 Open Access Article
Synthesis and bioactivity investigation of benzophenone and its derivatives†
Chun Leiabc,
Wanjing Yangabc,
Ziyu Linabc,
Yuyan Taobc,
Renping Yebc,
Yucai Jiangd,
Yuli Chenbc and
Beidou Zhou *abc
*abc
aSchool of Pharmacy, Fujian Medical University, Fuzhou 350108, China. E-mail: 491986737@qq.com; beidouzhou@ptu.edu.cn; Tel: +8613205940072
bSchool of Pharmacy and Medical Technology, Putian University, Putian 351100, China
cKey Laboratory of Pharmaceutical Analysis and Laboratory Medicine (Putian University), Fujian Province University, Putian 351100, China
dThe Affiliated Hospital (Group) of Putian University, Putian 351100, China
First published on 26th June 2024
Abstract
Four benzophenones, three dihydrocoumarins, and two coumarins were synthesised by a 1–3 step reaction, with yields ranging from 6.2 to 35%. Next, we investigated the in vitro antitumour activity of these compounds. Compounds 1, 8, and 9 exhibited strong antitumour activity and were considered promising candidates in this field. In particular, compound 1 exhibited very strong inhibitory activity against HL-60, A-549, SMMC-7721, and SW480 cells, with IC50 values of 0.48, 0.82, 0.26, and 0.99 μM, respectively. Finally, the antitumour mechanism of compound 1 was investigated through network pharmacology and molecular docking analyses, which identified 22 key genes and 21 tumour pathways. AKT1, ALB, CASP3, ESR1, GAPDH, HSP90AA1, and STAT3 were considered as potential target hub genes for compound 1. These results will enable the future development of benzophenone and its derivatives.
1 Introduction
Two aryl groups are connected to both sides of a carbonyl group to produce benzophenone. These two aryl and carbonyl groups form a conjugated system.1 Dihydrocoumarin and coumarin are derivatives of benzophenone (Fig. 1). Their basic structure consists of a benzene ring and a carbonyl group, which are linked to other groups in different ways to form various types of compounds. The two aryl groups of dihydrocoumarin are linked by a chiral carbon. In addition, the chemical name for coumarin is benzopyranone, which is the parent nucleus of a large class of coumarin compounds. These factors affect their physicochemical properties and biological activity.The unique structure of natural products and their attractive effects are of great significance for the discovery and development of new drugs. Inspired by the structure and efficacy of natural products, chemists can synthesise new medicinal molecules. For example, morphine was isolated from opium poppy and diacetylated to produce heroin, which was more analgesic and addictive. For another example, camptothecin was extracted from plants and exhibited good inhibitory activity against several tumor cells, but its human metabolite 10-hydroxycamptothecin exhibited better inhibitory activity and less toxic side effects than it. Therefore, 10-hydroxycamptothecin was synthesised by some chemists as a medicinal molecule.
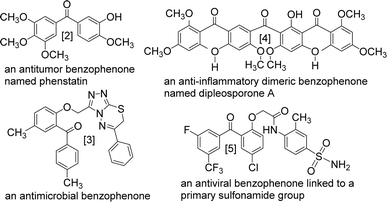
The benzophenone scaffold is one of structures in medicinal chemistry, found in several synthetic or naturally occurring molecules that exhibit a variety of biological activities, such as anticancer, antimicrobial, anti-inflammatory, and antiviral effects (Fig. 2). The benzophenone scaffold is the antitumor parent nucleus, and 3-hydroxy-4-methoxyphenyl and 3,4,5-trimethoxyphenyl are important antitumor groups, so phenstatin exhibits good antitumor activity.2 Khanum et al. integrated 1,3,4-oxadiazole-2-(3H)thione and triazolothiadiazine moieties into benzophenone framework to obtain compounds with good antimicrobial activity.3 These two heterocycles are key groups in antimicrobial activity. Zeng et al. reported three dimeric benzophenones inhibited lipopolysaccharide-induced NO production in RAW 264.7 cells, with half-maximal inhibitory concentration (IC50) values ranging from 8.8 to 18.1 μM, being more potent than the positive control, dexamethasone.4 Which means that dimeric benzophenones is the anti-inflammatory parent nucleus. Benzophenone derivatives with amino-sulfanilamide are non-nucleoside reverse transcriptional inhibitors, which seems to be effective against human immunodeficiency virus (HIV).5 This amino-sulfanilamide moiety is a key group that inhibits HIV. In addition, various synthetic benzophenone motifs are present in marketed drugs, such as ketoprofen, tolcapone, and fenofibrate (Fig. 3).6 Our team previously synthesised the benzophenone compound s3 using isovanillic acid (s1) and 2,4-dimethylphenol (s2) in Eaton's reagent (Fig. 4); this compound exhibited strong inhibitory activity against promyelocytic leukemia cell line HL-60 and hepatocarcinoma cell line SMMC-7721 with IC50 values of 0.122 and 0.111 μM, respectively.7 Therefore, s3 is an excellent candidate for further modification.
In addition, some representative studies on the synthesis of dihydrocoumarins and coumarins are discussed below. Jeon et al. reported the selective preparation of dihydrocoumarin derivatives using intramolecular cyclisation of cinnamic acid and substituted phenol, catalysed by p-toluene sulfonic acid (PTSA) or trifluoroacetic acid (TFA). A selective method for preparing dihydrocoumarin from aryl cinnamates using PTSA, MeSO3H, TiCl4, or SnCl4 was also reported.8 Jagdale et al. reported the hydroarylation of cinnamic acid with p-cresol mediated by PTSA to give dihydrocoumarin, followed by dehydrogenation of the dihydrocoumarin product with 2,3-dichloro-5,6-dicyanobenzoquinone (DDQ) to afford coumarin. Coumarin could be obtained by oxidation of dihydrocoumarin by DDQ,9 and also by reaction of benzophenones with sodium acetate and acetic anhydride.10
Advances in modern bioinformatics and computing techniques greatly facilitate the development of pharmaceutical molecules into drugs. Network pharmacology studies the mechanism of action of drugs in a multi-component, multi-target, and multi-pathway manner, and has important reference value for the development of novel compounds.
In short, s3 is a good lead compound that can be used for further modification. Some of its analogues and derivatives can be synthesised by the related methods and produce similar or better biological activities. Therefore, network pharmacology and molecular docking are used to explore the mechanism of action of the synthesized compounds.
2 Results and discussion
2.1 Synthesis
Our team previously reported that s3 had a yield of only 9.0%, so its synthesis process was explored and optimized.7 The optimum synthesis conditions of s3 were found to be an isovanillic acid/2, 4-dimethylphenol/phosphorus pentoxide molar ratio of 2![[thin space (1/6-em)]](https://www.rsc.org/images/entities/char_2009.gif) :
:![[thin space (1/6-em)]](https://www.rsc.org/images/entities/char_2009.gif) 2
2![[thin space (1/6-em)]](https://www.rsc.org/images/entities/char_2009.gif) :
:![[thin space (1/6-em)]](https://www.rsc.org/images/entities/char_2009.gif) 1 and a reaction time of 2.5 h. Under these conditions, its yield could reach 29.5%. Compound 1 was obtained by the reaction of s3 with 4-dimethylaminopyridine, triethylamine, and 2-chloroacetyl chloride in anhydrous 1,4-dioxane (Fig. 5). As a result, the hydroxyl at the ortho-position of the methoxy group reacted with 2-chloroacetyl chloride. Owing to the steric hindrance of the methyl group, the hydroxyl at the ortho-position of the carbonyl group could not be esterified.
1 and a reaction time of 2.5 h. Under these conditions, its yield could reach 29.5%. Compound 1 was obtained by the reaction of s3 with 4-dimethylaminopyridine, triethylamine, and 2-chloroacetyl chloride in anhydrous 1,4-dioxane (Fig. 5). As a result, the hydroxyl at the ortho-position of the methoxy group reacted with 2-chloroacetyl chloride. Owing to the steric hindrance of the methyl group, the hydroxyl at the ortho-position of the carbonyl group could not be esterified.
Using anhydrous potassium carbonate, s3 reacted with ethyl 2-chloroacetate in acetone to yield compound 2. The hydroxyl group adjacent to the methoxy group in s3 underwent a nucleophilic substitution reaction with ethyl 2-chloroacetate. Also due to steric hindrance, the hydroxyl group adjacent to the carbonyl group in s3 could not undergo nucleophilic substitution reaction with ethyl 2-chloroacetate. Next, compound 2 was refluxed in tetrahydrofuran and 24 equivalents of 1 M hydrochloric acid; then, its ester group was hydrolysed to yield compound 3 (Fig. 6). Compound 2 was initially refluxed in hydrochloric acid and ethanol; then, both ether and ester bonds were hydrolysed to give s3. Compound 2 was selectively hydrolysed by replacing ethanol with tetrahydrofuran to afford compound 3, containing a carboxylic acid side chain.
Using anhydrous potassium carbonate, s3 and N-methyl-4-chloropyridine-2-carboxamide (s4) was reacted in dimethylsulfoxide to form compound 4 (Fig. 7). Again, owing to the difference in steric hindrance, only the hydroxyl adjacent to the methoxy group in s3 reacted with s4.
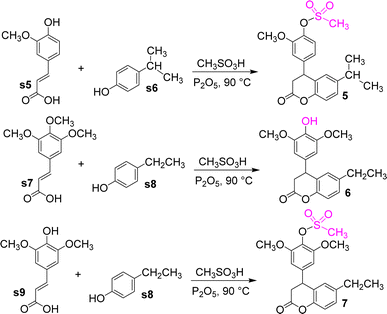
Cinnamic acid compounds and alkyl-substituted phenols were reacted in Eaton's reagent to obtain compounds 5–7 (Fig. 8). The cinnamic acid compounds were ferulic, 3,4,5-trimethoxyphenylacrylic, and erucic acids, whereas the phenol compounds were p-ethylphenol and p-isopropylphenol. An unexpected mechanism was found for these reactions, in which the methoxy group at C4 position of the phenyl ring of the dihydrocoumarin intermediate was converted to the hydroxyl group to give compound 6. However, compounds 5 and 7 were esterification products of dihydrocoumarin intermediates and methanesulfonic acid. This finding has a good reference value for the synthesis of related compounds.
Compound s3 reacted with sodium acetate and acetic anhydride to yield compound 8. In this reaction, the phenolic hydroxyl group adjacent to the carbonyl group was involved in the formation of coumarin, while the other phenolic hydroxyl group was acetylated to ester. Under the catalysis of 9 equivalents of 1 M hydrochloric acid, compound 8 was hydrolysed in ethanol to afford compound 9 (Fig. 9). In this reaction, compound 8 was deacetylated and acidified, exposing the phenol hydroxyl group.
2.2 Biological activity
| Compd | HL-60 | A-549 | SMMC-7721 | MDA-MB-231 | SW480 |
|---|---|---|---|---|---|
| 1 | 98.83 ± 0.42 | 74.56 ± 0.87 | 84.65 ± 0.66 | 82.63 ± 1.53 | 58.91 ± 0.99 |
| 2 | 68.57 ± 0.48 | 65.91 ± 0.80 | 69.93 ± 2.18 | 45.03 ± 1.40 | 61.83 ± 2.32 |
| 3 | 68.71 ± 0.89 | 63.12 ± 2.92 | 70.99 ± 3.61 | 64.86 ± 2.71 | 64.58 ± 0.88 |
| 4 | 84.07 ± 0.45 | 49.55 ± 1.43 | 68.10 ± 2.22 | 51.78 ± 1.09 | 45.08 ± 1.13 |
| 5 | 8.36 ± 2.75 | 6.42 ± 2.85 | 31.34 ± 1.45 | 10.79 ± 2.55 | 8.16 ± 1.53 |
| 6 | 42.41 ± 0.34 | 52.87 ± 1.96 | 76.09 ± 0.71 | 53.96 ± 0.08 | 54.40 ± 0.69 |
| 7 | 9.95 ± 1.28 | 4.65 ± 2.34 | 25.30 ± 3.04 | 9.88 ± 2.76 | 0.79 ± 1.56 |
| 8 | 91.04 ± 0.65 | 63.52 ± 0.50 | 75.27 ± 0.95 | 67.32 ± 1.48 | 57.67 ± 2.40 |
| 9 | 89.08 ± 0.22 | 65.71 ± 1.01 | 74.72 ± 0.47 | 67.37 ± 1.41 | 56.45 ± 1.89 |
| Compd | HL-60 | A-549 | SMMC-7721 | MDA-MB-231 | SW480 |
|---|---|---|---|---|---|
| a “—” means not being determinated. | |||||
| 1 | 0.48 ± 0.068 | 0.82 ± 0.038 | 0.26 ± 0.15 | 9.97 ± 0.23 | 0.99 ± 0.045 |
| 2 | 1.28 ± 0.022 | 10.64 ± 0.55 | 1.55 ± 0.083 | — | 13.56 ± 1.88 |
| 3 | 3.65 ± 0.14 | 14.25 ± 0.91 | 11.26 ± 1.10 | 3.77 ± 0.25 | 7.61 ± 0.22 |
| 4 | 14.30 ± 0.24 | — | 21.04 ± 1.11 | 19.02 ± 1.23 | — |
| 6 | — | 27.86 ± 0.94 | 11.50 ± 2.33 | 11.63 ± 0.73 | 29.07 ± 2.01 |
| 8 | 0.15 ± 0.004 | 3.92 ± 0.31 | 1.02 ± 0.034 | 6.13 ± 0.10 | 0.51 ± 0.054 |
| 9 | 0.16 ± 0.015 | 4.61 ± 0.29 | 0.80 ± 0.059 | 5.65 ± 0.34 | 0.93 ± 0.20 |
| Cisplatin | 2.50 ± 0.044 | 10.10 ± 0.34 | 8.68 ± 0.36 | 20.27 ± 1.43 | 17.70 ± 0.47 |
| Taxol | <0.008 | <0.008 | 0.11 ± 0.002 | <0.008 | <0.008 |
For the promyelocytic leukemia cell line HL-60, compound 4 exhibited weak inhibitory activity with an IC50 value of 14.30 μM, and compounds 2 and 3 exhibited strong inhibitory activity with IC50 values of 1.28 and 3.65 μM, respectively. Compounds 1, 8, and 9 exhibited very strong inhibitory activity against HL-60 cells with IC50 values of 0.48, 0.15, and 0.16 μM, respectively. Among these, compounds 1, 2, 8, and 9 exhibited stronger inhibitory activity than cisplatin against HL-60 cells.
For the A-549 lung cancer cell line, compounds 2, 3, and 4 exhibited weak inhibitory activity with IC50 values ranging from 10.64 to 27.86 μM, and compounds 8 and 9 exhibited strong inhibitory activity with IC50 values of 3.92 and 4.61 μM, respectively. Compound 1 exhibited very strong inhibitory activity against A-549 cells with an IC50 value of 0.82 μM. Among these, compounds 1, 8, and 9 exhibited stronger inhibitory activity than cisplatin against A-549 cells.
For the SMMC-7721 hepatocarcinoma cell line, compounds 3, 4, and 6 exhibited weak inhibitory activity with IC50 values in the range of 11.26–21.04 μM. Furthermore, compounds 2 and 8 exhibited strong inhibitory activity against SMMC-7721 cells with IC50 values of 1.55 and 1.02 μM, respectively. In particular, compounds 1 and 9 exhibited very strong inhibitory activity with IC50 values of 0.26 and 0.80 μM, respectively.
For the MDA-MB-231 breast cancer cell line, compounds 4 and 6 exhibited weak inhibitory activity with IC50 values of 19.02 and 11.63 μM, respectively, and compounds 1, 8, and 9 exhibited moderate inhibitory activity with IC50 values of 9.97, 6.13 and 5.65 μM, respectively. Futhermore, compound 3 exhibited strong inhibitory activity with an IC50 value of 3.77 μM.
For the SW480 colon cancer cell line, compounds 2 and 6 exhibited weak inhibitory activity with IC50 values of 13.56 and 29.07 μM, respectively, and compound 3 exhibited moderate inhibitory activity with an IC50 value of 7.61 μM. In particular, compounds 1, 8, and 9 exhibited very strong inhibitory activity with IC50 values of 0.99, 0.51 and 0.93 μM, respectively.
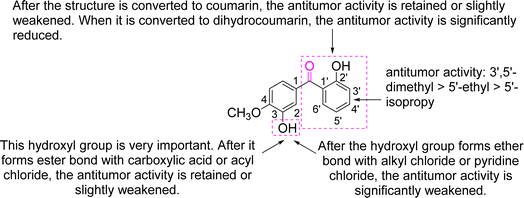
In summary, 1, 8, and 9 exhibited excellent antitumour activity, whereas 2 and 3 exhibited moderate antitumour effects, and the other compounds exhibited weak antitumour activity. In other words, the above nine compounds, designed and synthesised based on s3, exhibited varying antitumour activities. We previously reported on the synthesis and antitumour activities of s3 and its six benzophenone analogues, which also exhibited varying antitumour activities.7 Combining the results of this study and ref. 7, the structure–activity relationships (SAR) of benzophenone and its derivatives are analysed in Fig. 10.
2.2.2.1 Selection of compounds for network pharmacology. Of these compounds, compound 1 exhibited the best antitumor activity, with IC50 values of less than 1.0 μM for four tumor cell lines, so compound 1 was selected for network pharmacology study.
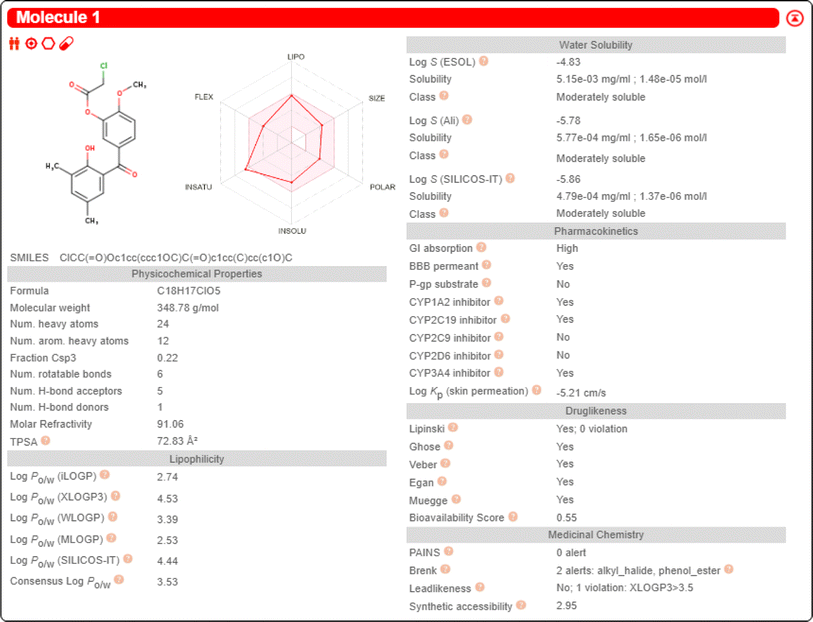
2.2.2.2 SwissADME prediction of compound 1. The properties of compound 1, including lipophilicity, water solubility, pharmacokinetics, and druglikeness, were predicted by the SwissADME database. The consensus log
![[thin space (1/6-em)]](https://www.rsc.org/images/entities/char_2009.gif) Po/w value for compound 1 was 3.53. The solubility class of compound 1 was moderate. The gatrointestinal absorption of compound 1 was “High”. For the BBB permeant, compound 1 was shown as “Yes”. So compound 1 has the potential to treat brain diseases. For druglikeness, compound 1 showed five “Yes”. This indicates that compound 1 has good pharmacokinetic properties and bioavailability. The predicted data for compound 1 are shown in Fig. 11.
Po/w value for compound 1 was 3.53. The solubility class of compound 1 was moderate. The gatrointestinal absorption of compound 1 was “High”. For the BBB permeant, compound 1 was shown as “Yes”. So compound 1 has the potential to treat brain diseases. For druglikeness, compound 1 showed five “Yes”. This indicates that compound 1 has good pharmacokinetic properties and bioavailability. The predicted data for compound 1 are shown in Fig. 11.
2.2.2.3 Target prediction of compound 1. Using the SwissTargetPrediction, PharmMapper, and TargetNet databases to predict target genes for compound 1, 366 target genes were identified after removing duplicates.
2.2.2.4 Tumor-related genes. The words “carcinoma,” “cancer,” and “tumor” were searched in the GeneCards database respectively, and 39
![[thin space (1/6-em)]](https://www.rsc.org/images/entities/char_2009.gif) 549 oncogenes were obtained after removing duplicates.
549 oncogenes were obtained after removing duplicates.
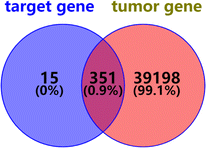
2.2.2.5 Oncogenes predicted by compound 1. The genes predicted by compound 1 and tumor-related genes were intersected on the Venny 2.1 website, and 351 oncogenes of compound 1 were obtained (Fig. 12).
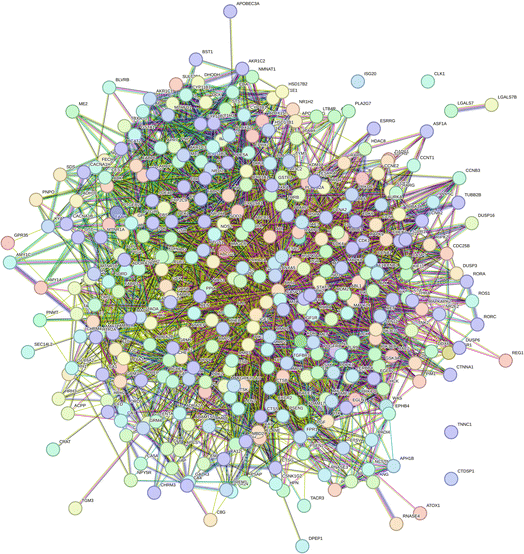
2.2.2.6 Construction of the protein–protein interaction network. A total of 351 target genes were input into the String website, and protein–protein interaction (PPI) network of 349 nodes and 4531 sides were obtained after analysis (Fig. 13).
2.2.2.7 Calculation of the topological parameters of proteins. The table in tsv format obtained from the String analysis was imported into Cytoscape 3.7.2 software. A table containing different parameters such as degree, betweenness centrality, closeness centrality, and clustering coefficient was built. Target genes whose degree value was ≥5 were selected to obtain 315 target genes.
2.2.2.8 The target major genes was obtained by molecular docking simulations. Using AutoDock Vina final v 1.0 (Beikwx, China), 315 target proteins and compound 1 were docked, respectively. A protein with a docking score ≤−5 was considered the target major protein, and its corresponding gene was considered the target major gene. Thus, 294 genes were considered the target major genes.
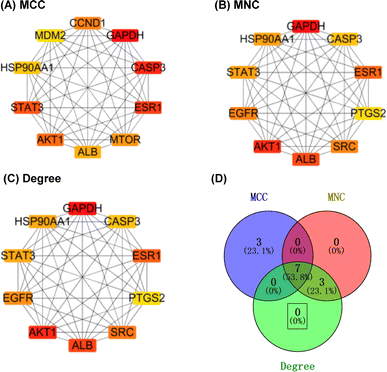
2.2.2.9 Identification of important target genes. The above table (in tsv format), obtained from the String analysis tool, was imported into the Cytoscape 3.7.2 software; then, 21 target genes with a docking score greater than −5 were removed. The remaining 294 genes were analysed using the CytoHubba plug-in, employing three algorithms (maximal clique centrality (MCC), maximum neighbourhood component (MNC), and degree) to identify the top 10 hub genes based on their scores. Then, the results of the three algorithms were intersected to obtain seven hub genes, namely, AKT1, ALB, CASP3, ESR1, GAPDH, HSP90AA1, and STAT3 (Fig. 14), which were considered as potential target hub genes for compound 1.
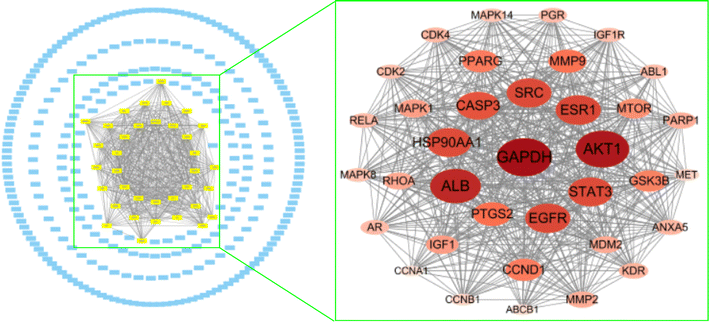
Moreover, the remaining 294 genes were analysed using the Molecular Complex Detection (MCODE) plug-in, enabling the selection of the module with the highest score, comprising 36 nodes (Fig. 15). This module had a score of 32.1, while the average of the degree values was 26.6; it was the only module with a score greater than the average of the degree values. This suggests that these 36 nodes are important target genes, containing the seven potential target hub genes mentioned above.
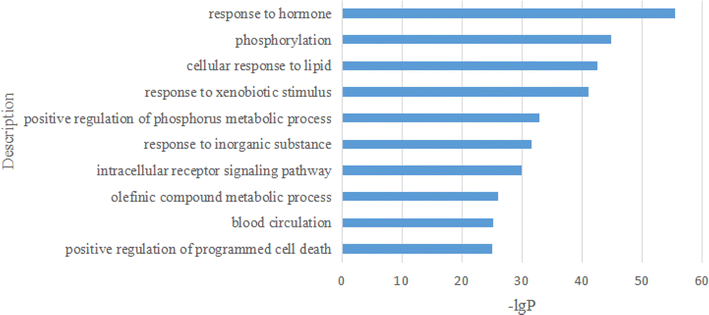
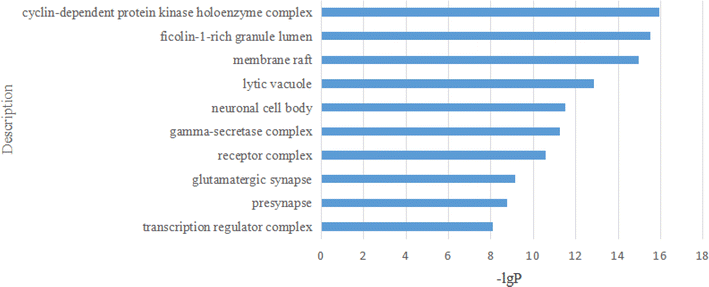
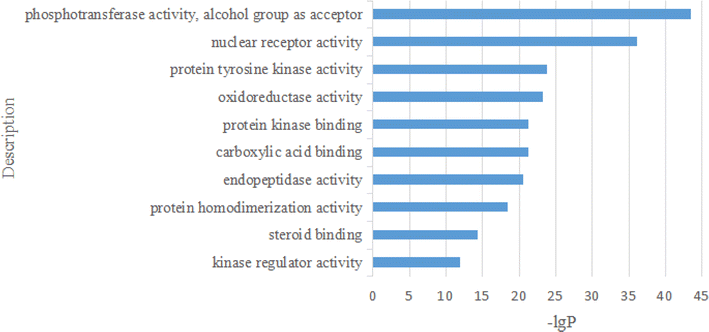
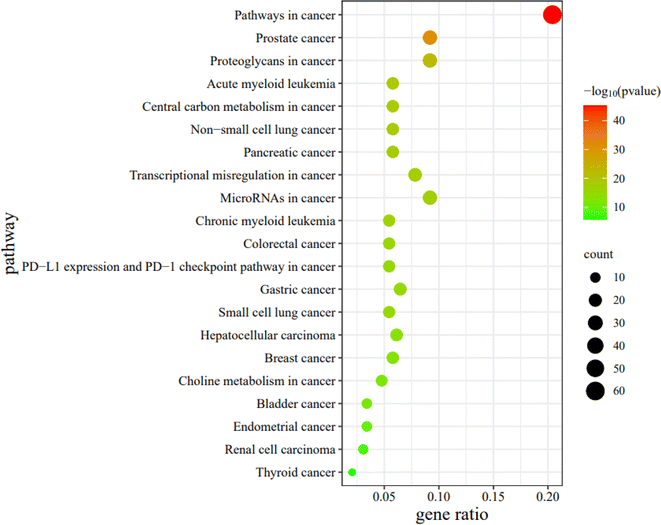
2.2.2.10 Enrichment analysis. These 294 main genes were imported into the Metascape website (https://metascape.org/gp/index.html), and then their Gene Ontology (GO) in terms of biological processes (BP), cellular components (CC), molecular functions (MF), and Kyoto Encyclopedia of Genes and Genomes (KEGG) pathway enrichment were analysed (Fig. 16–19).
On the bar graph, the longer the bar, the smaller the P-value, indicating that the difference between the experimental and control groups was more statistically significant. For the GO BP analysis, the top 10 representative processes are illustrated in Fig. 16.
For the GO CC analysis, the top 10 representative components are illustrated in Fig. 17.
For the GO MF analysis, the top 10 representative functions are illustrated in Fig. 18.
For the bubble map, the redder the color of the bubble, the smaller the P-value, indicating that the difference between the experimental and control pathways was more statistically significant. Furthermore, the larger the bubble coverage area, the more genes in the experimental pathway. In this study, the top 21 cancer pathways were selected in order from the smallest to the largest P-value. For the analysis of the KEGG pathway, the top 21 cancer pathways are illustrated in Fig. 19. For simplicity, these 21 pathways were abbreviated PW1-21 in turn.
Compound 1 exhibited strong inhibitory activity against HL-60 cells. Therefore, the potential targets and mechanism of compound 1 against acute myeloid leukemia (AML) are shown in Fig. 20.
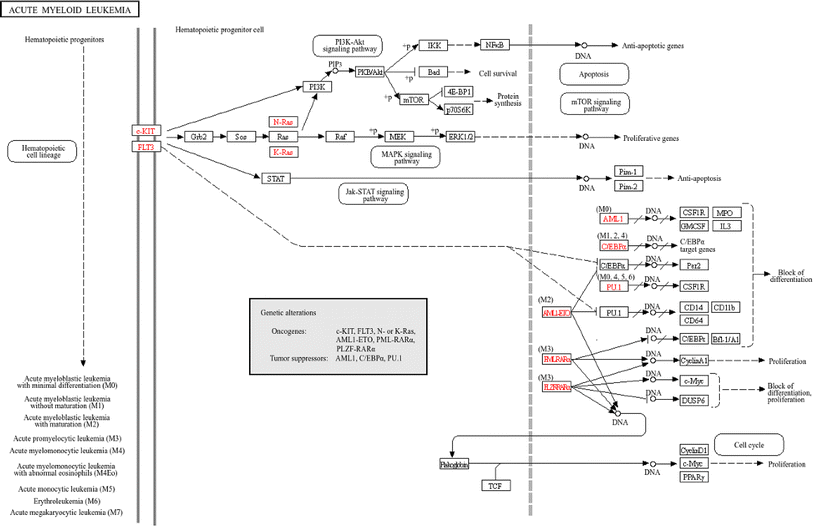 | ||
| Fig. 20 Potential targets and mechanism of compound 1 against AML. The red codes represent targeted genes involved in the AML pathway. | ||
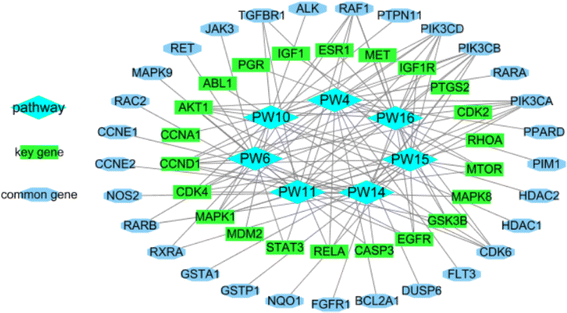
2.2.2.11 Identification of the potential mechanism of action. The analysis of the KEGG pathway included tumor pathways such as AML, non-small cell lung cancer, chronic myeloid leukemia, colorectal cancer, small cell lung cancer, hepatocellular carcinoma, and breast cancer, which matched the bioactivity test. When the related genes from the PW4, 6, 10, 11, 14, 15, and 16 were aggregated, 51 genes were obtained. They intersected with 36 important genes, resulting in 22 key genes. The 22 key genes were ABL1, AKT1, CASP3, CCNA1, CCND1, CDK2, CDK4, EGFR, ESR1, GSK3B, IGF1, IGF1R, MAPK1, MAPK8, MDM2, MET, MTOR, PGR, PTGS2, RELA, RHOA, and STAT3, respectively. Among them, AKT1, CASP3, and ESR1 are potential target hub genes. The identified pathways and their related genes are shown in Fig. 21.
2.2.2.12 Molecular docking simulation of compound 1 with some representative target proteins. Molecular docking simulations were carried out with six proteins and the docking results of binding affinities for compound 1 were computed in kcal mol−1 as −7.9, −7.1, −9.6, −8.1, −7.8, and −5.7 with target proteins AKT1, CASP3, CDK2, ESR1, MAPK1, and STAT3, respectively. Compound 1 showed significant binding affinities with the six proteins. Table 3 described the significant binding characteristics of compound 1 with the six proteins in detail.
| Protein | Binding affinity (kcal mol−1) | Ligand interaction | Interacting amino acids | |||
|---|---|---|---|---|---|---|
| Hydrophobic interaction | Hydrogen bond | π-Stacking (perpendicular) | Salt bridge | |||
| AKTI (PDB ID: 2JDO) | −7.80 | 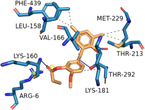 |
LEU-158, VAK-166, LYS-181, THR-213, MET-229, PHE-439 | LYS-160, THR-292 | — | ARG-6 |
| CASP3 (PDB ID: 3GJR) | −7.1 | 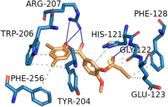 |
HIS-121, GLU-123, PHE-128, TYR-204, TRP-206, PHE-256 | GLY-122, ARG-207 | HIS-121 | HIS-121 |
| CDK2 (PDB ID: 3PXY) | −9.6 | 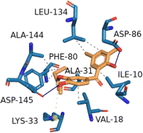 |
ILE-10, VAL-18, ALA-31, PHE-80, LEU-134, ALA-144 | ASP-86, ASP-145 | — | LYS-33 |
| ESR1 (PDB ID: 2OCF) | −8.1 | 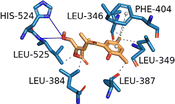 |
LEU-346, LEU-349, LEU-384, LEU-387, PHE-404, LEU-525 | HIS-524, LEU-525 | PHE-404 | — |
| MAPK1 (PDB ID: 3W55) | −7.8 | 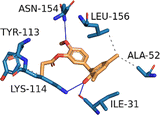 |
ALA-52, TYR-113, LYS-114, LEU-156 | ILE-31, LYS-114, ASN-154 | — | — |
| STAT3 (PDB ID: 6NJS) | −5.7 | 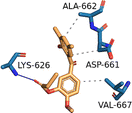 |
ASP-661, ALA-662, VAL-667 | LYS-626 | — | — |
3 Conclusion
Four benzophenones, three dihydrocoumarins, and two coumarins were synthesised. They are analogues or derivatives of the lead compound s3. Compounds 1, 8, and 9 exhibited excellent antitumor activity through evaluation of antitumor activity in vitro, especially compound 1. Therefore, the antitumor mechanism of compound 1 was investigated through network pharmacology and molecular docking analyses. These results provide an useful reference for the development of benzophenone and its derivatives as potential anticancer agents.4 Experimental
4.1 Chemistry
The chemical reagents purchased (Shanghai Aladdin Biochemical Technology Co., Ltd, Shanghai, China) were of the highest commercially available purity and were used as received. Melting points were determined on a micro melting point apparatus and the data were uncorrected (Shanghai Precision Scientific Instrument Co., Ltd, Shanghai, China). 1H and 13C NMR spectra were determined in acetone-d6 or pyridine-d5 at 500 MHz for 1H and 125 MHz for 13C (Bruker, Fällanden, Switzerland). IR spectra were recorded with KBr pellets (Bruker, Bremen, Germany). High-resolution mass (HRMS) data were recorded via a negative ion electron impact mass spectrometry using a time-of-flight analyzer (Bruker Daltonics Inc., Boston, USA).4.2 Synthesis
Due space constraints of the manuscript, general procedures and spectral data of compounds 1–9 have been placed in the ESI.†4.3 Cytotoxicity assay
Experimental methods were in accordance with ref. 11. The human cell lines A-549, HL-60, SMMC-7721, MCF-7, MDA-MB-231 and SW480 were used in the cytotoxic assay. These cell lines were obtained from ATCC (Manassas, VA, USA). Cells were cultured in RMPI-1640 or DMEM medium (Biological industries, Kibbutz Beit-Haemek, Israel), supplemented with 10% fetal bovine serum (Biological Industries) at 37 °C in a humidified atmosphere with 5% CO2. The cytotoxicity assay was evaluated by MTS (Promega, Madison, WI, USA) assay. Briefly, cells were seeded into each well of a 96-well cell culture plate. After 12 h of incubation at 37 °C, the test compound (40 μM) was added. After incubation for 48 h, cells were subjected to the MTS assay. Compounds with a growth inhibition of 50% were further evaluated at concentrations of 0.064, 0.32, 1.6, 8, and 40 μM in triplicate. Cisplatin and Taxol (Sigma, St. Louis, MO, USA) served as positive controls. The IC50 value of each compound was calculated using the method of Reed and Muench. The results were expressed as average ± standard deviation.4.4 Network pharmacology
Conflicts of interest
The authors declare no conflict of interest.Acknowledgements
The authors gratefully thank the Natural Science Foundation of Fujian Province (Grant No. 2022J011158), Putian City Science and Technology Plan Project (Grant No. 2021S2001-9), Project Approved by Fujian Key Laboratory of New Drug Targets Research (Grant No. FJ-YW-2021KF01) and Project Approved by Fujian Shanhe Pharmaceutical Co., Ltd (Grant No. 2022AHX211(L)) for the support of this program.References
- B. D. Zhou, C. Lei, X. M. Liao, H. Zhu, Z. P. Ruan, Y. Y. Fang, G. F. Xu and Y. L. Chen, J. Chin. Pharm. Sci., 2022, 31, 738–745 CrossRef CAS.
- C. Álvarez, R. Álvarez, P. Corchete, J. L. López, C. Pérez-Melero, R. Peláez and M. Medarde, Bioorg. Med. Chem., 2008, 16, 5952–5961 CrossRef.
- S. A. Khanum, S. Shashikanth, S. Umesha and R. K. Europ, J. Med. Chem., 2005, 40, 1156–1162 CAS.
- H. T. Zeng, Y. H. Yu, X. Zeng, M. M. Li, X. Li, S. S. Xu, Z. C. Tu and T. Yuan, J. Nat. Prod., 2022, 85, 162–168 CrossRef CAS.
- Glaxo Group Ltd, Expert Opin. Ther. Pat., 2001, 11, 1637–1640 CrossRef.
- K. Surana, B. Chaudhary, M. Diwaker and S. Sharma, MedChemComm, 2018, 9, 1803–1817 RSC.
- B. D. Zhou, R. R. Wei, J. L. Li, Z. H. Yu, Z. M. Weng, Z. P. Ruan, J. Lin, Y. Y. Fang, G. F. Xu and D. B. Hu, J. Asian Nat. Prod. Res., 2022, 24, 170–178 CrossRef CAS PubMed.
- J. H. Jeon, D. M. Yang and J. G. Jun, Bull. Korean Chem. Soc., 2011, 32, 65–70 CrossRef CAS.
- A. R. Jagdale and A. Sudalai, Tetrahedron Lett., 2008, 49, 3790–3793 CrossRef CAS.
- M. M. Garazd, Y. L. Garazd and V. P. Khilya, Chem. Nat. Compd., 2005, 41, 245–271 CrossRef CAS.
- B. D. Zhou, Z. M. Weng, Y. G. Tong, Z. T. Ma, R. R. Wei, J. L. Li, Z. H. Yu, G. F. Xu, Y. Y. Fang and Z. P. Ruan, J. Asian Nat. Prod. Res., 2020, 23, 271–283 CrossRef PubMed.
- B. D. Zhou, X. M. Liao, S. Y. Liu, G. Q. Gao, Y. T. Gao, W. T. Gan, J. L. Ke, Y. X. Wu, F. F. Wang, B. C. Huang, W. J. Yang, R. P. Ye, Y. H. Liu and Y. C. Lin, J. Mol. Struct., 2024, 1312, 138467 CrossRef CAS.
- A. Daina, O. Michielin and V. Zoete, Sci. Rep., 2017, 7, 42717 CrossRef PubMed.
- A. Daina, O. Michielin and V. Zoete, J. Chem. Inf. Model., 2014, 54, 3284–3301 CrossRef CAS PubMed.
- A. Daina and V. Zoete, ChemMedChem, 2016, 11, 1117–1121 CrossRef CAS PubMed.
- A. Daina, O. Michielin and V. Zoete, Nucleic Acids Res., 2019, 47, W357–W364 CrossRef CAS PubMed.
- D. Gfeller, O. Michielin and V. Zoete, Bioinformatics, 2013, 29, 3073–3079 CrossRef CAS PubMed.
- X. F. Liu, S. S. Ouyang, B. A. Yu, Y. B. Liu, K. Huang, J. Y. Gong, S. Y. Zheng, Z. H. Li, H. L. Li and H. L. Jiang, Nucleic Acids Res., 2010, 38, W609–W614 CrossRef CAS PubMed.
- X. Wang, C. X. Pan, J. Y. Gong, X. F. Liu and H. L. Li, J. Chem. Inf. Model., 2016, 56, 1175–1183 CrossRef CAS PubMed.
- X. Wang, Y. H. Shen, S. W. Wang, S. L. Li, W. L. Zhang, X. F. Liu, L. H. Lai, J. F. Pei and H. L. Li, Nucleic Acids Res., 2017, 45, W356–W360 CrossRef CAS.
- Z. J. Yao, J. Dong, Y. J. Che, M. F. Zhu, M. Wen, N. N. Wang, S. Wang, A. P. Lu and D. S. Cao, J. Comput.-Aided Mol. Des., 2016, 30, 413–424 CrossRef CAS PubMed.
- R. Y. Lin, L. J. Yang, X. L. Yu and L. Y. Huang, J. Fujian Med. Univ., 2021, 55, 217–223 Search PubMed.
- J. M. Word, S. C. Lovell, J. S. Richardson and D. C. Richardson, J. Mol. Biol., 1999, 285, 1735–1747 CrossRef CAS PubMed.
- A. N. S. S. Azman, J. J. Tan, M. N. H. Abdullah, H. Bahari, V. Lim and Y. K. Yong, Foods, 2003, 12, 1779 CrossRef PubMed.
- J. M. Zhuang, J. H. Mo, Z. G. Huang, Y. L. Yan, Z. Y. Wang, X. Q. Cao, C. K. Yang, B. Shen and F. Zhang, Chin. Med., 2023, 18, 104 CrossRef CAS.
Footnote |
| † Electronic supplementary information (ESI) available. See DOI: https://doi.org/10.1039/d4ra02797c |
| This journal is © The Royal Society of Chemistry 2024 |


