 Open Access Article
Characterization of key aroma compounds of fried pepper sauce under different pretreatment processes†
Hao Luo,
Yongjun Wu *,
Jing Jin,
Lincheng Zhang
 ,
Shuoqiu Tong,
Cen Li,
Qibo Tan and
Qiqin Han
Key Laboratory of Plant Resource Conservation and Germplasm Innovation in Mountainous Region (Ministry of Education), College of Life Sciences/Institute of Agro-Bioengineering, Guizhou University, Guiyang 550025, Guizhou Province, China. E-mail: wyjbio@163.com
First published on 20th May 2024
Abstract
Fried pepper sauce (FPS) is renowned among consumers for its distinct aroma profile and rich nutritional composition. However, the primary aroma components of FPSs, crucial for quality assurance, remain unclear. Therefore, this study aimed to delve deeper into the unique aroma profile of FPSs by analyzing samples subjected to various pretreatment methods (including three heat-moisture treatment processes: soaking at 60 °C, soaking at 100 °C, and steaming, and three crushing processes: mashing, mincing, and horizontal knife cutting). FPS samples were analyzed by quantitative descriptive sensory analysis (QDA), gas chromatography-olfactometry-mass spectrometry (GC-O-MS), relative odor activity value analysis (rOAV), principal component analysis (PCA), partial least squares-discriminant analysis (PLS-DA) and partial least squares regression analysis (PLSR). The QDA results revealed that the overall aroma profile of FPS products was characterized by chili-like, fatty, and herbal notes. GC-MS identified 115 volatile components in FPSs, primarily alkenes, ketones, and acids, with varying concentrations across samples. According to the rOAV (>1) and GC-O, 11 compounds were identified as key aroma contributors to FPS aroma, including 2-methylpropanal, acetic acid, 3-methylbutanal, methional, eucalyptol, benzeneacetaldehyde, linalool, (E)-2-nonenal, (2E)-2-decenal, (2E,4E)-deca-2,4-dienal, and (E,Z)-2,4-decadienal. PCA and PLS-DA were employed to assess aroma differences among nine FPS samples. Screening for VIP > 1 and p < 0.05 identified 8 and 12 key marker compounds influenced by different crushing methods or heat-moisture treatments, respectively. PLSR indicated that the sensory attributes were greatly related to most aroma-active compounds. These findings provide novel insights into FPS aroma attributes, facilitating precise processing and quality control of fried pepper sauce products.
1. Introduction
Chili peppers (Capsicum annuum L.), belonging to the family Solanaceae and genus Capsicum, are indigenous to South America.1 They are among the most extensively cultivated condiment crops globally, with production reaching 36 million tons in 2021.2 China leads in chili pepper production and consumption, contributing to half of the total global production in 2019.3 Chili peppers hold significant importance in Chinese culinary culture, commonly consumed fresh as a standalone vegetable or used as a condiment to enhance aroma and presentation in dishes.4,5 However, their high moisture content renders fresh peppers unsuitable for prolonged storage,6 leading to their transformation into various capsicum products such as fermented chili peppers, pickled peppers, and fried pepper sauce (FPS).7–9FPS is a prevalent processed pepper product in southwestern provinces of China, notably in Guizhou, Sichuan, and Chongqing, widely used in daily meals and culinary seasoning. The region boasts numerous FPS production enterprises, with Guizhou province alone hosting 57 FPS production enterprises in 2020, constituting approximately 20% of all pepper processing enterprises.10 Made primarily from dried peppers combined with peanuts, huajiao (Zanthoxylum bungeanum Maxim.) powder, sugar, salt, monosodium glutamate, and other additives, FPS undergoes deep frying. Rich in volatile aroma components like terpenes and esters, FPS exudes an appealing aroma highly favored by consumers.11 Aroma serves as a crucial quality indicator for food evaluation by consumers. Currently, limited research has explored the aroma components of FPS. Song et al.12 investigated the Maillard reaction of chili peppers with various auxiliary materials (including reducing sugars and amino acids) under frying conditions, revealing a negative correlation between acrylamide formation during frying and the presence of aroma compounds. They identified 11 aroma substances (nonanal, (E)-2-decenal, hexanal, nonenal, acetaldehyde, octana, 2-methyl-propanal, (E)-2-butenal, N-heptanal, benzeneacetaldehyde, 1-octen-3-ol) with a relative odor activity (ROAV) >1, significantly contributing to the overall aroma profile of FPS. While this study sheds light on FPS aroma, the diverse range of FPS products and their aromas, influenced not only by added additives but also by processing methods, renders key aroma substances largely unidentified.
In Guizhou Province, dried peppers undergo initial pre-processing to create ‘ciba pepper’, which is then deep-fried at high temperatures to produce FPS. The ciba pepper is prepared by subjecting dried red chili peppers to moist heat treatment to soften them, followed by crushing into a puree. Different stages of moist heat treatment and crushing methods directly influence the physical characteristics and chemical composition of ciba peppers, impacting the generation of FPS aroma during deep-frying. Frying is the primary method to impart a distinct aroma to FPS. Studies indicate that complex physical and chemical interactions occur between food constituents and the oil medium at elevated temperatures, leading to the unique aroma of fried foods.13 During frying, heat initially transfers from the oil to the food's outer surface through thermal convection, followed by heat transfer from the surface to the interior through thermal conduction. Proteins, lipids, polysaccharides, and other food components decompose or react with each other under high temperatures, forming aromatic substances.14 Thus, the physical characteristics (e.g., particle size and viscosity) and nutrient content (e.g., protein and polysaccharide content) of ciba pepper are crucial factors influencing FPS aroma, closely tied to pepper pretreatment processes.15
In the field of FPS production, the pretreatment process comprises two main components: heat-moisture treatment processes and crushing methods. Common heat-moisture treatment methods include soaking at 60 °C, soaking at 100 °C, and steaming, each exerting different influences on the depletion of nutrients in chili peppers. Primary crushing methods include mashing, mincing, and horizontal knife cutting, impacting the physical characteristics of ciba pepper tissue. Guizhou FPS has gained popularity among consumers, with products distributed in numerous countries and the market continuously expanding. However, published data on the effect of different pretreatments on FPS aroma are scarce. Therefore, developing methods to regulate pretreatment processes to achieve optimal aroma for FPS is necessary. In summary, this study aimed to (a) identify and quantify volatile compounds in FPSs with different pretreatment methods using gas chromatography-mass spectrometry (GC-MS), (b) characterize key aroma-active compounds using gas chromatography-olfactometry (GC-O) and relative odor activity values (rOAV), (c) compare changes in aroma characteristics among different FPS samples through PCA and PLS-DA analysis, and (d) explain the relationship between sensory attributes and aroma-active compounds using partial least squares regression (PLSR) analysis. This study, employing GC-O-MS techniques and rOAV analysis, was the first to characterize the aroma of FPS samples prepared using various pretreatments, enhancing understanding of characteristic aroma compounds and providing a practical guide for optimizing FPS processing to enhance aroma quality.
2. Materials and methods
2.1 Materials and chemicals
Fresh red peppers (C. annuum L.), including huaxi peppers and denglong peppers, were harvested from a local farm in Guiyang, Guizhou Province, in August 2023. Rapeseed oil, sodium glutamate (food grade), salt, white sugar, dried red huajiao (Zanthoxylum bungeanum Maxim.), raw peanuts, and fermented bean curd were purchased from a local supermarket in Guiyang. The fresh red peppers underwent hot air drying (Memmert GmbH + Co. KG, Schwabach, Germany) at 50–55 °C for 48 hours, resulting in a moisture content of less than 3% in the dried peppers. The dried red huajiao was ground using a high-speed multifunction pulverizer (RRH-250, Shanghai Yuanwo Trading Co., Ltd, Shanghai, China) to obtain red huajiao powder. Raw peanuts were fried in frying oil using a wok placed on a heated plate (C21-WK2102, GD Midea Holding Co. Ltd, Guangdong, China) to obtain deep-fried peanuts.A homologous series of n-alkane standards (C7–C30) (supelco, Bellefonte, PA, USA) was employed to calculate the retention indices (RI). Internal standard 1,2-dichlorobenzene (99%) was obtained from Aladdin Industrial Corporation (Shanghai, China). Reference standards were obtained from the following sources. 2-Methylpropanal (99%), linalool (98%), benzeneacetaldehyde (95%) were purchased from Aladdin Industrial Corporation (Shanghai, China). (2E)-2-Decenal (95%), 3-methylbutanal (99%), methional (98%), eucalyptol (99%), (2E,4E)-deca-2,4-dienal (90%), acetic acid (99%) were purchased from Macklin Biochemical Technology Corporation (Shanghai, China). (E)-2-Nonenal (98%) was obtained from bidepharm Ltd (Shanghai, China).
2.2 Fried pepper sauce (FPS) preparation
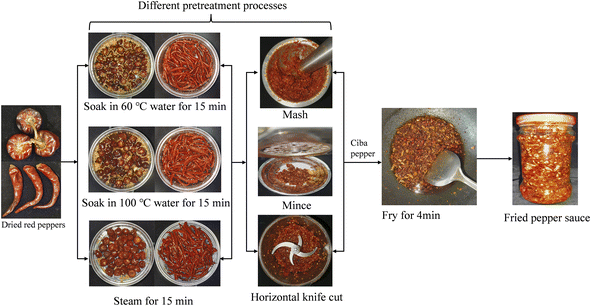
Nine types of Ciba pepper sauces were first prepared using different pretreatment methods (as shown in Table 1), followed by deep-frying to produce FPS. The FPS preparation process conditions were as follows: 100 g of Ciba peppers (50 g huaxi peppers and 50 g denglong peppers) were placed into a frying pan containing 210 g of rapeseed oil heated to 260 °C, then deep-fried for 3 minutes before reducing the temperature to the required stir-fry temperature (145 °C). Constant stirring with a spatula during processing prevented local overheating. Excipients were added (for 100% Ciba peppers, 2.0% red huajiao powder, 8% white sugar, 12% sodium glutamate, 13% salt, 32% deep-fried peanuts, 0.5% fermented bean curd), and the mixture was stir-fried for an additional minute. Temperature was maintained within ±5 °C, and an infrared temperature gun was used for measurement. The FPS was then bottled in 400 mL glass containers. All FPS samples were prepared on the same day and in triplicates. The major production process of FPS is illustrated in Fig. 1.| Sample | Heat-moisture treatment | Crushing method |
|---|---|---|
| a Vertical impact with a metal rod.b Material chopped by the shearing action of the rotating cutter and the eyelets on the perforated plate.c Horizontal cutting with a blade. | ||
| FPS1 | Soak in 60 °C water for 15 min | Masha |
| FPS2 | Soak in 100 °C water for 15 min | Mash |
| FPS3 | Steam for 15 min | Mash |
| FPS4 | Soak in 60 °C water for 15 min | Minceb |
| FPS5 | Soak in 100 °C water for 15 min | Mince |
| FPS6 | Steam for 15 min | Mince |
| FPS7 | Soak in 60 °C water for 15 min | Horizontal knife cutc |
| FPS8 | Soak in 100 °C water for 15 min | Horizontal knife cut |
| FPS9 | Steam for 15 min | Horizontal knife cut |
2.3 Sensory evaluation
Sensory evaluation of FPS was conducted in the laboratory under controlled temperature conditions (approximately 25 °C). The sensory evaluation panel, consisting of 10 members (five males and five females, aged 20 to 25), who were trained in quantitative descriptive analysis (QDA),16 was utilized. Prior to sensory analysis, a three-day induction course was administered to ensure that panelists could accurately recognize and describe FPS aromas. Six descriptors – chili-like, fatty, sweet, herbal, burnt, and pungent – were elicited from the descriptive test. Each FPS sample (20 g) was placed in covered, odorless, transparent PET bottles (volume = 50 mL), randomly numbered with three digits, and assigned to evaluators for scoring. Intensity ratings for each odor attribute were performed by linear scoring with scores ranging from 1 (extremely weak) to 5 (very strong), with a 1.0 increment. The experiment was conducted in triplicate, and averages for each attribute were calculated.2.4 Extraction of volatile compounds from FPS by HS-SPME
Volatile compounds were extracted from nine FPSs using a MultiPurpose Sampler (Gerstel, Mulheim, Germany) equipped with a 50/30 μm DVB/CAR/PDMS fiber (2 cm, grey, Supelco, Bellefonte, PA, USA). Before the initial measurement, the fiber underwent conditioning at 270 °C for 30 min to eliminate any remaining residues. Each FPS sample (4 g) and 6 μL of 1,2-dichlorobenzene (internal standard, 2000 μg mL−1 in methanol) were promptly placed in a headspace vial (20 mL), which was then sealed with a Teflon septum. The vial was transferred to an incubator (250 rpm, orbital shaking) and equilibrated for 10 min at 85 °C. Subsequently, an SPME fiber was exposed to the vial headspace to absorb volatile compounds for 30 min at 85 °C. After extraction, the fiber was introduced into the GC injection port of the GC-MS system and desorbed for 300 s. Between samples, a fiber backout was performed (5 min, 250 °C).2.5 GC-MS analysis
GC-MS analysis was carried out using a 7890B GC equipped with a 5977B mass selective detector (7890B–5977B, Agilent Technologies, Inc., Santa Clara, CA, U.S.A.). A non-polar HP-5MS capillary column (30 m × 250 μm × 0.25 μm, Agilent) was employed for separation. Helium (99.9%) served as the carrier gas at a constant flow rate of 2.0 mL min−1 through the column. The GC oven temperature was initially set at 40 °C (maintained for 3 min), then ramped up to 200 °C at a rate of 4 °C min−1 (held for 2 min), followed by a further increase to 250 °C at a rate of 10 °C min−1 with a final hold of 5 min. Mass spectra were acquired in electron ionization (EI) mode (70 eV) in full scan mode, with a mass range of m/z 35–450 at a scanning rate of 1.8 scans per s. The GC injection port temperature was set at 250 °C, the ion source temperature at 230 °C, and the quadrupole temperature at 150 °C. Sample injection was performed in splitless mode with a solvent delay of 1.5 min.2.6 GC-O analysis
GC-O analysis was performed using a GC-MS system equipped with a sniffer port ODP4 (Gerstel, Mulheim, Germany). At the outlet of the capillary column, a 1![[thin space (1/6-em)]](https://www.rsc.org/images/entities/char_2009.gif) :
:![[thin space (1/6-em)]](https://www.rsc.org/images/entities/char_2009.gif) 1 split ratio was maintained between the sniffer port ODP4 and MS detector. Moist gas (99% nitrogen) was pumped into the sniffing port to ensure the comfort of panelists. Each sample of FPS was sniffed twice by three panelists (two males and one female) who had been trained and were experienced. Aromatic compounds that were detected by more than two panelists were recorded. Simultaneously, the GC-O results were scored by the panelists based on the magnitude of the odor detected through sniffing, with intensities ranging from 1 to 5 points in increments of 1, where a larger number indicates that the compound has a stronger odor.17
1 split ratio was maintained between the sniffer port ODP4 and MS detector. Moist gas (99% nitrogen) was pumped into the sniffing port to ensure the comfort of panelists. Each sample of FPS was sniffed twice by three panelists (two males and one female) who had been trained and were experienced. Aromatic compounds that were detected by more than two panelists were recorded. Simultaneously, the GC-O results were scored by the panelists based on the magnitude of the odor detected through sniffing, with intensities ranging from 1 to 5 points in increments of 1, where a larger number indicates that the compound has a stronger odor.17
2.7 Identification and quantitation analysis
The volatile compounds in FPS were identified by comparing their MS spectra with those from the NIST 20.0 database and referencing retention indexes (RI) and odor characteristics found in the literature. Some important compounds were further certified using standards. The RI value was calculated using a homologous series of n-alkane standards (C7–C30) under the same chromatographic conditions, as described in the equation by An et al.18 Volatile compounds in FPS were semiquantitated by correlating them with 1,2-dichlorobenzene, which served as an internal standard. The concentrations of aroma compounds were then calculated from the volatiles' peak areas and the concentration of the internal standard. The relative abundance of each compound was determined according to the method outlined by Fang et al.192.8 Relative odor activity values (rOAV) determination
The rOAV for each aroma compound was calculated by dividing its relative concentration (Ci) by its odor threshold (OTi), expressed as rOAV = Ci/OTi. The odor thresholds of the aroma-active compounds used in this study were sourced from literature ref. 20 and 21.2.9 Statistical analysis
The GC-MS results were analyzed and processed using Excel 2016. The experimental data were expressed as the mean ± standard deviation (SD). The outcomes of the QDA and the combined rOAV and GC-O analysis were presented through a radar chart and Venn diagram, respectively. These visualizations were generated using Origin 2021 (OriginLab Corporation, Northampton, MA). The clustered heatmap was generated using TBtools version 2.019 (Heatmap Illustrator, China). Principal Component Analysis (PCA) and Partial Least Squares Discriminant Analysis (PLS-DA) were conducted using SIMCA-P 14.1 (Umetrics, Umeå, Sweden). Partial least squares regression (PLSR) analysis was performed using Unscrambler x. 10.4 (CAMO ASA, Norway). A one-way analysis of variance (ANOVA) was performed by SPSS statistics 26.0 (SPSS Inc., Chicago, IL, USA), p values < 0.05 were considered statistical significance.3. Results and discussion
3.1 Sensory evaluation
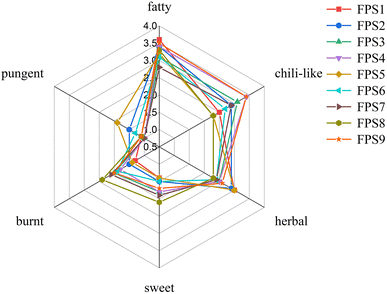
In order to comprehend the overall aroma profiles of the nine FPS samples subjected to different pretreatments, a QDA was conducted based on six sensory attributes. The results were depicted on a spider diagram (Fig. 2). It was observed that attributes such as chili-like, fatty, and herbal exhibited higher aroma intensities, while sweet, burnt, and pungent attributes were relatively subdued. Additionally, variations were noted in the sensory attributes among the nine FPS samples. FPS4 and FPS9 demonstrated comparatively higher overall aroma intensities, whereas FPS1 and FPS6 displayed relatively lower overall odor intensities. FPS7–FPS9, prepared using the horizontal cutting process, exhibited stronger burnt aroma notes. This could be attributed to the horizontal knife cuts causing the separation of chili pepper flesh from the skin, resulting in thinner skin sections more prone to charring during frying, thereby producing a more pronounced burning aroma.22 Moreover, FPS3 displayed stronger chili-like (3.1), herbal (2.5), and burnt (2) attributes, with the weakest pungent (1) note, denoted by (n) representing the average score for different aroma attributes, rendering the overall odor of FPS3 sample more balanced. In summary, FPS3 sample was preferred the most by the panelists.3.2 Identification and quantitation of volatile compounds
Volatile compounds present in FPS, prepared using various pretreatment processes, were identified utilizing SPME coupled with GC-MS, and quantified relative to the internal standard 1,2-dichlorobenzene employing a semi-quantitative approach. Table S1 (ESI)† illustrates the identification of a total of 115 volatile compounds, categorized into 12 main types, including alkenes (26), ketones (14), acids (2), alcohols (11), aldehydes (23), phenols (3), ethers (2), esters (12), hydrocarbons (8), pyrazines and pyrroles (5), furans (2), and others (7), where (n) represents the number of different volatile compounds identified. The number of volatiles detected in samples FPS1–FPS9 ranged from 92 to 102. All FPS samples exhibited rich aromatic properties.The analysis of compound content for each sample is depicted in Fig. S1 (ESI).† Alkenes (9.21–15.70 mg kg−1), ketones (2.20–15.86 mg kg−1), and acids (3.85–9.04 mg kg−1) were found to dominate the content of substances in FPS samples. Among all samples, FPS9 exhibited the highest concentration of volatile compounds, indicating that the ‘steam’ and ‘horizontal knife cut’ processes are more effective in accumulating volatile compounds. Regarding heat-moisture treatment, FPSs prepared through 100 °C water immersion showed lower total volatile compounds compared to those prepared via 60 °C water immersion and water-isolated steaming. This difference is primarily attributed to variations in ketones, acids, aldehydes, and alcohols content. Excessively high soaking water temperature may lead to the loss of volatile compounds or their precursor substances in FPSs, while intermittent steaming minimizes contact between peppers and water, thereby reducing the loss of aroma precursor substances.23 Concerning the crushing methods, FPS samples processed through mincing contained fewer volatile substances compared to those prepared through mashing and horizontal knife crushing. This difference can be attributed to variations in alkenes, ketones, acids, and phenols content. The smaller granularity and lower viscosity of ciba peppers produced through mincing facilitate a quicker heating process during frying. Consequently, a greater proportion of the compounds may vaporize or undergo decomposition in the latter stages of frying, resulting in a decrease in the concentration of aroma compounds.24
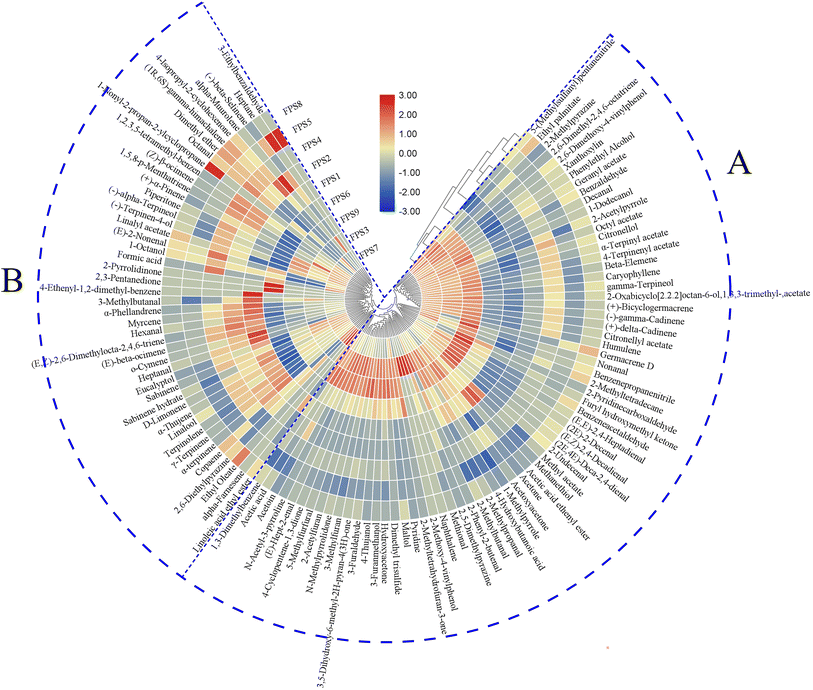
To facilitate a clearer comparison among the nine FPSs, hierarchical clustering analysis (HCA) was conducted using a clustered heatmap based on the contents of 115 volatiles. As illustrated in Fig. 3, the heatmap represents the comprehensive profile of each volatile through colored boxes, with color intensity normalized from blue (minimum) to red (maximum), corresponding to the smallest to the largest content of the compound.21 The HCA results delineated two distinct clusters of FPSs: FPS3, FPS7, and FPS9 formed one group, while FPS1, FPS2, FPS4, FPS5, FPS6, and FPS8 comprised the other group. This observation aligned with the quantitative findings for volatile compounds, suggesting that ‘heat-moisture treatment’ and ‘crushing mode’ processes exert significant influence on the aroma of FPSs. Additionally, the volatiles were categorized into two groups based on the dendrogram. Group A consisted of 70 compounds, predominantly acids, pyrazines and pyrroles, ketones, and all phenols, furans, and others. In group A, acetic acid (3.85–9.04 mg kg−1) and 3,5-dihydroxy-6-methyl-2H-pyran-4(3H)-one (1.12–12.83 mg kg−1) exhibited higher contents, potentially contributing significantly to the aroma of the FPSs. Research suggests that acetic acid, typically generated during carbohydrate metabolism in thermal processing, imparts a pungent sourness to foods.25 Despite its high odor threshold, acetic acid could contribute to aroma harmonization in FPSs. 3,5-Dihydroxy-6-methyl-2H-pyran-4(3H)-one is a product of the intermediate stage of the Maillard reaction, derived further from intermediate 1-deoxyglucosone.26 It often imparts a caramel aroma to food and could be a significant contributor to the overall aroma of FPSs.27 The remaining 45 compounds were categorized into group B, including mainly alkenes, hydrocarbons, alcohols, and all ethers. Among these, myrcene (2.37–4.86 mg kg−1) and D-limonene (3.55–5.59 mg kg−1) exhibited higher levels with lower odor thresholds. Myrcene and D-limonene are commonly used as flavorings in the food industry due to their pleasing terpene aroma,28–30 potentially exerting a significant impact on the aroma of FPSs.
3.3 Identification of aroma-active compounds by GC-O and rOAV
Research indicates that only a portion of the volatile compounds in food are relevant to overall aroma perception.31 To delve deeper into the aroma profile of FPSs, rOAV and GC-O were utilized to analyze the 115 volatile compounds present in the samples.The overall aroma of a food matrix is influenced not only by the concentration of volatile compounds but also by their odor thresholds and composition.32 rOAV is defined as the ratio of the relative concentration of volatile compounds to their odor threshold. Typically, compounds with rOAV >1 are considered to significantly contribute to sample aroma.33,34 As indicated in Table S2 (ESI),† among the 22 aroma-active compounds identified through rOAV analysis, 17, 18, 18, 19, 18, 18, 18, 18, and 21 volatiles had rOAVs >1 in FPS1–FPS9, respectively. Of these compounds, 17 were detected in all FPSs, suggesting their pivotal role in shaping the overall aroma profile of FPSs. Notably, methional (potato-like), myrcene (terpeny) and linalool (floral) exhibited high rOAV values (>100) in FPS samples, implying their significant contribution to the aroma of FPSs. Among these 17 compounds, Sample FPS9 displayed the highest number of rOAV maxima (7), contributing to its intense aroma. This finding was consistent with the results of sensory evaluation.
In the same crushing mode, six compounds (methanethiol, 2-methylpropanal, acetic acid, 2-methylbutanal, hydroxyacetone, methional) exhibited minimal rOAV values for samples produced using the ‘soak in 100 °C water’ process. Simultaneously, six compounds (2-methylpropanal, acetic acid, 3-methylbutanal, 2-methylbutanal, hydroxyacetone, D-limonene) showed the lowest rOAV values in samples produced through the ‘mince’ process with the same ‘heat-moisture treatment’. This finding suggests that the ‘soak in 100 °C ’ and ‘mince’ processes are not conducive to aroma generation in FPSs. Particularly, linalool exhibited high content in samples FPS1, FPS4, and FPS7 prepared using the ‘soak in 60 °C water’ process. Cho et al.35 reported that linalool has a sweet and citrus aroma profile, suggesting that FPS samples made through the ‘soak in 60 °C water’ process may have a strong herbal and sweet character. The content of myrcene (woody) was higher in samples FPS1, FPS2, and FPS3 produced through the mashing process, indicating that the ‘mash’ process favors the accumulation of woody odor. (2E,4E)-Deca-2,4-dienal, described as having fatty, and fried aromas in food, may have a beneficial impact on the scent of FPSs.36 Its concentration was found to be higher in FPS9 and FPS3 samples.
The intensity of GC-O is an assessment made by the experimenter based on the perceived strength of odor of the compound, and aromatic compounds identified by at least two experimenters are recorded.37 As shown in Table S3 (ESI),† a total of 26 volatile organic compounds were detected in FPSs through olfactory analysis, with 20, 20, 18, 19, 18, 19, 19, 23, and 21 compounds identified in FPS1–FPS9, respectively. Sixteen compounds were detected in all FPSs, including six aldehydes, two alcohols, two alkenes, as well as one each of pyrazines and pyrroles, furans, ethers, acids, ketones, and esters. These aroma-active compounds are potentially key aroma substances in FPSs. Particularly, linalool, benzeneacetaldehyde, 3,5-dihydroxy-6-methyl-2H-pyran-4(3H)-one, methional, and (−)-terpinen-4-ol exhibited high GC-O intensities (odor intensity ≥3) among the nine samples, and were therefore considered to be the main volatile characteristic substances of the FPSs.
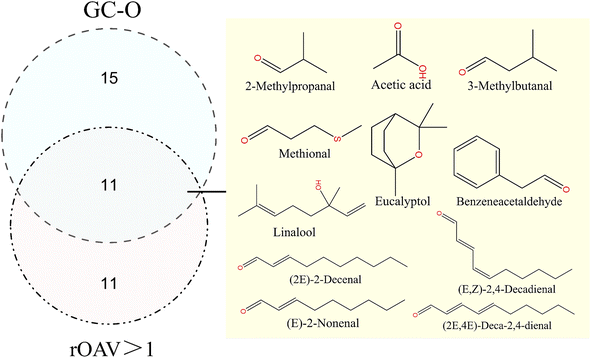
Performing a Venn diagram analysis of the rOAV analysis and GC-O detection results, as depicted in Fig. 4. The joint analysis revealed 11 compounds considered characteristic aroma substances of FPSs, including 2-methylpropanal, acetic acid, 3-methylbutanal, methional, eucalyptol, benzeneacetaldehyde, linalool, (E)-2-nonenal, (2E)-2-decenal, (2E,4E)-deca-2,4-dienal, and (E,Z)-2,4-decadienal. All of these were identified as key aroma compounds influencing the aroma of FPSs. They were classified into three groups based on aroma characteristics, detailed in Table 2. Group 1 (D5, E1, and G2) exhibited herbal-like odors described as floral, fresh, green, and minty. Group 2 (E16, E19, E21, and E22) predominantly presented an oily smell. Group 3 (C2, E2, E7, E14) was associated with sour, cocoa-like, potato-like, and bitter almond aromas, classified as other aromas. These key aroma compounds constitute the foundation of the aroma profile of FPSs. Additionally, 11 compounds showed rOAV values >1 only, while 15 compounds were detected solely by GC-O. These fragrant compounds were believed to play a significant coordinating role in the comprehensive aroma profile of FPSs.
| No.a | Compounds | Odor descriptionb | Related groupc |
|---|---|---|---|
| a The numbers refer to the compounds are in line with those specified in Table S1.b Odor description sensed at the GC-O sniffing port.c Represents the rOAV >1 and detected by GC-O in the FPS with different pretreatment methods. | |||
| Group 1 | |||
| D5 | Linalool | Floral | All |
| E1 | 2-Methylpropanal | Fresh, herbal | FPS2, FPS8, FPS9 |
| G2 | Eucalyptol | Green, minty | All |
![[thin space (1/6-em)]](https://www.rsc.org/images/entities/char_2009.gif) |
|||
| Group 2 | |||
| E16 | (E)-2-Nonenal | Unpleasant, fatty | FPS4 |
| E19 | (2E)-2-decenal | Fatty, mushroom | FPS9 |
| E21 | (2E,4E)-deca-2,4-dienal | Fatty, oily | FPS3, FPS9 |
| E22 | (E,Z)-2,4-decadienal | Fatty, oily | All |
![[thin space (1/6-em)]](https://www.rsc.org/images/entities/char_2009.gif) |
|||
| Group 3 | |||
| C2 | Acetic acid | Sour, pungent | All |
| E2 | 3-Methylbutanal | Cocoa-like | All |
| E7 | Methional | Potato-like | All |
| E14 | Benzeneacetaldehyde | Bitter almond | All |
3.4 PCA and PLS-DA analysis
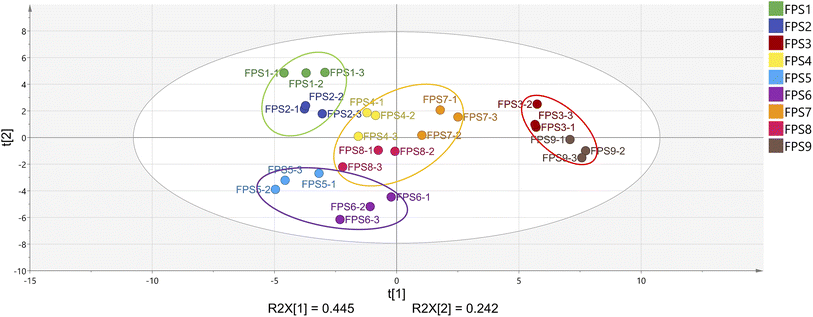
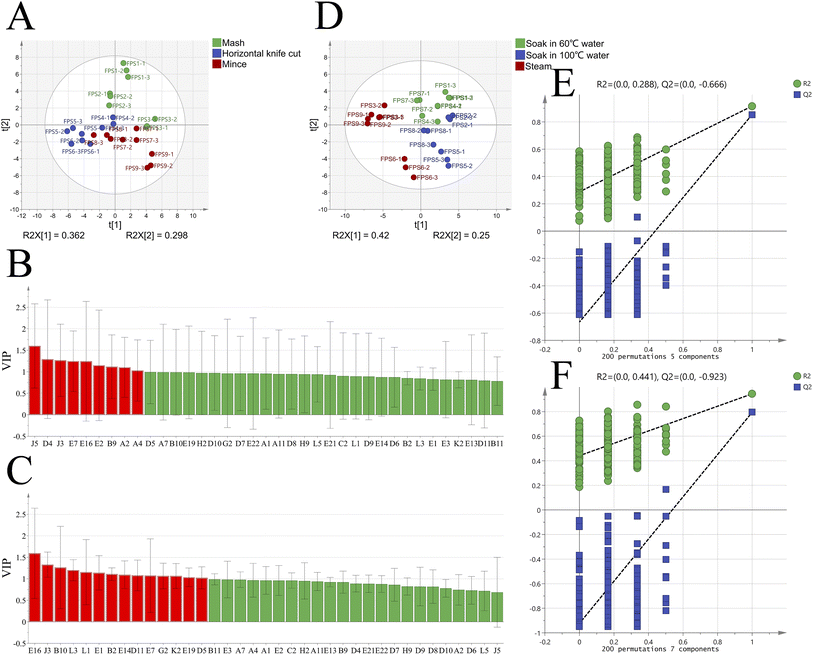
Utilizing the quantitative analysis of 37 aroma-active compounds with rOAV >1 or detected by GC-O, both PCA and PLS-DA were employed to scrutinize the variability of FPSs across different pretreatment processes. PCA, an unsupervised data analysis method, employs dimensionality reduction to visualize intricate variations in information across different samples.38,39 Fig. 5 illustrates PCA score scatter plots of the 9 FPSs subjected to various pretreatment processes. The total variance of the two principal components, PC1 and PC2, accounted for 68.7%, indicating that the model effectively captured the main information of all samples. In the PCA score plot, FPSs were roughly categorized into four different clusters due to the varying aroma-active compounds. Samples FPS1 and FPS2 formed one group, FPS5 and FPS6 in the second category, FPS4, FPS7, and FPS8 in the third category, and FPS3 and FPS9 constituted the fourth group. This finding suggests that different pretreatments, including ‘heat-moisture treatment’ and ‘crushing mode’, lead to deviations in the primary aroma profiles of FPSs. Notably, the distances between the fourth group and the other three categories of samples were greater in the PCA score plot. This indicates more significant differences between samples FPS3 and FPS9 compared to the remaining seven samples.40To delve further into the effects of the two pretreatment processes, namely ‘heat-moisture treatment’ and ‘crushing mode’, on the aroma of FPSs, we conducted PLS-DA analysis for the 37 aroma-active compounds based on the results of PCA. PLS-DA is a supervised statistical analysis method aiming to maximize the elucidation of differences between groups by leveraging sample grouping information.41 In this study, samples were categorized based on the ‘heat-moisture treatment’ process and the ‘crushing mode’, respectively, and PLS-DA analyses were subsequently performed for each group. Fig. 6A and D display the score plots of the two PLS-DA models. As observed, a portion of the FPS samples from different ‘crushing mode’ processes could be separated in the model, whereas samples derived from different ‘heat-moisture treatment’ processes demonstrated more distinct separation. This phenomenon indicates that the aroma formation of FPSs is more significantly influenced by the ‘heat-moisture treatment’ processes compared to the ‘crushing mode’ process.42 Fig. 6B and C illustrate the variable importance in the projection (VIP) for different compounds. VIP values were utilized to identify the most influential variables, with variables having a VIP score greater than 1 generally regarded as having a significant impact on sample discrimination.43 As shown in Fig. 6B, a total of 9 aroma-active volatiles with VIP >1 were screened out. In addition, based on one-way analysis of variance (p < 0.05) and VIP > 1, eight key substances (2,6-diethylpyrazine, sabinene hydrate, 2,5-dimethylpyrazine, (E)-2-nonenal, 3-methylbutanal, furyl hydroxymethyl ketone, (+)-α-pinene, myrcene) could be used as a aroma indicator to distinguish FPS samples prepared by different ‘crushing method’ processes. According to Fig. 6C, the VIP scores for the 14 volatile compounds were >1. Based on one-way analysis of variance (p < 0.05) and VIP >1, twelve key differential components could be used as markers to discriminate the aroma of FPSs prepared using different ‘heat-moisture treatment’ processes, including 2,5-dimethylpyrazine, dimethyl trisulfide, methanethiol, 2-methylpropanal, hydroxyacetone, benzeneacetaldehyde, 1-dodecanol, methional, eucalyptol, 2-acetylfuran, (2E)-2-decenal, linalool. To assess whether the discriminant model has overfitted the data, permutation tests (n = 200) were conducted on each of the two PLS-DA models (Fig. 6E and F). The results showed that all R2 and Q2 values on the left side in both models were smaller than the original point on the right side. Additionally, the regression line at the Q2 point had an intercept of less than 0 (Q12 = −0.666, Q22 = −0.923) with the vertical axis in both models. These results suggest that neither model was overfitted and both demonstrated strong predictive capability, suitable for discriminant analysis of different FPS aromas.
3.5 Correlation between aroma-active compounds and sensory attributes
Partial least squares regression (PLSR) was performed to investigate the correlations between the identified aroma-active compounds and sensory attributes of different FPS samples. As shown in Fig. 7, variable X was specified as the 37 aroma-active compounds and variable Y was set to the six sensory attributes. PLSR model included two-factor explaining 67% of the X variance and 43% of the Y variance. The inner ellipse and the outer ellipse showed 50% and 100% of the explained variance, respectively. Six sensory attributes and all aroma-active compounds were placed in the two ellipses, indicating that these variables were well explained by the PLSR model. In the PLSR analysis, the closer to variable Y indicated the higher X and Y correlation.44 As shown in Fig. 7, the ‘chili-like’, ‘burnt’ and ‘sweet’ attributes were closely related to most of the aroma-active compounds, such as E1 (2-methylpropanal), J3 (2,5-dimethylpyrazine), B9 (furyl hydroxymethyl ketone), and L5 (5-(methylsulfanyl)pentanenitrile). Moreover, the ‘fatty’ and ‘herbal’ attributes were weakly associated with some aroma-active volatiles. The possible reason is that there are more volatile compounds involved in the formation of these two sensory attributes due to the complexity of the FPSs matrix. In addition, ‘pungent’ attribute was one of the lowest scoring sensory attributes in the FPS samples, and it appeared to be weakly correlated with only two aroma-active compounds, E10 (benzaldehyde) and E16 ((E)-2-nonenal).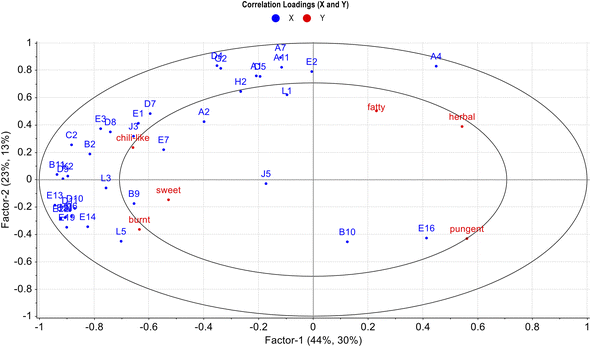 | ||
| Fig. 7 The correlation loading plots between the aroma-active components (x) and sensory attributes (y) in FPSs with different pretreatment processes. | ||
4. Conclusions
In this study, the aroma profiles and key aroma compounds of FPSs from various pretreatment processes were characterized using GC-O-MS, QDA, rOAV, PCA and PLS-DA, and PLSR. QDA results revealed that the overall aroma of FPSs was predominantly characterized by chili-like, fatty, and herbal notes. A total of 115 volatile aroma compounds were identified by GC-MS across nine FPSs, categorized into 12 chemical classes. Alkenes, ketones, and acids emerged as the primary volatiles in FPSs, albeit with variations in content among samples. Both rOAV (with rOAV >1) and GC-O analyses identified 22 and 26 aroma-active compounds in FPSs, respectively. Combining these two groups of aroma actives yielded 11 key aroma substances influencing the FPS aroma profile. These substances include 2-methylpropanal, acetic acid, 3-methylbutanal, methional, eucalyptol, benzeneacetaldehyde, linalool, (E)-2-nonenal, (2E)-2-decenal, (2E,4E)-deca-2,4-dienal, and (E,Z)-2,4-decadienal. Furthermore, PCA analysis modeled 37 aroma-active substances to characterize the variation in FPS aromas. Subsequent PLS-DA analysis and one-way ANOVA highlighted 8 compounds as significant factors influencing FPS aroma in different ‘crushing method’ processes. Additionally, 12 aroma compounds were identified as significant contributors to aroma variations in FPSs with different ‘heat-moisture treatment’ processes. Finally, PLSR results showed a good correlation between the aroma-active compounds and the sensory attributes. This comprehensive exploration sheds light on the aroma attributes of fried pepper sauce and underscores the significance of different pretreatment methods in shaping FPSs aroma profiles. Such insights hold promise for enhancing the precision of FPSs processing and ensuring superior aroma quality in FPSs products.Ethical statement
In this study, informed consent was obtained from all participants prior to conducting experiments involving human participation. All participants were in good health and had the option to withdraw from the study at any time.Author contributions
Hao Luo: investigation, conceptualization, sample collection, data analysis, software, writing – original draft. Yongjun Wu: resources, funding acquisition, project administration, conceptualization, supervision, validation, writing – review and editing manuscript. Jing Jin: supervision, writing–review and editing manuscript. Lincheng Zhang: conceptualization, writing – review and editing manuscript. Shuoqiu Tong: writing – review and editing. Cen Li: writing – review and editing. Qibo Tan: sample collection, data analysis. Qiqin Han: investigation, data analysis.Conflicts of interest
The authors declare that they have no conflict of interest.Acknowledgements
This work was financially supported by the Guizhou Province's Twelfth Major Agricultural Specialty (Pepper) Industry Task Force Project Genetic Analysis and Associated ‘Genetic Analysis and Associated Gene Mining of Guizhou Pepper Quality’.References
- Z. Liu, S. Cai, S. Zhang, Y. Xiao, S. Devahastin, C. Guo, Y. Wang, T. Wang and J. Yi, Trends Food Sci. Technol., 2023, 141, 104189 CrossRef CAS.
- V. Stoleru, I. Mangalagiu, D. Amăriucăi-Mantu, G.-C. Teliban, A. Cojocaru, O.-R. Rusu, M. Burducea, G. Mihalache, M. Rosca, G. Caruso, A. Sekara and G. Jităreanu, Front. Nutr., 2023, 10, 1264999 CrossRef PubMed.
- J. Zhang, C. Wang, J. Wang, Y. Yang, K. Han, E. P. Bakpa, J. Li, J. Lyu, J. Yu and J. Xie, Front. Nutr., 2023, 9, 1027605 CrossRef PubMed.
- S. Choi, Y. Lee, M. Jung, S. Kim and B. Moon, Food Control, 2024, 155, 110091 CrossRef CAS.
- J. Szwejda-Grzybowska, E. Ropelewska, A. Wrzodak and T. Sabat, Food Control, 2024, 155, 110088 CrossRef CAS.
- J. Wang, Y.-P. Pei, C. Chen, X.-H. Yang, K. An and H.-W. Xiao, Innovative Food Sci. Emerging Technol., 2023, 83, 103246 CrossRef CAS.
- K. Li, T. Chen, X. Shi, W. Chen, X. Luo, H. Xiong, X. Tan, Y. Liu and D. Zhang, Food Chem.: X, 2023, 19, 100854 CAS.
- X. Xu, B. Wu, W. Zhao, F. Lao, F. Chen, X. Liao and J. Wu, Food Chem., 2021, 335, 127512 CrossRef CAS PubMed.
- Z. Ye, Z. Shang, M. Li, Y. Qu, H. Long and J. Yi, Food Res. Int., 2020, 137, 109535 CrossRef CAS PubMed.
- M. LU, S. Tong, G. Peng, M. Zhou and W. Yongjun, China Brew., 2021, 40(09), 221–224 Search PubMed.
- Y. Song, Z. Ding, Y. Wu, T. Zhang, Z. Tang, Y. Yu and Y. Wang, Int. J. Food Sci. Technol., 2021, 56, 5533–5546 CrossRef CAS.
- Y. Song, Z. Ding, Y. Peng, J. Wang, T. Zhang, Y. Yu and Y. Wang, Food Chem.: X, 2022, 15, 100413 CAS.
- N. Zhang, B. Sun, X. Mao, H. Chen and Y. Zhang, Food Res. Int., 2019, 121, 296–306 CrossRef CAS PubMed.
- X. Wang, D. J. McClements, Z. Xu, M. Meng, C. Qiu, J. Long, Z. Jin and L. Chen, Trends Food Sci. Technol., 2023, 138, 297–309 CrossRef CAS.
- B. Shi, X. Guo, H. Liu, K. Jiang, L. Liu, N. Yan, M. A. Farag and L. Liu, Food Chem., 2024, 438, 137994 CrossRef CAS PubMed.
- Y. Fu, M. Sun, T. Feng, Q. Liu, L. Yao, C. Yu and S. Song, J. Agric. Food Chem., 2023, 71, 18973–18985 CrossRef CAS PubMed.
- X. Yin, Y. Xiao, K. Wang, W. Wu, J. Huang, S. Liu and S. Zhang, Food Res. Int., 2023, 174, 113515 CrossRef CAS PubMed.
- H. An, X. Ou, Y. Zhang, S. Li, Y. Xiong, Q. Li, J. Huang and Z. Liu, Food Chem., 2022, 385, 132718 CrossRef CAS PubMed.
- X. Fang, W. Xu, G. Jiang, M. Sui, J. Xiao, Y. Ning, R. Niaz, D. Wu, X. Feng, J. Chen, Y. Huang and G. Lei, Food Chem., 2024, 439, 137810 CrossRef CAS PubMed.
- L. Van Gemert, Compilations of Odor Threshold Values in Air, Water and Other Media, Oliemans Punter & Partners BV, Netherlands, 2011 Search PubMed.
- R. Ni, H. Yan, H. Tian, P. Zhan and Y. Zhang, Food Chem., 2022, 377, 131984 CrossRef CAS PubMed.
- A. Patra, V. A. Prasath, P. P. Sutar, N. K. S. Pandian and R. Pandiselvam, Food Res. Int., 2022, 162, 112074 CrossRef CAS PubMed.
- A. C. Araújo, S. M. Oliveira, I. N. Ramos, T. R. S. Brandão and C. L. M. Silva, Food Bioprocess Technol., 2016, 9, 872–881 CrossRef.
- C. Chang, G. Wu, H. Zhang, Q. Jin and X. Wang, Crit. Rev. Food Sci. Nutr., 2019, 60, 1496–1514 CrossRef PubMed.
- A. Korkmaz, A. A. Hayaloglu and A. F. Atasoy, Lwt, 2017, 84, 842–850 CrossRef CAS.
- H. Li, X.-Y. Tang, C.-J. Wu and S.-J. Yu, Lwt, 2019, 105, 156–163 CrossRef CAS.
- S. Xu, J.-R. Zhao, Q. Guo, H.-M. Liu, Z. Qin and X.-D. Wang, Lwt, 2023, 187, 115385 CrossRef CAS.
- M. Dein and J. P. Munafo, J. Agric. Food Chem., 2019, 67, 2589–2597 CrossRef CAS PubMed.
- C.-Y. Hou, S. H. Hazeena, S.-L. Hsieh, B.-H. Li, M.-H. Chen, P.-Y. Wang, B.-Q. Zheng and Y.-S. Liang, Molecules, 2022, 27, 6157 CrossRef CAS PubMed.
- S. Surendran, F. Qassadi, G. Surendran, D. Lilley and M. Heinrich, Front. Nutr., 2021, 8, 699666 CrossRef PubMed.
- R. Ni, P. Wang, P. Zhan, H. Tian and T. Li, Food Chem., 2021, 357, 129786 CrossRef CAS PubMed.
- H. Li, D. Qin, Z. Wu, B. Sun, X. Sun, M. Huang, J. Sun and F. Zheng, Food Chem., 2019, 284, 100–107 CrossRef CAS PubMed.
- Q. Li, B. Li, C. Zhang, X. Zhou, W. Liu, Y. Mi, Z. Xie, Y. Li and J. Li, Food Control, 2024, 155, 110048 CrossRef CAS.
- J. Xie, L. Wang, Y. Deng, H. Yuan, J. Zhu, Y. Jiang and Y. Yang, Food Chem., 2023, 427, 136641 CrossRef CAS PubMed.
- I. H. Cho, H. J. Namgung, H. K. Choi and Y. S. Kim, Food Chem., 2008, 106, 71–76 CrossRef CAS.
- W.-t. Yin, X.-t. Ma, S.-j. Li, X.-d. Wang, H.-m. Liu and R. Shi, Food Res. Int., 2021, 150, 110794 CrossRef CAS PubMed.
- Y. Feng, Y. Cai, X. Fu, L. Zheng, Z. Xiao and M. Zhao, Food Chem., 2018, 265, 274–280 CrossRef CAS PubMed.
- X. Ji, W. Ji and L. Ding, Food Anal. Methods, 2023, 17, 200–206 CrossRef.
- G. Song, M. Zhang, Y. Zhang, H. Wang, S. Li, Z. Dai and Q. Shen, J. Agric. Food Chem., 2019, 67, 4679–4688 CrossRef CAS PubMed.
- H. Zhai, W. Dong, Y. Tang, R. Hu, X. Yu and X. Chen, Lwt, 2024, 192, 115717 CrossRef CAS.
- H. Pei, S. He, S. Liu, H. Chen, J. Song, Q. Liu, L. Wang and H. Sun, Food Biosci., 2023, 56, 103312 CrossRef CAS.
- Y. Ye, L. Wang, P. Zhan, H. Tian and J. Liu, Food Chem., 2022, 366, 130691 CrossRef CAS PubMed.
- C. Li, Y. Zou, G. Liao, Z. Zheng, G. Chen, Y. Zhong and G. Wang, Food Chem., 2024, 440, 138188 CrossRef CAS PubMed.
- Y. Zheng, Y. Li, L. Pan, M. Guan, X. Yuan, S. Li, D. Ren, Y. Gu, M. Liang and L. Yi, Food Chem., 2024, 442, 138472 CrossRef CAS.
Footnote |
| † Electronic supplementary information (ESI) available. See DOI: https://doi.org/10.1039/d4ra02343a. |
| This journal is © The Royal Society of Chemistry 2024 |

