 Open Access Article
Chitosan-induced NH4V4O10 hierarchical hybrids as high-capacity cathode for aqueous zinc ion batteries
Yaotong Lia,
Chunru Zhaoa,
Abdukayum Abdukader *b and
Xiang Wu
 *a
*a
aSchool of Materials Science and Engineering, Shenyang University of Technology, Shenyang 110870, P. R. China. E-mail: wuxiang05@sut.edu.cn
bXinjiang Key Laboratory of Novel Functional Materials Chemistry, College of Chemistry and Environmental Sciences, Kashi University, Kashi 844000, P. R. China. E-mail: abdukadera@sina.com
First published on 21st March 2024
Abstract
Aqueous zinc ion batteries (AZIBs) have been widely investigated due to their characteristics of convenient operation and intrinsic safety. However, there are several issues to be addressed in AZIBs, such as slow diffusion kinetics of Zn2+, cathode material dissolution and the dendrite formation of zinc anodes. Thus, it is challenging to prepare a high-performance cathode material. In this work, we prepare NH4V4O10 flower-like structures by a facile hydrothermal route. The introduction of chitosan significantly enlarges the layer spacing of the (001) crystal plane. The assembled Zn//NVO-0.15C batteries deliver a specific capacity of 520.54 mA h g−1 at a current density of 0.2 A g−1. Furthermore, they maintain 91% of the retention rate at 5.0 A g−1 after 1000 times cycling. It demonstrates the excellent zinc ion storage behavior of ammonium vanadate electrode materials for AZIBs.
1. Introduction
In the past few years, the energy crisis and environmental pollution are globally worsened with the acceleration of industrialization. It motivates researchers to develop rechargeable energy storage devices to meet the increasing demands.1,2 Currently, lithium ion batteries (LIBs) dominate most of the battery market with their combination of high energy density and wide operating voltage. However, the safety issues are not negligible due to the use of organic liquid electrolytes and short circuits.3–6 Thus, aqueous zinc-ion batteries (AZIBs) are considered as the alternatives to LIBs with their safety, environmental friendliness, low cost and high theoretical capacity.7–9 It is still a challenge to design cathodes with high specific capacity and durable cycle life.10–12Ammonium vanadate compounds are regarded as a promising cathode material with excellent specific capacity, light weight and superior rate performance.13–15 But the dissolution of vanadium and the collapse of the layer structure decrease their capacity and cyclic life.16 Several strategies are utilized to improve the performance of electrode materials including interlayer insertion,17 nuclear-shell encapsulation18 and the introduction of oxygen defects.19 For example, Zhao et al. designed Ga-NHVO-0.5 cathodes with the capacity of 438.23 mA h g−1 at 0.2 A g−1.20 The addition of Ga increased the specific surface area of (NH4)2V10O25·8H2O materials, which enhanced the transfer of Zn2+. Besides, Zhao and coworkers synthesized graphene oxide encapsulated VO2 nanobelts.21 The carbon layer improves the electrical conductivity and facilitates the insertion and de-insertion of Zn2+. The cells deliver a capacity of 323 mA h g−1 at 0.1 A g−1. Moreover, Peng et al. introduced oxygen defects into NH4V4O10.22 The oxygen vacancy reduces the diffusion barrier of Zn2+ and forms a stable crystal structure during cycling. The as-assembled batteries possess the specific capacity of 499 mA h g−1 at 0.2 A g−1 and a 95.1% retention at 5 A g−1 for 4000 times cycling. However, there is a lack of exploration and experiment with intercalated polymers of ammonium materials.
Herein, we introduce chitosan into NH4V4O10 materials by a facile hydrothermal avenue. The synthesized products present a flower-like shape assembled by many nanorods/sheets, which provide abundant active sites during electrochemical reaction. The NVO-0.15C samples possess the specific surface area of 83.81 m2 g−1. The assembled Zn//NVO-0.15C batteries deliver a specific capacity of 520.54 mA h g−1 at 0.2 A g−1. Also, they possess the energy density of 216.15 W h kg−1 at the power density of 450 W kg−1. Meanwhile, the devices maintain 358.19 mA h g−1 at 5.0 A g−1 after 1000 times cycling.
2. Experimental section
2.1 Material synthesis
In the experiments, all the chemicals were directly used without any purification. The NH4V4O10 samples were synthesized according to previous reports.23 Firstly, 4 mmol NH4VO3 (99%, Shanghai Aladdin Corporation) and 4 mmol H2C2O4·2H2O (99.5%, Tianjin Damao Corporation) were dissolved into 40 mL deionized water at 70 °C. Then, different mass of chitosan (99.5%, Tianjin Damao Corporation) was added into the above solution under magnetic stirring. The mass of chitosan is 0.1, 0.15 and 0.2 g, respectively. The above mixture was then place in a water bath at a constant temperature of 70 °C. After stirring for 0.5 h, the precursor was removed and cooled to room temperature, the pH value of the solution was adjusted to 2 by adding four to five drops of 3 M hydrochloric acid. Then, the solution was transferred into 100 mL Teflon-lined autoclaves and putted in the electric oven. The mixture was heated at 180 °C for 24 h. After cooling to ambient temperature naturally, the products were centrifuged several times alternately with anhydrous ethanol and DI. Finally, the resulting precipitate was dried overnight in a desiccator at 60 °C. The collected black powder was labeled a NVO-0.1C, NVO-0.15C and NVO-0.2C, respectively. For comparison, pure NH4V4O10 materials were also prepared without adding chitosan and labeled as NVO.2.2 Structure and morphology characterization
The crystallographic and phase structure of the samples were evaluated by X-ray diffractometer (XRD, Rigaku Ultima IV, Cu Kα radiation, λ = 0.1541 nm, 40 kV). Then we utilized the X-ray photoelectron spectroscopy (XPS, Thermo fisher Nexsa G2) to characterize the valence of the elements. The morphology and microstructures of the products was observed by scanning electron microscope (SEM, Gemini, 300-71-31) and transmission electron microscope (TEM, JEOL JEM-F200). Finally, the specific surface area and pore size were characterized by the Brunauer–Emmett–Teller (BET) and Barrett–Joyner–Halenda (BJH) test system.2.3 Electrochemical characterization
The cathode materials were fabricated by mixing the prepared samples, carbon black (Taiyuan Lizhiyuan Technology Corporation) and PVDF (polyvinylidene fluoride, Taiyuan Lizhiyuan Technology Corporation) with a mass ratio of 7![[thin space (1/6-em)]](https://www.rsc.org/images/entities/char_2009.gif) :
:![[thin space (1/6-em)]](https://www.rsc.org/images/entities/char_2009.gif) 2:1. After that, an amount of N-methyl-L-2-pyrrolidone (NMP, 99%, Tianjin Damao Corporation) was added to the above mixture to form slurry, then applied on carbon paper. The carbon papers were made of 0.02 mm graphite foil. After that, it was dried in vacuum oven at 60 °C for 12 h. A series of CR2032-type cells were assembled with the obtained electrodes, glass fiber separators (Whatman), zinc foils (0.1 mm) and 3 M Zn(CF3SO3)2 electrolyte (98%, Macklin Corporation). Before using, the zinc foils were sanded on both sides by using sandpapers and cut to 0.5 × 0.5 cm. Two fiberglass diaphragms were used as barriers between the positive and negative electrodes to stop short circuits caused by dendrites in the zinc anode. The mass average and thickness of the cathode are 1.4 mg and 0.2 mm, respectively. The automatic battery test system (Neware, CT-4008T-5 V6A-164) was employed to study the galvanostatic charge–discharge (GCD) curves and galvanostatic intermittent titration technique (GITT). Finally, we study the cyclic voltammetry (CV) and electrochemical impedance spectroscopy (EIS) by using an electrochemical workstation (CHI660E).
2:1. After that, an amount of N-methyl-L-2-pyrrolidone (NMP, 99%, Tianjin Damao Corporation) was added to the above mixture to form slurry, then applied on carbon paper. The carbon papers were made of 0.02 mm graphite foil. After that, it was dried in vacuum oven at 60 °C for 12 h. A series of CR2032-type cells were assembled with the obtained electrodes, glass fiber separators (Whatman), zinc foils (0.1 mm) and 3 M Zn(CF3SO3)2 electrolyte (98%, Macklin Corporation). Before using, the zinc foils were sanded on both sides by using sandpapers and cut to 0.5 × 0.5 cm. Two fiberglass diaphragms were used as barriers between the positive and negative electrodes to stop short circuits caused by dendrites in the zinc anode. The mass average and thickness of the cathode are 1.4 mg and 0.2 mm, respectively. The automatic battery test system (Neware, CT-4008T-5 V6A-164) was employed to study the galvanostatic charge–discharge (GCD) curves and galvanostatic intermittent titration technique (GITT). Finally, we study the cyclic voltammetry (CV) and electrochemical impedance spectroscopy (EIS) by using an electrochemical workstation (CHI660E).
3. Results and discussion
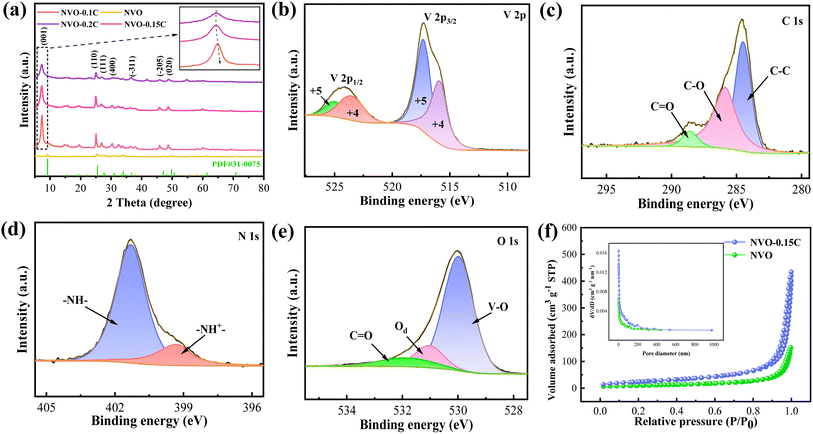
Firstly, XRD is utilized to investigate the phase structures of the fabricated materials. As presented in Fig. 1a, the main characteristic peaks of the samples are well indexed to the NH4V4O10 phase (PDF card No. 31-0075). The diffraction peaks at 9.2, 25.5, 27.7, 31.0, 33.9, 47.0 and 49.8° correspond to the (001), (110), (111), (400), (−311), (−205) and (020) crystal planes, respectively. It is worth noticeable that the (001) diffraction peaks shift to left significantly after chitosan adding, revealing the expansion of the interlayer spacing. The large layer spacing reduces the coulombic interactions when Zn2+ embedding, thus enhance the performance of NVO-0.1C and NVO-0.15C cathodes.24 Moreover, there are slight difference in the characteristic peaks of chitosan doping samples, as shown in the enlarging pattern. The peaks of NVO-0.1C, NVO-0.15C and NVO-0.2C are located at 7.36, 7.26 and 7.28°, respectively. The slight rightward shift of the NVO-0.2C peak is attributed to the collapse of the layer structure, which leads to the degradation of the performance.25Then we use XPS to characterize the chemical valence states and compositions of the samples. Fig. 1b shows the two distinct signal peaks of V 2p1/2 at 525.1/523.7 eV and V 2p3/2 at 517.3/516 eV, which belong to V5+ and V4+, respectively.26 The C 1s peak is fitted into three peaks, including C![[double bond, length as m-dash]](https://www.rsc.org/images/entities/char_e001.gif) O bond (288.6 eV), C–O bond (285.9 eV) and C–C bond (284.8 eV), as demonstrated in Fig. 1c.27 The N 1s spectra corresponds two signal peaks located at 401.3 eV and 399.3 eV (Fig. 1d). They belong to neutral nitrogen (–NH–) and positively charged nitrogen (–NH+–).28 From Fig. 1e, the O 1s signal peaks at 530, 531.1 and 531.9 eV are assigned to the lattice oxygen (V–O), oxygen vacancy defects (Od) and carbonyl group (C
O bond (288.6 eV), C–O bond (285.9 eV) and C–C bond (284.8 eV), as demonstrated in Fig. 1c.27 The N 1s spectra corresponds two signal peaks located at 401.3 eV and 399.3 eV (Fig. 1d). They belong to neutral nitrogen (–NH–) and positively charged nitrogen (–NH+–).28 From Fig. 1e, the O 1s signal peaks at 530, 531.1 and 531.9 eV are assigned to the lattice oxygen (V–O), oxygen vacancy defects (Od) and carbonyl group (C![[double bond, length as m-dash]](https://www.rsc.org/images/entities/char_e001.gif) O), respectively.29 The N2 adsorption–desorption isotherms of the products (Fig. 1f) indicate the typical type IV hysteresis loops, which suggest their mesoporous feature. The specific surface area of the NVO-0.15C materials (83.81 m2 g−1) is larger than that of the NVO samples (35.35 m2 g−1). Furthermore, the two samples possess the pore sizes of 0.453 and 0.296 cm3 g−1, respectively. The high specific surface area and pore volume offer abundant active sites for the transfer of Zn2+ during electrochemical reaction.30
O), respectively.29 The N2 adsorption–desorption isotherms of the products (Fig. 1f) indicate the typical type IV hysteresis loops, which suggest their mesoporous feature. The specific surface area of the NVO-0.15C materials (83.81 m2 g−1) is larger than that of the NVO samples (35.35 m2 g−1). Furthermore, the two samples possess the pore sizes of 0.453 and 0.296 cm3 g−1, respectively. The high specific surface area and pore volume offer abundant active sites for the transfer of Zn2+ during electrochemical reaction.30
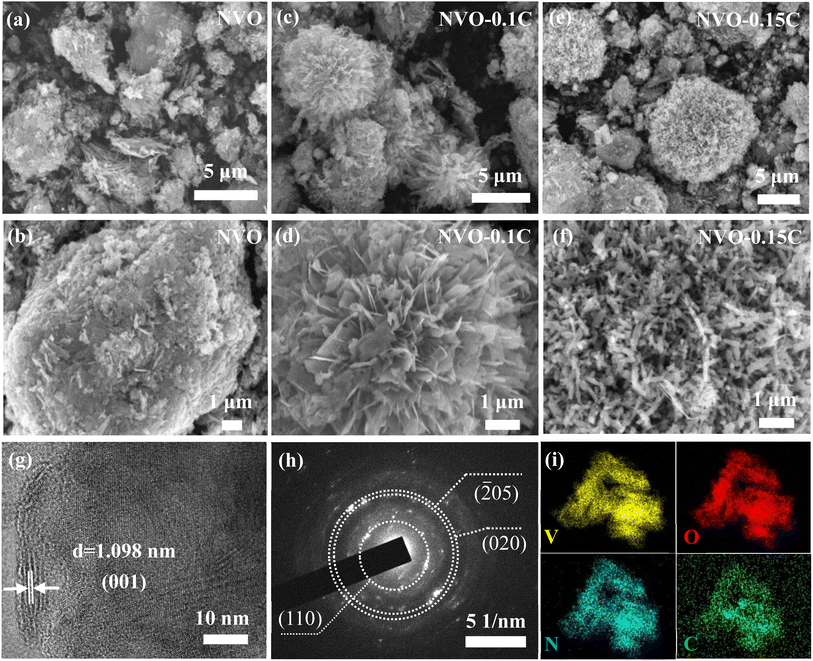
SEM is employed to observe the morphology of the samples. Compared with the NVO samples (Fig. 2a and b), the other two products (Fig. 2c–f) manifest flower-like shapes with the gradual addition of chitosan. Therefore, the morphology of vanadate samples is related to the addition of chitosan. As indicated in Fig. 2d, the NVO-0.1C powder consists of nanosheets. Similarly, many nanorods are interconnected and aggregated disorderly to form nanoflowers (Fig. 2f). Subsequently, Fig. 2g shows the HRTEM image of NVO-0.15C sample. The lattice fringe of 1.098 nm can be assigned to the (001) planes of NVO phase. It can be found that the layer spacing increases compared to that of the NH4V4O10 (d(001) = 0.96 nm, PDF card no. 31-0075). This proves that the introduction of chitosan enlarges the crystal spacing of NH4V4O10 sample, which is consist with the XRD results. Moreover, selected area electron diffraction (Fig. 2h) can be indexed to the (110), (![[2 with combining macron]](https://www.rsc.org/images/entities/char_0032_0304.gif) 05) and (020) planes of NVO-0.15C product, revealing that the fabricated sample belongs to typical polycrystalline structure. As shown in Fig. 2i, the uniform distribution of the elements (V, O, N, and C) is demonstrated by elemental mapping images, which proves the successful intercalation of chitosan.
05) and (020) planes of NVO-0.15C product, revealing that the fabricated sample belongs to typical polycrystalline structure. As shown in Fig. 2i, the uniform distribution of the elements (V, O, N, and C) is demonstrated by elemental mapping images, which proves the successful intercalation of chitosan.
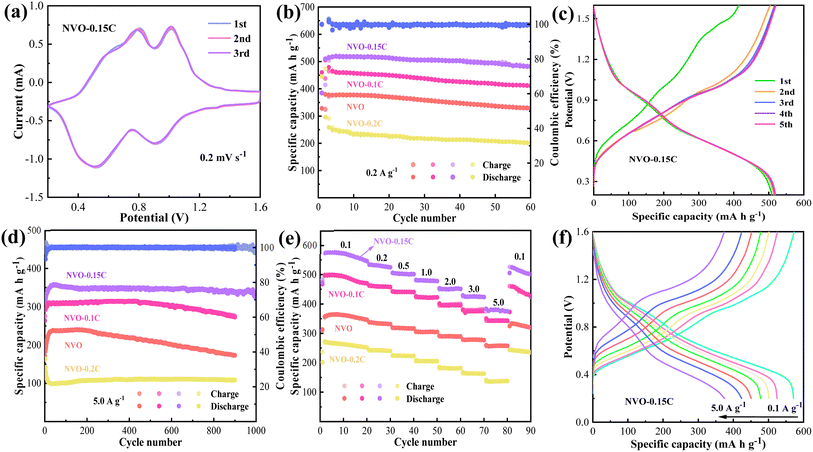
To evaluate the electrochemical performance of the fabricated materials, many button batteries are assembled with 3 M Zn(CF3SO3)2 electrolyte. Fig. 3a shows the first three cycles of the CV curves of NVO-0.15C cathode at the voltage ranging 0.2–1.6 V. The curve patterns are closely overlapping when the scanning rate is 0.2 mV s−1, which suggests the excellent reversibility of the cells. The two pairs of redox peaks are located at 0.51/0.91 V and 0.80/1.01 V, respectively, which correspond to different intercalation and de-intercalation processes of Zn2+.31 As shown in Fig. 3b, the Zn//NVO-0.15C batteries deliver an initial specific capacity of 520.54 mA h g−1 at 0.2 A g−1. They maintain a retention rate of 92.3% after 60 cycles. It is superior to those of NVO-0.1C (464.92 mA h g−1), NVO (377.65 mA h g−1), and NVO-0.2C electrodes (258.49 mA h g−1). Fig. 3c shows the GCD curves for the first five charging and discharging processes of the Zn//NVO-0.15C cell at 0.2 A g−1. The curves maintain a similar shape except for the first two cycles. This reveals that the activation process of the battery leads to a gradual increase in specific capacity. Besides, the curves manifest slightly inclined voltage platforms, which corresponds to the redox peaks of the CV curves.32 This indicates that the embedding and de-embedding of Zn2+ in the cathode material are accompanied by the dynamic changes between V5+ and V4+.
Rate capacity and cycle life are significant parameters to assess the comprehensive property of the cells. Fig. 3d indicates that the NVO-0.15C batteries deliver the specific capacity of 358.19 mA h g−1 at the current density of 5.0 A g−1. They maintain a retention rate of 91% after 1000 cycles. From Fig. 3e, the NVO-0.15C cathodes present the specific capacities of 577.04, 533.05, 503.46, 480.33, 452.19, 425.4 and 378.21 mA h g−1 at 0.1, 0.2, 0.5, 1.0, 2.0, 3.0 and 5.0 A g−1, respectively. When the current density restores to 0.1 A g−1, the capacity returns to 525.69 mA h g−1, which presents the retention rate of 91.1%. Compared with the other three devices, the NVO-0.15C cells present superior rate performance. The inserted chitosan provide high electrical conductivity and accelerate the migration rate of zinc ions. It facilitates the transfer of Zn2+, which increase the specific capacity of batteries during charging and discharging. The GCD curves (Fig. 3f) indicate that the specific capacity decreases with the increase of the current density from 0.1 to 5.0 A g−1. Besides, the curves present small charge–discharge platforms, which correspond to two pairs of redox peaks of the CV curves.
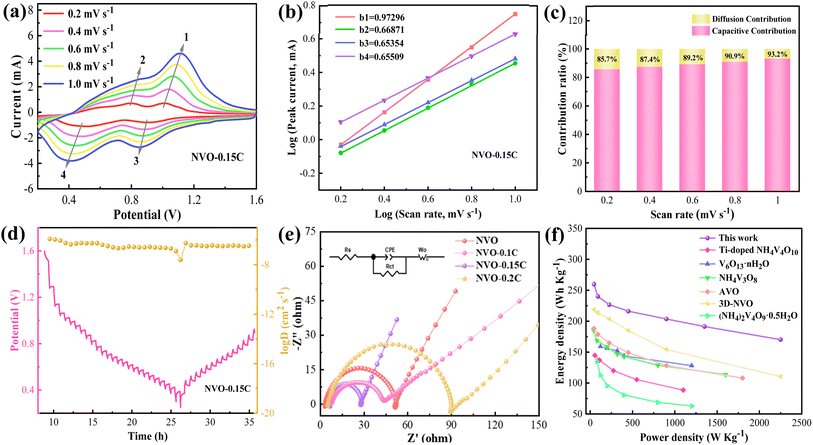
Subsequently, we investigate the electrochemical reaction kinetics of the Zn//NVO-0.15C batteries. Fig. 4a indicates the CV curves of the electrodes at various scanning speeds (0.2–1.0 mV s−1). As the sweeping rates increase, the oxidation and reduction peaks shift to the different potential regions, indicating the occurrence of a polarization phenomenon. In addition, the entire areas of the CV curves gradually rise with the increment of the scanning speed, which reveals a multi-step intercalation and de-intercalation of Zn2+.33 The curves maintain their shapes in different sweep speeds, presenting the high reversibility of the cells. The relationship between scan rates (v) and current (i) is abided by eqn (1) as follows:34
| i = avb | (1) |
![[thin space (1/6-em)]](https://www.rsc.org/images/entities/char_2009.gif) i vs. log
i vs. log![[thin space (1/6-em)]](https://www.rsc.org/images/entities/char_2009.gif) v). From Fig. 4b, the b values are in the range of 0.5–1 (b1 = 0.97, b2 = 0.67, b3 = 0.65 and b4 = 0.66). The result suggests that the surface and diffusion behaviors are synergistically regulate the charge and discharge process. In addition, the contribution rates of pseudocapacitive and diffusion are calculated via eqn (2) below:35
v). From Fig. 4b, the b values are in the range of 0.5–1 (b1 = 0.97, b2 = 0.67, b3 = 0.65 and b4 = 0.66). The result suggests that the surface and diffusion behaviors are synergistically regulate the charge and discharge process. In addition, the contribution rates of pseudocapacitive and diffusion are calculated via eqn (2) below:35| i(V) = k1v + k2v1/2 | (2) |
 | (3) |
Furthermore, EIS is employed to study the zinc storage behavior of Zn//NVO-0.15C cells, as shown Fig. 4e. The typical curve is composed of a semicircle and a line, where the area of semicircle represents the charge transfer resistance (Rct). The inset is the schematic of the equivalent circuit. By fitting the curves, the assembled batteries using NVO, NVO-0.1C and NVO-0.2C materials manifest Rct values of 37.21, 48.52 and 84.37 Ω, respectively. This indicates that the NVO-0.15C electrodes deliver the lower resistance (Rct = 22.46 Ω) than other electrodes, which suggests the fast Zn2+ diffusion process within the cells. This is due to the intercalated chitosan enhances the electrical conductivity and widens the interlayer spacing. Besides, the large specific surface area and pore volume of NVO-0.15C sample provide a wide distribution of Zn2+ storage sites. Energy density and power density are calculated by the equations as follows:37
| E = QU/2m | (4) |
| P = IU/2m | (5) |
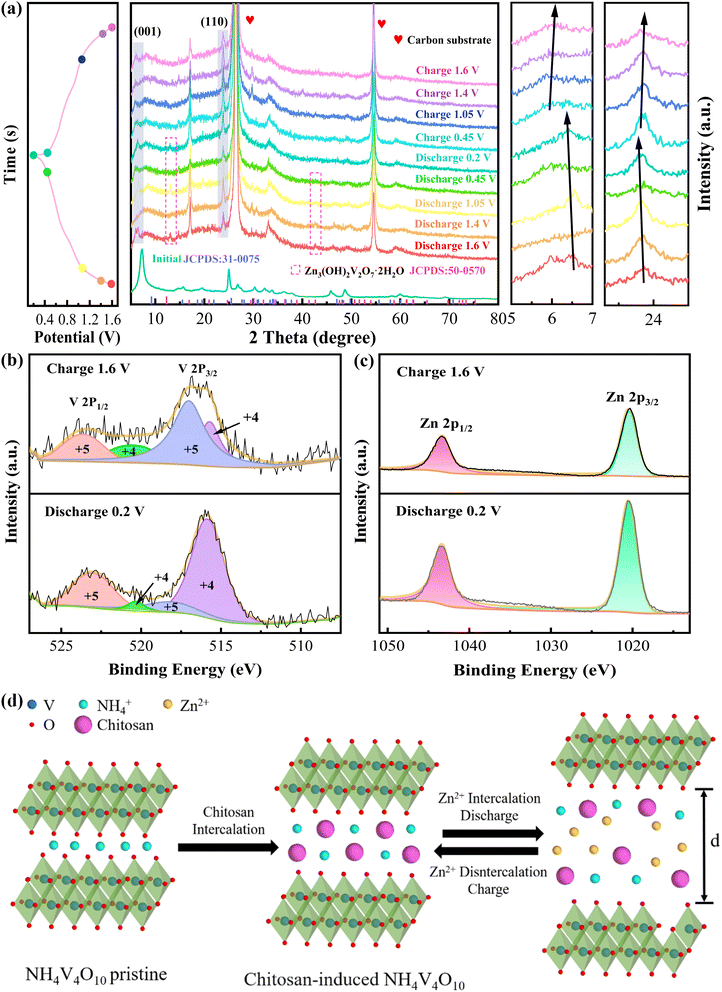
To investigate the Zn2+ storage mechanism of the cells, ex situ XRD is utilized to determine the structure evolution of the devices. Fig. 5a presents the XRD patterns of the samples during the second charge and discharge states. The intensities of these diffraction peaks increase with the enhanced discharge. The similar diffraction peaks in the initial and final states suggest the considerable reversibility of the crystal structure. The characteristic peaks do not apparently change except for the (001) and (110) planes due to the high intensities of carbon peaks. Owing to the contraction and expansion of the crystalline interstitial layers, the characteristic peaks reveal a slight movement toward different angles. During discharging, the characteristic peaks move to left due to the insertion of Zn2+, which reveals the expansion of the interlayer space. On the contrary, the decrease of the layer spacing during charging leads the characteristic peaks move to right, which demonstrates the de-insertion of Zn2+. Besides, the intercalated chitosan act as “pillars” between the NH4V4O10 interlayers to maintain the layer structure. When charge to 1.6 V, the peak shapes and intensities of the pattern return to the initial state, indicating the superior reversibility during cycling. Moreover, it is notably that the signal peaks at 12.29 and 42.65° appear during discharge reaction, demonstrating the formation of Zn3(OH)2V2O7·2H2O phase (JCPDS no. 50-0570). During charging, the signal peaks gradually disappear, indicating the reversibility of the reaction. The detailed reaction is listed as follows:
| V5+ + 4H2O → VO2(OH)2− + 6H+ | (6) |
| 2VO2(OH)2− + 3Zn2+ + 3H2O → Zn3(OH)2V2O7·2H2O + 4H+ | (7) |
Finally, the ex situ XPS is also used to explore the composition and valence change of the NVO-0.15C samples. Fig. 5b shows the V 2p spectra in the charged and discharged states. V 2p1/2 and V 2p3/2 are V4+ and V5+ at 520.45/515.7 eV and 523.6/517.01 eV, respectively. The peak areas of the different valence states vary with the state of charge and discharge. During discharge process, the signal peak area of V5+ decrease accompanied by the increase of V4+. The variation to the valence state of element V indicates the occurrence of reduction reaction and the insertion of Zn2+. Then, the XPS shape is restored after charging, revealing the high reversibility. The two Zn 2p peaks in the charged state are located at 1043.26 eV (Zn 2p1/2) and 1020.44 eV (Zn 2p3/2), respectively, as shown in Fig. 5c. During the discharging, the increasing of the peak intensities confirms the embed of Zn2+ in the cathode. Fig. 5d further shows the mechanism of the NVO-0.15C cathode, confirming the reversible insertion of Zn2+ during charge and discharge.
4. Conclusions
In summary, we synthesized several NH4V4O10 electrode materials by a simple hydrothermal strategy. The introduction of chitosan significantly enlarges the crystallographic spacing of the material and tailors the microscopic morphology of the samples. Moreover, the flower-like structure provides many active sites for the transfer of Zn2+ during electrochemical reaction. The assembled Zn//NVO-0.15C batteries possess an excellent specific capacity and long cycle life. It demonstrates potential application of the assembled cells in future high performance energy storage devices and systems. Simultaneously, this synthesis approach can be extended to prepare some other high-performance cathode materials for AZIBs.Author contributions
Yaotong Li: conceptualization, methodology, data processing, and writing – original draft preparation. Chunru Zhao: software. Yaotong Li: visualization and investigation. Abdukayum Abdukader and Xiang Wu: validation, supervision, and writing – review & editing.Conflicts of interest
The authors declare that they have no known competing financial interests.References
- Z. H. Yi, G. Y. Chen, F. Hou, L. Q. Wang and J. Liang, Adv. Energy Mater., 2020, 11, 2003065 CrossRef.
- D. Selvakumaran, A. Q. Pan, S. Q. Liang and G. Z. Cao, J. Mater. Chem. A, 2019, 7, 18209–18277 RSC.
- V. Etacheri, R. Marom, R. Elazari, G. Salitra and D. Aurbach, Energy Environ. Sci., 2011, 4, 3243–3262 RSC.
- Y. J. Wu, S. Wang, H. Li, L. Q. Chen and F. Wu, InfoMat, 2021, 3, 827–853 CrossRef CAS.
- J. F. Peters, M. Baumann, B. Zimmermann, J. Braun and M. Weil, Renewable Sustainable Energy Rev., 2017, 67, 491–506 CrossRef CAS.
- N. Nitta, F. X. Wu, J. T. Lee and G. Yushin, Mater. Today, 2015, 18, 252–264 CrossRef CAS.
- L. E. Blanc, D. Kundu and L. F. Nazar, Joule, 2020, 4, 771–799 CrossRef CAS.
- M. Song, H. Tan, D. L. Chao and H. J. Fan, Adv. Funct. Mater., 2018, 28, 1802564 CrossRef.
- Y. Tian, Y. L. An, C. L. Wei, B. J. Xi, S. L. Xiong, J. K. Feng and Y. T. Qian, Adv. Energy Mater., 2021, 11, 2002529 CrossRef CAS.
- X. H. Zheng, T. Ahmad and W. Chen, Energy Storage Mater., 2021, 39, 365–394 CrossRef.
- Y. Liu, Y. Liu and X. Wu, Batteries Supercaps, 2023, 6, e2200461 Search PubMed.
- Q. Yang, X. L. Li, Z. Chen, Z. D. Huang and C. Y. Zhi, Acc. Mater. Res., 2022, 3, 78–88 CrossRef CAS.
- C. Lu, Z. Yang, Y. J. Wang, Y. Zhang, H. Wu, Y. Guo and W. L. Cai, Chin. Chem. Lett., 2023, 8, 108572 CrossRef.
- Y. Liu, Y. Liu and X. Wu, Chin. Chem. Lett., 2023, 34, 107839 CrossRef CAS.
- H. M. Jiang, Y. F. Zhang, L. Xu, Z. M. Gao, J. Q. Zheng, Q. S. Wang, C. G. Meng and J. Wang, Chem. Eng. J., 2020, 382, 122844 CrossRef CAS.
- Y. H. Dai, C. Y. Zhang, J. W. Li, X. Gao, P. Hu, C. M. Ye, H. Z. He, J. X. Zhu, W. Zhang, R. W. Chen, W. Zong, F. Guo, I. P. Parkin, D. J. L. Brett, P. R. Shearing, L. Q. Mai and G. J. He, Adv. Mater., 2024, 2310645 CrossRef PubMed.
- L. Zhang, X. H. Qin, L. Wang, Z. F. Zhao, L. W. Mi and Q. Q. Lu, Front. Chem. Sci. Eng., 2023, 17, 1244–1253 CrossRef CAS.
- Y. Liu, Y. Liu, X. Wu and Y. R. Cho, ACS Appl. Mater. Interfaces, 2022, 14, 11654–11662 CrossRef CAS PubMed.
- S. J. Li, X. Y. Xu, W. X. Chen, J. W. Zhao, K. Wang, J. S. Shen, X. Chen, X. Lu, X. X. Jiao, Y. Y. Liu and Y. Bai, Energy Storage Mater., 2024, 65, 103108 CrossRef.
- M. Zhao, S. L. Li, X. Wu and S. H. Luo, Adv. Mater. Technol., 2024, 9, 2400125 CrossRef.
- C. R. Zhao, Y. Liu, X. Wu and S. H. Luo, Adv. Sustainable Syst., 2024, 8, 2400077 CrossRef.
- Y. Q. Peng, L. Mo, T. T. Wei, Y. F. Wang, X. X. Zhang, Z. Q. Li, Y. Huang, G. Yang and L. H. Hu, Small, 2023, 19, 2306972 Search PubMed.
- K. X. Li, Y. Liu and X. Wu, CrystEngComm, 2022, 24, 5421 RSC.
- H. Tang, F. Y. Chao, H. Y. Luo, K. S. Yu, J. Wang, H. B. Chen, R. M. Jia, F. Y. Xiong, Y. Q. Pi, P. Luo and Q. Y. An, ChemSusChem, 2023, 15, e202300403 CrossRef PubMed.
- X. X. Cai, Y. Zhang, H. H. Cheng, C. F. Liu, Z. W. Wang, H. Ye, Y. L. Pan, D. Z. Jia and H. Lin, Small, 2023, 19, 2304668 CrossRef CAS PubMed.
- Q. F. Li, X. H. Rui, D. Chen, Y. Z. Feng, N. X, L. Y. Gan, Q. Zhang, Y. Yu and S. M. Huang, Nano-Micro Lett., 2020, 12, 67–78 CrossRef CAS PubMed.
- W. Yang, L. B. Dong, W. Yang, C. J. Xu, G. J. Shao and G. X. Wang, Small Methods, 2020, 4, 1900670 CrossRef CAS.
- T. Y. Wei, Y. Y. Liu, G. Z. Yang and C. X. Wang, Energy Storage Mater., 2020, 30, 130–137 CrossRef.
- R. Sun, Z. X. Qin, X. L. Liu, C. H. Wang, S. J. Lu, Y. F. Zhang and H. S. Fan, ACS Sustainable Chem. Eng., 2021, 35, 11769–11777 CrossRef.
- Y. Liu and X. Wu, J. Energy Chem., 2023, 87, 334–341 CrossRef CAS.
- H. Luo, B. Wang, C. L. Wang, F. D. Wu, F. D. Jin, B. W. Cong, Y. Ning, Y. Zhou, D. L. Wang, H. K. Liu and S. X. Dou, Energy Storage Mater., 2020, 33, 390–398 CrossRef.
- G. Z. Yang, T. Y. Wei and C. X. Wang, ACS Appl. Mater. Interfaces, 2018, 10, 35079–35089 CrossRef CAS PubMed.
- Y. Liu, Y. Liu and X. Wu, ACS Sustainable Chem. Eng., 2023, 11, 13298–13305 CrossRef CAS.
- N. Zhang, Y. Dong, M. Jia, X. Bian, Y. Y. Wang, M. D. Qiu, J. Z. Xu, Y. C. Liu, L. F. Jiao and F. Y. Cheng, ACS Energy Lett., 2018, 3, 1366–1372 CrossRef CAS.
- S. Wu, Y. F. Wang, W. L. Liu, M. M. Ren, F. G. Kong, S. J. Wang, X. Q. Wang, H. Zhao and J. M. Bao, Inorg. Chem. Front., 2018, 5, 3067–3073 RSC.
- Y. Liu, Y. Liu, X. Wu and Y. Cho, J. Colloid Interface Sci., 2022, 628, 33–40 CrossRef CAS PubMed.
- W. Zhang, Y. Xiao, C. Zuo, W. Tang, G. Liu, S. Wang, W. Cai, S. Dong and P. Luo, ChemSusChem, 2021, 14, 971 CrossRef CAS PubMed.
| This journal is © The Royal Society of Chemistry 2024 |

