 Open Access Article
Synthesis of urchin-like NiCo2S4 electrode materials based on a two-step hydrothermal method for high-capacitance supercapacitors
Jingyu Tian,
Jingjia Zhang and
Xiaofeng Li *
*
College of Chemical and Chemistry, Harbin Normal University, Harbin 150025, P. R. China
First published on 21st March 2024
Abstract
Transition metal sulfides have been considered as promising electrode materials for future super-capacitors due to their spinel structures and environmentally friendly properties. Among these materials, NiCo2S4 compounds exhibit high theoretical specific capacity but poor cycling performance. To address this issue, we synthesize several NiCo2S4 urchin balls. The NCS-1.5 nanospheres demonstrate a specific capacitance of 1352.2 F g−1 at a current density of 1 A g−1, and maintain high specific capacity after 10![[thin space (1/6-em)]](https://www.rsc.org/images/entities/char_2009.gif) 000 charge–discharge cycles. An asymmetric capacitor assembled with the NCS-1.5 sample as the cathode and activated carbon as the anode achieve an energy density of 45.5 W h kg−1 at 2025 W kg−1. The urchin-like nanospheres also facilitate the combination with other materials, providing potential insights for the synthesis of supercapacitor electrode materials.
000 charge–discharge cycles. An asymmetric capacitor assembled with the NCS-1.5 sample as the cathode and activated carbon as the anode achieve an energy density of 45.5 W h kg−1 at 2025 W kg−1. The urchin-like nanospheres also facilitate the combination with other materials, providing potential insights for the synthesis of supercapacitor electrode materials.
Introduction
Due to the rapid advancement of industry and technology, the demand for energy is steadily increasing. Conventional fossil fuels are finite resources and detrimental to the ecological environment. Hence, it is imperative to devise and create sustainable green energy sources.1–3 There are different types of energy storage devices such as capacitors, supercapacitors, batteries and fuel cells.4–7 Super-capacitors attract much attention from researchers due to their high-power density, and cycle stability.8–10 The current research focus on supercapacitors is on enhancing their energy density while ensuring high-power and cycle stability.11–13 Increasing the specific capacitance and expanding the voltage window are two important methods to enhance energy density.14Currently, the majority of research is concentrated on developing new materials to enhance specific capacitance. Among these, transition metal sulfides exhibit numerous valence states and undergo plentiful redox reactions.15 In particular, ternary transition metal sulfides (such as NiCo2S4,16 FeCo2S4,17 MnCo2S4,18 and ZnCo2S4,19 etc.) have been investigated intensively due to their high theoretical capacitance, low toxicities and costs. Recently, NiCo2S4 with spinel structure have drawn more attention. In AB2S4 spinel structure, sulfur ions as cubic close-packed, where A ions (Ni2+, Co2+) fill in the tetrahedral voids and B ions (Co3+) in the octahedral voids.20,21 In addition, NiCo2S4 materials possess multiple forms to improve ion diffusion. For example, Pu et al. prepare NiCo2S4 nanotube arrays with a specific capacitance of 738 F g−1 at 4 A g−1.22 Hussain S synthesizes zero-dimensional 14-sided (6 squares and 8 rectangles) NiCo2S4 cubic hexa-octahedral (NCS–COH) using a simple hydrothermal route.23 Xie's group use an one-pot method to compose spinel-type NiCo2S4 nanoparticles/carbon nanotubes (CNT).24 Preparation of NiCo2S4 layered nanostructures by microwave-assisted hydrothermal/solvothermal strategy by Li.25
In this study, we utilize a two-step hydrothermal method to fabricate urchin-shaped nanospheres of NiCo2S4. The resulting samples exhibit a specific capacity of 1352 F g−1 at 1 A g−1. Furthermore, the capacitance retention remains at 87.82% after 10![[thin space (1/6-em)]](https://www.rsc.org/images/entities/char_2009.gif) 000 cycles. Assembling an asymmetric capacitor with NCS-1.5 NF as the cathode and activated carbon as the anode resulted in a high energy density of 45.5 W h kg−1 at 2025 W kg−1.
000 cycles. Assembling an asymmetric capacitor with NCS-1.5 NF as the cathode and activated carbon as the anode resulted in a high energy density of 45.5 W h kg−1 at 2025 W kg−1.
Results and discussion
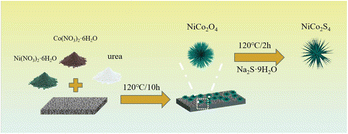
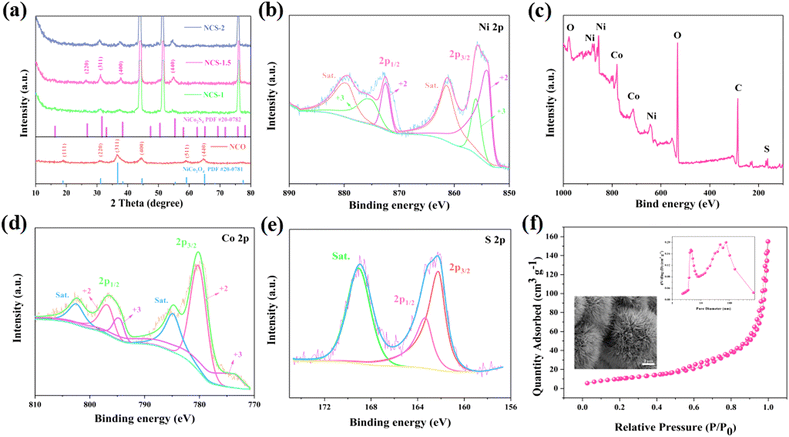
Fig. 1 illustrates NiCo2S4 materials synthesis pathway. NiCo2S4 urchin-like nanospheres are grown on a nickel foam substrate by two-step hydrothermal method. The composition and crystal structure of the four samples are first analyzed by XRD spectroscopy. As shown in Fig. 2a, the diffraction peaks at 18.91, 31.15, 36.70, 44.62, 59.09, and 64.98° correspond to the (111), (220), (311), (400), (511), and (440) crystal planes of NiCo2O4, phase (JCPDS no. 20-0781) respectively. After the addition of Na2S·9H2O, the peaks at 26.83, 31.59, 38.32, and 55.33° correspond to the (220), (311), (400), and (440) crystal planes of the NiCo2S4 respectively. The XRD spectra of the samples do not change for different Na2S·9H2O contents. It illustrates that impurities are also not generated in the product.We use XPS to recognize the surface elemental composition and valence of NiCo2S4 samples. Fig. 2b presents the survey spectra of NiCo2S4 materials. The peaks correspond to the Ni, Co, S, and O elements. Elemental O come from CO2 absorbed in the air or from a small amount of oxidation of the sample.26 The Ni 2p and Co 2p of XPS spectra be well fitted with two spin–orbit doublets and two shakeup satellites (marked as “Sat.”). As shown in Fig. 2c, the peaks at 855.7 and 872.4 eV correspond to Ni 2p3/2 and Ni 2p1/2, respectively. The difference of binding energy between Ni 2p3/2 and Ni 2p1/2 is 16.7 eV, indicating the coexistence of Ni2+ and Ni3+.27 Fig. 2d, depicts the Co 2p XPS spectrum. The peaks at 779.3 and 795.6 eV are related to Co 2p3/2 and Co 2p1/2, respectively, suggesting the coexistence of Co2+ and Co3+.28 The S 2p spectrum (Fig. 2e) is divided into two main peaks and one shake-up satellite. The component at 163.4 eV is typical of metal–sulfur bonds,29 while the peak at 162.2 eV can be attributed to the sulfur ion in low coordination at the surface. The XPS spectra closely match the theoretical composition of the NiCo2S4 material. Fig. 2f shows the nitrogen adsorption desorption isotherm of the NCS-1.5 sample. The inset presents the pore size distribution and SEM image of NCS materials. The specific surface area of NCS samples is 35.311 m2 g−1. The samples show an urchin-like distribution. The large specific surface area and the porous structure increase the contact area with the electrolyte, which accelerates the ion transport.30
Then we use scanning electron microscopy (SEM) to observe the sample morphology. Fig. 3a and e present that the NCO samples are composed of nano-needles arrange closely in rows and the surface of the nano-needles is smooth. As shown in Fig. 3b and f, after vulcanization with 1.5 mmol Na2S·9H2O, the surface of NCS-1.5 nano pins become rough compared to NCO nano pins. This is attributed to the substitution of oxygen by sulfur during recrystallisation during vulcanization, resulting in the formation of nanocrystalline particles.19 This configuration reveals empty spaces and creates a permeable framework. It enhances the interaction area with the electrolyte and eases ion transportation.31 Transitional vulcanization changes the morphology of the samples in Fig. 3d and h. The transformation of nano-needles into nanosheets and subsequent layer stacking results in suboptimal electrochemical performance.32 The element mappings (Fig. 3i–l) also indicate that the composite material consists of S, Co, Ni.
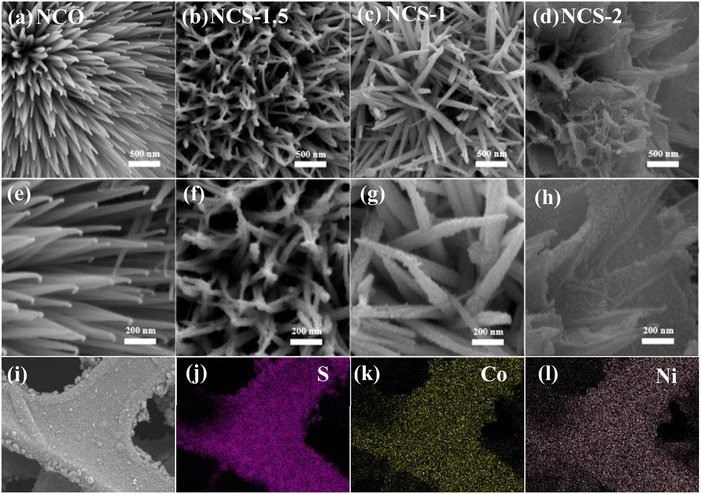 | ||
| Fig. 3 Morphology characterization (a–d) low-magnification SEM images (e–h) high-magnification SEM images (i–l) element mappings. SEM, scanning electron microscope. | ||
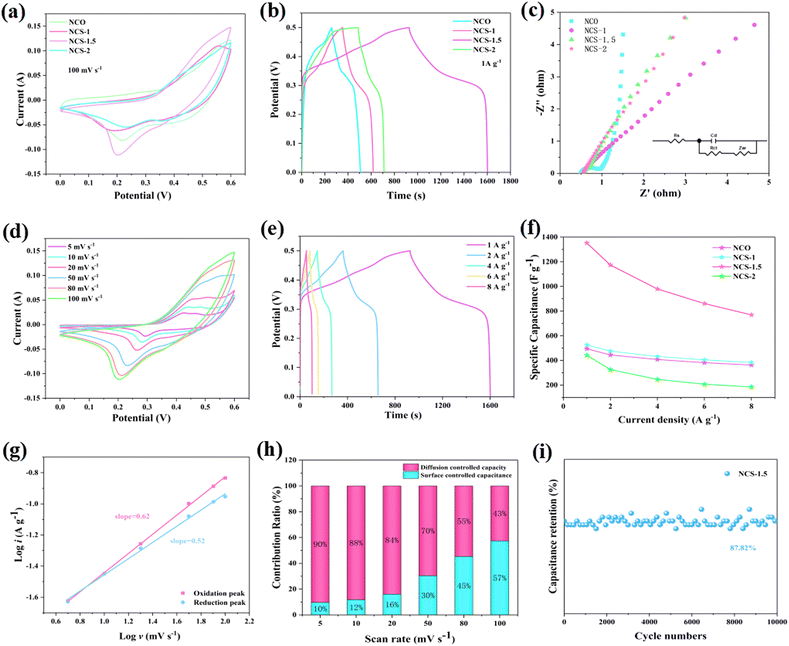
The electrochemical performances of the samples are evaluated using a three-electrode system in 3 M KOH electrolyte. Fig. 4a presents the CV curves of the electrodes at 100 mV s−1. Clearly, NCS-1.5 material shows higher peak current density and larger closed CV curve area. Suggesting that the NCS-1.5 electrode has larger charge storage capacity.33 In Fig. 4d, distinct redox peaks appear at different scanning speeds. These distinct peaks can be attributed to the reversible faradaic redox processes of Co2+/Co3+/Co4+ and Ni2+/Ni3+ based on the following reactions:11
| CoS + OH− ⇄ CoSOH + e− | (1) |
| CoSOH + OH− ⇄ CoSO + H2O + e− | (2) |
| NiS + OH− ⇄ NiSOH + e− | (3) |
In addition, the first pair of redox peaks in CV curves is related to faradaic reactions of NiCo2S4 to form NiSOH and CoSOH. Whereas, the second pair of peaks is due to the redox reaction between CoSOH and CoSO.34
According to the GCD curve (Fig. 4b) of current density at 1 A g−1, the NCS-1.5 sample has the longest charge–discharge time of 1600 s. It is proved that NCS-1.5 material has the largest specific capacitance. Fig. 4e presents the GCD curves of NCS-1.5 product at the current density range of 1–8 A g−1. The non-triangular shapes with obvious plateaus further confirm the battery-like behavior of the electrodes. And no significant iR drop is observed at low current densities, indicating that the NCS-1.5 electrode has good conductivity.33,35
EIS is also an important parameter to determine the electrochemical properties of the electrode material in Fig. 4c. RS represents the internal resistance between the electrolyte and the electrode. The RS values for NCO, NCS-1, NCS-1.5, and NCS-2 are 0.52 Ω, 0.59 Ω, 0.56 Ω, 0.60 Ω, respectively. Rct is the charge transfer resistance. In the high-frequency region, the NCO sample possesses a complete semicircle, indicating a large charge transfer resistance. W refers to the ion diffusion resistance, in the low-frequency region, the NCS-1.5 sample possesses a large slope proving its strong ionic diffusion. Fig. 4f shows the specific capacitance of the sample at different current densities. The specific capacitance of NCS-1.5 electrode is 1352.2 F g−1 at a current density of 1 A g−1, which is superior to other samples. The capacitive behavior of the sample during charging and discharging can be obtained according to the following equation:
| I = avb | (4) |
| i(v) = k1v + k2v1/2 | (5) |
The values of k1 and k2 in the equation can be calculated by CV curves. In addition, the cycling performance of the sample is critical. As shown in Fig. 4i the retention rate of NCS-1.5 samples after 10![[thin space (1/6-em)]](https://www.rsc.org/images/entities/char_2009.gif) 000 charge–discharge cycles still reach 87.82%. It reflects the outstanding cycling performance of the sample.
000 charge–discharge cycles still reach 87.82%. It reflects the outstanding cycling performance of the sample.
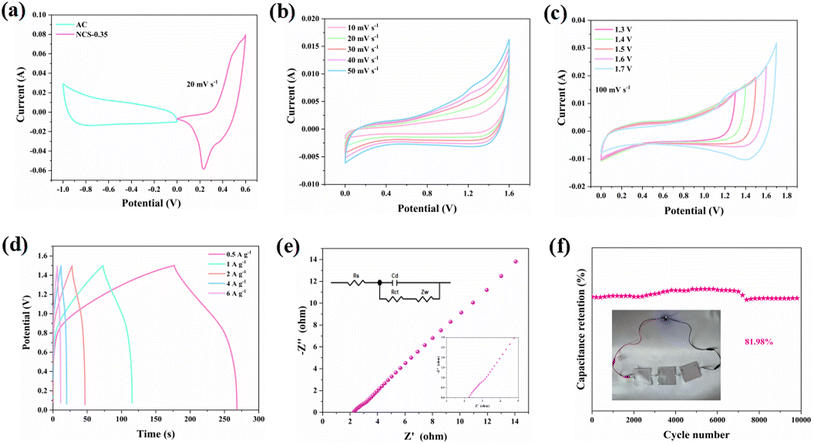
To investigate the application of the samples, we assemble a hybrid capacitor using an NCS-1.5 electrode as the cathode and an AC as the anode. The CV window of activated carbon is 0–1. Fig. 5a shows that the device reaches 1.6 V at a scanning rate of 20 mv s−1. The CV curves remain rectangular shape at the different scan rates and different voltage windows in Fig. 5b and c. It indicates a high electrochemical stability and capacitance.38 The device is discharged for 91 s at a current density of 0.5 A g−1 (Fig. 5d). From the EIS, the RS value of the device is 2.36 Ω (Fig. 5e). As shown in Fig. 5f, the capacitance retention of NCS-1.5//AC is 81.98% after 10![[thin space (1/6-em)]](https://www.rsc.org/images/entities/char_2009.gif) 000 cycles of charging and discharging. It demonstrates the desirable cycling stability and application of the device. At the same time, LED bulb is successfully lit via the three devices in series (inset of Fig. 5f). The energy density of NCS-1.5//AC at 2025 W kg−1 is calculated to be 45.5 W h kg−1, which is higher than that of the previously reported devices as shown in Table 1.
000 cycles of charging and discharging. It demonstrates the desirable cycling stability and application of the device. At the same time, LED bulb is successfully lit via the three devices in series (inset of Fig. 5f). The energy density of NCS-1.5//AC at 2025 W kg−1 is calculated to be 45.5 W h kg−1, which is higher than that of the previously reported devices as shown in Table 1.
| Electrode materials | Specific capacity | Cyclic performance | Energy density | Power density | Ref. |
|---|---|---|---|---|---|
| NCS/NF//N-RGONS/NF | 987.2 C g−1 (2 A g−1) | 83.9% (8000 times after) | 67.5 | 850 | 39 |
| Ni–Co–S/NF//AC | 1406.9 F g−1 (0.5 A g−1) | 88.6% (1000 times after) | 24.8 | 849.5 | 40 |
| NiCo2S4@NiO//AC | 12.2 F cm−2 (1 mA cm−2) | 88.8% (10![[thin space (1/6-em)]](https://www.rsc.org/images/entities/char_2009.gif) 000 times after) 000 times after) |
30.38 | 288 | 41 |
| NiCo2S4@NiS//AC | 1314 C g−1 (1 A g−1) | 96.2% (5000 times after) | 62.4 | 800 | 42 |
| NiCo2S4/NCF//OMC/NCF | 1231 F g−1 (2 A g−1) | 90.4% (2000 times after) | 45.5 | 512 | 43 |
| NiCo2S4//AC | 1352.2 F g−1 (1 A g−1) | 87.82% (10![[thin space (1/6-em)]](https://www.rsc.org/images/entities/char_2009.gif) 000 times after) 000 times after) |
45.5 | 2025 | This work |
Experimental section
All the reagents utilized in the experiment are of analytical purity. Prior to the synthesis of the material, a 3 × 4 cm2 piece of nickel foam was subjected to repeated washings with ethanol and deionized water. Then, 2 mmol of Ni(NO3)2·6H2O, 2 mmol of Co(NO3)2·6H2O, 9 mmol of urea were dissolved into 60 mL of deionized water and stirred for 30 min. Next, the pre-treated nickel foam and the aforementioned solution were transferred into a 100 mL PTFE lined autoclave and maintained at 120 °C for 10 hours. After being cooled to room temperature, the nickel foam was rinsed several times with deionized water and ethanol, and then subjected to a heat treatment at 350 °C for 2 hours. Finally, 1.5 mmol of Na2S·9H2O with 60 mL of deionized water and the above precursors was put into an autoclave at 120 °C for 2 h. The nickel foam washed several times and dried for 4 h, named NCS-1.5. The average mass loading was 1.3 mg cm−2. For comparison, without Na2S·9H2O, with 1 mmol of Na2S·9H2O, and with 2 mmol of Na2S·9H2O were synthesized in the above pathways and named NCO, NCS-1, and NCS-2. The whole formation process is given in the following equation:| Ni2+ + 2Co2+ + 6OH− → NiCo2(OH)6 | (6) |
| NiCo2(OH)6 + 1/2O2 → NiCo2O4 + 3H2O | (7) |
| NiCo2O4 + S2− → NiCo2S4 + O2− | (8) |
The samples were initially analysed for composition using a powder X-ray diffraction analyser (XRD, Shimadzu-7000). We observed the morphology and microstructure of the samples using a scanning electron microscope (SEM, Gemini 300-71-31). The elemental and valence states of the samples were analysed by X-ray photoelectron spectroscopy (XPS, Thermo Scientific K-Alpha). Finally, we used Bruner–Emmett–Taylor (BET) to calculate the specific surface area and pore size of the samples.
The electrochemical experiments of the samples were performed using an electrochemical workstation (Shanghai Chenhua, CHI660E). The prepared materials were used as the working electrode, Hg/HgO as the reference electrode and Pt foil as the counter electrode. Several devices were assembled to further explore the practicality of the samples. NCS-1.5 samples were used as the positive electrodes, AC as the negative electrode, and PVA/KOH gel as electrolyte. The mass ratio of activated carbon, carbon black and polyvinylidene fluoride (PVDF) was 7![[thin space (1/6-em)]](https://www.rsc.org/images/entities/char_2009.gif) :
:![[thin space (1/6-em)]](https://www.rsc.org/images/entities/char_2009.gif) 2
2![[thin space (1/6-em)]](https://www.rsc.org/images/entities/char_2009.gif) :
:![[thin space (1/6-em)]](https://www.rsc.org/images/entities/char_2009.gif) 1. N-Methyl-2-pyrrolidone was then added dropwise until a homogeneous slurry was obtained. It was coated on nickel foam and dried. According to the charge balance principle of an electrode material (q+ = q−), the following formulas are abided by:44
1. N-Methyl-2-pyrrolidone was then added dropwise until a homogeneous slurry was obtained. It was coated on nickel foam and dried. According to the charge balance principle of an electrode material (q+ = q−), the following formulas are abided by:44
| Q = It = CmΔV | (9) |
| m+/m− = Cm−(ΔV)−/Cm+(ΔV)+ | (10) |
| E = 1/2CV2 | (11) |
| P = 3600E/t | (12) |
Conclusions
In summary, four samples are obtained by controlling the amount of Na2S·9H2O. The best electrochemical performance is obtained with the addition of 1.5 mmol Na2S·9H2O. The synthesized samples demonstrate a specific capacity of 1352 F g−1 at a current density of 1 A g−1. The capacitance retention remained at 87.82% after 10![[thin space (1/6-em)]](https://www.rsc.org/images/entities/char_2009.gif) 000 cycles. The samples form urchin structures after vulcanization, which increase the contact area with the electrolyte. It also promotes the occurrence of redox reactions and ion transport. The NiCo2S4//AC ASC device provides high energy density at a power density of 2025 W kg−1. These results demonstrate a potential application of NiCo2S4 sample in energy storage fields and provide a reasonable design approach for highly-efficient electrode material.
000 cycles. The samples form urchin structures after vulcanization, which increase the contact area with the electrolyte. It also promotes the occurrence of redox reactions and ion transport. The NiCo2S4//AC ASC device provides high energy density at a power density of 2025 W kg−1. These results demonstrate a potential application of NiCo2S4 sample in energy storage fields and provide a reasonable design approach for highly-efficient electrode material.
Conflicts of interest
The authors declare no conflict of interest.Acknowledgements
The project was supported by Basic Scientific Research for Universities of Heilongjiang Province (2021-KYYWF-0183).Notes and references
- Y. Liu, Y. Liu, X. Wu and Y. R. Cho, J. Colloid Interface Sci., 2022, 628, 33–40 CrossRef CAS PubMed.
- Y. Liu, Y. Liu and X. Wu, Chin. Chem. Lett., 2023, 34, 107839 CrossRef CAS.
- X. L. Jian, H. B. Li, H. Li, Y. X. Li and Y. Y. Shang, Carbon, 2021, 172, 132–137 CrossRef CAS.
- Z. S. Iro, C. Subramani, J. Rajendran and A. K. Sundramoorthy, Carbon Lett., 2021, 31, 1145–1153 CrossRef.
- S. Chen, J. W. Zhu, X. D. Wu, Q. F. Han and X. Wang, ACS Nano, 2010, 4, 2822–2830 CrossRef CAS PubMed.
- Poonam, K. Sharma, A. Arora and S. K. Tripathi, J. Energy Storage, 2019, 21, 801–825 CrossRef.
- Y. Liu, D. Yan, Y. H. Li, Z. G. Wu, R. F. Zhuo, S. K. Li, J. J. Feng, J. Wang, P. X. Yan and Z. R. Geng, Electrochim. Acta, 2014, 117, 528–533 CrossRef CAS.
- X. J. Sun, D. D. Zhang, A. Umar and X. Wu, ACS Appl. Energy Mater., 2023, 6, 9594–9601 CrossRef CAS.
- H. Q. Liu, M. Z. Dai, D. P. Zhao, X. Wu and B. Wang, ACS Appl. Energy Mater., 2020, 3, 7004–7010 CrossRef CAS.
- M. Z. Dai, H. Q. Liu, D. P. Zhao, X. F. Zhu, X. Wu and B. Wang, ACS Appl. Energy Mater., 2021, 4, 2637–2643 CrossRef CAS.
- L. F. Shen, J. Wang, G. Y. Xu, H. S. Li, H. Dou and X. G. Zhang, Adv. Energy Mater., 2015, 5, 1400977 CrossRef.
- P. Simon and Y. Gogotsi, Nat. Mater., 2008, 7, 845–854 CrossRef CAS PubMed.
- Z. J. Fan, J. Yan, T. Wei, L. J. Zhi, G. Q. Ning, T. Y. Li and F. Wei, Adv. Funct. Mater., 2011, 21, 2366–2375 CrossRef CAS.
- F. Zhao, D. H. Zheng, Y. Liu, F. D. Pan, Q. B. Deng, C. L. Qin, Y. Y. Li and Z. F. Wang, Chem. Eng. J., 2021, 415, 128871 CrossRef CAS.
- S. Hasan, A. H. Reaz, S. Das, C. K. Roy and M. A. Basith, J. Mater. Chem. C, 2022, 10, 7980–7996 RSC.
- J. L. Xie, Y. F. Yang, G. Li, H. C. Xia, P. J. Wang, P. H. Sun, X. L. Li, H. R. Cai and J. Xiong, RSC Adv., 2019, 9, 3041–3049 RSC.
- D. P. Zhao, M. Z. Dai, Y. Zhao, H. Q. Liu, Y. Liu and X. Wu, Nano Energy, 2020, 72, 104715 CrossRef CAS.
- A. M. Elshahawy, X. Li, H. Zhang, Y. T. Hu, K. H. Ho, C. Guan and J. Wang, J. Mater. Chem. A, 2017, 5, 7494–7506 RSC.
- G. T. Xiang, J. M. Yin, G. M. Qu, P. X. Sun, P. Y. Hou, J. Z. Huang and X. J. Xu, Inorg. Chem. Front., 2019, 6, 2135–2141 RSC.
- X. J. Chen, D. Chen, X. Y. Guo, R. M. Wang and H. Z. Zhang, ACS Appl. Mater. Interfaces, 2017, 9, 18774–18781 CrossRef CAS PubMed.
- Z. B. Wu, X. L. Pu, X. B. Ji, Y. R. Zhu, M. J. Jing, Q. Y. Chen and F. P. Jiao, Electrochim. Acta, 2015, 174, 238–245 CrossRef CAS.
- J. Pu, T. T. Wang, H. Y. Wang, Y. Tong, C. C. Lu, W. Kong and Z. H. Wang, ChemPlusChem, 2014, 79, 577–583 CrossRef CAS PubMed.
- S. Hussain, T. M. Liu, N. Aslam, Y. Y. Zhang and S. Q. Zhang, Mater. Lett., 2017, 189, 21–24 CrossRef CAS.
- H. Zhang, C. Y. Sun and X. W. Xie, Electrochim. Acta, 2023, 466, 143057 CrossRef CAS.
- Y. H. Li, H. Liu, J. Xu, Y. Y. Liu, M. R. Wang, J. Li and H. T. Cui, J. Mater. Chem. A, 2018, 6, 19788–19797 RSC.
- M. L. Yan, Y. D. Yao, J. Q. Wen, L. Long, M. L. Kong, G. G. Zhang, X. M. Liao, G. F. Yin and Z. B. Huang, ACS Appl. Mater. Interfaces, 2016, 8, 24525–24535 CrossRef CAS PubMed.
- F. Zhu, H. Xia and T. Feng, Mater. Technol., 2015, 30, A53–A57 CrossRef CAS.
- Y. X. Wen, S. L. Peng, Z. L. Wang, J. X. Hao, T. F. Qin, S. Q. Lu, J. C. Zhang, D. Y. He, X. Y. Fan and G. Z. Cao, J. Mater. Chem. A, 2017, 5, 7144–7152 RSC.
- H. C. Chen, J. J. Jiang, L. Zhang, H. Z. Wan, T. Qi and D. D. Xia, Nanoscale, 2013, 5, 8879–8883 RSC.
- J. X. Liu, S. Q. Zhao, A. Umar and X. Wu, Mater. Today Sustain., 2023, 23, 100433 CrossRef.
- T. S. Li, Z. F. Zhao, Z. H. Su, S. Y. Lin, R. Sun and Y. C. Shang, Dalton Trans., 2023, 52, 6823–6830 RSC.
- X. Y. Huai, J. X. Liu and X. Wu, CrystEngComm, 2023, 25, 5310–5315 RSC.
- K. Tao, Y. J. Yang, C. Yang, Q. X. Ma and L. Han, Dalton Trans., 2019, 48, 14156–14163 RSC.
- L. Yu, L. Zhang, H. B. Wu and X. W. Lou, Angew. Chem., Int. Ed., 2014, 126, 3785–3788 CrossRef.
- Y. L. Xiao, Y. Lei, B. Z. Zheng, L. Gu, Y. Y. Wang and D. Xiao, RSC Adv., 2015, 5, 21604–21613 RSC.
- X. Y. Liu, M. D. Wang, A. Umar and X. Wu, Dalton Trans., 2023, 52, 10457–10464 RSC.
- X. Y. Liu, M. D. Wang and X. Wu, Molecules, 2022, 27, 7344 CrossRef CAS PubMed.
- T. Chen, L. B. Qiu, Z. B. Yang, Z. B. Cai, J. Ren, H. P. Li, H. J. Lin, X. M. Sun and H. S. Peng, Angew. Chem., Int. Ed., 2012, 51, 11977–11980 CrossRef CAS PubMed.
- W. Y. Chen, X. M. Zhang, L. E. Mo, Y. S. Zhang, S. H. Chen, X. X. Zhang and L. H. Hu, Chem. Eng. J., 2020, 388, 124109 CrossRef CAS.
- T. Tao, X. Han, Q. X. Ma and L. Han, Dalton Trans., 2018, 47, 3496–3502 RSC.
- Y. Y. Huang, T. L. Shi, S. L. Jiang, S. Y. Cheng, X. X. Tao, Y. Zhong, G. L. Liao and Z. R. Tang, Sci. Rep., 2016, 6, 38620 CrossRef CAS PubMed.
- G. M. Qu, C. L. Li, P. Y. Hou, G. Zhao, X. Wang, X. L. Zhang and X. J. Xu, Nanoscale, 2020, 12, 4686–4694 RSC.
- L. F. Shen, J. Wang, G. Y. Xu, H. S. Li, H. Dou and X. G. Zhang, Adv. Energy Mater., 2015, 5, 1400977 CrossRef.
- X. H. Lu, M. H. Yu, T. Zhai, G. M. Wang, S. L. Xie, T. Y. Liu, C. L. Liang, Y. X. Tong and Y. Li, Nano Lett., 2013, 13, 2628–2633 CrossRef CAS PubMed.
- J. Rajendran, A. N. Reshetilov and A. K. Sundramoorthy, RSC Adv., 2021, 11, 3445–3451 RSC.
| This journal is © The Royal Society of Chemistry 2024 |

