 Open Access Article
Investigating the influence of Cu and Ti substitution on the structural, optical, and dielectric properties of BiFeO3
A. Ouertania,
Z. Abdelkafi *a,
H. Khemakhema and
N. Randrianantoandrob
aLaboratory of Multifunctional Materials and Applications (LaMMA), LR16ES18, Faculty of Sciences of Sfax, University of Sfax, B.P. 1171, Sfax, 3000, Tunisia. E-mail: zied_abdelkafi@yahoo.fr
bInstitut des Molécules et Matériaux du Mans – UMR 6283, CNRS – Le Mans Université, Avenue Olivier Messaien, Le Mans, 72085, France
First published on 29th April 2024
Abstract
The environmentally friendly BiFe1−x(Ti1/2Cu1/2)xO3 system with various substitution rates, including x = 0 (BFO), x = 0.02 (BFTCO2) and x = 0.04 (BFTCO4), has been synthesized using the solid-state reaction technique. All compositions exhibited a distorted rhombohedral structure with R3c space, as observed from the results of XRD and Raman spectroscopy. A significant impurity phase (Bi25FeO40) appears in pure and doped BFO, with a percentage ranging between 6 and 9%. This impurity was also detected using Mössbauer spectroscopy. UV-vis spectroscopy revealed a decrease in optical band energy with the substitution, suggesting the potential applications of doped BFO within the visible range of the spectrum, making it suitable for photocatalytic and solar cell applications. The smallest bandgap was observed for BFTCO2 with Eg = 1.93 eV. The origin of this reduction is discussed from a scientific point of view. Furthermore, Cu2+ and Ti4+ co-doped BFO display an improvement in dielectric properties due to the reduction in the value of tan δ. Dielectric measurements revealed an anomaly below TN with diffusive and dispersive behavior, suggesting a relaxor-like behavior for all compositions. The relaxor character was quantified by using the Vogel–Fulcher relationship which yielded activation energy of 0.359–0.614 eV. In our system, the relaxor behavior showed an enhancement with the heterogeneity created by the substitution rate, reaching its maximum for BFTCO4, characterized by the empirical parameters which are: ΔTrelax = 96 K and γ = 1.96. Finally, co-doped BFO ceramics not only present promising materials for optical applications due to the narrow bandgap, but their relaxor behavior can also be tailored for promising applications in high-energy storage devices.
1. Introduction
Materials that exhibit the coexistence of ferroic orders, including ferroelectric and (anti)ferromagnetic properties, are referred to as multiferroics. These materials hold promise for diverse device applications like memory, microelectronics and spintronics.1,2 In this respect, BiFeO3 (BFO), the most well-known multiferroic, is one of the rare materials that exhibit the coexistence of antiferromagnetic and ferroelectric orders at room temperature (RT). BFO boasts a high Curie temperature (TC = 1103 K) and a high Néel temperature (TN = 643 K).3,4 In its bulk form, the crystal structure stabilizes in a rhombohedral configuration with the R3c space group. Ferroelectricity arises from the distortion induced by stereochemically active 6s2 lone pair electrons of Bi3+, while the indirect magnetic exchange interaction between Fe3+ ions through O2− causes G-type antiferromagnetic ordering. This ordering is superimposed with a space-modulated spiral structure of an incommensurate wavelength of 62 nm.5 However, this structure is responsible for the suppression of weak ferromagnetism and the linear magneto-electric (M-E) effect.6 Additionally, synthesizing a single-phase BFO is a challenging task due to several factors such as oxygen vacancies, mixed valence states of Fe ions, and impurity phases like Bi25FeO40, which enhance electrical conductivity, posing a serious drawback for device applications.7 To mitigate these issues and reduce leakage currents, various attempts have been made, including adopting different processing techniques,8–10 substituting elements at the Bi/Fe site,10,11 and fabricating composites.12On the other hand, BFO stands out as a promising lead-free ferroelectric material, owing to its exceptional intrinsic polarization exceeding 100 μC cm−2.13 Generally, polarization can remain stable across various temperatures in relaxors due to their diffuse phase transition behavior near dielectric maxima. This behavior holds a significant promise in several applications such as sensors, capacitors, actuators, piezoelectric transducers and notably in dielectric energy storage applications.14–16 Doping at site A or B emerges as an effective strategy to achieve a more diffuse transition phase by modifying the short-range ordering nature due to the difference in size and charge between host and dopant elements.17,18
Furthermore, BFO has recently gained significant attention for its potential application in photolysis and photocatalytic activity due to its smaller bandgap (ranging between 1.9 eV and 2.8 eV at RT19–22) in comparison to other ferroelectric oxides like BaTiO3, LiNbO3, and PbZrTiO3 (with a bandgap of Eg > 3 eV). Therefore, reducing the bandgap further becomes essential for enhanced absorption of the larger part of the sunlight spectrum, particularly in the visible range. Substitution is a potential approach to further reduce this gap as observed in Ti-doped BFO,23,24 (Cu, Zr) co-doped BFO25 and (Zr, Zn) co-doped BFO.26
Several studies suggest that doping with 4+ ions is anticipated to decrease the formation of oxygen vacancies, while the introduction of 2+ ions is expected to hinder the creation of Fe2+ ions.27 In this context, various researchers have reported that the substitution of Fe3+ sites with Ti4+ and Zr4+ contributes to enhancing the multiferroic properties of BFO.28,29 Conversely, substituting Fe3+ with Ti4+ has been found to improve the electrical properties of BFO.24 Moreover, the incorporation of 2+ ions, such as Cu2+, into BFO thin films has exhibited a noteworthy reduction in leakage current and an enhancement in ferroelectric properties.30
Motivated by these findings, we investigated the effects of co-substituting Cu2+ and Ti4+ at the Fe3+ site in bulk BFO to enhance various physical properties and tailor its multifunctional performances across multiple application domains. Thus, we explored the crystal structure, vibrational and optical properties, as well as the dielectric behavior of the BiFe1−x(Ti1/2Cu1/2)xO3 system (where x = 0, 0.02, and 0.04, referred to respectively as BFO, BFTCO2, and BFTCO4). This compositional series was synthesized by the conventional solid-state reaction. Additionally, 57Fe Mössbauer spectroscopy was employed as a complementary method to delve deeper into the material's characteristics.
2. Experimental details
The synthesis of polycrystalline samples derived from the BiFe1−x(Ti1/2Cu1/2)xO3 system was carried out using the standard solid-state reaction method. The substitution rates of interest in this study are x = 0.00, x = 0.02 and x = 0.04. High-purity Bi2O3, Fe2O3, CuO and TiO2 oxides (Aldrich 99.9%) were accurately weighed in stoichiometric ratios using the chemical reaction equation:The powder was thoroughly ground in an agate mortar for 2 hours to achieve a homogeneous mixture. Subsequently, the resulting powder was further mixed and ground for an additional 2 hours. Following this, the milled powder was pressed into pellets with a diameter of 13 mm and a thickness of 10 mm under uniaxial compaction with a load of 100 MPa for 5 minutes at RT. The pellet underwent an initial calcination at 600 °C for 2 hours. After this, the calcined pellet was ground again for 2 hours before undergoing a second calcination at 700 °C for 2 hours to achieve the desired phase formation. Following this stage, the obtained powder was ground for an additional 2 hours and pressed under 100 MPa into disks with a diameter of 8 mm and a thickness of about 1 mm. Finally, the pellets were sintered in the air using a high heating rate (250 K h−1) at 880 °C for 2 hours, followed by furnace cooling at a rate of 300 K h−1.
The phase purity of the synthesized samples was evaluated using an EMPYREAN X-ray diffractometer equipped with CuKα radiation (λ = 1.5405 Å, 45 kV and 30 mA) in the range of 10° ≤ 2θ ≤ 80°. Raman spectra of the sintered samples were obtained at room temperature using the LabRam HR800 from Horiba Jobin-Yvon equipped with a diode laser emitting a red line (λ = 633 nm). UV-visible diffuse reflectance spectra of the powder samples were measured using a Thermo Scientific spectrometer model Evolution 220 (Thermo Scientific Co., Ltd., Waltham, MA, USA). Impedance measurements were carried out on gold-coated pellets using a Broadband Dielectric spectrometer. For Mössbauer spectroscopy, 57Fe spectra were recorded under RT conditions using a constant acceleration spectrometer and a 57Co source diffused within a rhodium matrix. Subsequent examination of the Mössbauer data was conducted through the MOSFIT software, a specialized Lorentzian line fitting program.31
3. Results and discussion
3.1. Structural characterization
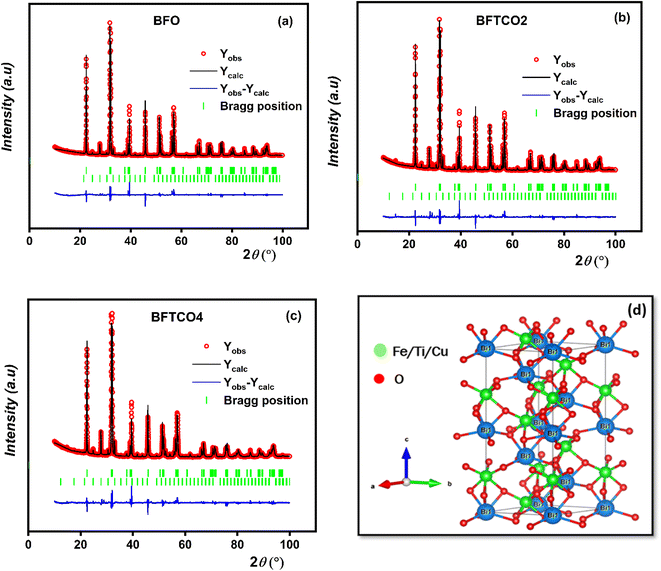
To investigate the influence of (Ti, Cu) co-doping on the crystal structure of BFO, X-ray diffraction (XRD) measurements were performed at RT.Fig. 1a displays the XRD patterns of BFO, BFTCO2, and BFTCO4 samples. From this figure, the observed high-intensity peaks suggest the phase purity and good crystalline nature of all the prepared ceramics. However, traces of a secondary phase selenite-type Bi25FeO40 were observed in both undoped and doped samples, which is a common occurrence during the solid-state synthesis of BFO-based materials, as reported in various studies.5,32,33 Here, the detected diffraction peaks were identified with the R3c space group of a rhombohedral structure.34 Furthermore, a close inspection of the patterns reveals a displacement of the peak (012) position towards lower 2θ values with an increase in Cu2+ and Ti4+ content (Fig. 1b). Presumably, this displacement can be attributed to the increase in lattice parameters. To further examine the X-ray diffraction data, Rietveld refinement of the patterns of BFO, BFTCO2, and BFTCO4 was performed using the FullProf program35 to provide detailed crystal structure parameters. Here, two-phase refinements were employed to identify the amounts of the BFO phase and the Bi25FeO40 phase impurity in all prepared samples. The integrated intensity of the peaks was analyzed as a function of structural parameters using the Marquardt least-squares method to minimize differences between simulated and observed patterns. The background assessment employed the method of direct inclusion among selected background points and the minimization was performed based on parameters like Rwp, Rp, Rexp and χ2.36 The profile fitting technique was adjusted according to the limit of the χ2 function.
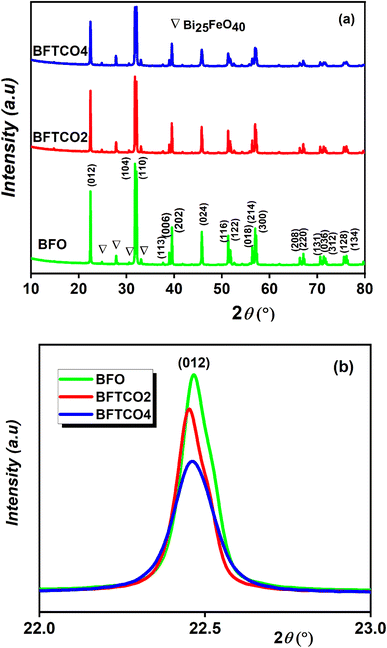 | ||
| Fig. 1 XRD patterns (a) and magnified view of (012) diffraction peak (b) of BFO, BFTCO2 and BFTCO4 samples. | ||
Fig. 2a–c illustrate the results of refinement, including the observed, calculated and difference-refined XRD patterns for BFO, BFTCO2, and BFTCO4 respectively. The important structural parameters, such as atomic positions, lattice parameters, bond lengths and bond angles derived from the Rietveld analysis are summarized in Table 1. As an example, we present in Fig. 2d the crystal structure of BFTCO2 generated by refined ionic positions obtained from Rietveld refinement using Vesta software.
| Sample | Space group | Cell (Å) | Atom | x | y | z | Percentage (%) | Bi–O (Å) | Fe–O1 (Å) | Fe–O2 (Å) | Fe–O–Fe (°) | R-Factors |
|---|---|---|---|---|---|---|---|---|---|---|---|---|
| BFO | R3C | a = b = 5.5795 | Bi(6a) | 0 | 0 | 0 | 93.16 | 2.331 | 1.915 | 2.144 | 155.26 | Rp: 3.24 |
| c = 13.8710 | Fe(6a) | 0 | 0 | 0.2210 | Rwp: 4.60 | |||||||
| V = 373.973 | O(18b) | 0.4352 | 0.0059 | 0.9537 | Rexp: 3.41 | |||||||
| X2: 1.83 | ||||||||||||
| Bi25FeO40 | I23 | V = 1045.713 | 6.84 | |||||||||
| BFTCO2 | R3C | a = b = 5.5800 | Bi(6a) | 0 | 0 | 0 | 90.86 | 2.278 | 1.962 | 2.088 | 156.6 | Rp: 2.85 |
| c = 13.8720 | Fe/Ti/Cu(6a) | 0 | 0 | 0.2203 | Rwp: 4.31 | |||||||
| V = 374.066 | O(18b) | 0.4504 | 0.0187 | 0.9533 | Rexp: 3.61 | |||||||
| X2: 1.43 | ||||||||||||
| Bi25FeO40 | I23 | V = 1046.038 | 9.14 | |||||||||
| BFTCO4 | R3C | a = b = 5.5807 | Bi(6a) | 0 | 0 | 0 | 90.63 | 2.320 | 1.895 | 2.147 | 157.7 | Rp: 3.00 |
| c = 13.8715 | Fe/Ti/Cu(6a) | 0 | 0 | 0.2218 | Rwp: 4.44 | |||||||
| V = 374.146 | O(18b) | 0.4457 | 0.0055 | 0.9532 | Rexp: 3.68 | |||||||
| X2: 1.46 | ||||||||||||
| Bi25FeO40 | I23 | V = 1048.822 | 9.37 |
In comparison to BFO, the co-substitution was found to lead to an expansion of lattice parameters in the rhombohedral phase, consequently elevating the unit cell volume as previously observed. This augmentation can be elucidated by considering the effective ionic radii of the dopants Ti4+ (0.745 Å) and Cu2+ (0.87 Å), which are notably larger than the host ionic radius of Fe3+ (0.69 Å). Moreover, the increase in ionic radii of the co-dopants contributes to an augmentation in the Fe–O–Fe bond angle and induces buckling. The same deduction was observed in cobalt doping BFO nanoparticles.37 The anticipated impact of this discovery on the magnetic characteristics of the compound was significant, as the Fe–O–Fe bond angle plays a crucial role in both superexchange and Dzyaloshinskii–Moriya (DM) interactions.38,39
XRD patterns are further utilized to determine the average crystallite size (D) and microstrain (ε) for BFO, BFTCO2, and BFTCO4 samples. D has been calculated using the Debye–Scherrer equation, described as follows:40
 | (1) |
| Samples | BFO | BFTCO2 | BFTCO4 |
|---|---|---|---|
| Crystallite size (nm) | 63.1 | 62.3 | 50.2 |
| Microstrain ε (10−3) | 2.08 | 2.11 | 2.62 |
| Bandgap (eV) | 2.03 | 1.93 | 2 |
In this work, we aimed at the calculation of microstrain (ε) using the following relationship:42
 | (2) |
The calculated values are displayed in Table 2. Herein, ε increases from 2.08 to 2.62 × 10⁻³ with the increase of the Co-doping rate in BFO, suggesting dense and compact crystallites of doped materials. This finding is further supported by Fig. 1b, where the shift in peak positions towards the left with the substitution rate indicates a decrease in interplanar spacing, contributing to heightened microstrain and consequently resulting in a reduction in crystallite size. A similar trend was observed in Co-substituted BFO nanoparticles,43 as well as in BFO nanoparticles with (Cu, Zr) co-substitution.44
3.2. Vibrational analysis
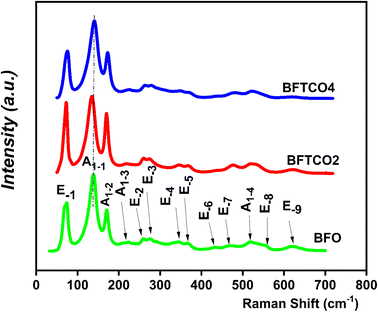
Raman spectroscopy is a discerning approach for identifying short-range ordered structures and can detect local and static symmetries. Fig. 3 displays Raman scattering spectra of both undoped and doped BFO ceramics using an excitation wavelength of 633 nm performed at RT. According to Group Theory,45 most of the A1 and E active Raman modes for all samples were observable, closely corresponding to those of the rhombohedral R3c perovskite BFO. These outcomes were consistent with the findings of the XRD analysis.The collective results of the pure and doped BFO ceramics were derived from the 13Γ = 4A1 + 9E Raman active modes. In this context, the letter A denotes the symmetric transformation of a molecule during rotation around the principal axis of symmetry, while the letter E represents a twofold degenerate vibration. The low-frequency A1 modes were primarily associated with the Bi–O vibration and lattice distortion.46 Conversely, the high frequency of E modes was predominantly attributed to the Fe–O vibration.45 For BFO, BFTCO2, and BFTCO4, the higher magnitude of A1 modes compared to E modes was due to measurements in the unpolarized configuration.47 A1 modes, polarized along the z-axis, were strongly excited and detectable compared to E modes polarized in the x–y plane. According to Hermet et al.,48 Bi atoms contribute to low-frequency modes up to 167 cm−1, while oxygen atoms dominate modes beyond 262 cm−1. Moreover, Fe atoms mostly contribute to modes between 152 and 262 cm−1, with potential involvement in higher frequency modes.
According to Fig. 3 and as indicated by the dashed line, we observe a slight red shift of the optical mode A1–1 with an increase in substitution rate up to x = 2%, followed by a blue shift when the substitution rate reached x = 4%. The same trend was observed in the evolution of the Bi–O bond length (deduced from the XRD study) as a function of the substitution rate. The shift bond A1–1 is attributed to the hybridization between Bi (6s2 6p3) and O (2s2 2p4), which is in turn related to the force constant (k) between the Bi–O bond. Therefore, the mode frequency denoted by ω can advantageously explain the shift of A1–1 versus substitution since ω is given by the following equation based on the simple harmonic mode:
 | (3) |
3.3. Optical properties
To investigate the optical properties of BFO, BFTCO2, and BFTCO4, UV-vis spectroscopy measurements were carried out. Fig. 4 displays the results of these measurements taken at RT. UV-visible diffuse reflectance spectroscopy (DRS) was employed in the wavelength range of 350–900 nm, as shown in the insert in Fig. 4a. Subsequently, these UV-visible DRS spectra were converted to diffuse spectra using the Kubelka–Munk function to determine the absorption coefficient F(R). Its expression is given by the following relation:
 | (4) |
| F(R)hν = A(hν − Eg)n | (5) |
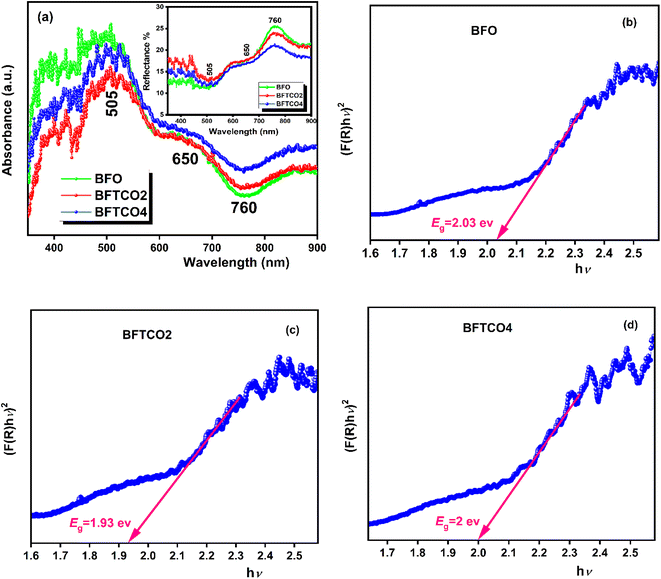 | ||
| Fig. 4 a UV-visible spectra and the inset illustrates a variation of reflectance (R) as a function of wavelength. The plot of [F(R)hν]2 Vs hν of BFO (b), BFTCO2 (c) and BFTCO4 (d) samples. | ||
3.4. Mössbauer spectroscopic study
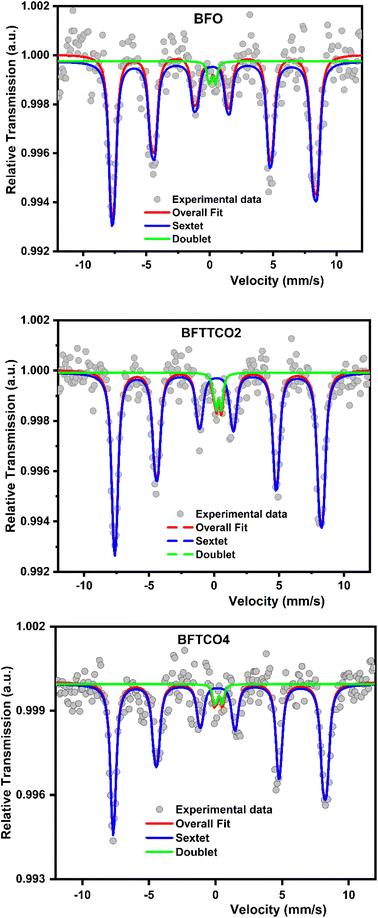
To investigate of the hyperfine magnetic behavior and oxidation state of iron atoms, 57Fe Mössbauer spectroscopy was employed to analyze BFO, BFTCO2, and BFTCO4 ceramics. The Mössbauer spectra for these samples were recorded at RT and are visually represented in Fig. 5. The spectra for all samples exhibited a combination of a sextet (six-line) and a doublet. The sextet is attributed to the Zeeman splitting of Fe nuclear levels caused by the hyperfine magnetic field, suggesting magnetic ordering, possibly a screw or slightly canted antiferromagnetic ordering with a Néel temperature (TN) expected to be above RT. Meanwhile, the doublet is associated with the impurity phase Bi25FeO40,64 consistent with XRD results. The absence of a hyperfine field in the doublet indicates that the Bi25FeO40 phase does not contribute to the magnetic ordering materials. A detailed comparison of Mössbauer spectral parameters, including isomer shift IS (δ), half width at half maximum (Γ), quadrupole shift/splitting (2ε/QS), magnetic hyperfine field (Bhf), and fractional area, is summarized in Table 3 for BFO, BFTCO2 and BFTCO4 samples. Herein, the range of values of IS (δ) for all samples suggests the exclusive presence of the Fe3+ state, with no signal indicating the presence of Fe2+ ions (0 < δ < 0.5 mm s−1 for Fe3+ and 0.6 < δ < 1.4 mm s−1 for Fe2+).65 Moreover, compared to the pristine BFO, the slight reduction in Bhf detected in BFTCO2 and BFTCO4 is attributed to the local distortion at Fe sites due to Bi vacancies, consistent with other reported results.66,67 From Fig. 5, the Mössbauer spectrum of BFO exhibits evident asymmetry with a notable intensity disparity between lines 1 and 6, as well as lines 2 and 5. This asymmetry serves as compelling evidence for the presence of cycloidal modulation.68,69 Interestingly, this asymmetry becomes slightly more symmetrical with the substitution, notably in the case of BFTCO2.69 Such a result implies that the introduction of Cu and Ti doping has the potential to disrupt the modulated spiral spin structure of BFO. A similar trend has been observed in other doped BFO compounds, including Pr-doped BFO,70 Y-doped BFO71 and (Zr, Zn) co-doped BFO.26| Sample | Fe site | IS (δ) (mm s−1) | Γ/2 (mm s−1) | 2ε/QS (mm s−1) | Bhf (T) | Area (%) | Phase |
|---|---|---|---|---|---|---|---|
| BFO | Sextet | 0.245 | 0.26 | 0.63 | 49.6 | 96 | BFO |
| Doublet | 0.136 | 0.15 | 0.85 | 4 | Bi25FeO40 | ||
| BFTCO2 | Sextet | 0.247 | 0.22 | 0.515 | 49.2 | 95 | BFO |
| Doublet | 0.316 | 0.16 | 0.40 | 5 | Bi25FeO40 | ||
| BFTCO4 | Sextet | 0.207 | 0.22 | 0.451 | 49.5 | 96 | BFO |
| Doublet | 0.215 | 0.16 | 0.49 | 4 | Bi25FeO40 |
3.5. Dielectric measurements
To explore the dielectric properties in BFO, BFTCO2, and BFTCO4, an investigation was carried out on the temperature and frequency dependencies of the dielectric constant and tangent loss (tan δ). Fig. 6 illustrates the temperature evolution of
  (within the temperature range 300–675 K) for BFO (a), BFTCO2 (b) and BFTCO4 (c) samples at selected frequencies (ranging from 1 kHz to 1 MHz). Tan δ versus temperature for all samples is depicted in the inset of Fig. 6. At RT, the tan δ of BFO is approximately 0.32 when measured at 10 kHz. This value decreases in BFTCO2 to around 0.13, then decreases significantly for BFTCO4 to reach approximately 0.0092. Here, the decrease in the values of tan δ with the levels of Ti4+ and Cu2+ substitution rate reduces the conductivity of the BFO sample. This result reveals that the oxygen vacancies in substituted BFO were controlled by Cu2+ and Ti4+ doping, leading to an enhancement in its resistivity. This finding supports the earlier discussion in the structural characterization section where the decrease in average crystallite size was associated with the reduction in the amount of oxygen vacancies. Above RT and especially at elevated temperatures (>450 K), the notable rise in the value of tan δ, which decreased as the frequency increased, suggests that the hopping of electrons is unable to follow the frequencies of the applied field.
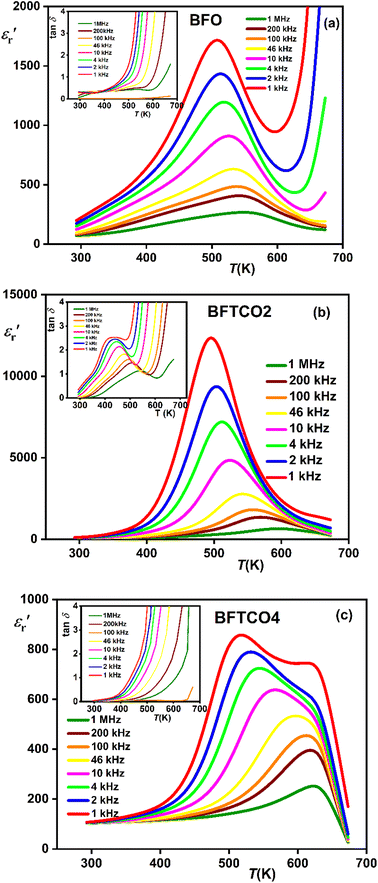 | ||
Fig. 6 Variation of  with temperature at different frequencies for BFO (a), BFTCO2 (b) and BFTCO4 (c). The inset shows the corresponding tan δ versus T. with temperature at different frequencies for BFO (a), BFTCO2 (b) and BFTCO4 (c). The inset shows the corresponding tan δ versus T. | ||
For BFO (Fig. 6a), we observed a pronounced anomaly in the dielectric constant  across the entire temperature range, occurring at Tm. For example, its value was 509 K detected at 1 kHz. Since the antiferromagnetic transition temperature for BFO is around (TN) ∼623–643 K,72 indicating that the presence of this anomaly rules out magneto-electric coupling. Herein, Tm shifted towards higher temperatures as the measuring frequency rose. Additionally, the maximum dielectric permittivity
  decreased as the frequency increased. All these observations confirm the relaxor-like dielectric behavior of the material. Such anomaly was observed in the work of Shama et al.,73 where they attributed the relaxor behavior occurring below TN to the presence of defects like
  and
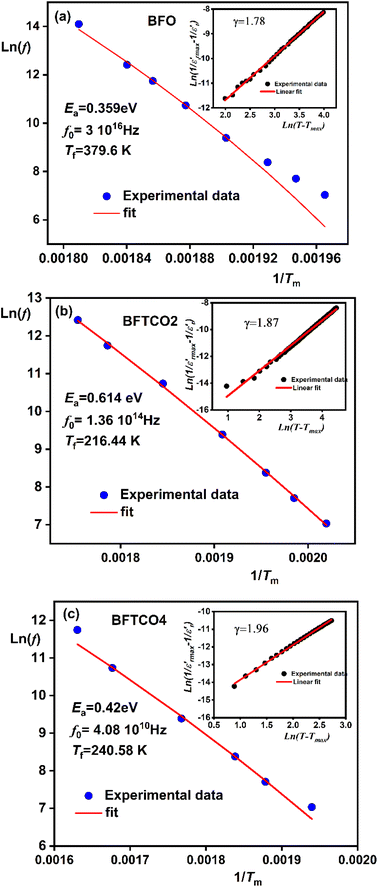
and  in the material. Upon doping BFO with Cu and Ti, relaxor behavior was also observed, as illustrated in Fig. 6b and c. Furthermore, to confirm the relaxor behavior, we applied the Vogel–Fulcher relationship to all prepared ceramics. This relationship is given by the following expression:74
| f = f0 exp[−Ea/KB(Tm − Tf)] | (6) |
The dielectric relaxation characteristics of BFO, BFTCO2, and BFTCO4 ceramics can be described by two empirical parameters: γ and ΔTrelax. Here, γ can be calculated using the modified Curie–Weiss law, which is deduced by the following relationship:76
 | (7) |
 denotes the dielectric constant maximum at Tm and C1 is constant. γ represents the slope of the graph between
  and ln(T − Tm) (the inset in Fig. 7). ΔTrelax is determined by the difference between two Tm values measured at two distinct frequencies as indicated by:77
| ΔTrelax = Tm (105 Hz) − Tm(103 Hz). | (8) |
As shown in the inset of Fig. 7, the value of the γ parameter rises with increasing x and reaches its maximum for BFTCO4, with a value of 1.96. Additionally, ΔTrelax increases progressively with the doping level, from 30 for BFO, reaching 64 for BFTCO2, and 96 for BFTCO4. All these observations suggest that the substitution of Fe3+ by Ti4+ and Cu2+ appears to increase the random local field due to the disordered distribution created in the B site, leading to the enhancement of dielectric relaxor behavior.
For the composition BFTCO4, two dielectric constant peaks appeared in the dielectric response. Similar dielectric behavior has been noted in BF-BT-based ceramics78 and is attributed to the core–shell structure of the grains. In addition, the relaxor behavior observed in our system is certainly beneficial for energy storage performance.
4. Conclusion
To explore practical advancements and potential applications of BiFeO3, especially in the field of photovoltaics and in the development of energy storage devices, we co-doped it at the Fe-site with Cu2+ and Ti4+ to form the system BiFe1−x(Ti1/2Cu1/2)xO3, with x restricted to the range of 0–0.04. These compositions were synthesized using the solid-state reaction method and the correlation between their structure, vibrational, optical and dielectric properties was highlighted. The XRD analysis revealed that substituting Cu2+ and Ti4+ at the Fe3+ site does not disrupt the rhombohedral structure of BFO. However, the substitution resulted in a reduction of crystallite size. On the other hand, the substitution did not prevent the formation of a secondary phase (selenite Bi25FeO40), as also identified through Mössbauer spectroscopy analysis. This study provided that Fe was present in the +3 oxidation state in pure as well as doped BFO. This is probably caused by the decrease in the formation of oxygen vacancies, which prevents the formation of Fe2+. Consequently, this leads to a decrease in dielectric losses with the substitution rate of Cu and Ti as observed from the dielectric study. Optical band gap reduction due to (Ti, Cu) co-doping, as shown by the UV-vis spectroscopy results, enhanced the photocatalytic properties of BFO doping. This enhancement was facilitated by the competitive effects between the 3d conduction band edge of Cu2+ and the Bi–O bond length. A broad dielectric peak in the temperature-dependent dielectric constant with a pronounced frequency dispersion was observed beyond TN, indicating relaxor behavior for all the samples. Furthermore, the degree of relaxor behavior was found to increase gradually with the doping level, attributed to the disordered distribution created in the B site. In addition, the obtained relaxor behavior might be promising for dielectric materials in various fields of application, especially for high-energy storage devices.Author contributions
All authors participated in the preparation of the present manuscript. Material synthesis, data collection, and analysis were conducted by A. Ouertani, Z. Abdelkafi, and H. Khemakhem. Furthermore, N. Randrianantoandro assisted with the Mössbauer measurements. The initial draft of the manuscript was written by A. Ouertani with the assistance of Z. Abdelkafi and all other authors commented on the previous versions of the manuscript. All authors read and approved the final version of the manuscript.Conflicts of interest
The authors declare that they have no conflict of interest.Acknowledgements
The authors acknowledge the Laboratory of Multifunctional Materials and Applications (LaMMA), (LR16ES18), Faculty of Sciences of Sfax, University of Sfax, (Tunisia).References
- W. Eerenstein, N. D. Mathur and J. F. Scott, Nature, 2006, 442, 759–765 CrossRef CAS PubMed.
- G. Catalan and J. F. Scott, Adv. Mater., 2009, 21, 2463–2485 CrossRef CAS.
- J. Wang, J. B. Neaton, H. Zheng, V. Nagarajan, S. B. Ogale, B. Liu, D. Viehland, V. Vaithyanathan, D. G. Schlom, U. V. Waghmare, N. A. Spaldin, K. M. Rabe, M. Wuttig and R. Ramesh, Science, 2003, 299, 1719–1722 CrossRef CAS PubMed.
- K. F. Wang, J.-M. Liu and Z. F. Ren, Adv. Phys., 2009, 58, 321–448 CrossRef CAS.
- T. Durga Rao, R. Ranjith and S. Asthana, J. Appl. Phys., 2014, 115, 124110 CrossRef.
- C. Ederer and N. A. Spaldin, Phys. Rev. B: Condens. Matter Mater. Phys., 2005, 71, 060401 CrossRef.
- V. R. Palkar, J. John and R. Pinto, Appl. Phys. Lett., 2002, 80, 1628–1630 CrossRef CAS.
- X. Chen, Y. Wu, J. Zhang and X. Chen, Sci. China Phys. Mech. Astron., 2012, 55, 404–408 CrossRef CAS.
- T. D. Rao, T. Karthik and S. Asthana, J. Rare Earths, 2013, 31, 370–375 CrossRef CAS.
- T. Durga Rao, T. Karthik, A. Srinivas and S. Asthana, Solid State Commun., 2012, 152, 2071–2077 CrossRef CAS.
- F. Chang, N. Zhang, F. Yang, S. Wang and G. Song, J. Phys. Appl. Phys., 2007, 40, 7799 CrossRef CAS.
- D. H. Wang, W. C. Goh, M. Ning and C. K. Ong, Appl. Phys. Lett., 2006, 88, 212907 CrossRef.
- D. Lebeugle, D. Colson, A. Forget and M. Viret, Appl. Phys. Lett., 2007, 91, 022907 CrossRef.
- Y. Wang, X. Chen, H. Zhou, L. Fang, L. Liu and H. Zhang, J. Alloys Compd., 2013, 551, 365–369 CrossRef CAS.
- X. Wang, Y. Zhang, X. Song, Z. Yuan, T. Ma, Q. Zhang, C. Deng and T. Liang, J. Eur. Ceram. Soc., 2012, 32, 559–567 CrossRef CAS.
- F. Bian, S. Yan, C. Xu, Z. Liu, X. Chen, C. Mao, F. Cao, J. Bian, G. Wang and X. Dong, J. Eur. Ceram. Soc., 2018, 38, 3170–3176 CrossRef CAS.
- W. Ye, C. Zhu, Y. Xiao, X. Bai, P. Zheng, J. Zhang, W. Bai, Q. Fan, L. Zheng and Y. Zhang, J. Eur. Ceram. Soc., 2023, 43, 900–908 CrossRef CAS.
- S. Chen, T. Wang, S. Xie, J. Leng, Q. Zhu, K. Li, W. Gong, J. Zhu and Q. Wang, ACS Appl. Mater. Interfaces, 2024, 16, 12521–12533 CrossRef CAS PubMed.
- S. J. Clark and J. Robertson, Appl. Phys. Lett., 2007, 90, 132903 CrossRef.
- J. F. Ihlefeld, N. J. Podraza, Z. K. Liu, R. C. Rai, X. Xu, T. Heeg, Y. B. Chen, J. Li, R. W. Collins, J. L. Musfeldt, X. Q. Pan, J. Schubert, R. Ramesh and D. G. Schlom, Appl. Phys. Lett., 2008, 92, 142908 CrossRef.
- T. P. Gujar, V. R. Shinde and C. D. Lokhande, Mater. Chem. Phys., 2007, 103, 142–146 CrossRef CAS.
- A. Mukherjee, Sk. M. Hossain, M. Pal and S. Basu, Appl. Nanosci., 2012, 2, 305–310 CrossRef CAS.
- N. Rong, M. Chu, Y. Tang, C. Zhang, X. Cui, H. He, Y. Zhang and P. Xiao, J. Mater. Sci., 2016, 51, 5712–5723 CrossRef CAS.
- W. Cai, C. Fu, R. Gao, W. Jiang, X. Deng and G. Chen, J. Alloys Compd., 2014, 617, 240–246 CrossRef CAS.
- A. Sathiya Priya and D. Geetha, Braz. J. Phys., 2021, 51, 40–46 CrossRef CAS.
- M. Boukhari, Z. Abdelkafi, N. Abdelmoula, H. Khemakhem and N. Randrianantoandro, J. Mater. Sci. Mater. Electron., 2023, 34, 1218 CrossRef CAS.
- J. Wu, J. Wang, D. Xiao and J. Zhu, J. Appl. Phys., 2011, 109, 124118 CrossRef.
- S. Mukherjee, R. Gupta, A. Garg, V. Bansal and S. Bhargava, J. Appl. Phys., 2010, 107, 123535 CrossRef.
- A. R. Jayakrishnan, B. Anina Anju, S. K. P Nair, S. Dutta and J. P. B. Silva, J. Eur. Ceram. Soc., 2024, 44, 4332–4349 CrossRef CAS.
- S. Yang, F. Zhang, X. Xie, X. Guo, L. Zhang and S. Fan, J. Mater. Sci. Mater. Electron., 2017, 28, 14944–14948 CrossRef CAS.
- R. Chakraborty, S. Mukherjee and S. Mukherjee, J. Aust. Ceram. Soc., 2017, 53, 57–65 CrossRef CAS.
- M. Ncube, D. Naidoo, K. Bharuth-Ram, D. Billing, H. Masenda, D. R. Sahu, B. K. Roul and R. M. Erasmus, Hyperfine Interact., 2013, 219, 83–88 CrossRef CAS.
- W. Ramadan and A. Gupta, J. Nanosci. Nanotechnol., 2018, 18, 7804–7810 CrossRef CAS.
- K. Chakrabarti, K. Das, B. Sarkar, S. Ghosh, S. K. De, G. Sinha and J. Lahtinen, Appl. Phys. Lett., 2012, 101, 042401 CrossRef.
- A. E. Yacoubi, A. Massit, S. E. Moutaoikel, A. Rezzouk and B. C. E. Idrissi, Am. J. Mater. Sci. Eng., 2017, 5, 1–5 Search PubMed.
- M. Abushad, W. Khan, S. Naseem, S. Husain, M. Nadeem and A. Ansari, Ceram. Int., 2019, 45, 7437–7445 CrossRef CAS.
- M. M. Rhaman, M. A. Matin, M. N. Hossain, F. A. Mozahid, M. A. Hakim and M. F. Islam, Bull. Mater. Sci., 2019, 42, 190 CrossRef.
- T. Moriya, Phys. Rev., 1960, 120, 91–98 CrossRef CAS.
- M. Salah, I. Morad, H. E. Ali, M. M. Mostafa and M. M. El-Desoky, J. Inorg. Organomet. Polym. Mater., 2021, 31, 3700–3710 CrossRef CAS.
- M. K. Anupama, B. Rudraswamy and N. Dhananjaya, J. Alloys Compd., 2017, 706, 554–561 CrossRef CAS.
- M. Kumar and K. L. Yadav, J. Phys. Chem. Solids, 2007, 68, 1791–1795 CrossRef CAS.
- J.-B. Zhang, V. V. Struzhkin, W. Yang, H.-K. Mao, H.-Q. Lin, Y.-C. Ma, N.-L. Wang and X.-J. Chen, J. Phys. Condens. Matter, 2015, 27, 445701 CrossRef PubMed.
- M. M. Rhaman, M. A. Matin, M. N. Hossain, F. A. Mozahid, M. A. Hakim and M. F. Islam, Bull. Mater. Sci., 2019, 42, 190 CrossRef.
- A. S. Priya, I. B. Shameem Banu, M. Shahid Anwar and S. Hussain, J. Sol–Gel Sci. Technol., 2016, 80, 579–586 CrossRef CAS.
- M. K. Singh, H. M. Jang, S. Ryu and M.-H. Jo, Appl. Phys. Lett., 2006, 88, 042907 CrossRef.
- X. Xue, G. Tan, W. Liu and H. Ren, Mater. Chem. Phys., 2014, 146, 183–191 CrossRef CAS.
- P. Hermet, M. Goffinet, J. Kreisel and Ph. Ghosez, Phys. Rev. B: Condens. Matter Mater. Phys., 2007, 75, 220102 CrossRef.
- A. Jaiswal, R. Das, T. Maity, K. Vivekanand, S. Adyanthaya and P. Poddar, J. Phys. Chem. C, 2010, 114, 12432–12439 CrossRef CAS.
- X. Y. Guan, Z. W. Qiao, D. Z. Yan, Y. F. Sun and J. Li, J. Mater. Sci. Mater. Electron., 2015, 26, 6807–6813 CrossRef CAS.
- S. Kulkarni, S. Chaturvedi, R. Das and P. Poddar, RSC Adv., 2015, 5, 23563–23568, 10.1039/C5RA00933B.
- M. Nadeem, W. Khan, S. Khan, M. Shoeb, S. Husain and M. Mobin, Mater. Res. Express, 2018, 5, 065506 CrossRef.
- P. R. Vanga, R. V. Mangalaraja and M. Ashok, Mater. Res. Bull., 2015, 72, 299–305 CrossRef CAS.
- J. F. Ihlefeld, N. J. Podraza, Z. K. Liu, R. C. Rai, X. Xu, T. Heeg, Y. B. Chen, J. Li, R. W. Collins, J. L. Musfeldt, X. Q. Pan, J. Schubert, R. Ramesh and D. G. Schlom, Optical band gap of BiFeO3 grown by molecular-beam epitaxy, Appl. Phys. Lett., 2008, 92, 142908 CrossRef , https://pubs.aip.org/aip/apl/article-abstract/92/14/142908/166239/Optical-band-gap-of-BiFeO3-grown-by-molecular-beam?redirectedFrom=fulltext.
- Y. Xu and M. Shen, Mater. Lett., 2008, 62, 3600–3602 CrossRef CAS.
- A. Manzoor, A. M. Afzal, N. Amin, M. I. Arshad, M. Usman, M. N. Rasool and M. F. Khan, Ceram. Int., 2016, 42, 11447–11452 CrossRef CAS.
- Y. Xu and M. A. A. Schoonen, Am. Mineral., 2000, 85, 543–556 CrossRef CAS.
- J. Rodríguez-Carvajal, M. Hennion, F. Moussa, A. H. Moudden, L. Pinsard and A. Revcolevschi, Phys. Rev. B: Condens. Matter Mater. Phys., 1998, 57, R3189–R3192 CrossRef.
- M. Hasan, M. A. Basith, M. A. Zubair, Md. S. Hossain, R. Mahbub, M. A. Hakim and Md. F. Islam, J. Alloys Compd., 2016, 687, 701–706 CrossRef CAS.
- Z. Zhang, P. Wu, L. Chen and J. Wang, Appl. Phys. Lett., 2010, 96, 012905 CrossRef.
- S. Irfan, Y. Shen, S. Rizwan, H.-C. Wang, S. B. Khan and C.-W. Nan, J. Am. Ceram. Soc., 2017, 100, 31–40 CrossRef CAS.
- S. Hussain and S. K. Hasanain, J. Alloys Compd., 2016, 688, 1151–1156 CrossRef CAS.
- S. K. Patra, B. Bhushan and A. Priyam, Dalton Trans., 2016, 45, 3918–3926 RSC.
- C. Li, B. Dong and Q. Wang, in Handbook of Nanomaterials Properties, ed. B. Bhushan, D. Luo, S. R. Schricker, W. Sigmund and S. Zauscher, Springer, Berlin, Heidelberg, 2014, pp. 1263–1298 Search PubMed.
- J. Li, H. He, F. Lü, Y. Duan and D. Song, MRS Online Proc. Libr. OPL, 2001, 676, Y7.7 CrossRef.
- C. Janot, in Colloquium Spectroscopicum Internationale, ed. J. P. Robin, Pergamon, 1976, pp. 53–64 Search PubMed.
- J. Prado-Gonjal, D. Ávila, M. E. Villafuerte-Castrejón, F. González-García, L. Fuentes, R. W. Gómez, J. L. Pérez-Mazariego, V. Marquina and E. Morán, Solid State Sci., 2011, 13, 2030–2036 CrossRef CAS.
- T. R. Paudel, S. S. Jaswal and E. Y. Tsymbal, Phys. Rev. B: Condens. Matter Mater. Phys., 2012, 85, 104409 CrossRef.
- S. R. Burns, O. Paull, J. Juraszek, V. Nagarajan and D. Sando, Adv. Mater., 2020, 32, 2003711 CrossRef CAS PubMed.
- A. Agbelele, D. Sando, C. Toulouse, C. Paillard, R. D. Johnson, R. Ruffer, A. F. Popkov, C. Carretero, P. Rovillain, J.-M. L. Breton, B. Dkhil, M. Cazayous, Y. Gallais, M.-A. Measson, A. Sacuto, P. Manuel, A. K. Zvezdin, A. Barthelemy, J. Juraszek and M. Bibes, Adv. Mater., 2017, 29, 1602327 CrossRef PubMed.
- S. Kumar Srivastav, N. S. Gajbhiye and A. Banerjee, J. Appl. Phys., 2013, 113, 203917 CrossRef.
- H. Fki, M. Koubaa, L. Sicard, W. Cheikhrouhou-Koubaa, A. Cheikhrouhou and S. Ammar-Merah, Ceram. Int., 2017, 43, 4139–4150 CrossRef CAS.
- P. Fischer, M. Polomska, I. Sosnowska and M. Szymanski, J. Phys. C Solid State Phys., 1980, 13, 1931 CrossRef CAS.
- S. Sharma, J. M. Siqueiros and O. R. Herrera, J. Alloys Compd., 2021, 853, 156979 CrossRef CAS.
- D. Viehland, S. J. Jang, L. E. Cross and M. Wuttig, J. Appl. Phys., 1990, 68, 2916–2921 CrossRef CAS.
- J. Zhao, T. Hu, Z. Fu, Z. Pan, L. Tang, X. Chen, H. Li, J. Hu, L. Lv, Z. Zhou, J. Liu, P. Li and J. Zhai, Small, 2023, 19, 2206840 CrossRef CAS PubMed.
- K. Uchino and S. Nomura, Ferroelectrics, 1982, 44, 55–61 CrossRef CAS.
- D. Zheng, R. Zuo, D. Zhang and Y. Li, J. Am. Ceram. Soc., 2015, 98, 2692–2695 CrossRef CAS.
- Z. Chen, X. Bu, B. Ruan, J. Du, P. Zheng, L. Li, F. Wen, W. Bai, W. Wu, L. Zheng and Y. Zhang, J. Eur. Ceram. Soc., 2020, 40, 5450–5457 CrossRef CAS.
| This journal is © The Royal Society of Chemistry 2024 |


