 Open Access Article
Effective separation of dyes/salts by sulfonated covalent organic framework membranes based on phenolamine network conditioning
Zekun Zhou†
a,
Zezhen Zhang†a,
Shuman Fengb,
Lulu Liua,
Weishan Denga and
Lili Wu *a
*a
aSchool of Materials Science and Engineering, Wuhan University of Technology, Wuhan, 430070, China. E-mail: polym_wl@whut.edu.cn
bDepartment of Neurology, Henan Provincial People's Hospital, Zhengzhou University People's Hospital, Zhengzhou, Henan 450003, China
First published on 3rd May 2024
Abstract
This study developed a modified polyacrylonitrile (PAN) membrane controlled by a phenol–amine network and enhanced with a sulfonated covalent organic framework (SCOF), aimed at improving the efficiency of textile wastewater treatment. Utilizing a phenol–amine network control strategy allows for precise manipulation of interfacial reactions in the synthesis of SCOF, achieving highly uniform modification on the surface of the PAN membrane. This modified membrane demonstrated high rejection of over 98% for various water-soluble dyes, including Alcian blue 8GX, Coomassie Brilliant Blue G250, methyl blue, congo red, and rose bengal, and also exhibited specific selectivity in processing salt-containing wastewater. By adjusting the deposition time of the phenol–amine and the concentration of SCOF monomers, optimal retention performance and permeate flux were achieved, effectively separating dyes and salts. This research provides a new and effective solution for treating textile wastewater, especially in separating and recovering dyes and salts, offering broad application prospects in environmental management and water resource management, and highlighting its significant practical implications.
Introduction
With the rapid development of the dye industry, the substantial discharge of dye wastewater has gradually become one of the primary sources of water pollution.1–3 Dye wastewater, due to its complex composition, high biological concentration, and low biodegradability, is regarded as a typical type of recalcitrant organic wastewater. Although conventional nanofiltration membrane technology can remove organic compounds from high salinity organic wastewater, its limitations such as poor organic/salt selectivity and inadequate permeability make it unsuitable for zero discharge treatment of textile wastewater. Furthermore, the salts present in the wastewater possess recyclable value, particularly inorganic salts like Na2SO4. These salts can be directly reused in the textile dyeing process, thus enabling efficient resource utilization.4 Membrane-based separation technology has garnered considerable attention in the field of textile industry wastewater treatment due to its outstanding performance advantages. The development of corresponding membrane technologies is imperative for efficiently separating and recovering valuable components from dye/salt mixtures.In recent years, covalent organic frameworks (COFs), a novel type of porous material, have generated widespread research interest. Given their unique physical and chemical properties, COFs have demonstrated significant potential for applications across a broad range of fields, thereby attracting widespread attention. These areas include, but are not limited to, gas storage,5 catalysis,6 chemical sensing,7 fine separation,8 electrode materials,9 adsorption,10 optoelectronics,11 and energy storage.12 The extensive research interest in these COFs can primarily be attributed to their outstanding characteristics, such as exceptionally high surface area, low density, excellent stability, tunable structures, permanent porosity, and the ease of functional design.13 With their surface area surpassing that of activated carbon and metal–organic frameworks (MOFs), COFs demonstrate unique advantages in the fields of adsorption and gas storage.14 The tunability of their structure and porosity plays a crucial role in selective molecular adsorption, catalysis, drug delivery, and separation technologies.15 Additionally, the exceptional chemical and thermal stability of these frameworks ensures stable performance under extreme conditions, thereby expanding their range of applications.16 Upon functionalization, these frameworks reveal significant electrical and optical characteristics, providing novel material options for advancing the next generation of energy and optoelectronic technologies. Moreover, selecting appropriate building blocks and synthesis conditions allows for the customization of specific structures and properties of COFs, further enhancing their potential across various application domains.16–18
Inspired by the strong adhesive properties of marine mussels, dopamine (DA) has been proven to polymerize and adhere to nearly all types of organic and inorganic surfaces through the formation of strong covalent and non-covalent bonds, ultimately resulting in the formation of thin polydopamine (PDA) layers.19,20 The PDA layer is rich in functional groups such as phenolic hydroxyl and amine groups, making it an ideal platform for modification. These functional groups can participate in Michael addition and Schiff base reactions, providing numerous reactive sites for subsequent modification processes. This characteristic greatly expands the application range of PDA in surface functionalization and material science.21 However, the high cost of dopamine and its derivatives has hindered their widespread application. Therefore, employing cost-effective substitutes like catechol and polyamines offers a viable solution. Catechol can polymerize and deposit on various material surfaces in alkaline solutions, providing an economically efficient approach for surface modification.22–24 By adopting this cost-effective and straightforward modification method, hydrophobic membranes can be transformed into hydrophilic membranes, while almost not altering the membrane's pore structure.25 The number of ethyleneimine units or the spacer length in polyamines significantly influences the morphology of catechol/polyamine polymers. When short-chain polyamines are used, the resulting oligomers have a higher distribution density of benzene rings. This high-density π–π stacking promotes the aggregation of oligomers, leading to the formation of nanoparticles. However, it is noteworthy that as the number of ethyleneimine units in polyamines increases, there is a decrease in benzene ring density, chain rigidity, and cross-linking density, which tends to favor the formation of films over particles. This indicates that by adjusting the content and distribution of ethyleneimine units, it is possible to control the morphology of polymers between nanoparticles and films, offering a strategy for designing materials with specific functions.26–28
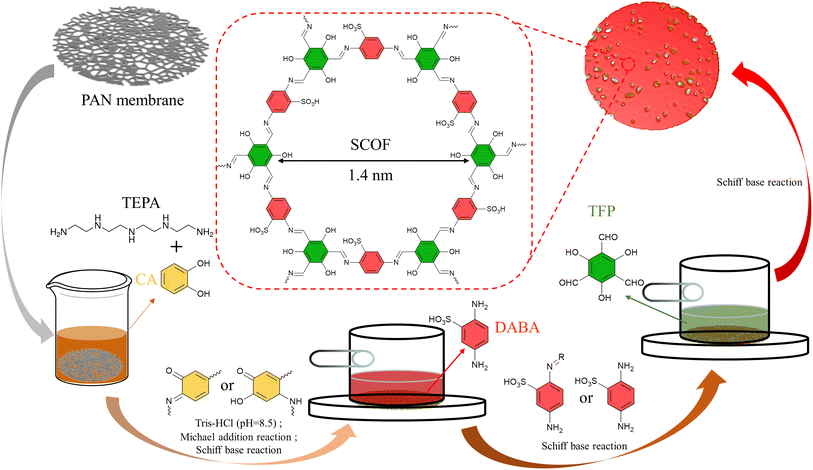
In this research, by co-depositing polyphenols and polyamines on PAN ultrafiltration membranes to provide reaction sites, and then utilizing the tunable pore structure of COFs for a sieving mechanism, and introducing unique sulfonic acid groups to enhance surface electrostatic repulsion charge, a sulfonated imine-type covalent organic framework (SCOF) modified membrane with selective dye/salt separation capability was synthesized through interfacial polymerization.29 Catechol and tetraethylenepentamine were chosen as key materials for the membrane modification layer to ensure optimal hydrophilicity and a porous morphology. In an alkaline Tris-HCl buffer solution, catechol undergoes oxidation to transform into a quinone-like structure. This quinone-like structure can crosslink with amine compounds through Michael addition or Schiff base reactions, forming a stable crosslinked network. Moreover, this process also provides effective adsorption sites for subsequent reactions.30 Imine-based COFs exhibit excellent chemical stability in water, a feature that makes them highly attractive for applications in molecular separation within aqueous solutions. The phenol–amine network coating deposited on the carrier surface acts as a molecular tether, effectively attracting and anchoring the building monomers of SCOF. This is followed by interfacial polymerization, promoting the uniform growth of SCOF on the surface. The research further delved into the optimal deposition time for the phenol–amine coating and the ideal concentration ratio of SCOF monomers. The correct modification duration and monomer reaction concentration are key to minimizing selective layer defects during the growth of SCOF.31,32 The optimized SCOF/CA-TEPA/PAN (referred to as SCOF/C-T/PAN) membrane exhibited enhanced water permeability and solute removal efficiency in the treatment of various aqueous dye solutions.
Experimental section
Materials
The polyacrylonitrile (PAN) membrane (200 kDa) was purchased from Ander Membrane Technology Co., Ltd., with an initial pure water flux of 512 L m−2 h−1 bar−1 (abbreviated as LMH bar−1). Catechol (CA), tetraethylenepentamine (TEPA), 2,5-diaminobenzenesulfonic acid (DABA), 2,4,6-triformylphloroglucinol (TFP), Alcian blue 8GX (ACB), Coomassie brilliant blue G250 (CBB), Congo red (CR), methyl orange (MO), polyethylene glycol (PEG 400, 600, 800, 1000 and 1500), MgCl2, MgSO4, NaCl, Na2SO4 were supplied by Shanghai Aladdin Biochemical Technology Co., Ltd. Ethanol, tris(hydroxymethyl)aminomethane, 1,4-dioxane, and glacial acetic acid were provided by Sinopharm Chemical Reagent Co., Ltd. Methyl Blue (MB) and rose bengal (RB) were supplied by Shanghai Yien Chemical Technology Co., Ltd. All chemicals were used as received without any pretreatment. Detailed information on the dyes mentioned is summarized in Table 1.| Dyes | Mw (Da) | Formula | Dye tape | Size (nm) |
|---|---|---|---|---|
| ACB | 1299 | C56H68Cl4CuN16S4 | Cationic | 2.76 × 2.68 (ref. 33) |
| CBB | 858 | C47H48N3NaO7S2 | Anionic | 2.24 × 1.56 (ref. 34) |
| CR | 697 | C32H22N6Na2O6S2 | Anionic | 2.62 × 0.85 (ref. 33) |
| MB | 799 | C37H27N3Na2O9S3 | Anionic | 2.38 × 1.62 (ref. 33) |
| RB | 1048 | C20H2Cl4I4Na2O5 | Anionic | 1.54 × 1.49 (ref. 34) |
| MO | 327 | C14H14N3NaO3S | Anionic | 1.13 × 0.42 (ref. 35) |
Preparation of SCOF/CA-TEPA/PAN modified membrane
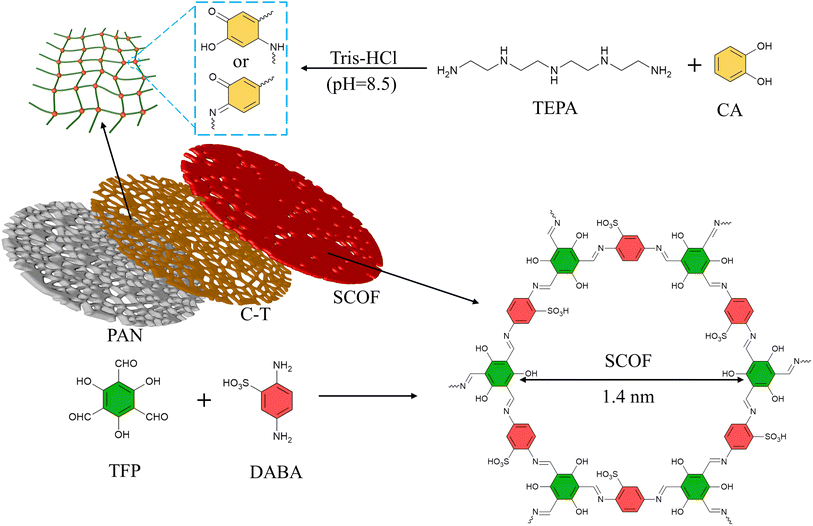
To begin, a PAN ultrafiltration membrane, measuring 32.17 cm2, is immersed in an ethanol solution to remove impurities such as glycerol and surfactants from its surface. After soaking for 30 minutes, the PAN membrane is removed and rinsed 3 to 5 times with deionised water (DIW) to thoroughly eliminate any ethanol and other residual impurities. Subsequently, the membrane is immersed again in DIW for 30 minutes. This step aims to ensure a complete exchange between the solvents within the membrane pores and on its surface with DIW, to guarantee no ethanol or other pre-treatment solvents remain in the PAN membrane.The preparation process is illustrated in Fig. 1. Initially, an appropriate amount of CA and TEPA is weighed and soaked in 100 mL of pH 8.5 Tris-HCl buffer solution, stirred for 30 minutes to ensure it dissolves and mixes evenly. Subsequently, the pre-treated membrane is immersed in the aforementioned solution and left to stand for a while. Afterward, it is rinsed 3–5 times with DIW to remove any phenol–amine solution not stably adsorbed on the surface, producing the CA-TEPA/PAN (C-T/PAN) membrane. This C-T/PAN membrane is then fixed in a specially designed modification mould, followed by the addition of 10 mL of a certain concentration of DABA aqueous solution, reacting for 2 minutes before the excess solution is removed.
Subsequently, TFP is dissolved in 1,4-dioxane, and once fully dissolved, this solution is poured into the mould. The interfacial polymerization reaction is allowed to proceed at room temperature for a set time before the solution is removed. Finally, the membrane is heat-treated at 60 °C for 5 minutes. The resulting membrane is named the SCOF/C-T/PAN membrane.
Membrane characterization
Field emission scanning electron microscope (F-SEM, Tescan Mira4) was employed at an acceleration voltage of 5.00 kV to observe the surface morphology of the membrane, with gold sputtering conducted prior to measurements to enhance conductivity. Chemical and structural characteristics were analyzed using attenuated total reflectance Fourier transform infrared spectroscopy (ATR-FTIR, Nexus) and X-ray photoelectron spectroscopy (XPS, Nexsa). The elemental distribution of the modified membrane was further analyzed using an energy dispersive X-ray spectroscope (EDX, Oxford ultim max 65). Surface hydrophilicity was evaluated by measuring the water contact angle with a contact angle meter (CA, JC2000C). X-ray diffraction (XRD) analysis was used to study the diffraction patterns of the SCOF-modified membrane before and after modification, within a 2θ range of 3–50°. The surface zeta potential of the SCOF/C-T/PAN membrane was assessed using a SurPass3 (Anton Paar, Austria).Performance evaluation
Filtration tests were conducted using a crossflow flat sheet membrane tester with an effective membrane area of 18.1 cm2 (BONA-TYLG-18, ShanDong BoNa Group, China), with the inlet water temperature strictly controlled within the range of 25 °C ± 2 °C to ensure consistency in experimental conditions. During the membrane testing phase, at least three tests were performed for performance evaluation to minimize human error. All newly prepared membranes were pre-pressed for 30 minutes at 3.0 bar to achieve stabilization, and crossflow filtration tests were conducted at 2.3 bar.To accurately measure the retention rate of the target filtrate and changes in salt concentration, a UV-visible spectrophotometer (UV-vis, UV-2550) was used to determine the dye rejection. Concurrently, the conductivity of the solution was analyzed using a conductivity meter (EC, DDS-307A) to measure the difference in salt concentration in the feed and filtrate before and after filtration.
Single component filtration performance
The membrane separation performance was evaluated using single-component feed solutions of 100 ppm dye solutions of CR, ACB, CBB, RB, MB, and MO, along with salt solutions of 2 g L−1 MgSO4, MgCl2, Na2SO4, and NaCl.The membrane permeate flux, denoted in LMH bar−1, and solute rejection (%) are calculated using eqn (1) and (2), respectively.
 | (1) |
 | (2) |
Molecular weight cutoff (MWCO) tests were also conducted using 1 g L−1 of PEG of various molecular weights as the feed solution, under the same conditions as the dye separation performance experiments. Finally, the concentrations of the feed and permeate solutions were measured using a total organic carbon analyzer (TOC-L VCPN, SHIMADZU). The MWCO of the SCOF/C-T/PAN membrane is defined when its rejection reaches 90%.
Dual component filtration performance
To further evaluate the membrane's mixed separation capability for dyes/salts, tests were conducted with mixtures of CR (100 ppm) and varying concentrations of Na2SO4 and NaCl (0, 1, 2, 5, 10 g L−1) as the model components. To ensure the accuracy of conductivity measurements, dye molecules were removed from the permeate solution using activated carbon before the measurements, to prevent their interference with the conductivity of the permeated salt solution.Results and discussion
Separation and optimization of SCOF/C-T/PAN membrane
As illustrated in Fig. 2, the formation of the phenol–amine network is facilitated through the quinone-like structure provided by the oxidized CA and the amine groups on TEPA via Michael addition and Schiff base reactions. In this process, TEPA also acts as a reaction site for further reactions, thereby immobilizing a significant amount of TFP on the membrane surface, providing an effective pathway for the subsequent construction of SCOF.36,37 The primary selective layer is composed of SCOF, whose synthesis relies on the rapid formation of covalent bonds through the Schiff base reaction between the amino groups of DABA and the formyl groups of TEP. The pore size of the synthesized SCOF is approximately 1.4 nm.38The impact of C-T deposition time on the separation performance of the modified membrane is illustrated in Fig. 3(a), where the concentrations of CA and TEPA were both set at 10 mmol L−1, and the concentration of the monomer DABA, used for synthesizing SCOF, was 9 mmol L−1. The deposition time was set to 2 minutes, with a TFP concentration of 6 mmol L−1, and the interfacial polymerization reaction also lasted for 2 minutes. As the deposition time of C-T increases, the permeate flux of the modified membrane for CR gradually decreases, while the rejection for CR gradually increases. At a deposition time of 10 hours, the flux reaches its maximum of 174 LMH bar−1, while the rejection reaches 98%. Extending the C-T deposition time leads to an increase in the amount of C-T deposited on the membrane surface. On one hand, this promotes the formation of a denser phenol–amine network on the PAN membrane surface, which can more extensively cover the membrane pores, effectively reducing dye permeation. On the other hand, under C-T regulation, SCOF is more likely to form a continuous and defect-free selective layer, thereby enhancing the rejection. The growth of the SCOF layer plays a crucial role in the rejection of dye molecules, with its efficient retention of dye molecules primarily attributed to the formation of a defect-free SCOF layer. After considering both key performance indicators, flux and rejection, a C-T deposition time of 10 hours was selected for subsequent experimental exploration.
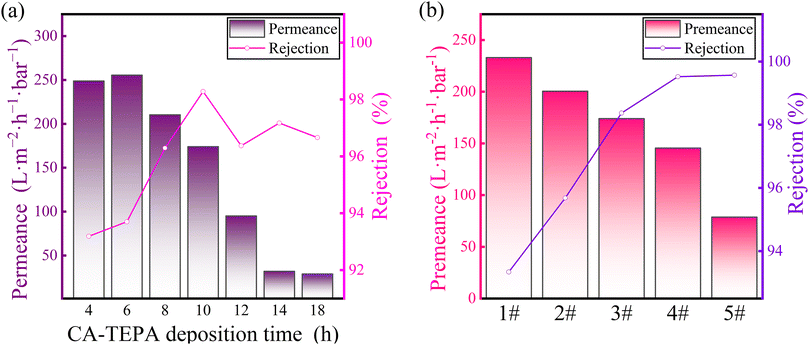 | ||
| Fig. 3 Influence of conditions on membrane efficacy: (a) C-T deposition time (b) monomer concentration for SCOF synthesis. | ||
The reactant concentrations for synthesizing SCOF were adjusted according to the formulations set in Table 2, with the interfacial polymerization time fixed at 2 minutes. DABA and TFP were prepared in a molar ratio of 3![[thin space (1/6-em)]](https://www.rsc.org/images/entities/char_2009.gif) :
:![[thin space (1/6-em)]](https://www.rsc.org/images/entities/char_2009.gif) 2 based on functional group reactions. Fig. 3(b) shows that as the monomer concentration increases, the rejection for CR dye shows an upward trend. This indicates that increasing the monomer concentration helps in forming a defect-free SCOF, more effectively blocking the permeation of CR dye, thereby effectively enhancing the membrane's ability to retain CR dye. As the monomer concentration for synthesizing SCOF increases, the permeate flux of the modified membrane also gradually decreases. This phenomenon occurs because higher monomer concentrations during the interfacial polymerization rocess lead to a greater quantity of SCOF forming on the membrane surface, resulting in a thicker modification layer and, consequently, an increased resistance to solute transfer through the modified membrane. Therefore, after balancing the two key performance indicators, rejection and permeate flux, a ratio of DABA monomer concentration at 9 mmol L−1 and TFP concentration at 6 mmol L−1 was determined as the condition for achieving the best separation performance.
2 based on functional group reactions. Fig. 3(b) shows that as the monomer concentration increases, the rejection for CR dye shows an upward trend. This indicates that increasing the monomer concentration helps in forming a defect-free SCOF, more effectively blocking the permeation of CR dye, thereby effectively enhancing the membrane's ability to retain CR dye. As the monomer concentration for synthesizing SCOF increases, the permeate flux of the modified membrane also gradually decreases. This phenomenon occurs because higher monomer concentrations during the interfacial polymerization rocess lead to a greater quantity of SCOF forming on the membrane surface, resulting in a thicker modification layer and, consequently, an increased resistance to solute transfer through the modified membrane. Therefore, after balancing the two key performance indicators, rejection and permeate flux, a ratio of DABA monomer concentration at 9 mmol L−1 and TFP concentration at 6 mmol L−1 was determined as the condition for achieving the best separation performance.
| Membrane | CA (mmol L−1) | TEPA (mmol L−1) | C-T time (h) | DABA (mmol L−1) | TFP (mmol L−1) |
|---|---|---|---|---|---|
| 1# | 10 | 10 | 10 | 3.0 | 2.0 |
| 2# | 10 | 10 | 10 | 6.0 | 4.0 |
| 3# | 10 | 10 | 10 | 9.0 | 6.0 |
| 4# | 10 | 10 | 10 | 12.0 | 8.0 |
| 5# | 10 | 10 | 10 | 24.0 | 16.0 |
In summary, the C-T deposition time and the monomer concentration for synthesizing SCOF are key factors affecting the performance of the modified membrane. After considering preparation efficiency, membrane permeability, and solute retention rate, a C-T co-deposition time of 10 hours, a DABA monomer concentration of 9 mmol L−1, and a TFP concentration of 6 mmol L−1 were determined as the optimal conditions. Membranes prepared based on these parameters will undergo further testing and characterization to evaluate their performance.
Characterisation of SCOF/C-T/PAN films
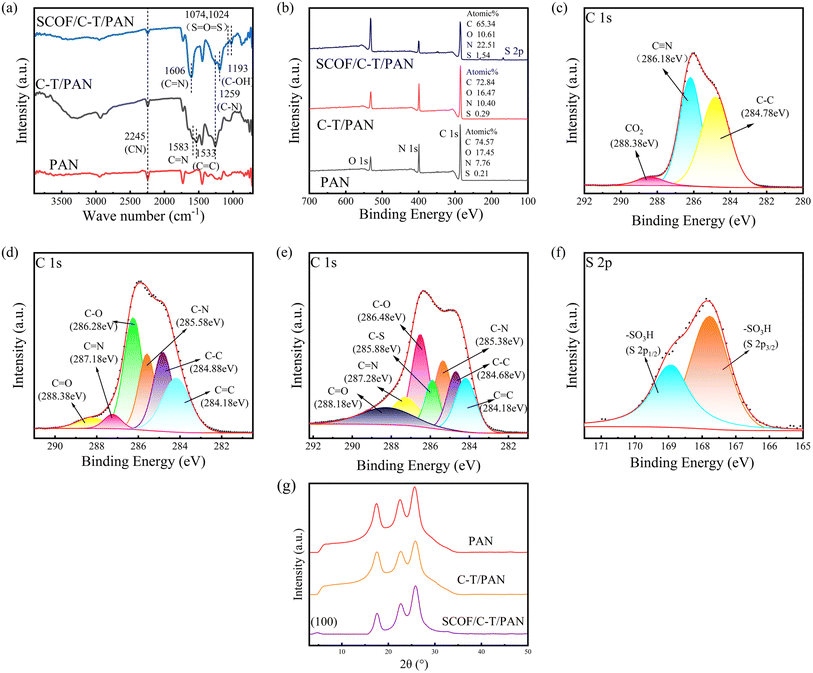
The chemical property changes of the modified membrane before and after preparation were analyzed using ATR-FTIR and XPS. Fig. 4(a) displays the ATR-FTIR spectra comparison between the original PAN membrane and the modified C-T/PAN membrane. Compared to the original PAN membrane, the C-T/PAN membrane exhibits three new absorption peaks at 1259 cm−1, 1533 cm−1, and 1583 cm−1, which are attributed to the stretching vibrations of C–N, C![[double bond, length as m-dash]](https://www.rsc.org/images/entities/char_e001.gif) C, and C
C, and C![[double bond, length as m-dash]](https://www.rsc.org/images/entities/char_e001.gif) N, respectively. These results confirm the successful occurrence of Michael addition and Schiff base reactions.39,40 The infrared spectroscopy analysis of the SCOF/C-T/PAN membrane revealed an absorption peak at 1193 cm−1, attributed to the stretching vibration of phenolic C–OH on TFP. Additionally, the double absorption peaks located at 1074 cm−1 and 1024 cm−1 correspond to the stretching vibrations of aromatic sulfonic SO2 in DABA. The presence of these characteristic peaks further confirms the successful deposition and modification of SCOF, indicating significant changes in the chemical structure of the membrane surface.32,41,42
N, respectively. These results confirm the successful occurrence of Michael addition and Schiff base reactions.39,40 The infrared spectroscopy analysis of the SCOF/C-T/PAN membrane revealed an absorption peak at 1193 cm−1, attributed to the stretching vibration of phenolic C–OH on TFP. Additionally, the double absorption peaks located at 1074 cm−1 and 1024 cm−1 correspond to the stretching vibrations of aromatic sulfonic SO2 in DABA. The presence of these characteristic peaks further confirms the successful deposition and modification of SCOF, indicating significant changes in the chemical structure of the membrane surface.32,41,42
To gather more insights into the chemical compositions of the original and modified membranes, XPS was employed to examine the compositions and proportions of elements C, N, O, S on the surfaces of the PAN original membrane and the modified membranes. Fig. 4(b) illustrates the complete XPS spectra of the surface elements for the PAN original membrane, C-T/PAN membrane, and SCOF/C-T/PAN membrane, allowing for the observation of changes in the composition of surface elements. Compared to the original PAN membrane, the O content in the C-T/PAN membrane increased significantly from 7.76% to 10.40%, indicating the successful deposition of CA-TEPA on the membrane surface. After the interfacial polymerization reaction for synthesizing SCOF, the O content in the SCOF/C-T/PAN membrane markedly increased to 22.51%, and the S content rose to 1.54%. This change is attributed to the S from the sulfonic acid groups in DABA and the O in both DABA and TFP, leading to an increased O content on the membrane surface during the reaction process. The peak fittings of the C 1 s fine spectra for the PAN original membrane and the C-T/PAN membrane, as shown in Fig. 4(c) and (d), reveal new peaks at 284.18 eV, 285.58 eV, 286.28 eV, 287.18 eV, and 288.38 eV for the C-T/PAN membrane compared to the original membrane. The emergence of these new peaks is attributed to CA and the occurrence of Michael addition and Schiff base reactions with TEPA, introducing C![[double bond, length as m-dash]](https://www.rsc.org/images/entities/char_e001.gif) C, C–N, C–O, C
C, C–N, C–O, C![[double bond, length as m-dash]](https://www.rsc.org/images/entities/char_e001.gif) N, and C
N, and C![[double bond, length as m-dash]](https://www.rsc.org/images/entities/char_e001.gif) O bonds.43,44 Fig. 4(e) and (f) respectively present the peak fitting results for the C 1s and S 2p fine spectra of the SCOF/C-T/PAN membrane. Compared to the C-T/PAN membrane, an additional absorption peak at 285.88 eV in the SCOF/C-T/PAN membrane signifies the introduction of C–S bonds within the SCOF layer formed by interfacial polymerization. Furthermore, Fig. 4(f) shows two absorption peaks at 167.78 eV and 168.98 eV attributed to the S 2p3/2 and S 2p1/2 of –SO3H, respectively.42,45,46 These results further confirm the successful deposition of the C-T modification layer and the uniform growth of SCOF on the membrane, providing clear evidence for the modified membrane's structure and functionality.
O bonds.43,44 Fig. 4(e) and (f) respectively present the peak fitting results for the C 1s and S 2p fine spectra of the SCOF/C-T/PAN membrane. Compared to the C-T/PAN membrane, an additional absorption peak at 285.88 eV in the SCOF/C-T/PAN membrane signifies the introduction of C–S bonds within the SCOF layer formed by interfacial polymerization. Furthermore, Fig. 4(f) shows two absorption peaks at 167.78 eV and 168.98 eV attributed to the S 2p3/2 and S 2p1/2 of –SO3H, respectively.42,45,46 These results further confirm the successful deposition of the C-T modification layer and the uniform growth of SCOF on the membrane, providing clear evidence for the modified membrane's structure and functionality.
As depicted in Fig. 4(g), XRD analysis of the SCOF/C-T/PAN membrane at different stages of modification revealed no significant structural changes before and after the deposition of the phenolic amine network. After interfacial polymerization, a characteristic (100) peak at 4.8° in the XRD spectrum indicated a regular repeating distance along the edges of the hexagonal lattice system, suggesting the formation of an ordered hexagonal structure, he pore diameter of the synthesized SCOF is approximately 1.4 nm.14,38 The width of the diffraction peak indicates the polycrystalline nature of the SCOF formed.
Fig. 5 (a–c) display the original photographs of the PAN original membrane and the modified membranes. As seen in the images, the original white PAN membrane turns light brown after modification with C-T, with the color distributed evenly, indicating that the modification process was successful and the modification layer is uniformly distributed. After the interfacial polymerization reaction, the color of the membrane changes from brown to orange-yellow, and the color remains evenly distributed, further confirming the uniform growth of the SCOF layer. F-SEM was used to examine the surface morphology of the original PAN membrane and the modified membranes. Fig. 5(a1) and (a2) show that the surface of the original PAN membrane has numerous uniform pores, creating interconnected circular pore structures. After phenol–amine self-polymerization and deposition on the membrane surface, as illustrated in Fig. 5(b1) and (b2), there is a noticeable reduction in surface pores, yet a few interconnected circular pores remain visible. This suggests that the C-T/PAN membrane retains the original microporous structure without the observation of microparticle formation on the surface. It indicates that phenol–amine forms a selective layer on the membrane surface, which tends to form a film rather than microparticles. Fig. 5(c1) and (c2) display the surface morphology of the membrane after interfacial polymerization, showing a rougher texture on the membrane surface. Some pores are covered by newly formed layers, and the continuous pore structure disappears, replaced by surfaces populated with circular small pores. These observations indicate that a stable modified layer has successfully formed on the membrane surface. These photographs and SEM images visually confirm the success of the membrane modification technique, demonstrating significant changes in the surface morphology of the modified membrane and the uniform, stable coverage of the modification layer on the membrane surface.
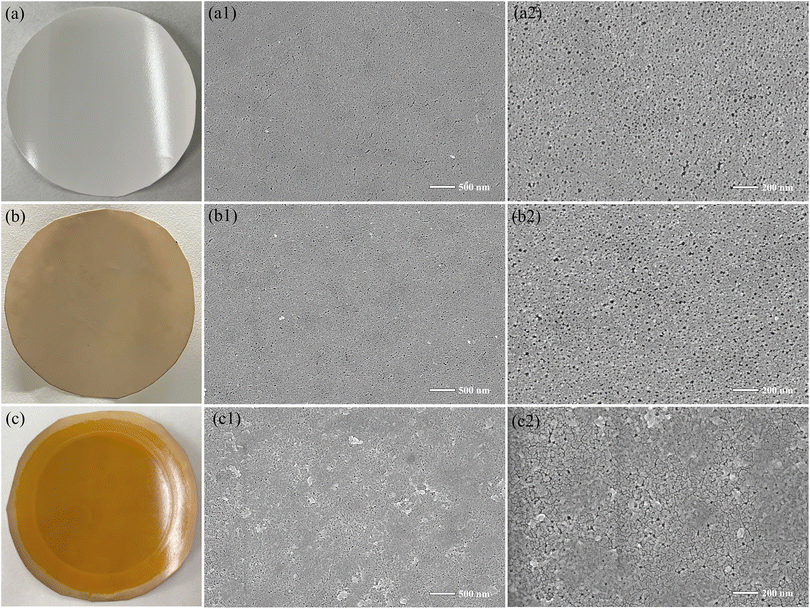 | ||
| Fig. 5 Photos and SEM images: (a) PAN, (b) C-T/PAN, (c) SCOF/C-T/PAN, with respective SEM images (a1), (a2) for PAN, (b1), (b2) for C-T/PAN, and (c1), (c2) for SCOF/C-T/PAN. | ||
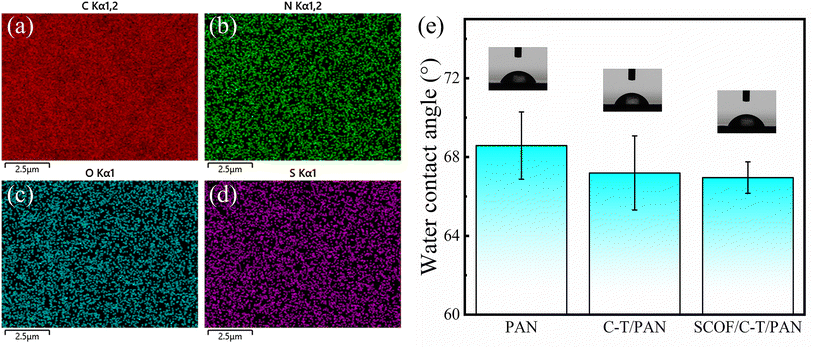
EDS was utilized to perform a detailed analysis of the elemental distribution on the surface of the SCOF/C-T/PAN membrane. Fig. 6(a–d) illustrates the uniform distribution of the four key elements—C, N, O, and S—on the membrane surface, demonstrating that the modification layer is tightly and uniformly bonded with the original membrane. Specifically, the O element is mainly derived from CA, DABA, and TFP, while the N element comes from TEPA and DABA. The C element, being the primary constituent in both the original PAN membrane and during its modification steps, is extensively distributed across the membrane surface. Notably, the presence of the S element is attributed to the sulfonic acid groups in DABA, further confirming DABA's successful incorporation into the synthesis process of SCOF.
The hydrophilicity of the PAN original membrane and the modified membranes was evaluated by measuring the static water contact angle. Fig. 6(e) shows that the water contact angle of the PAN membrane remained around 68°, both before and after modification. This phenomenon could be due to the hydrophobic benzene ring structures in the modification layer counteracting the effects of hydrophilic groups (such as –OH, –NH2, and –SO3H) on the membrane surface, leading to no significant change in overall hydrophilicity. However, the SCOF/C-T/PAN membrane exhibited the lowest static water contact angle, indicating a slight improvement in hydrophilicity compared to other membrane samples, even though the increase in hydrophilicity was not pronounced.
Filtration performance of SCOF/C-T/PAN membrane
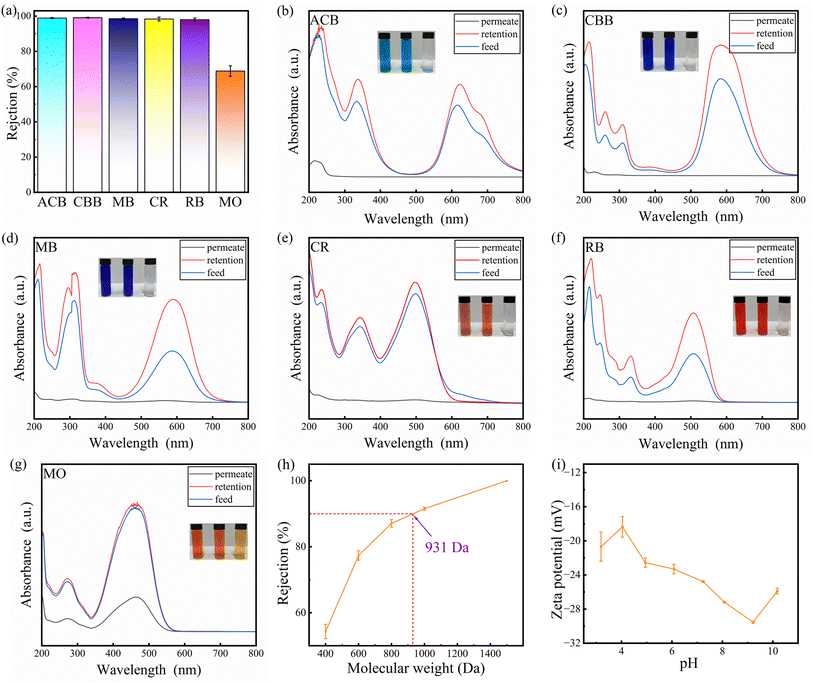
This reflects the SCOF structure's capacity for selective separation based on molecular size. To determine the MWCO of the SCOF/C-T/PAN membrane and to eliminate the influence of Donnan effects, non-ionic substances such as PEG 400, 600, 800, 1000, and 1500 were used to test the membrane. As shown in Fig. 7(h), when the MWCO of the SCOF/C-T/PAN membrane reaches 931 Da, its retention rate is 90%. The effectiveness of the retention rate, besides being influenced by the size exclusion mechanism, is also significantly affected by the regulation of the membrane surface charge properties. The introduction of TFP and CA enriches the membrane surface with more anionic hydroxyl groups, while the sulfonic acid groups in DABA also carry negative charges. The synergistic effect of these charged groups results in the formation of a lower isoelectric point on the membrane surface. This negative charge characteristic of the membrane surface further enhances the electrostatic attraction to dye molecules, thereby improving the efficiency of dye retention.37
The modified membrane exhibited high retention for anionic dyes with size characteristics longer than 1.4 nm and narrower than 1.4 nm (e.g., CR), which is likely largely due to electrostatic repulsion. Fig. 7(i) displays the surface zeta potential of the SCOF/C-T/PAN membrane within the pH range of 3 to 10. At pH = 7, the membrane shows a zeta potential of −24.47 mV, providing effective electrostatic repulsion against anionic dyes, successfully separating anionic dyes smaller than the pore size of SCOF. Moreover, the presence of TEPA in the modified membrane, whose –NH2 groups protonate in water to form –NH3+, provides the membrane with a repulsion function in the middle layer against cationic dyes (such as ACB).47 This repulsion effect results in the efficient retention of cationic dyes as well. Therefore, the combined contribution of size exclusion and charge repulsion by SCOF enables the modified membrane to exhibit exceptional performance in dye separation applications.39 Fig. 7(b–f) further confirm this, showing that the filtrate of most dye solutions treated by the modified membrane becomes clear, clearly demonstrating the modified membrane's strong separation capability for various types of dyes.
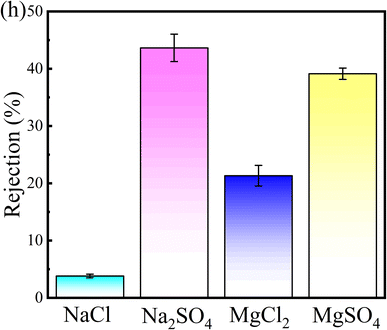
The performance of the modified membrane in the separation of inorganic salts is shown in Fig. 8, where the rejection for NaCl is relatively low, at only 3.82%, which is particularly important in the initial stages of dye-salt separation. The rejection for Na2SO4, MgCl2, and MgSO4 are 39.12%, 21.32%, and 43.64%, respectively, demonstrating varied retention capabilities for different salts. Notably, the modified membrane exhibits a higher retention rate for sulfates compared to chlorides. This phenomenon is primarily due to the larger diameter of divalent hydrated SO42− ions compared to monovalent hydrated Cl− ions, as well as the greater negative charge of SO42− over Cl−.48 These separation results indicate that the modified membrane can effectively retain dyes while allowing some inorganic salts to pass through.
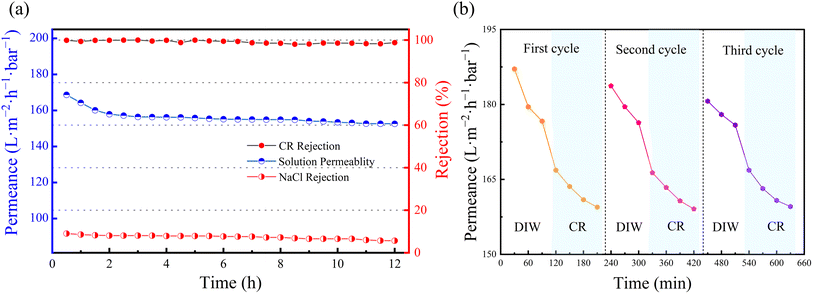 | ||
| Fig. 10 (a) Sustained separation in CR and NaCl mixture by SCOF/C-T/PAN membrane; (b) permeation flux variations of SCOF/C-T/PAN membrane over three cycles. | ||
Repeatability is critical for the practical application value of membranes. SCOF/C-T/PAN membranes were subjected to three cycles of testing to evaluate their repeatability. In each cycle, the pure water flux was first assessed using DIW, and then the membrane's permeability was tested with a CR (100 ppm) dye solution, with measurements taken every 30 minutes. After testing, the membranes were washed with DIW. Fig. 10(b) shows the permeation flux changes after three cycles of testing, where a rapid decline in the initial pure water flux was observed, followed by a sharp decrease and subsequent stabilization during dye separation. This may be attributed to the accumulation of dye molecules on the membrane surface or within its pores, causing partial pore blockage and an increase in mass transfer resistance. Despite some flux loss after washing, the membrane demonstrated adequate flux recovery, indicating good antifouling capabilities. The SCOF/C-T/PAN membrane exhibited satisfactory repeatability, which is vital for ensuring its sustainable use in practical applications.
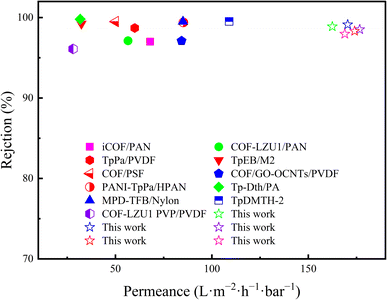
| Membrane type | Dye | Dye weight (g mol−1) | Rejection (%) | Permeance (LMH bar−1) | Ref. |
|---|---|---|---|---|---|
| iCOF/PAN | RB | 1048 | 97 | 68 | 49 |
| COF-LZU1/PAN | Aniline blue | 738 | 97.12 | ∼56.5 | 50 |
| TpPa/PVDF | CR | 697 | 98.7 | 60 | 51 |
| TpEB/M2 | CR | 697 | 99.23 | 32.34 | 52 |
| COF/PSF | CR | 697 | 99.5 | 50 | 8 |
| COF/GO-OCNTs/PVDF | CBB | 858 | 97.1 | 84.3 | 53 |
| PANI-TpPa/HPAN | CR | 697 | 99.4 | 85.2 | 54 |
| Tp-Dth/PA | ACB | 1299 | 99.8 | 31.7 | 33 |
| MPD-TFB/Nylon | CBB | 858 | 99.5 | ∼85 | 55 |
| TpDMTH-2 | CBB | 858 | 99.51 | ∼109 | 56 |
| COF-LZU1 PVP/PVDF | MB | 799 | 96.1 | ∼28 | 57 |
| This work | ACB | 1299 | 98.88 | 162.47 | — |
| This work | CBB | 858 | 99.12 | 170.42 | — |
| This work | MB | 799 | 98.52 | 176.67 | — |
| This work | CR | 697 | 98.32 | 173.99 | — |
| This work | RB | 1048 | 97.96 | 168.94 | — |
Conclusions
In this work, a successful strategy of polyphenol/polyamine-assisted synthesis of COFs was employed to construct a C-T pretreatment layer on a PAN ultrafiltration membrane. Furthermore, through Michael addition and Schiff base reactions between quinone groups and amines, a SCOF membrane was successfully synthesized on the C-T/PAN membrane. Detailed characterizations by FTIR, XPS, XRD, Zeta potential and EDS confirmed that the phenol–amine network layer effectively served as a molecular tether to attract and anchor the building monomers of SCOF, facilitating uniform growth of SCOF on the membrane surface. Through meticulous optimization of the phenol–amine deposition time and SCOF monomer concentration, a C-T deposition time of 10 hours and optimal concentrations of DABA and TFP at 9 mmol L−1 and 6 mmol L−1, respectively, were determined. Under these conditions, the SCOF layer formed flawlessly, achieving optimal retention performance and permeate flux. The optimized SCOF/C-T/PAN membrane exhibited outstanding water permeability and efficient solute removal performance, particularly displaying over 98% dye removal for dyes such as ACB, CBB, MB, CR, and RB, while also showing a lower salt retention rate. In long-term continuous separation processes, the membrane exhibited more than 98% retention rate for CR dye and less than 10% retention rate for salts in simulated wastewater, while also demonstrating good reusability. Hence, this work not only demonstrates the significant application potential of the phenol–amine network-assisted COF synthesis strategy in the field of water treatment, especially in separating dyes and recovering inorganic salts in textile wastewater treatment but also provides a simple and effective approach for the practical application of COF materials in environmental remediation.Author contributions
Zekun Zhou: responsible for conceptualization, data curation, formal analysis, conducting experiments, drafting the original manuscript, and review & editing; Zezhen Zhang: responsible for conceptualization, data curation, formal analysis, and software operation; Shuman Feng: responsible for conceptualization, data curation, and formal analysis; Lulu Liu: responsible for validation, formal analysis, and methodology design; Weishan Deng: responsible for validation, formal analysis, and conducting investigations; Lili Wu: responsible for project administration, resource acquisition, supervision, visualization, and review & editing.Conflicts of interest
The authors declare no known competing financial interests or personal relationships that could have appeared to influence the work reported in this paper.Acknowledgements
This study was supported by Guangdong Pustar Adhesives & Sealants Co. Ltd.References
- X. Zhang, X. Du, Y. Ke, Y.-G. Zhang and Z.-K. Xu, J. Membr. Sci., 2021, 640, 119821 CrossRef CAS.
- A. Kanwal, R. Rehman, M. Imran, G. Samin, M. M. Jahangir and S. Ali, RSC Adv., 2023, 13, 26455–26474 RSC.
- X. H. Chen, X. A. Ning, X. J. Lai, Y. Wang, Y. P. Zhang and Y. He, J. Hazard. Mater., 2021, 416, 125721 CrossRef CAS PubMed.
- H. Demissie, G. Y. An, R. Y. Jiao, T. Ritigala, S. Lu and D. S. Wang, Sep. Purif. Technol., 2021, 259, 117845 CrossRef CAS.
- L. Z. Xia and Q. Liu, J. Solid State Chem., 2016, 244, 1–5 CrossRef CAS.
- S. M. Unni, L. George, S. N. Bhange, R. N. Devi and S. Kurungot, RSC Adv., 2016, 6, 82103–82111 RSC.
- Y. B. Meng, Y. C. Huang, G. L. Huang and Y. P. Song, RSC Adv., 2023, 13, 28148–28157 RSC.
- R. Wang, X. S. Shi, A. K. Xiao, W. Zhou and Y. Wang, J. Membr. Sci., 2018, 566, 197–204 CrossRef CAS.
- C. Jiang, M. Tang, S. Zhu, J. Zhang, Y. Wu, Y. Chen, C. Xia, C. Wang and W. Hu, Angew. Chem., Int. Ed. Engl., 2018, 57, 16072–16076 CrossRef CAS PubMed.
- R. Li, X. Tang, J. Wu, K. Zhang, Q. Zhang, J. Wang, J. Zheng, S. Zheng, J. Fan, W. Zhang, X. Li and S. Cai, Chem. Eng. J., 2023, 464, 142706 CrossRef CAS.
- Y. J. Li, W. R. Cui, Q. Q. Jiang, R. P. Liang, X. J. Li, Q. Wu, Q. X. Luo, J. W. Liu and J. D. Qiu, ACS Appl. Mater. Interfaces, 2021, 13, 47921–47931 CrossRef CAS PubMed.
- H. Y. Zhang, Y. B. Geng, J. Huang, Z. X. Wang, K. Du and H. Y. Li, Energy Environ. Sci., 2023, 16, 889–951 RSC.
- Z. F. Wang, S. N. Zhang, Y. Chen, Z. J. Zhang and S. Q. Ma, Chem. Soc. Rev., 2020, 49, 708–735 RSC.
- Y. Xie, T. Pan, Q. Lei, C. Chen, X. Dong, Y. Yuan, W. A. Maksoud, L. Zhao, L. Cavallo, I. Pinnau and Y. Han, Nat. Commun., 2022, 13, 2878 CrossRef CAS PubMed.
- Y. Yang, S. Wu, Y. Yan, X. Tang, S. L. Cai, S. G. Zheng, W. G. Zhang and F. L. Gu, Chem. Res. Chin. Univ., 2021, 42, 956–964 Search PubMed.
- Y. Y. Su, X. Yan, Y. Chen, X. J. Guo, X. F. Chen and W. Z. Lang, J. Membr. Sci., 2021, 618, 117706 CrossRef.
- S. Hao, L. Jiang, Y. L. Li, Z. Q. Jia and B. Van der Bruggen, Chem. Commun., 2020, 56, 419–422 RSC.
- F. S. Pan, W. X. Guo, Y. L. Su, N. A. Khan, H. Yang and Z. Y. Jiang, Sep. Purif. Technol., 2019, 215, 582–589 CrossRef CAS.
- H. Lee, S. M. Dellatore, W. M. Miller and P. B. Messersmith, Science, 2007, 318, 426–430 CrossRef CAS PubMed.
- Y. L. Liu, K. L. Ai and L. H. Lu, Chem. Rev., 2014, 114, 5057–5115 CrossRef CAS PubMed.
- J. Zhu, A. Uliana, J. Wang, S. Yuan, J. Li, M. Tian, K. Simoens, A. Volodin, J. Lin, K. Bernaerts, Y. Zhang and B. Van der Bruggen, J. Mater. Chem. A, 2016, 4, 13211–13222 RSC.
- T. S. Sileika, D. G. Barrett, R. Zhang, K. H. Lau and P. B. Messersmith, Angew. Chem., Int. Ed. Engl., 2013, 52, 10766–10770 CrossRef CAS PubMed.
- H. Wang, J. J. Wu, C. Cai, J. Guo, H. S. Fan, C. Z. Zhu, H. X. Dong, N. Zhao and J. Xu, ACS Appl. Mater. Interfaces, 2014, 6, 5602–5608 CrossRef CAS PubMed.
- Z. Z. Zhang, Y. Y. Zhao, X. Luo, S. M. Feng and L. L. Wu, Appl. Surf. Sci., 2022, 572, 151440 CrossRef CAS.
- X. Luo, S. Feng, Z. Zhang, L. Liu, L. Wu and C. Zhang, J. Mater. Sci., 2022, 57, 9002–9017 CrossRef CAS.
- Y. Q. Xu, G. B. Peng, J. B. Liao, J. N. Shen and C. J. Gao, J. Membr. Sci., 2020, 601, 117727 CrossRef CAS.
- W. Z. Qiu, Y. Lv, Y. Du, H. C. Yang and Z. K. Xu, RSC Adv., 2016, 6, 34096–34102 RSC.
- D. G. Barrett, T. S. Sileika and P. B. Messersmith, Chem. Commun., 2014, 50, 7265–7268 RSC.
- M. B. Asif, S. Kim, T. S. Nguyen, J. Mahmood and C. T. Yavuz, J. Am. Chem. Soc., 2024, 146, 3567–3584 CrossRef CAS PubMed.
- Y. C. Xu, D. X. Guo, T. Li, Y. R. Xiao, L. G. Shen, R. J. Li, Y. Jiao and H. J. Lin, J. Colloid Interface Sci., 2020, 565, 23–34 CrossRef CAS PubMed.
- C. Wu, X. Wang, T. Zhu, P. Li and S. Xia, Chemosphere, 2020, 261, 127580 CrossRef CAS PubMed.
- J. Shen, R. Zhang, Y. Su, B. Shi, X. You, W. Guo, Y. Ma, J. Yuan, F. Wang and Z. Jiang, J. Mater. Chem. A, 2019, 7, 18063–18071 RSC.
- Y. X. Yang, W. D. Ma, G. R. Li, C. Zhong, X. Yan, W. N. Huang, S. S. Zhang, Z. W. Cai and Z. A. Lin, ACS Appl. Nano Mater., 2021, 4, 13967–13975 CrossRef CAS.
- J. J. Han, Q. Y. Zhang, M. Y. Huang, Y. Chen, X. Yan and W. Z. Lang, Desalination, 2020, 480, 114380 CrossRef CAS.
- K. Li, J. Y. Zhu, D. C. Liu, Y. T. Zhang and B. Van der Bruggen, Chem. Mater., 2021, 33, 7047–7056 CrossRef CAS.
- Y. Mei, K. Yu, H. Yazdani-Ahmadabadi, D. Lange and J. N. Kizhakkedathu, ACS Appl. Mater. Interfaces, 2022, 14, 39577–39590 CrossRef CAS PubMed.
- P. Fu, D. Zhou, W.-L. Li, W.-T. Lin, X.-J. Huang, Z.-K. Xu and L.-S. Wan, Desalination, 2023, 566, 116946 CrossRef CAS.
- Y. W. Peng, G. D. Xu, Z. G. Hu, Y. D. Cheng, C. L. Chi, D. Q. Yuan, H. S. Cheng and D. Zhao, ACS Appl. Mater. Interfaces, 2016, 8, 18505–18512 CrossRef CAS PubMed.
- Y. Cao, H. Zhang, S. Guo, J. Luo and Y. Wan, J. Membr. Sci., 2021, 629, 119287 CrossRef CAS.
- Z. Shi, Y. Zhang, R. Dai, S. Chen, M. Zhang, L. Jin, J. Wang, W. Zhao and C. Zhao, Colloids Surf., B, 2020, 186, 110728 CrossRef CAS PubMed.
- Y. Wang, L. Ren, J. Wang, J. Zhao and Q.-B. Chen, J. Membr. Sci., 2022, 659, 120818 CrossRef CAS.
- L. L. Huang, C. C. Song, Y. C. Liu, H. Lin, W. Y. Ye, H. Huang, R. W. Lu and S. F. Zhang, Microporous Mesoporous Mater., 2021, 318, 111024 CrossRef CAS.
- H. K. Li, Y. X. An, E. H. Zhang, S. N. Zhou, M. X. Li, Z. J. Li, X. Li, R. Yuan, W. Zhang and H. He, Anal. Chim. Acta, 2022, 1223, 340204 CrossRef CAS PubMed.
- X. Liu, X. Wang, W. Jiang, C.-R. Zhang, L. Zhang, R.-P. Liang and J.-D. Qiu, Chem. Eng. J., 2022, 450, 138062 CrossRef CAS.
- Y. Zhao, Y. Li, J. Zhu, A. Lejarazu-Larrañaga, S. Yuan, E. Ortega, J. Shen, C. Gao and B. Van der Bruggen, J. Mater. Chem. A, 2019, 7, 13903–13909 RSC.
- Z. J. Zhao, Y. J. Li, D. Jin and B. Van der Bruggen, Colloids Surf., A, 2021, 615, 126267 CrossRef CAS.
- F. M. Sheng, X. Y. Li, Y. Y. Li, N. U. Afsar, Z. Zhao, L. Ge and T. W. Xu, J. Membr. Sci., 2022, 644, 120118 CrossRef CAS.
- J. Joseph, Y. A. Boussouga, M. Di Vincenzo, M. Barboiu and A. I. Schäfer, J. Membr. Sci., 2022, 664, 121019 CrossRef CAS.
- Q. Miao, Y. Wang, D. Chen, N. Cao and J. Pang, J. Hazard. Mater., 2024, 465, 133049 CrossRef CAS PubMed.
- S. Hao, J. Wen, S. Li, J. Wang and Z. Jia, J. Mater. Sci., 2020, 55, 14817–14828 CrossRef CAS.
- R. Wang, X. Shi, Z. Zhang, A. Xiao, S.-P. Sun, Z. Cui and Y. Wang, J. Membr. Sci., 2019, 586, 274–280 CrossRef CAS.
- N. Basel, Q. Liu, L. Fan, Q. Wang, N. Xu, Y. Wan, Q. Dong, Z. Huang and T. Guo, Sep. Purif. Technol., 2022, 303, 122243 CrossRef CAS.
- M. Qian, X. Yan, Y. Chen, X. J. Guo and W. Z. Lang, J. Colloid Interface Sci., 2022, 622, 11–20 CrossRef CAS PubMed.
- C. Mao, S. Zhao, P. He, Z. Wang and J. Wang, Chem. Eng. J., 2021, 414, 128929 CrossRef CAS.
- Y.-X. Fang, Y.-F. Lin, Z.-L. Xu, J.-W. Mo and P.-P. Li, J. Membr. Sci., 2023, 673, 121470 CrossRef CAS.
- J.-Y. Dai, Y.-X. Fang, Z.-L. Xu, D. Pandaya, J. Liang, H.-F. Yan and Y.-J. Tang, Desalination, 2023, 568, 117025 CrossRef CAS.
- Y. Pan, Z. Li, S. Shen, D. Liu and G. Zhang, Colloids Surf., A, 2024, 686, 133431 CrossRef CAS.
Footnote |
| † These two authors contribute equally to this work. |
| This journal is © The Royal Society of Chemistry 2024 |

