 Open Access Article
Photocatalytic degradation of methyl blue dye with H2O2 sensing†
Priyanka Sharma,
Mainak Ganguly * and
Mamta Sahu
Department of Chemistry, Manipal University Jaipur, Jaipur-Ajmer Express Highway, Dehmi Kalan, Jaipur, Rajasthan 303007, India. E-mail: humansense2009@gmail.com
First published on 3rd May 2024
Abstract
A condensation polymer (urea-formaldehyde resin) passivated ZnO nanoparticles were used as an efficient photocatalyst for methyl blue degradation in the presence of H2O2 involving a Fenton-like reaction. The formation of OH˙ radicals were attributed to the pivotal factor for the degradation process. The method was easy and recyclable. The dose of photocatalyst, initial dye concentration, pH variation, variations of the composition of the photocatalyst, and the effect of scavengers were gauged. The degraded product was highly fluorescent and fluorometric detection of H2O2 was achieved along with a colorimetric recognition pathway. No other dye could be degraded under similar experimental conditions, implying the novel utility of methyl blue for environmental remediation.
1 Introduction
Paper, plastics, leather, pharmaceuticals, food, cosmetics, dyestuffs, and textile dye effluents have always been a severe environmental hazard.1 Several hues are poisonous and may have a direct impact on aquatic ecosystems.2 Dyes are organic molecules with a complex aromatic molecular structure that may give other materials a vibrant and vivid color. However, dyes' complex aromatic molecular structures render them extremely persistent, making biodegradation more difficult. Methyl blue (MB) is a popular dye, that is used as a coloring agent and disinfectant in dyestuffs, rubbers, pharmaceuticals, insecticides, and varnish.3Zinc oxide (ZnO) nanoparticles are inexpensive and easily manufactured on a big scale. ZnO is a heterogeneous n-type semiconductor with a large direct band gap of around 3.37 eV and an exciton binding energy of ∼60 meV.4 ZnO absorbs ultraviolet light (UV) at room temperature and responds poorly to visible light in the electromagnetic spectrum. This limits the intrinsic semiconductor's ability to function actively as a photocatalyst in the presence of a visible light source.5
Due to its potent oxidizing qualities, hydrogen peroxide (H2O2) has extensive applications in a range of chemical industries, food processing, environmental detection, and clinical treatment. H2O2 is also necessary for biological systems since it is a significant reactive oxygen species. For instance, human atherosclerosis, myocardial infection, and Alzheimer's disease have all been connected to unbalanced [H2O2]. According to a study, when [H2O2] levels are above 75 ppm, it is immediately harmful to human health.6 In general, sensing H2O2 is critical in biological and chemical applications because it can serve as a versatile marker or messenger in interconnected chemical events. To identify H2O2, a range of techniques (such as spectrophotometry, chemiluminescence,7 chromatography,8 and colorimetric analysis) have been published. They are relatively complex, expensive, time-consuming, and prone to interference.9 As a result, developing accurate, sensitive, easy, and quick detection of H2O2 is critical. Researchers have developed alternative techniques to satisfy comparable demands.
For the dye removal, two techniques were used. Adsorption is the purest and most friendly physical approach for the elimination of colors from contaminated aquatic bodies to save the lives of aquatic species and make the environment clean for human beings. A wide range of nanoparticles have been investigated for dye adsorption because of their high surface-to-volume ratio, which boosts adsorption capacity and efficiency, and the simplicity of altering surface functionality.10–12
Nanosized metal oxides, including MnO2, Fe2O3, and ZnO, are hypothesized to have the ability to adsorb dyes from aqueous solutions.10 With a large theoretical specific surface area, the actual application of ZnO in water cleaning, including decontamination and reuse, has received a lot of attention in recent years. ZnO has superior adsorption performance due to the presence of extra functional groups. Altıntıg et al.11 utilized activated carbon loaded with zinc oxide nanoparticles as an eco-friendly adsorbent to remove malachite green from water efficiently. Zhang et al.12 investigated the mechanism and adsorption of methyl blue on zinc oxide nanoparticles.
Adsorption is an effective method for removing colors, however, it cannot eliminate organic contaminants from contaminated aquatic systems. Because the effectiveness of developed adsorption systems is insufficient, the photocatalytic degradation pathway is used to break down water-soluble organic dyes, making the environment safe for aquatic life and humans. This is comparatively a long and time-consuming process, but it is also very ecologically friendly and cost-effective. The extent of the nature of adsorption can be estimated using various adsorption isotherms (Langmuir, Freundlich, Elovich).13,14
One of the most popular advanced remediation techniques is photocatalytic degradation, which leaves a persistent trace when attempting to break the cycle by removing water from wastewater, breaking down human waste using light, or eliminating airborne pollutants. A redox mechanism known as photocatalytic degradation produces e− and h+ on the surfaces of nanoparticles. To promote photocatalysis, it is essential to select materials that can absorb light at all wavelengths. Water reacts with generated h+ and e− ions to produce radicals (−O2˙ and –OH˙). The literature suggests that collecting impurities or states and generating crystal facets through microscopic surface design are essential for the greatest possible photocatalytic activity.
Venkatesan et al.15 showed that ZnO nanoparticles were produced by utilizing leaf extract from Solanum trilobatum. The catalytic activity of produced ZnO NPs against the degradation of methylene blue dye was assessed together with optical, structural, and morphological features. The materials carbon dots (CDs), ZnO–N nanoparticles, and CD/ZnO–N nanocomposites were used as photocatalysts in the photodegradation of [methylene blue] (10 ppm) using a UV-B lamp 75 W for 60 minutes at ambient temperature. The effect of pH on methylene blue decolorization, as well as a cyclic test to determine the stability and reusable nature of the CD/ZnO–N photocatalyst.16
Metal oxide nanoparticles are widely valued because of their non-toxicity, chemical and physical stability, and biological properties, among other factors. ZnO, an II–VI semiconductor compound, is unique among metal oxide nanomaterials due to its peculiar properties and numerous applications. ZnO has a high exciton binding energy (60 meV), excellent optical gain at ambient temperature, and a high saturation velocity, among other properties. The optical properties of ZnO semiconductor materials are impacted by both internal and external causes. As electrons move between the conduction and valence bands, intrinsic effects arise. Extrinsic variables, such as dopant type and concentration, produce discrete electronic states that influence optical absorption.17
Polymer capping of nanoparticles offers several advantages in various applications, primarily due to the unique properties of polymers and their ability to tailor the surface chemistry and functionality of nanoparticles. Polymers contributed improved stability, controlled dispersion, surface functionalization, biocompatibility, tunable properties, multifunctionality, scalability, and cost-effectiveness to nanoparticles.18
There are reports available for polymer-capped nanoparticles. Guo et al.19 used polyvinylpyrrolidone (PVP) as a capping polymer to stabilize ZnO nanoparticles. PVP surface treatment resulted in extremely monodisperse ZnO nanoparticles (3.760.3 nm) with increased UV luminescence and decreased visible luminescence. Tachikawa et al.20 showed the optical properties of PVP-passivated ZnO nanoparticles. Sarkar et al.21 reviewed the green polymeric nanomaterials for the degradation of dyes. Wang et al.22 and Muzammal et al.23 reviewed the polymer nanocomposite for photocatalytic degradation of azo dye.
Polymer is extensively used in modern research for the synthesis and protection of metal nanoparticles. We utilized CP, a condensation co-polymer of formaldehyde and urea24 Fig. SI, ESI† for the synthesis of ZnO nanoparticles for the first time. Here, CP-capped ZnO nanoparticles were employed to eliminate toxic dye MB and sense H2O2 for environmental remediation. As ZnO is a well-known photocatalyst, we gauged its activity for the photocatalysis of MB dye. Moreover, we depicted the H2O2 sensing protocol as a corollary of photocatalysis. In the future, we would like to venture into other probable applications.
2 Experimental section
2.1 Materials and instruments
Without further purification, all the chemicals employed in the studies were of analytical grade. Triple-distilled water was used throughout the process. All glassware was cleaned with freshly prepared aqua regia, followed by soapy water and copious amounts of distilled water. Before use, the glassware was carefully dried. All metal salts, including zinc sulphate, urea, and formaldehyde, were obtained from Sigma Aldrich. Fisher Scientific and Qualigens supplied the NaOH, respectively. Fisher Scientific offered buffer tablets to calibrate the pH meter.The Shimadzu UV-2600 digital spectrophotometer was used to collect all UV/Vis absorption spectra. The fluorescence was analyzed at room temperature using a Horiba FluoroMax-4 spectrometer. The JEOL Make JSM-7610FPlus FESEM, a high resolution (1 kV 1.0 nm, 15 kV 0.8 nm) scanning electron microscope with a wide range of probes, was used to investigate particle morphology. Samples were vacuum-dried for 24 hours before the FESEM experiment. Elemental analysis was performed using a JSM-7610F chamber equipped with an energy-dispersive X-ray spectrometer. For microscopic investigation, the water suspension was dried on carbon tape. pH solutions were produced using a Systronics Digital pH Meter 335. Liquid chromatography-mass spectra (LCMS) were recorded using a Xevo G2-S Q Tof mass spectrometer.
3 Results and discussion
3.1 Choice of MB
We disclosed MB dye for the sensing of H2O2 fluorometrically and colorimetrically. This paper also demonstrated the degradation of toxic MB dye via a fast cost-effective, recyclable, energetically favorable, and biocompatible pathway. Simultaneous detection and remediation of toxic materials are reported for the first time, the main essence of the paper. There are few reports available on the nanoparticle-based degradation of MB.25–34 Polymer-capped nanoparticles for MB elimination are not available in the literature.Though there are reports available for methylene blue degradation,35–51 there is no report in the literature for MB degradation in the presence of H2O2. Moreover, the origin of fluorescent species after the treatment of H2O2 and photocatalyst with dye for sensing applications is completely novel, as reported in this manuscript.
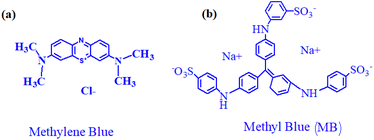
Since methylene blue is one of the most often used industrial dyes, it is frequently utilized in literature to evaluate the effectiveness of recently developed adsorbent materials. By employing hydrogels' swelling, adsorption, and water-holding capacities, methylene blue can be successfully removed from wastewater.49 [Fig. 1(a)].
Commonly used dye MB (C37H27N3Na2O9S3) is poisonous and nonbiodegradable. When released into the environment, it severely damages aquatic ecosystems by raising the chemical and biological oxygen demand of water bodies, decreasing light penetration, and interfering with photosynthesis.25 [Fig. 1(b)]. Table 1 summarizes the removal of MB in the presence of nanoparticles with physico-chemical conditions.
| Nanoparticles | Size/morphology | Removal technique adsorption/degradation | Rate constant (min−1) | Condition of removal | Apparatus to monitor |
|---|---|---|---|---|---|
| Zinc oxide (Guo et al.)19 | 25 ± 5 nm | Adsorption | — | Room temperature | UV-Vis spectrometer |
| Iron oxide26 | 12 nm/spherical | Adsorption | — | Room temperature | UV-Vis spectrometer |
| Fe3O4/SiO2 (Ali et al.)27 | 25 ± 5 nm | Adsorption | — | Room temperature | UV-Vis spectrometer |
| MgFe2O4 (Liu et al.)28 | 50 nm/polycrystalline | Adsorption | — | Room temperature | UV-Vis spectrometer |
| Fe3O4 (Fana et al.)29 | 100 nm/spherical | Adsorption | — | 30 °C | UV-Vis spectrometer |
| MnFe2O4 (Zhang et al.)30 | 86–94 nm | Adsorption | — | 298 K | UV-Vis spectrometer |
| Mn0.5Co0.5Fe2O4 (Liu et al.)31 | 25 nm/crystalline | Adsorption | — | Room temperature | UV-Vis spectrometer |
| Fe (NO3)3·9H2O (Azama et al.)32 | — | Adsorption | — | Room temperature | UV-Vis spectrometer |
| Co3O4 (Dhiman et al.)33 | 47 nm/spherical | Degradation | 0.023 | Solar | |
| ZnFe2O4 (Li et al.)34 | 18 nm/polycrystalline | Adsorption | — | Room temperature | UV-Vis spectrometer |
| ZnO (present study) | ∼800 nm/spherical | Degradation | 1 × 10⁻¹ | Sunlight | UV-Vis spectrometer/fluorometric |
The degradation of MB has only a few reports. No report is available for MB dye degradation employing H2O2. The present work is associated with a report of degradation, along with fluorometric and colorimetric sensing applications. We investigated with other dyes (methylene blue, methyl red, and methyl orange) employing a similar protocol (ZnO@CP/H2O2/sunlight). Fig. S2, ESI† denoted that removal of these dyes was not possible under similar experimental conditions. Thus, MB was very selective in our experimental conditions.
Many other toxic dyes (Congo red, methyl orange) are released from the industries,52,53 Pesticides,54 fungicides,55 novel dyes56 and discharged pharma ingredients,57 are also toxic and a threat to the environment. We will study the degradation of such toxic pollutants also in the future.
3.2 Photodegradation of MB with ZnO@CP in the presence of H2O2
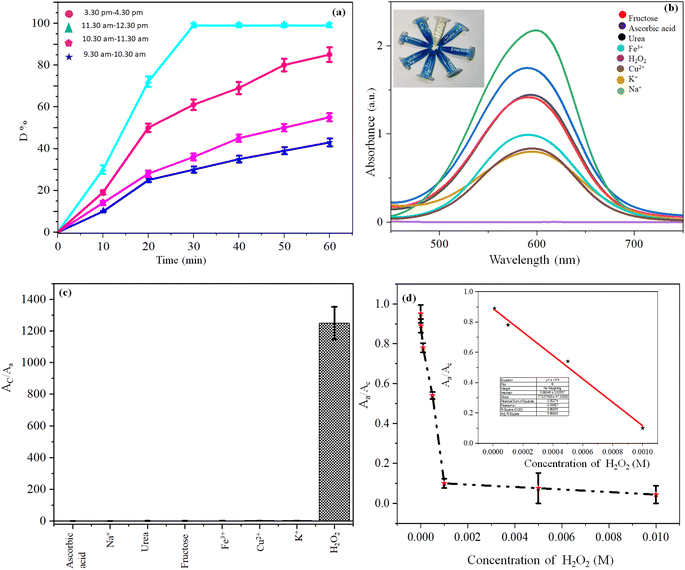
Zinc oxide-impregnated CP (ZnO@CP) was added in blue-colored MB (MBZnO@CP) solution under sunlight for 30 min. No significant change was observed in the solution. However, the introduction of H2O2 to Zn-impregnated CP and 30 min sunlight treatment made the solution colorless (ZnO@CPH). We also varied other metal ions (Ag+, Pb2+, Na+, K+, Cd2+, Co3+, Cr2+, Ni2+, Ba2+, Mg2+, Ca2+) in lieu of Zn2+ and repeated the synthetic procedure of metal impregnated CP. Interestingly, no metal ion could make the MB solution colorless, unlike Zn2+ under similar experimental conditions. Decolorization by ZnO@CPH was not affected by pH change. Such observation concluded that ZnO@CPH under sunlight exposure caused photochemical degradation of MB and it was an irreversible process. Fig. 2, depicted Aa/Ac (Aa = absorbance in the presence of different metal-impregnated CP + MB + H2O2; Ac = MB + H2O2). We exposed MB with ZnO@CPH at different time domains on a certain day. We found that between 11.30 am to 12.30 pm, the flux density was highest and photodegradation was faster (Fig. 3). We varied the exposure time and found that 30 min exposure could break MB (10−2 M) quantitively at that time domain. Thus, flux was directly proportional to the rate of degradation.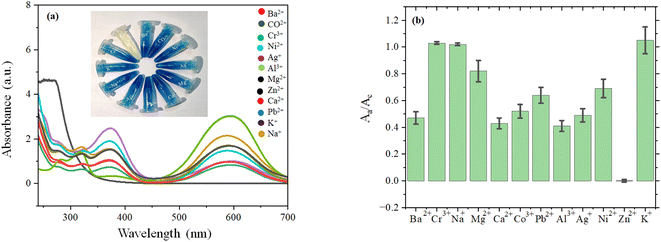 | ||
| Fig. 2 (a) UV-Vis spectra and digital image and (b) bar diagram of absorbance variation of different metals impregnated CP with MB dye (under 30 min sunlight exposure). | ||
3.3 Colorimetric sensing of H2O2
To understand the role of H2O2 we introduced fructose, ascorbic acid, urea, K+, Fe3+, Cu2+, and Na+ (competing molecules58 of H2O2) to ZnO@CP instead of H2O2. Such competitive reagents could not decolor MB, justifying the selectivity of the H2O2 sensor. As depicted in Fig. 3 Aa/Ac (Aa = absorbance of MBZnO@CP in the presence of analytes at 597 nm; Ac = absorbance of MBZnO@CP in the absence of analytes at 597 nm) was much lower for H2O2 (0.0008) than fructose (0.69), ascorbic acid (0.86), urea (0.71), K+ (0.42), Fe3+(0.48), Cu2+(0.39), Na+ (1.07). Naked eyes could detect H2O2 contamination in water up to 5 × 10⁻⁵ M by tallying with blue coloration. However, a linear detection range was observed from 0.005 M to 10−5 M with a limit of detection (LOD) 10−5 M.3.4 Kinetics of MB photodegradation
Degradation (D%) (eqn (1)) at time t with various doses of ZnO@CP in the presence of H2O2 (10−2 M) are shown following the following equation (under the Sun). C0 and Ct are the MB concentrations at time 0 and t respectively.
 | (1) |
 | (2) |
Table 2 indicates that increased [ZnO@CP] up to 1.5 g dm−3 enhanced the MB removal efficiency [Fig. 4]. Exceeding 1.5 g dm−3 resulted in an unfavorable effect of photodegradation owing to the aggregation of ZnO@CP, which made the surface inaccessible for photon absorption. Furthermore, the turbidity of the solution reduced UV light penetration, lowering photodegradation efficiency. The photocatalytic process was found to be pseudo-first order. The slope of the fitting line corresponds to the value of the rate constant k (min−1) (eqn (2)).
| Doses (g dm−3) | 0 | 0.5 | 1 | 1.5 | 2 |
| D% | 0 | 65 | 75 | 99 | 85 |
| k (min−1) | — | 3 × 10⁻² | 4 × 10⁻² | 1 × 10⁻¹ | 7 × 10⁻² |
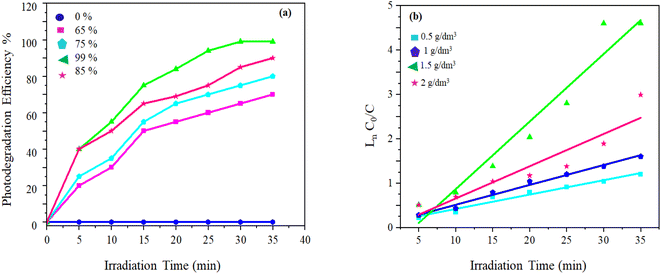 | ||
| Fig. 4 (a) Influence of the amount of ZnO@CP and (b) linear simulation kinetics curves for photocatalytic degradation of MB under the sun. | ||
ZnO@CP was synthesized at various molar ratio of CP and ZnO for the degradation study (Table 3). The highest degradation efficiency was observed at [Urea]![[thin space (1/6-em)]](https://www.rsc.org/images/entities/char_2009.gif) :
:![[thin space (1/6-em)]](https://www.rsc.org/images/entities/char_2009.gif) [formaldehyde]
[formaldehyde]![[thin space (1/6-em)]](https://www.rsc.org/images/entities/char_2009.gif) :
:![[thin space (1/6-em)]](https://www.rsc.org/images/entities/char_2009.gif) [ZnO] = [66]
[ZnO] = [66]![[thin space (1/6-em)]](https://www.rsc.org/images/entities/char_2009.gif) :
:![[thin space (1/6-em)]](https://www.rsc.org/images/entities/char_2009.gif) [133]
[133]![[thin space (1/6-em)]](https://www.rsc.org/images/entities/char_2009.gif) :
:![[thin space (1/6-em)]](https://www.rsc.org/images/entities/char_2009.gif) [1].
[1].
![[thin space (1/6-em)]](https://www.rsc.org/images/entities/char_2009.gif) :
:![[thin space (1/6-em)]](https://www.rsc.org/images/entities/char_2009.gif) [formaldehyde]
[formaldehyde]![[thin space (1/6-em)]](https://www.rsc.org/images/entities/char_2009.gif) :
:![[thin space (1/6-em)]](https://www.rsc.org/images/entities/char_2009.gif) [ZnO]) and H2O2
[ZnO]) and H2O2
| Precursor of polymer (CP) | Moles of zinc acetate | Amount of ZnO@CP applied | [Urea]![[thin space (1/6-em)]](https://www.rsc.org/images/entities/char_2009.gif) : :![[thin space (1/6-em)]](https://www.rsc.org/images/entities/char_2009.gif) [formaldehyde] [formaldehyde]![[thin space (1/6-em)]](https://www.rsc.org/images/entities/char_2009.gif) : :![[thin space (1/6-em)]](https://www.rsc.org/images/entities/char_2009.gif) [ZnO] [ZnO] |
k (min−1) | |
|---|---|---|---|---|---|
| Moles of urea | Moles of formaldehyde | ||||
| 0.066 | 0.133 | 0.001 | 1.5 g dm−3 | 66![[thin space (1/6-em)]](https://www.rsc.org/images/entities/char_2009.gif) : :![[thin space (1/6-em)]](https://www.rsc.org/images/entities/char_2009.gif) 133 133![[thin space (1/6-em)]](https://www.rsc.org/images/entities/char_2009.gif) : :![[thin space (1/6-em)]](https://www.rsc.org/images/entities/char_2009.gif) 1 1 |
1.0 × 10⁻¹ |
| 0.066 | 0.133 | 0.05 | 1.5 g dm−3 | 1.32![[thin space (1/6-em)]](https://www.rsc.org/images/entities/char_2009.gif) : :![[thin space (1/6-em)]](https://www.rsc.org/images/entities/char_2009.gif) 2.66 2.66![[thin space (1/6-em)]](https://www.rsc.org/images/entities/char_2009.gif) : :![[thin space (1/6-em)]](https://www.rsc.org/images/entities/char_2009.gif) 1 1 |
4.1 × 10⁻² |
| 0.066 | 0.133 | 0.0005 | 1.5 g dm−3 | 132![[thin space (1/6-em)]](https://www.rsc.org/images/entities/char_2009.gif) : :![[thin space (1/6-em)]](https://www.rsc.org/images/entities/char_2009.gif) 266 266![[thin space (1/6-em)]](https://www.rsc.org/images/entities/char_2009.gif) : :![[thin space (1/6-em)]](https://www.rsc.org/images/entities/char_2009.gif) 1 1 |
2.3 × 10⁻² |
We varied the initial concentrations (0.05 M, 10−2 M, 5 × 10⁻³ M, 10−3 M, 5 × 10⁻⁴ M, 10−4 M) of MB dye in Fig. S3, ESI.† With the decrease of the dye concentration, D% was increased. Such an inverse relation was attributed to the rise of internal optical density, making the solution impermeable to sunlight.59 On the other hand, the degradation was effective in neutral and alkaline pH. Highest D% was observed at pH 12. Probably at acidic pH OH˙ radicals were quenched, causing a decrease in D%.
3.5 Significance of sunlight exposure
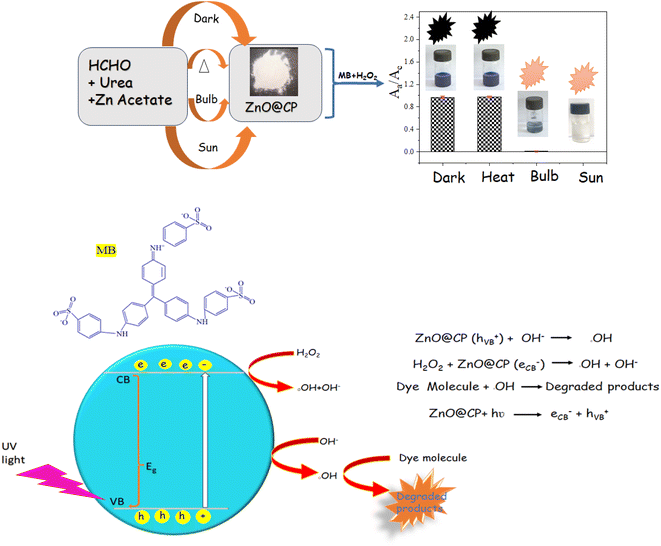
Sunlight exposure (30 min) was vital for the synthesis of ZnO@CP to degrade MB with H2O2. 200 W bulb exposure (from 9 cm above), dark and heat (100 °C) during the synthesis of ZnO@CP caused D% 0.8%, 97%, and 98% respectively (Scheme 1).3.6 Characterization of ZnO@CP
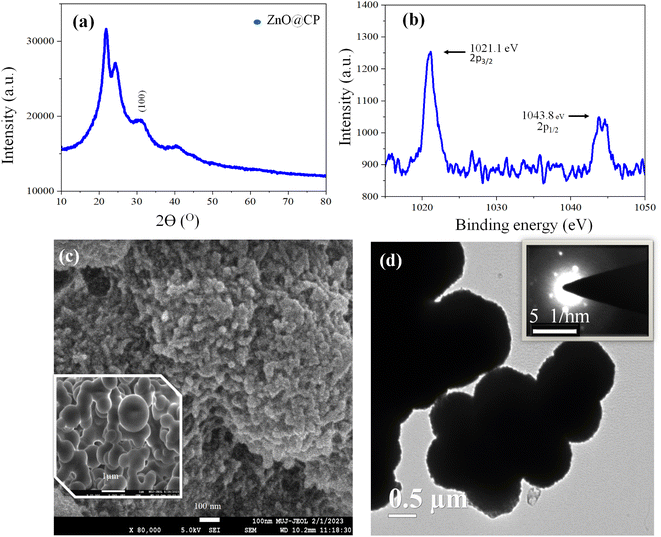
Thermogravimetric analysis (TGA) (Fig. S4, ESI†) was used to investigate the thermal profile of ZnO@CP at a 10 °C min−1 heating rate in the air within the 800 °C temperature range. Initially, a weight loss of 12.9% and 20.42% for CP and ZnO@CP respectively was observed in the thermogram attributed to the desorption of physiosorbed water. Moreover, a steep weight loss, as well as cramped weight loss of 63.8% and 23.3%, was due to the thermal degradation of covalently bonded organic scaffolds of CP. On the contrary, the high residual weight (13.55%) was attributed to the production of thermostable ZnO in ZnO@CP, and no crap was obtained, demonstrating the nanoparticle's stability.60 Such type of polymerization was associated with different polymer molecules (with different degrees of polymerization).61 Polymers with a low degree of polymerization decomposed in the temperature range of 200 °C to 500 °C, associated with 87.1% weight loss. On the other hand, polymer passivated ZnO (ZnO@CP) had a comparatively higher degree of polymerization. Thus, 66.03% weight loss happened in between temperatures 200 °C to 370 °C. After that, no further weight loss was observed. The residual mass was due to ZnO and long-chain polymers.Powder XRD analyses confirmed the formation of ZnO in ZnO@CP. According to the XRD analysis, the XRD peak of the CP was very intense and broad (2θ 10°–35°), as denoted by the black trace (Fig. S5, ESI†). So, the peak of ZnO was not shown clearly. One new peak with a 2θ value of 31.75° represented the (100) plane for ZnO in ZnO@CP (blue trace). It is noteworthy that the intense peak intensity of the polymer implied the increased crystallite nature and decreased amorphous nature.62 No other peak of ZnO was observable in XRD spectra due to the efficient coating of polymer over ZnO (Fig. 5).
The formation of ZnO in ZnO@CP was further confirmed with XPS analysis. The peak with a binding energy of 1021.8 eV corresponded to Zn 2p3/2, when Zn was in the form of ZnO.63 However, the other XPS peak of Zn 2p1/2 at 1043.8 eV was 2 eV towards higher binding energy indicating strong capping of CP on ZnO. From the FESEM images, it was evident that ZnO@CP showed porous micro-flowers (∼800 nm) with sharp-tipped nano petals (∼10 nm). The elemental analysis of the corresponding to the FESEM image confirmed the presence of Zn at the surface (Fig. S6, ESI†). Low-resolution images indicated that micro-flowers were spherical and a bit aggregated. The spherical shape of ZnO particles with CP capping (with a sort of aggregation) was also confirmed by TEM images, where each particle was of ∼800 nm diameter. The crystalline nature was also confirmed via the arranged pattern of bright dots from the SAED (Selected area electron diffraction) image (Fig. 5).
3.7 Recyclability of ZnO@CP
After treating 1.5 g dm−3 of ZnO@CP in 50 mL 10−2 M MB with 10−2 M H2O2 under 30 min sunlight exposure D% was calculated for the first cycle (by monitoring the difference in absorbance with and without catalyst). The ZnO@CP was filtered out, washed with water, dried, and added in 50 mL 10−2 M MB with 10−2 M H2O2 under 30 min sunlight exposure to calculate the D% for the second cycle. Similarly, D% was calculated for 3rd, 4th, and 5th cycles. For the first cycle, second cycle, third cycle, fourth cycle, and fifth cycle, the % of removal was 99%, 94%, 85%, 79%, and 72% respectively. The decrease in removal efficiency with the increased number of cycles might be due to an irreversible change in surface morphology (Fig. S7, ESI†).3.8 Mechanism of dye removal
For the first time, we reported MB degradation with polymer-capped ZnO and H2O2. It is noteworthy that ZnO@CP could adsorb MB efficiently in a monolayer fashion. Attempting to fit in Langmuir, Elovich, and Frudnlich isotherms we found that the adsorption of MB was Langmuir type (maximum uptake capacity Qm = 100.4 mg dm−3) (Fig. S8, ESI†). However, the introduction of H2O2 switched the process to photodegradation. Excitation of the e− from the valence band (VB) to the conduction band (CB) happened during UV light irradiation, resulting in the formation of the e− and h+ in the CB &VB, respectively. The e−, transferred in the CB combined with H2O2 molecules to generate oxidative species OH˙ radicals, while photoinduced holes left in the VB accept electrons from the hydroxyl group, generating highly oxidative OH˙ radicals that were responsible for the degradation of MB dye molecules (Scheme 1). Addition of radical scavenger ascorbic acid, EDTA ([Scavenger]/[H2O2] = 1, molar ratio) substantially decreased D%, implying the significance of OH˙ radicals for degradation. The degradation efficiency was 59% suppressed when EDTA was employed and 62% suppressed when ascorbic acid and 41% suppressed when IPA was added at the same volume and concentration. EDTA and ascorbic acid as serve as a h+ scavenger, while IPA is used as an OH˙ scavenger.64–66 Thus, h+ and ˙OH are necessary for photocatalysis, with ˙OH having a bigger impact than h+ [Fig. S9, ESI†].The OH˙ radical formation in the presence of ZnO and H2O2 was supported by various literature and mass spectra analysis (Fig. S10, ESI†). Ali et al.67 demonstrated the photodegradation of methylene blue dye using UV/H2O2. Naikwade et al.68 demonstrated the photocatalytic degradation of methyl orange using a magnetically retrievable supported ionic liquid phase photocatalyst using H2O2.
The treatment of ZnO@CPH with MB under the light of 30 min followed by filtration resulted in a colorless solution with strong fluorescence measured by a fluorimeter. We varied the excitation wavelength from 260 nm to 420 nm and found that maximum fluorescence intensity was observed at an excitation wavelength of 360 nm.
We obtained a very small fragment of 99.00 (SO2+ H2O+ OH˙) (from LCMS), which was the main (dominant) fragment, justifying the process of degradation. Moreover, Fig. S10, ESI† indicated the cleavage of the C–N bond with the formation of X and Y (the structures of fragments were depicted in Fig. S10, ESI†). X and/or Y might be decent fluorophores to generate high emissions of MB dye after ZnO@CP/H2O2/sunlight treatment. Further research is warranted in the future to understand the nature of the in situ-generated fluorophore at various physico-chemical conditions.
3.9 Fluorometric sensing of H2O2
Though we were able to sense H2O2 selectively calorimetrically, the LOD was 10−5 M only. To further increase the LOD we employed fluorescence spectroscopy. After the treatment of ZnO@CPH with MB under the light of 30 min, a colorless solution was obtained with highly emissive behaviour (λem 437 nm and λex 360 nm). In other words, the degraded products of MB were fluorescent. Such behavior prompted us to design a fluorometric H2O2 sensor. With the increase of [H2O2], the fluorescence was increased due to the formation of increased OH˙ radicals, capable of degrading MB. Thus, an increase in H2O2 concentrations caused the increase in the concentration of degraded MB with the gradual enhancement of fluorescence. So increased [H2O2] associated with increasing fluorescence was helpful for H2O2 sensing (Fig. 6).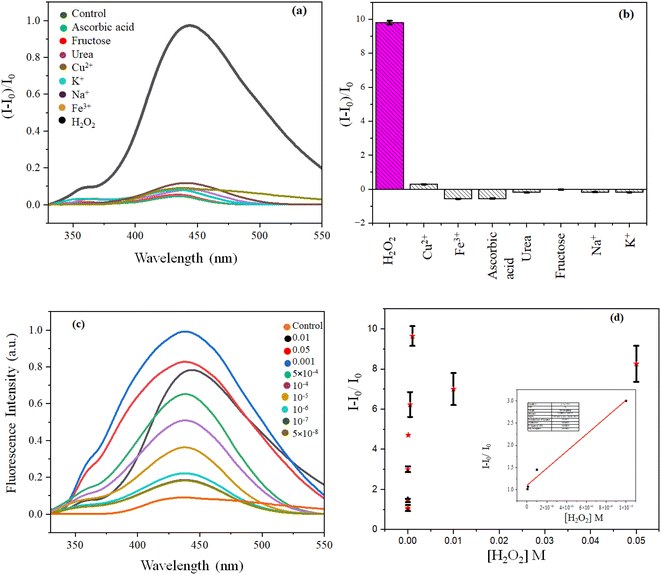 | ||
| Fig. 6 (a) Fluorescence spectra and (b) bar diagram of ZnO@CP with H2O2 & other competing molecules; (c) fluorescence spectra with [H2O2] and (d) LOD of H2O2 detection. | ||
Though the fluorescence was decreased monotonously up to the concentration of 5 × 10⁻⁸ M, a linear detection range was observed between 10−5 M to 5 × 10⁻⁸ M with a limit of detection 5 × 10⁻⁸ M and linear regression (R2) 0.985. No competing material (K+, Na+, ascorbic acid, urea, fructose, Cu2+, Fe3+) could exhibit such evolution of fluorescence, unlike H2O2, as they could not degrade MB, unlike H2O2. We also studied the effect of interfering materials in the colorless degraded solution of MB during the sensing of H2O2. No other coexisted interfering agent could alter the originated fluorescence of degraded MB except Fe3+ (Fig. 6 and S11, ESI†).
4 Conclusions
This work showed that toxic dye MB could be photodegraded effectively in the presence of sunlight by employing H2O2. The rate of degradation decreased significantly in the presence of OH˙ the radical scavenger. These OH˙ radicals proceeded through an oxidation process that produces intermediates, OH˙, CO2, SO2, and H2O at the end. However, after the photodegradation a strong fluorophore was generated, accelerating the sensitive and selective sensing platform. Future research is warranted to investigate the origin of fluorescence after MB degradation. The proposed tactic can be used for the remediation of other toxic materials like pesticides, fungicides, waste pharma materials, novel dyes, etc. We believe that the present paper may be highly helpful for young researchers venturing into the field of circular economy.Conflicts of interest
There are no conflicts to declare.Acknowledgements
The authors are thankful to CAF & SAIF (MUJ) for the instrumental facility.Notes and references
-
(a) M. Anbia and S. Salehi, Dyes Pigm., 2012, 1, 1–9 CrossRef
; (b) G. Z. Kyzas, M. Kostoglou, A. Vassiliou and N. K. Lazaridis, Chem. Eng. J., 2011, 2, 577–585 CrossRef
; (c) S. C. Hsieh and P. Y. Lin, J. Nanopart. Res., 2012, 14, 956 CrossRef
.
-
(a) J. Ma, Y. Jia, Y. Jing, Y. Yao and J. Sun, Dyes Pigm., 2012, 3, 1441–1446 CrossRef
; (b) R. Cheng, S. Ou, B. Xiang, Y. Li and Q. Liao, Langmuir, 2009, 2, 752–758 Search PubMed
; (c) A. C. Lucilha, C. E. Bonancea, W. J. Barreto and K. Takashima, Spectrochim. Acta, Part A, 2010, 75, 389–393 CrossRef PubMed
; (d) Z. X. Chen, Y. Cheng, Z. L. Chen, M. Megharaj and R. Naidu, J. Nanopart. Res., 2012, 8, 899–915 CrossRef
.
-
(a) Y. Wang and J. Yu, Water Res., 1999, 33, 3512 CrossRef
; (b) T. Wu, X. Cai, S. Tan, H. Li, J. Liu and W. Yang, Chem. Eng. J., 2011, 1, 144–149 CrossRef
.
-
(a) C. C. Chen, P. Liu and C. H. Lu, Chem. Eng. J., 2008, 3, 509–513 CrossRef
; (b) X. Wang, Y. Ding, C. J. Summers and Z. L. Wang, J. Phys. Chem. B, 2004, 26, 8773–8777 CrossRef
; (c) Z. L. Wang and J. Song, Science, 2006, 312, 242–246 CrossRef CAS PubMed
; (d) A. Janotti and C. G. Van de Walle, Rep. Prog. Phys., 2009, 12, 126501 CrossRef
; (e) Y. Zhang, M. K. Ram, E. K. Stefanakos and D. Y. Goswami, J. Nanomater., 2012, 2012, 1–22 Search PubMed
.
-
(a) J. Wellings, N. Chaure, S. Heavens and I. Dharmadasa, Thin Solid Films, 2008, 12, 3893–3898 CrossRef
; (b) M. Nirmala, M. G. Nair, K. Rekha, A. Anukaliani, S. Samdarshi and R. G. Nair, Afr. J. Basic Appl. Sci., 2010, 2, 161–166 Search PubMed
; (c) I. S. J. Bao, Z. Su, R. Gurwitz, F. Capasso, X. Wang and Z. Ren, Nanoscale Res. Lett., 2011, 404, 1–7 Search PubMed
.
-
(a) J. Sun, C. Li, Y. Qi, S. Guo and X. Liang, Sensors, 2016, 16, 584 CrossRef PubMed
; (b) G. He, F. Gao, W. Li, P. Li, X. Zhang, H. Yin, B. Yang, Y. Liu and S. Zhang, Anal. Methods, 2019, 11, 1651–1656 RSC
; (c) H. Wei and E. Wang, Anal. Chem., 2008, 80, 2250–2254 CrossRef CAS PubMed
; (d) M. Hoshino, S. Kamino, M. Doi, S. Takada, S. Mitani, R. Yanagihara, M. Asano, T. Yamaguchi and Y. Fujita, Spectrochim. Acta, Part A, 2014, 117, 814–816 CrossRef CAS PubMed
.
-
(a) Y. Huiyun, W. Haijun, X. Chengyi, C. Yaqin and Y. Ruo, Biosens. Bioelectron., 2018, 116, 16–22 CrossRef PubMed
; (b) X. Jiang, H. Wang, R. Yuan and Y. Chai, Anal. Chem., 2018, 90, 8462–8469 CrossRef CAS PubMed
; (c) H. Yue, X. Bu, M.-H. Huang, J. Young and T. Raglione, Int. J. Pharm., 2009, 375, 33–40 CrossRef CAS PubMed
.
-
(a) P. Gimeno, C. Bousquet, N. Lassu, A.-F. Maggio, C. Civade, C. Brenier and L. Lempereur, J. Pharm. Biomed. Anal., 2015, 107, 386–393 CrossRef CAS PubMed
; (b) Q. Liu, P. Chen, Z. Xu, M. Chen, Y. Ding, K. Yue and J. Xu, Sens. Actuators, B, 2017, 251, 339–348 CrossRef CAS
; (c) P. J. Rivero, E. Ibanez, J. Goicoechea, A. Urrutia, I. R. Matias and F. Arregui, Sens. Actuators, B, 2017, 251, 624–631 CrossRef CAS
.
-
(a) G. Jiaojiao, L. Hui, P. Lingyan, G. Kai and L. Junqi, ACS Appl. Mater. Interfaces, 2018, 10, 30441–30450 CrossRef PubMed
; (b) Z. Ya, Z. Zhifeng, W. Fangfang, T. Jing, P. Tao, L. Bingqing, W. Honggui and Y. Shixue, Sens. Actuators, B, 2018, 275, 155–162 CrossRef
.
- W. S. Al-Arjan, Polymers, 2022, 15, 3086 CrossRef PubMed
.
- E. Altıntıg, M. Yenigun, A. Sarı, H. Altundag, M. Tuzen and T. A. Saleh, Environ. Technol. Innovation, 2021, 21, 101305 CrossRef
.
- F. Zhang, J. Lan, Y. Yang and T. Wei, J. Nanopart. Res., 2013, 15, 2034 CrossRef
.
- V. Batra, I. Kaur and D. Pathania, Sonu, Appl. Surf. Sci. Adv., 2022, 11, 100314 CrossRef
.
- M. Ganguly and P. A. Ariya, ACS Omega, 2019, 7, 12107–112120 CrossRef PubMed
.
- S. Venkatesan, S. Suresh, P. Ramu, J. Arumugam, S. Thambidurai and N. Pugazhenthiran, Results Chem., 2022, 4, 100637 CrossRef CAS
.
- D. G. Ayu, S. Gea, N. Andriayani, D. J. Telaumbanua, A. F. R. Piliang, M. Harahap, Z. Yen, R. Goei and A. I. Y. Tok, ACS Omega, 2023, 17, 14965–14984 CrossRef PubMed
.
- R. Kumar, G. Kumar and A. Umar, Nanosci. Nanotechnol. Lett., 2014, 8, 631–650 CrossRef
.
- X. Zhang, Y. Zhao, H. Zhang, W. Chen, S. Guo and Y. Chen, Org. Biomol. Chem., 2016, 14, 4815–4830 Search PubMed
.
- L. Guo, S. Yang, C. Yang, P. Yu, J. Wang, W. Ge and G. K. L. Wong, Appl. Phys. Lett., 2000, 76, 2901–2903 CrossRef CAS
.
- S. Tachikawa, A. Noguchi, T. Tsuge, M. Hara, O. Odawara and H. Wada, Materials, 2011, 1132–1143 CrossRef CAS PubMed
.
- S. Sarkar, N. T. Ponce, A. Banerjee, R. Bandopadhyay, S. Rajendran and E. Lichtfouse, Environ. Chem. Lett., 2020, 18, 1569–1580 CrossRef CAS PubMed
.
- E. Z. Wang, Y. Wang and D. Xiao, Polymers, 2021, 8, 1215 CrossRef PubMed
.
- S. Muzammal, A. Ahmad, M. Sheraz, J. Kim, S. Ali, M. B. Hanif, I. Hussain, S. Pandiaraj, A. Alodhayb, M. S. Javed, H. A. Z. Al-bonsrulah and M. Motola, Energy Convers. Manage.: X, 2024, 22, 100547 CAS
.
-
(a) S. Kumar, N. Dilbaghi, R. Rani and G. Bhanjana, J. Bionanosci., 2012, 4, 227–250 CrossRef
; (b) Y.-Q. Liu, Y. Tian, G.-Z. Zhao, Y.-Y. Sun, F.-T. Zhu and Y. Cao, J. Polym. Res., 2008, 15, 501–505 CrossRef CAS
.
- F. Zhang, J. Lan, Y. Yang, T. Wei, R. Tan and W. Song, J. Nanopart. Res., 2013, 15, 2034 CrossRef
.
- N. J. Singh, B. Wareppam, S. Ghosh, B. P. Sahu, P. K. AjiKumar, H. P. Singh, S. Chakraborty, S. S. Pati, A. C. Oliveira, S. Barg, V. K. Garg and L. H. Singh, Nanotechnology, 2020, 31, 425703 CrossRef CAS PubMed
.
- N. S. M. Ali, H. A. Alalwan, A. H. Alminshid and M. M. Mohammed, Pollution, 2022, 8, 295–302 Search PubMed
.
- R. Liu, P. Lv, H. Fu, R. Lu, X. Wu and Y. Lu, J. Nanosci. Nanotechnol., 2017, 17, 4755–4762 CrossRef CAS
.
- L. Fana, Y. Zhang, C. Luoa, F. Lua, H. Qiua and M. Suna, Int. J. Biol. Macromol., 2012, 50, 444–450 CrossRef PubMed
.
- L. Zhang, Y. Zhang, L. Yang, X. Jiang and Q. Yang, Desalin. Water Treat., 2014, 1–11 Search PubMed
.
- Y. Liu, Q. Yu, X. Liu and R. Liu, Environ. Prog. Sustainable Energy, 2019, 38, S277–S287 CAS
.
- K. Azama, R. Razab, N. Shezada, M. Shabira, W. Yang, N. Ahmada, I. Shafiqa, P. Akhterd, A. Razzaqa and M. Hussaina, J. Environ. Chem. Eng., 2020, 5, 104220 CrossRef
.
- S. Dhiman and B. Gupta, Environ. Technol. Innovation, 2021, 23, 101765 CrossRef CAS
.
- S. Li, Q. Liu, R. Liu, R. Lu and J. Xiang, J. Nanosci. Nanotechnol., 2017, 17, 4112–4118 CrossRef CAS
.
- M. A. Abu-Dalo, S. A. Al-Rosan and B. A. Albiss, Polymers, 2021, 19, 3451 CrossRef PubMed
.
- S. Venkatesan, S. Suresh, P. Ramu, J. Arumugam, S. Thambidurai and N. Pugazhenthiran, Results Chem., 2022, 4, 100637 CrossRef CAS
.
- A. Bhapkar, R. Prasad, D. Jaspal, M. Shirolkar, Kh. Gheisari and S. Bhame, Inorg. Chem. Commun., 2023, 148, 110311 CrossRef CAS
.
- G. Ankamwar, K. Balaprasad, B. Vaishali, I. Annsi, Jose, Sarma, S. Loka, Mahajan and M. Chandrashekhar, J. Nanosci. Nanotechnol., 2017, 17, 1185–1192 CrossRef PubMed
.
- D. G. Ayu, S. Gea, Andriayani, D. J. Telaumbanua, A. F. R. Piliang, M. Harahap, Z. Yen, R. Goei and A. I. Y. Tok, ACS Omega, 2023, 17, 14965–14984 CrossRef PubMed
.
- K. A. Isai and V. S. Shrivastava, SN Appl. Sci., 2019, 1, 1247 CrossRef CAS
.
- A. Negash, S. Mohammed, H. D. Weldekirstos, A. D. Ambaye and M. Gashu, Sci. Rep., 2023, 13, 22234 CrossRef CAS PubMed
.
- A. Balcha, O. P. Yadav and T. Dey, Environ. Sci. Pollut. Res. Int., 2016, 24, 25485–25493 CrossRef PubMed
.
- P. B. Koli, K. H. Kapadnis, U. G. Deshpande and M. R. Patil, J. Nanostruct. Chem., 2018, 8, 453–463 CrossRef CAS
.
- P. B. Koli, K. H. Kapadnis and U. G. Deshpande, J. Environ. Eng., 2019, 7, 103373 CAS
.
- R. S. Shinde, S. D. Khairnar, M. R. Patil, V. A. Adole, P. B. Koli, V. V. Deshmane, D. K. Halwar, R. A. Shinde, T. B. Pawar, B. S. Jagdale and A. V. Patil, J. Inorg. Organomet. Polym., 2022, 32, 1045–1066 CrossRef CAS
.
- R. H. Waghchaure, V. A. Adole, B. S. Jagdale and P. B. Koli, Inorg. Chem. Commun., 2022, 140, 109450 CrossRef
.
- S. A. Ahire, A. A. Bachhav, T. B. Pawar, B. S. Jagdale, A. V. Patil and P. B. Koli, Results Chem., 2022, 4, 100633 CrossRef CAS
.
- P. B. Koli, S. G. Shinde, K. H. Kapadnis, A. P. Patil, M. P. Shinde, S. D. Khairnar, D. B. Sonawane and R. S. Ingale, J. Indian Chem. Soc., 2021, 98, 100225 CrossRef CAS
.
- S. A. Ahire, A. A. Bachhav, B. S. Jagdale, A. Patil, P. B. Koli and T. Pawar, J. Inorg. Organomet. Polym. Mater., 2023, 33, 1–12 CrossRef
.
- R. H. Waghchaure, P. B. Koli, V. A. Adole and B. S. Jagdale, Results Chem., 2022, 4, 100488 CrossRef CAS
.
- M. A. Ali, I. M. Maafa and I. Y. Qudsieh, Water, 2024, 16, 453 CrossRef CAS
.
- J. Gaur, K. Vikrant, K.-H. Kim, S. Kumar, M. Pal, R. Badru, S. Masand and J. Momoh, Mater. Today Sustain., 2023, 22, 100339 CrossRef
.
- J. Kaur, S. Bansal and S. Singhal, Phys. B, 2013, 416, 33–38 CrossRef CAS
.
- S. H. Khan and B. Pathak, Environ. Nanotechnol. Monit. Manag., 2020, 13, 100290 Search PubMed
.
- P. Purkait, A. Bhattacharyya, S. Roy, S. Maitra, G. C. Das and M. G. Chaudhuri, Int. J. Environ. Anal. Chem., 2023, 103, 307–325 CrossRef CAS
.
- M. Chijioke-Okere, N. J. Okorocha, B. N. Anukam and E. Emanuel Oguzie, Int. Lett. Chem., Phys. Astron., 2019, 81, 18–26 Search PubMed
.
- R. Mohammed, M. E. M. Ali, E. Gomma and M. Mohsen, J. Environ. Chem. Eng., 2020, 5, 104295 CrossRef
.
- P. Sharma and M. Ganguly, New J. Chem., 2023, 47, 7481–7485 RSC
.
- J.-C. Sin, S.-M. Lam, A. R. Mohamed and K.-T. Lee, Int. J. Photoenergy, 2012, 2012, 1–23 CrossRef
.
- A. G. Naikwade, M. B. Jagadale, D. P. Kale, A. D. Gophane, K. M. Garadkar and G. S. Rashinkar, ACS Omega, 2020, 5, 131–144 CrossRef CAS PubMed
.
- A. Sánchez-Ferrer, D. Rogez and P. Martinoty, RSC Adv., 2015, 5, 6758–6770 RSC
.
-
(a) A. K. Zak, R. Razali, H. A. W. Majid and M. Darroudi, Int. J. Nanomed., 2011, 6, 1399–1403 Search PubMed
; (b) S. A. Bhat, F. Zafar, A. U. Mirza, A. H. Mondal, A. Kareem, Q. M. R. Haq and N. Nishat, Arab. J. Chem., 2020, 13, 5724–5739 CrossRef
.
-
(a) X. Liu, H. L. Liu, W. X. Zhang, X. M. Li, N. Fang, X. H. Wang and J. Wu, Nanoscale Res. Lett., 2015, 10, 1–9 CrossRef PubMed
; (b) A. Kruth, S. Hasen, T. Beweries and V. Bruser, ChemSusChem, 2013, 1, 152–159 CrossRef PubMed
.
- Y. Zhu, J. Xue, T. Xu, G. He and H. Chen, J. Mater. Sci.: Mater. Electron., 2017, 28, 8519 CrossRef CAS
.
- L. Ye, J. Liu, C. Gong, L. Tian, T. Peng and L. Zan, ACS Catal., 2012, 2, 1677 CrossRef CAS
.
- B.-J. Yang, W. Luo, Q. Liao, J.-Y. Zhu, M. Gan, X.-D. Liu and G.-Z. Qiu, Trans. Nonferrous Met. Soc. China, 2020, 30, 200–211 CrossRef CAS
.
- M. A. Ali, I. M. Maafa and I. Y. Qudsieh, Water, 2024, 16, 453 CrossRef CAS
.
- A. G. Naikwad, M. B. Jagadale, D. P. Kale, A. D. Gophane, K. M. Garadkar and G. S. Rashinkar, ACS Omega, 2020, 5, 131–144 CrossRef PubMed
.
Footnote |
| † Electronic supplementary information (ESI) available: Diagrammatic presentation of CP, digital images, D% with initial dye concentration & pH, TGA, XRD, EDS, recyclability, adsorption isotherm, scavengers study, LCMS, fluorescence data. See DOI: https://doi.org/10.1039/d4ra01354a |
| This journal is © The Royal Society of Chemistry 2024 |

