 Open Access Article
Na3V2(PO4)3-decorated Na3V2(PO4)2F3 as a high-rate and cycle-stable cathode material for sodium ion batteries†
Yi Yang‡
a,
Guo-Rong Xu‡a,
An-Ping Tanga,
Jun-chao Zheng b,
Lin-Bo Tang*c,
Ying-De Huang*b and
He-Zhang Chen
 *a
*a
aSchool of Chemistry and Chemical Engineering, Hunan University of Science and Technology, Xiangtan 411201, Hunan, China. E-mail: 278789069@qq.com
bSchool of Metallurgy and Environment, Central South University, Changsha 410083, Hunan, China. E-mail: yingdecsu@foxmail.com
cSchool of Chemistry and Chemical Engineering, Central South University, Changsha 410083, Hunan, China. E-mail: tlb943464594@csu.edu.cn
First published on 15th April 2024
Abstract
Since Na3V2(PO4)3 (NVP) possesses modest volume deformation and three-dimensional ion diffusion channels, it is a potential sodium-ion battery cathode material that has been extensively researched. Nonetheless, NVP still endures the consequences of poor electronic conductivity and low voltage platforms, which need to be further improved. On this basis, a high voltage platform Na3V2(PO4)2F3 was introduced to form a composite with NVP to increase the energy density. In this study, the sol–gel technique was successfully used to synthesize a Na3V2(PO4)2.75F0.75/C (NVPF·3NVP/C) composite cathode material. The citric acid-derived carbon layer was utilized to construct three-dimensional conducting networks to effectively promote ion and electron diffusion. Furthermore, the composites' synergistic effect accelerates the quick ionic migration and improves the kinetic reaction. In particular, NVP as the dominant phase enhanced the structural stability and significantly increased the capacitive contribution. Therefore, at 0.1C, the discharge capacity of the modified NVPF·3NVP/C composite is 120.7 mA h g−1, which is greater than the theoretical discharge capacity of pure NVP (118 mA h g−1). It discharged 110.9 mA h g−1 of reversible capacity even at an elevated multiplicity of 10C, and after 200 cycles, it retained 64.1% of its capacity. Thus, the effort produced an optimized NVPF·3NVP/C composite cathode material that may be used in the sodium ion cathode.
1 Introduction
Because sodium-ion batteries are widely available and relatively inexpensive when compared to lithium resources,1–4 scholars have shown considerable curiosity regarding them. Lithium-ion batteries' design and production skills can be applied to sodium-ion batteries because their physical and chemical characteristics are similar. A suitable method for the embedding and de-embedding of sodium ions can be found in the huge number of voids formed by the three-dimensional open frameworks of sodium super ion-conductor (NASICON), which is used as the cathode material. However, NASICON-type materials suffer from relatively low conductivity and sodium ion embedding/de-embedding capacity, resulting in unsatisfactory rate performance and cycling stability, which limits their practical applications.5,6 In general, surface modification of conductive carbon materials, material doping, nanostructure modulation, and multifunctional composites7–9 are ways to enhance sodium-ion battery performance.It is acknowledged that Na3V2(PO4)3 and Na3V2(PO4)2F3 (NVPF) are NASICON-type materials, valued for their capacity to facilitate sodium ion intercalation.10–15 Zhang et al.16 produced carbon-coated Na3V2(PO4)2F3 composites using the sol–gel method. It has good capacity retention of 95.9% at 10C for 800 cycles after delivering a beginning capacity of 113.8 mA h g−1 at 0.5C. Deng17 successfully enhanced the electronic conductivity of the sample by introducing dopamine as a carbon supply to coat the surface of Na3V2(PO4)2F3/C, thereby improving the electrochemical performance. In the doping modification of NVPF, in addition to the doping of the Na-site, more studies have focused on the doping of the V-site. Criado et al.18 modified NVPF with Cr doping at the V-site and found that low levels of Cr doping could reduce the interfacial resistance and polarization, especially enhancing the kinetic response of the electrode material's at high current densities. Mao et al.19 synthesized porous nanocomposites with ultrafine structure by the use of a microwave-assisted hydrothermal technique, which could increase the materials electrochemical reaction interface as well as shorten the routes used by ions and electrons during transit, contributing to improving the sample's sodium storage capabilities. In contrast, the comparison sample produced by the conventional hydrothermal method only had a 96% capacity retention rate and a specific capacity of 99 mA h g−1. In the paper, the material's capacity did not decrease after 100 cycles at 0.5C, and it could still release the same specific capacity of 106 mA h g−1 as the first time. In recent years, it has been found that hybrid composites have high performance. Li et al.20 successfully composited a two-phase Na2LiV2(PO4)3 material that incorporates the superiority of NVP and Li3V2(PO4)3 with high capacity and magnificent rate and cycling properties. Therefore, we proposed combining NVPF with other cathode materials to improve the problems of NVPF's low electronic conductivity, structural damage, and capacity decay during cycling. Compared with other cathode materials, NVP has obvious advantages. It has a NASICON structure similar to NVPF and cycle stability, which makes it have a relatively stable discharge capacity and cycle efficiency during charging and discharging, reducing the problem of capacity decay and prolonging the battery life. These inherent characteristics render NVP an extremely competitive nominee for synergistic integration with NVPF. In addition, the electrode material obtained by the combination of NVP/C and NVPF/C will show the ladder-shaped charge/discharge profiles, which increases the energy density and specific capacity of the electrode materia.21 This combination facilitates the realization of higher energy density and longer battery life. However, both NVP and NVPF suffer from poor electronic conductivity impeding electron-ion transport.22–25 To address this issue, we added excess citric acid as a carbon coating source on the surface of the material during the preparation process, which improved the conductivity of the material. Therefore, the stable cycling of NVP and the high energy density of NVPF are integrated into NVPF·3NVP/C composite, resulting in the simultaneous achievement of high voltage, long cycle stability, and performance at a high rate.
2 Experimental
2.1 Synthesis of Na3V2(PO4)3−xF3x/C
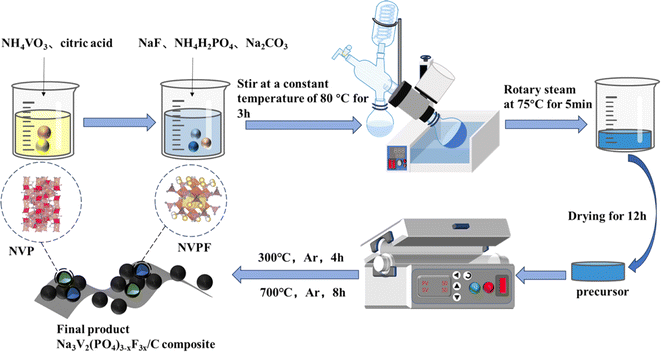
Na2CO3, NH4VO3, NH4H2PO4, citric acid (C6H8O7), and NaF are all analytical-grade raw ingredients that have not been purified. NH4VO3, citric acid, NH4H2PO4, and NaF were used as initial supplies in the sol–gel process to make Na3V2(PO4)3−xF3x/C (x = 0, 0.25, 0.5, 0.75, and 1) with stoichiometric ratios of 2![[thin space (1/6-em)]](https://www.rsc.org/images/entities/char_2009.gif) :
:![[thin space (1/6-em)]](https://www.rsc.org/images/entities/char_2009.gif) 1.6
1.6![[thin space (1/6-em)]](https://www.rsc.org/images/entities/char_2009.gif) :
:![[thin space (1/6-em)]](https://www.rsc.org/images/entities/char_2009.gif) 3x
3x![[thin space (1/6-em)]](https://www.rsc.org/images/entities/char_2009.gif) :
:![[thin space (1/6-em)]](https://www.rsc.org/images/entities/char_2009.gif) 2−x. Citric acid is a source of carbon coating on material surfaces in addition to its roles as a chelating and reducing agent. The steps of the preparation were as follows: NH4VO3 was dissolved in deionized water, stirred in a thermostatic water bath at 80 °C, 1.6 mmol of dissolved citric acid was added dropwise, and after stirring for 20 min, 2−x mmol NH4H2PO4, 3x mmol NaF and Na2CO3 were added sequentially to the blue solution, and stirring was performed for 5 min to make it fully dissolved, and the stirring was continued to the formation of the sol, and the solvent was dissolved in a rotary evaporator. The solvent was stripped off in a rotary evaporator at 75 °C to form a gel and was put at 120 °C in a vacuum-drying oven to evaporate. Grinding was used to extract the precursor. For comparison, the specimens were named NVP/C, NVPF·NVP/C, NVPF·3NVP/C, 3NVPF·NVP/C, and NVPF/C, according to the difference of the x-value. The samples were baked in an Argon environment for four hours at 300 °C inside a tube furnace, brought down to room temperature, and then continued to calcine at 700 °C for 8 h and brought down to room temperature to acquire the samples. Fig. 1 depicts the complete synthesis procedure.
2−x. Citric acid is a source of carbon coating on material surfaces in addition to its roles as a chelating and reducing agent. The steps of the preparation were as follows: NH4VO3 was dissolved in deionized water, stirred in a thermostatic water bath at 80 °C, 1.6 mmol of dissolved citric acid was added dropwise, and after stirring for 20 min, 2−x mmol NH4H2PO4, 3x mmol NaF and Na2CO3 were added sequentially to the blue solution, and stirring was performed for 5 min to make it fully dissolved, and the stirring was continued to the formation of the sol, and the solvent was dissolved in a rotary evaporator. The solvent was stripped off in a rotary evaporator at 75 °C to form a gel and was put at 120 °C in a vacuum-drying oven to evaporate. Grinding was used to extract the precursor. For comparison, the specimens were named NVP/C, NVPF·NVP/C, NVPF·3NVP/C, 3NVPF·NVP/C, and NVPF/C, according to the difference of the x-value. The samples were baked in an Argon environment for four hours at 300 °C inside a tube furnace, brought down to room temperature, and then continued to calcine at 700 °C for 8 h and brought down to room temperature to acquire the samples. Fig. 1 depicts the complete synthesis procedure.
2.2 Material characterization
The basic crystallographic information was obtained by XRD measurements to study the crystal structure of each sample. The instrument was a Rigaku Ultima IV with an angular range of 10–90° and a scanning speed of 5° per minute. Using Fourier Transform Infrared (FT-IR) absorption spectra noted in the 500–2000 cm−1 range by a Thermo Scientific Nicolet iS50 analyzer, the fundamental chemical bonding of the samples was ascertained. Through the use of Thermo Scientific K-Alpha XPS testing, the valence states of various elements in various composites were examined. Transmission electron microscopy (TEM, TF30) and scanning electron microscopy (SEM, Hitachi Regulus8100) were used to assess the morphology of the materials. An ASAP 2460 equipment was utilized to ascertain the specific surface area and pore size using N2 adsorption and desorption studies.2.3 Electrochemical testing
By putting together CR2025 button cells in an argon-filled glove box, the electrochemical characteristics of each sample were assessed. Glass fibers were used as a separator and aluminum foil as the current collector to create the Na3V2(PO4)3−xF3x/C positive electrodes, which were made up of 70 wt% active substances, 15 wt% acetylene black, and 15 wt% polyvinylidene fluoride. A sodium metal sheet served as the negative electrode. The electrolyte consisted of a mixed solvent (EC![[thin space (1/6-em)]](https://www.rsc.org/images/entities/char_2009.gif) :
:![[thin space (1/6-em)]](https://www.rsc.org/images/entities/char_2009.gif) DEC = 1
DEC = 1![[thin space (1/6-em)]](https://www.rsc.org/images/entities/char_2009.gif) :
:![[thin space (1/6-em)]](https://www.rsc.org/images/entities/char_2009.gif) 1 vol%) and a 1 M NaClO4 solute. Overall, each cell was loaded with 1.15–1.61 mg cm−2 of active material. A Blue Battery Test System was utilized to complete constant-current charge/discharge tests. A CHI760E electrochemical workstation was utilized to conduct cyclic voltammetry (CV) measurements spanning the 2.0–4.3 V vs. Na/Na+ range, using a scanning speed of 0.1–5 mV s−1. Utilizing the same device, electrochemical impedance spectroscopy (EIS) curves of sinusoidal signals at a potential magnitude of 5.0 mV were acquired in the 0.01 Hz–100 kHz frequency range.
1 vol%) and a 1 M NaClO4 solute. Overall, each cell was loaded with 1.15–1.61 mg cm−2 of active material. A Blue Battery Test System was utilized to complete constant-current charge/discharge tests. A CHI760E electrochemical workstation was utilized to conduct cyclic voltammetry (CV) measurements spanning the 2.0–4.3 V vs. Na/Na+ range, using a scanning speed of 0.1–5 mV s−1. Utilizing the same device, electrochemical impedance spectroscopy (EIS) curves of sinusoidal signals at a potential magnitude of 5.0 mV were acquired in the 0.01 Hz–100 kHz frequency range.
3 Results and discussion
The XRD spectra and Rietveld refined XRD findings of Na3V2(PO4)3−xF3x/C (x = 0.25, 0.5, 0.75 and 1) and NVPF·3NVP/C composites are illustrated in Fig. 2a and b. With regard to standard Na3V2(PO4)2F3 (JCPDS No. 89-8485) and Na3V2(PO4) 3 (JCPDS No. 53-0018), all materials are well indexed. The Rietveld technique and GSAS-II software were used to refine the collected data. Lower values of Rp, Rwp, and Rexp were obtained, indicating better reliability. The refinement results show that NVPF·3NVP/C consists of NVPF and NVP fractions in tetragonal P42/mnm and tripartite R![[3 with combining macron]](https://www.rsc.org/images/entities/char_0033_0304.gif) c phases. The content ratio of NVP to NVPF in NVPF·3NVP/C is 78
c phases. The content ratio of NVP to NVPF in NVPF·3NVP/C is 78![[thin space (1/6-em)]](https://www.rsc.org/images/entities/char_2009.gif) :
:![[thin space (1/6-em)]](https://www.rsc.org/images/entities/char_2009.gif) 22, which is extremely near to the intended value (Table S1†). A small loss of fluorine from NVPF at high temperatures could cause the content ratio to differ from the expected value. An illustration of the NVPF crystal structure may be found in the inset of Fig. 2b. The structure is made up of [PO4] tetrahedral and [V2O8F3] dioctahedral units joined by common oxygen atoms. The structure contains two distinct Na sites (one of which is totally occupied by Na (1) and the other half by Na (2)). Therefore, the charge–discharge curves of the SIBs show two peaks, one at 3.7 V and the other at 4.2 V. In conclusion, the modified NVPF·3NVP/C composites with NVP and NVPF co-mingled phases were successfully synthesized.
22, which is extremely near to the intended value (Table S1†). A small loss of fluorine from NVPF at high temperatures could cause the content ratio to differ from the expected value. An illustration of the NVPF crystal structure may be found in the inset of Fig. 2b. The structure is made up of [PO4] tetrahedral and [V2O8F3] dioctahedral units joined by common oxygen atoms. The structure contains two distinct Na sites (one of which is totally occupied by Na (1) and the other half by Na (2)). Therefore, the charge–discharge curves of the SIBs show two peaks, one at 3.7 V and the other at 4.2 V. In conclusion, the modified NVPF·3NVP/C composites with NVP and NVPF co-mingled phases were successfully synthesized.
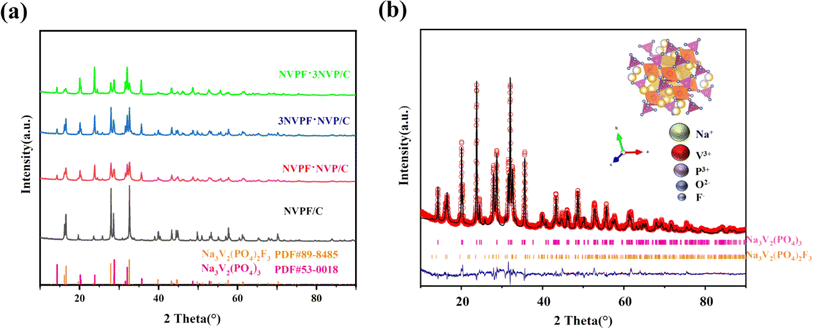 | ||
| Fig. 2 (a) XRD patterns of Na3V2(PO4)3−xF3x/C (x = 0.25, 0.5, 0.75, 1) and (b) refinement result for NVPF·3NVP/C composite. | ||
The morphological characteristics of every material were examined by performing SEM, and the corresponding findings are elucidated in Fig. 3a–c. Pronounced agglomeration of particles was observed in the NVP/C and NVPF/C materials throughout the procedure of high-temperature calcination. In stark contrast, the dimensions of active particles in the NVPF·3NVP/C sample decreased, as shown in Fig. 3c. Interestingly, under high zoom (Fig. 3d and e), the small-sized particles formed some interstices, which effectively enlarged the contact region between the electrolyte and the active substances. It accelerates the migration of Na+ and increases the electrochemical active site during the charge–discharge process. Furthermore, elemental mapping and energy spectroscopy showed that the uniform distribution of C, O, P, Na, V, and F in NVPF·3NVP/C indicated that the composite sample was successfully synthesized.
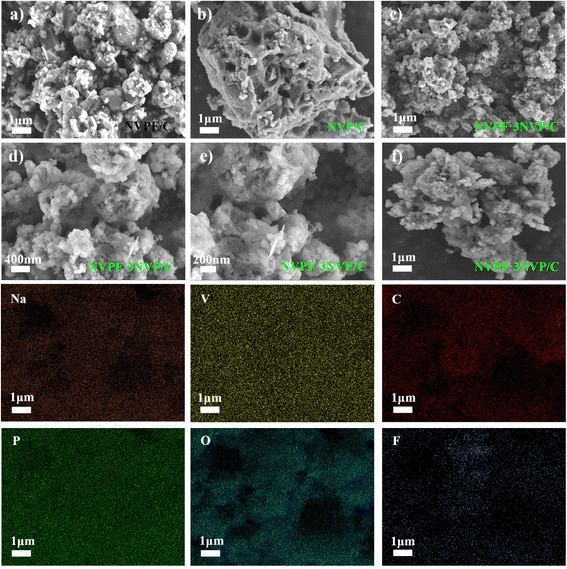 | ||
| Fig. 3 Low magnification images captured by SEM of NVP/C (a), NVPF/C (b) and NVPF·3NVP/C (c); enlarged images (d and e); (f) EDS elemental mapping of NVPF·3NVP/C. | ||
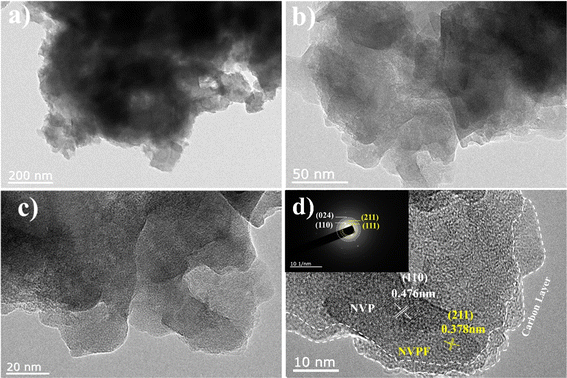
In addition, Fig. 4 displays the TEM and HRTEM pictures of the NVPF·3NVP/C composites. The optimized samples' crystallinity is compatible with the findings of XRD tests, as shown by HRTEM images. Notably, the particles' surface had a layer of carbon covering it that had an average thickness of 4 nm, which was advantageous for enhancing the electronic conductivity even more. Furthermore, at labeled lattice stripe spacings of 0.476 nm and 0.378 nm, separately, the NVP and NVPF phases can coexist well in the HRTEM images, which is consistent with the NASICON-type NVP (110) and NVPF (211) planar maps. Fig. 4d shows the surface of the NVPF·3NVP/C composite granule to have a distinct layer of carbon with an average thickness of 4 nm. Thermogravimetric analysis was used to ascertain the amount of carbon in the composites; the findings are displayed in Fig. S1.† The amount of carbon in the material was attributed to the initial weightlessness of around 4.04%. The NVPF·3NVP/C area electron diffraction (SAED) maps matched the (110), (024), and (111), (211) surfaces, respectively. This result confirms the structural phase of NVPF·3NVP/C.
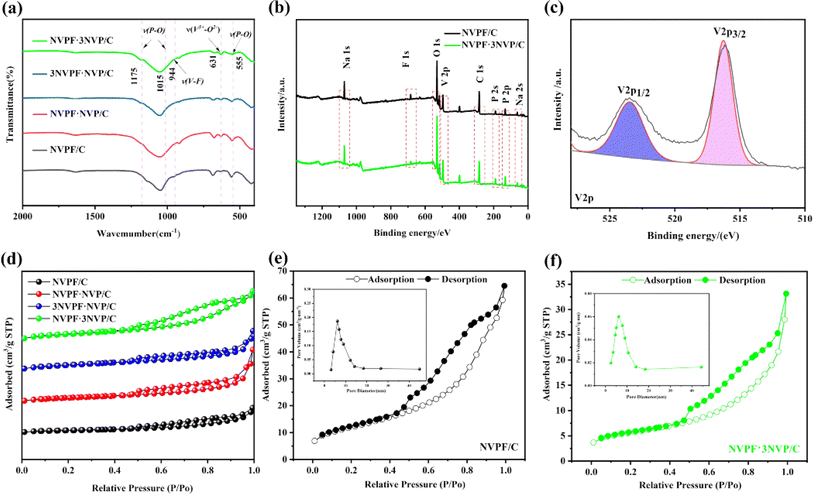
Fig. 5a shows the FT-IR spectra of Na3V2(PO4)3−xF3x/C (x = 0.25, 0.5, 0.75, and 1). Every sample's peak displays a good crystal structure. V3+–O2− is the peak location at 916 cm−1 in the VO6 structure. Additionally, at 1175, 1015, and 555 cm−1, distinctive peaks connected to P–O bonds in the PO4 tetrahedra are seen. Furthermore, XPS was used to examine the vanadium valence state in the NVPF·3NVP/C composites. For all elements labeled with Na, F, O, P, and V, Fig. 5b displays the narrow peaks of NVPF/C and NVPF·3NVP/C in the 0–1200 eV range. The peaks are shown in Fig. 5c. V3+ was present in the NVPF·3NVP/C composite, as evidenced by the division of the V 2p peak into two subpeaks, V3+2p1/2 (523.5 eV) and V3+2p3/2 (516.3 eV), as seen in Fig. 5c.
Nitrogen isothermal adsorption was used to calculate every sample's BET specific surface area (Fig. 5d). Every material exhibited iv-type isotherms, and they were connected to the mesoporous characteristics. Fig. 5e and f displays the pore size distribution plots NVPF/C (6.13 nm), and NVPF·3NVP/C (6.12 nm) have smaller average pore sizes. In addition, compared to NVPF/C (19.8 m2 g−1), NVPF·NVP/C (36.3 m2 g−1), 3NVPF·NVP/C (32.1 m2 g−1), NVPF·3NVP/C (43.2 m2 g−1) has a greater specific surface area, which can offer more pore space and adsorption sites, which is advantageous for the effective penetration of electrolyte.
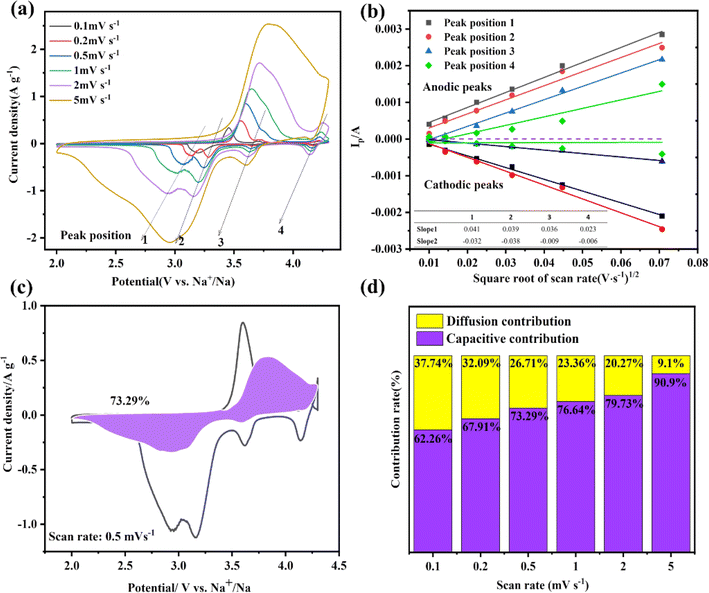
Cyclic voltammetry (CV) was utilized to test the electrochemical behavior of the NVPF·3NVP/C electrode during charging and discharging to learn more about the reaction kinetics of NVPF·3NVP/C. Fig. 6a displays the NVPF·3NVP/C electrode's CV curves at distinct scan speeds. The redox peak of pure NVP material is around 3.4 V, while the two plateaus of the NVPF are positioned at 3.7 V and 4.2 V, respectively.21,22 The combination of the NVP and NVPF phases is responsible for the four peaks that are visible on the CV curve of NVPF·3NVP/C, which are roughly situated at 3.4, 3.6, 3.8, and 4.2 V, respectively (referred to as peaks 1, 2, 3, and 4, correspondingly). As the scanning speed increases, the low potential and high potential zones are where the anodic and cathodic peaks move, separately and the induction effect is enhanced. The Randles–Sevcik equation23 was devoted to computing the Na+ diffusion coefficient, and the resulting linear connection between Ip and v1/2 is exhibited in Fig. 6b.
| IP = 2.69 × 10⁵n3/2ACDNa+1/2ν1/2 | (1) |
A, C, and ν symbolize the electrode area (cm2, in this case, 1.13 cm2), the concentration of Na+ bulk in the active material (mol cm3), and the scanning speed. The calculated diffusion coefficients (DNa+) for the different peaks of the NVPF·3NVP/C are shown in Table 1, where the NVPF·3NVP/C in the 3.6 V region has a DNa+ value of 4.19 × 10⁻⁹ cm2 s−1 in the negative response and 4.06 × 10⁻⁹ cm2 s−1 in the positive response. It is evident that the computed DNa+ value for NVPF is significantly larger than the values for the other voltage zones that correspond to NVPF. Hence, in the two-phase system, the redox pair of NVPF drives the Na+ intercalation kinetics, which coincides with the preceding work.
| Peak voltage | Slope | DNa+/cm2 s−1 | ||
|---|---|---|---|---|
| Charge | Discharge | Charge | Discharge | |
| Position 1 (∼3.4 V) | 0.0409 | −0.0321 | 4.74 × 10⁻⁹ | 2.91 × 10⁻⁹ |
| Position 2 (∼3.6 V) | 0.0384 | −0.0378 | 4.19 × 10⁻⁹ | 4.06 × 10⁻⁹ |
| Position 3 (∼3.8 V) | 0.0364 | −0.0095 | 3.75 × 10⁻⁹ | 2.55 × 10⁻¹⁰ |
| Position 4 (∼4.2 V) | 0.0232 | −0.0064 | 1.52 × 10⁻⁹ | 1.17 × 10⁻¹⁰ |
Analyzing the capacitance impact allowed for a thorough investigation of the sodium storage mechanism in NVPF·3NVP/C composites. Usually, there are two main ways of the sodium storage mechanism: diffusion-controlled mode and capacitive mode. A single approach to ascertain the capacitance impact is to use the subsequent equation.24
| i = avb | (2) |
In eqn (2), “b” is gained from the slope of the log![[thin space (1/6-em)]](https://www.rsc.org/images/entities/char_2009.gif) i vs. log
i vs. log![[thin space (1/6-em)]](https://www.rsc.org/images/entities/char_2009.gif) ν curve, immediately convincing whether the diffusion pattern is indicative of a capacitance-controlled process (b = 1.0) or a diffusion-controlled process (b = 0.5). Fig. S2a and b† show log
ν curve, immediately convincing whether the diffusion pattern is indicative of a capacitance-controlled process (b = 1.0) or a diffusion-controlled process (b = 0.5). Fig. S2a and b† show log![[thin space (1/6-em)]](https://www.rsc.org/images/entities/char_2009.gif) i versus log
i versus log![[thin space (1/6-em)]](https://www.rsc.org/images/entities/char_2009.gif) ν of NVPF/C and NVPF·3NVP/C, correspondingly. b values of 0.62 for the NVPF/C discharge process and 0.63 for the NVPF·3NVP/C discharge process indicate that the kinetic behaviors of both electrodes are under the control of capacitive processes.26 The capacitance contribution and diffusion-controlled contribution of the NVPF·3NVP/C composite were quantitatively analyzed by eqn (3).25
ν of NVPF/C and NVPF·3NVP/C, correspondingly. b values of 0.62 for the NVPF/C discharge process and 0.63 for the NVPF·3NVP/C discharge process indicate that the kinetic behaviors of both electrodes are under the control of capacitive processes.26 The capacitance contribution and diffusion-controlled contribution of the NVPF·3NVP/C composite were quantitatively analyzed by eqn (3).25
| i = k1v + k2v1/2 | (3) |
It is significant to remember that the current response, denoted by i, may be summed up by the diffusion control (k2v1/2) and the capacitive control (k1v) at a fixed potential (V). Fig. 6c shows NVPF·3NVP/C electrode possesses a high capacitive contribution of 73.29% (shaded area) at 0.5 mV s−1. Furthermore, the capacitive contribution ratio of NVPF·3NVP/C at various scan rates is calculated (Fig. S3a–e†) and collected in Fig. 6d. With an increase in scan rate, the proportion of capacitive contribution rises; at 5 mV s−1, it reaches its maximum at 90.9%. The enhanced rate capability of the redesigned NVPF·3NVP/C composite is demonstrated by its high capacitance contribution.
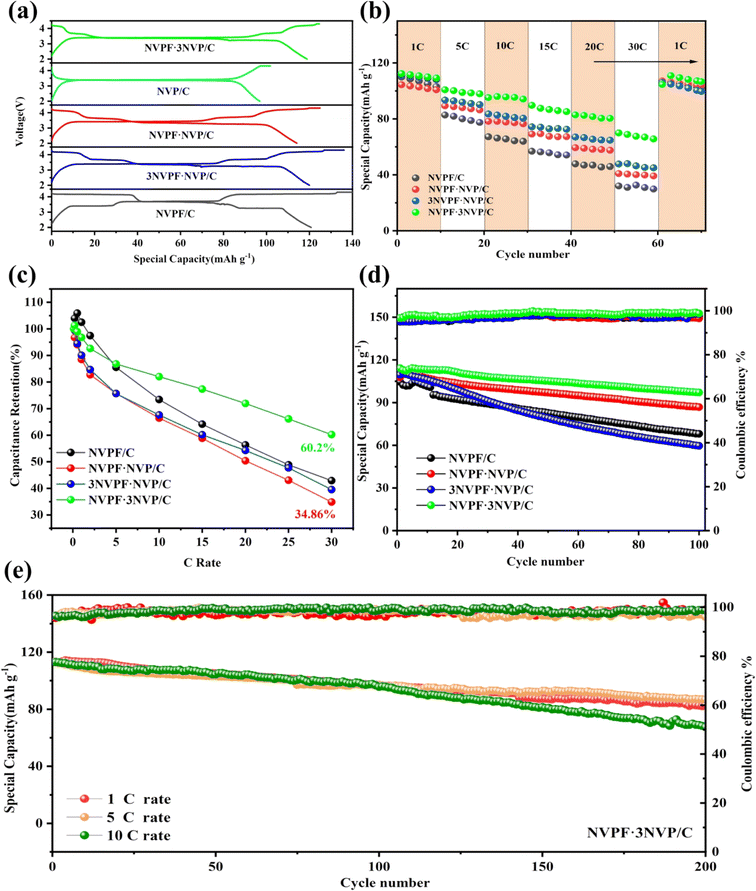
The Na3V2(PO4)3−xF3x/C (x = 0.25, 0.5, 0.75, and 1) electrochemical behavior was assessed using sodium half-cells that were produced and charged/discharged with a constant current. The initial charge/discharge curve of Na3V2(PO4)3−xF3x/C (x = 0, 0.25, 0.5, 0.75, and 1) materials at 0.1C is shown in Fig. 7a. The presence of NVP and NVPF phases results in a multi-platform curve on the NVPF·3NVP/C electrode that closely matches the CV curve. In particular, the NVPF·3NVP/C electrode offered a 120.7 mA h g−1 reversible capacity. As current density increases, the discharge capacity of Na3V2(PO4)3−xF3x/C (x = 0.25, 0.5, 0.75, and 1) decreases as shown in Fig. 7b and c. However, when compared to the other modified NVPF electrodes, the designed NVPF·3NVP/C electrode at higher current density performance increased. The NVPF/C samples' discharge capacities at 1, 10, 15, 20, and 30C were 109.9, 67.2, 56.8, 47.8, and 32 mA h g−1, as seen in Fig. 7b. The NVPF·3NVP/C electrode's specific capacities at 1, 10, 15, 20, and 30C were 112.4, 95.2, 89.7, 82.8, and 69.9 mA h g−1 compared to NVPF/C. A great capacity retention of 109.6 mA h g−1 was acquired when cycling back to 1C. Fig. S4(a)† shows the charge–discharge curves of NVPF·3NVP/C at different rates.
Fig. 7d show the cyclic performance of NVPF/C, NVPF·NVP/C, 3NVPF·NVP/C and NVPF·3NVP/C electrodes. Note that half-cells underwent a single cycle of 0.1C to activate the sample. Using a 1C current density, NVPF·3NVP/C shows a reversible capacity of 112.9 mA h g−1. The benefits of the hybrid phase and the structure of the carbon conductive layer were credited with improving the cycling performance of NVPF·3NVP/C, which showed a capacity retention of 85.8% after 100 cycles. In addition, NVPF·3NVP/C presented exceptional cycling performance at high current density (Fig. 7e). 76.4% of the capacity was kept at 5C after 200 cycles. A discharge capacity of 110.9 mA h g−1 was still delivered by the NVPF·3NVP/C at 10C. With a capacity retention of 64.1%, the final capacity after 200 cycles was 71.1 mA h g−1. Fig. S4(b–d)† show the galvanostatic charge discharge curves of NVPF·3NVP/C at 1C, 5C, and 10C for the initial 3 cycles and at 200th cycle. Therefore, we can infer that the extra carbon layer and NVP phase are conducive to enhancing structural stability and lessening volume shrinking throughout the protracted reaction. The NVPF·3NVP/C anode's sodium storage capacity may be enhanced by its quick reaction kinetics and excellent structural stability, as evidenced by its rate and cycle performances.
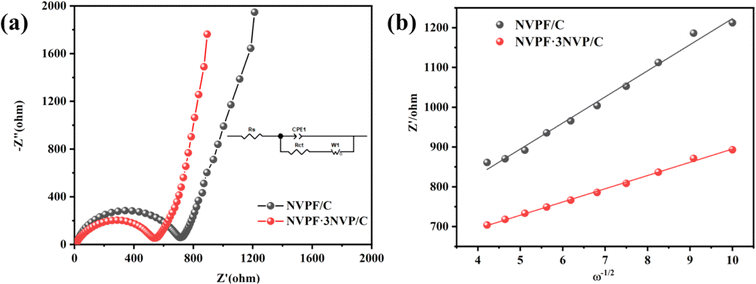
Additionally, the kinetic properties of the electrode reactions of the NVPF/C and NVPF·3NVP/C composites were examined using EIS. Fig. 8a displays the electrode Nyquist plots prior to the two composites cycling. The graphs of both electrodes exhibit a straight line and semicircles on their Nyquist curves. The ohmic resistance (Rs) of the electrode and electrolyte is denoted by the intercepts in the high-frequency region. The charge transfer resistance (Rct), which measures the diffusion of sodium ions between the electrolyte and the electrode, is linked to the semicircle in the mid-high frequency bands. The diffusion of sodium ions in NVPF particles is correlated with the Warburg impedance (Zω) and is represented by a diagonal in the low-frequency band. A condensed equivalent circuit model for analyzing the impedance spectrum is shown in the inset of Fig. 8. Passivated film capacitors and electric double-layer capacitors are referred to as constant phase elements (CPE). Table 1 displays the impedance parameters that were derived from the analogous circuit. Compared to the NVPF/C (655.9 Ω), the Rct of the NVPF·3NVP/C is only 506.3 Ω, indicating a quicker rate of electron transport. Simultaneously, the diffusion coefficients27–30 of sodium ions (DNa+) were calculated using eqn (4) and (5).
| Zreal = Rs + Rct + σω−1/2 | (4) |
 | (5) |
R, F, σ, and ω stand for the gas constant, Faraday constant, Warburg coefficient, and angular frequency in the low-frequency domain. Fig. 8b exhibits the linear fit of Z′ to ω−1/2, with σ representing the slope. Based on eqn (4) and (5), DNa+ is computed, and the consequences are displayed in Table 2. NVPF·3NVP/C exhibits a notable increase in Na+ diffusivity to 2.67 × 10⁻¹³ cm2 s−1, nearly four times greater than NVPF/C (6.67 × 10⁻¹⁴ cm2 s−1). This discovery implies that fast Na+ transport is facilitated by the two-phase composites' excellent channel area for Na+ migration inside their crystal structure.
| Sample | Rs | Rct | σ | DNa+ (cm2 s−1) |
|---|---|---|---|---|
| NVPF/C | 8.3 | 725.1 | 65.6 | 6.67 × 10⁻¹⁴ |
| NVPF·3NVP/C | 11.6 | 506.3 | 33.3 | 2.67 × 10⁻¹³ |
4. Conclusion
In this study, the NVPF·3NVP/C sample was intentionally designed and synthesized. XRD, SEM, and TEM investigations verified the existence of NVPF and NVP phases in the composite. The incorporation of an improved 3D conductive network markedly enhanced electron and ion migration between active particles, as evidenced by kinetic analysis. Moreover, the composite cathode sample displayed a discharge capacity of 120.7 mA h g−1 at 0.1C. Impressively, after 100 cycles at 1C, the NVPF·3NVP/C electrode still maintained 85.8% capacity retention. Furthermore, NVPF·3NVP/C demonstrated a reversible capacity of 110.9 mA h g−1 at 10C with a residual capacity of 71.1 mA h g−1 after 200 cycles. The remarkable electrochemical performance is attributed to its superior kinetic properties, which makes it an extremely interesting choice for cathode replacement materials in SIBs.Conflicts of interest
There are no conflicts to declare.Acknowledgements
This project was financially supported by the National Natural Science Foundation of China (52104300) and the Hunan Provincial Natural Science Foundation of China (2021JJ30264).References
- S. W. Kim, D. H. Seo, X. Ma, G. Ceder and K. Kang, Adv. Energy Mater., 2012, 2, 710–721 CrossRef CAS.
- V. Palomares, P. Serras, I. Villaluenga, K. B. Hueso, J. Carretero-González and T. Rojo, Energy Environ. Sci., 2012, 5, 5884–5901 RSC.
- M. D. Slater, D. Kim, E. Lee and C. S. Johnson, Adv. Funct. Mater., 2012, 23, 947–958 CrossRef.
- Z. Wen, Y. Hu, X. Wu, J. Han and Z. Gu, Adv. Funct. Mater., 2012, 23, 1005–1018 CrossRef.
- Y. Chen, J. Cheng, Z. He, Y. Wang, C. Wang and L. Guo, Ceram. Int., 2020, 46, 27660–27669 CrossRef CAS.
- Y. Chen, J. Cheng, C. Wang, Z. He, Y. Wang, D. Li and L. Guo, Chem. Eng. J., 2021, 413, 127451 CrossRef CAS.
- L. Bi, X. Li, X. Liu, Q. Zheng and D. Lin, ACS Sustain. Chem. Eng., 2019, 7, 7693–7699 CrossRef CAS.
- Y. Chen, Y. Xu, X. Sun and C. Wang, J. Power Sources, 2018, 375, 82–92 CrossRef CAS.
- Y. Chen, Y. Xu, X. Sun, B. Zhang, S. He, L. Li and C. Wang, J. Power Sources, 2018, 378, 423–432 CrossRef CAS.
- W. Song, X. Ji, Y. Yao, H. Zhu, Q. Chen, Q. Sun and C. E. Banks, Phys. Chem. Chem. Phys., 2014, 16, 3055–3061 RSC.
- Y. H. Jung, C. H. Lim and D. K. Kim, J. Mater. Chem. A, 2013, 1, 11350–11354 RSC.
- S. Li, Y. Dong, L. Xu, X. Xu, L. He and L. Mai, Adv. Mater., 2014, 26, 3545–3553 CrossRef CAS PubMed.
- J. Barker, R. K. B. Gover, P. Burns and A. J. Bryan, Electrochem. Solid-State Lett., 2006, 9, A190 CrossRef CAS.
- W. Song, X. Ji, J. Chen, Z. Wu, Y. Zhu, K. Ye, H. Hou, M. Jing and C. E. Banks, Phys. Chem. Chem. Phys., 2015, 17, 159–165 RSC.
- M. Peng, B. Li, H. Yan, D. Zhang, X. Wang, D. Xia and G. Guo, Angew. Chem., 2015, 127, 6552–6556 CrossRef.
- L.-L. Zhang, D. Ma, T. Li, J. Liu, X.-K. Ding, Y.-H. Huang and X.-L. Yang, ACS Appl. Mater. Interfaces, 2018, 10, 36851–36859 CrossRef CAS.
- L. Deng, G. Sun, K. Goh, L.-L. Zheng, F.-D. Yu, X.-L. Sui, L. Zhao and Z.-B. Wang, Electrochim. Acta, 2019, 298, 459–467 CrossRef CAS.
- A. Criado, P. Lavela, C. Pérez-Vicente, G. F. Ortiz and J. L. Tirado, J. Electroanal. Chem., 2020, 856, 113694 CrossRef CAS.
- Y. Mao, X. Zhang, Y. Zhou and W. Chu, Scr. Mater., 2020, 181, 92–96 CrossRef CAS.
- M. Li, Z. Zuo, J. Deng, Q. Yao, Z. Wang, H. Zhou, W.-B. Luo, H.-K. Liu and S.-X. Dou, J. Mater. Chem. A, 2018, 6, 9962–9970 RSC.
- J. Cheng, Y. Chen, S. Sun, Z. Tian, Y. Linghu, Z. Tian, C. Wang, Z. He and L. Guo, Ceram. Int., 2021, 47, 18065–18074 CrossRef CAS.
- P. Hu, X. Wang, T. Wang, L. Chen, J. Ma, Q. Kong, S. Shi and G. Cui, Advanced Science, 2016, 3, 1600112 CrossRef PubMed.
- M. Bianchini, F. Fauth, N. Brisset, F. Weill, E. Suard, C. Masquelier and L. Croguennec, Chem. Mater., 2015, 27, 3009–3020 CrossRef CAS.
- K. Kretschmer, B. Sun, J. Zhang, X. Xie, H. Liu and G. Wang, Small, 2017, 13, 1603318 CrossRef PubMed.
- G. Liu, M. Huang, Z. Zhang, B. Xi, H. Li and S. Xiong, J. Energy Chem., 2021, 53, 175–184 CrossRef CAS.
- H. Kim, H. Lim, H.-S. Kim, K. J. Kim, D. Byun and W. Choi, Nano Res., 2018, 12, 397–404 CrossRef.
- J.-f. Zhang, X.-w. Wang, B. Zhang, C.-l. Peng, H. Tong and Z.-h. Yang, Electrochim. Acta, 2015, 169, 462–469 CrossRef CAS.
- R. Klee, P. Lavela, M. J. Aragón, R. Alcántara and J. L. Tirado, J. Power Sources, 2016, 313, 73–80 CrossRef CAS.
- H. Shu, X. Wang, Q. Wu, B. Hu, X. Yang, Q. Wei, Q. Liang, Y. Bai, M. Zhou, C. Wu, M. Chen, A. Wang and L. Jiang, J. Power Sources, 2013, 237, 149–155 CrossRef CAS.
- J.-F. Zhang, X.-W. Wang, B. Zhang and H. Tong, Electrochim. Acta, 2015, 180, 507–513 CrossRef CAS.
Footnotes |
| † Electronic supplementary information (ESI) available. See DOI: https://doi.org/10.1039/d4ra01653j |
| ‡ These authors contributed equally to this work. |
| This journal is © The Royal Society of Chemistry 2024 |

