
 Open Access Article
 This Open Access Article is licensed under a Creative Commons Attribution-Non Commercial 3.0 Unported Licence
Insight into heavy metal chemical fractions in ash collected from municipal and industrial waste incinerators in northern Vietnam†
Thi Thu Thuy Nguyena,
Truong Xuan Vuong *a,
Thi Thu Ha Phama,
Quoc Anh Hoangb,
Binh Minh Tub,
Thi Hue Nguyenc and
Thi Thu Phuong Nguyend
*a,
Thi Thu Ha Phama,
Quoc Anh Hoangb,
Binh Minh Tub,
Thi Hue Nguyenc and
Thi Thu Phuong Nguyend
aFaculty of Chemistry, TNU-University of Science, Tan Thinh Ward, Thai Nguyen City 24000, Vietnam. E-mail: xuanvt@tnus.edu.vn
bUniversity of Science, Vietnam National University, Hanoi, 19 Le Thanh Tong, Hanoi 11000, Vietnam
cInstitute of Science and Technology for Energy and Environment, Vietnam Academy of Science and Technology, 18 Hoang Quoc Viet Street, Cau Giay, Hanoi, Vietnam
dFaculty of Chemical Technology, Hanoi University of Industry, 298 Cau Dien Street, Bac Tu Liem District, Hanoi, Vietnam
First published on 21st May 2024
Abstract
This investigation involved the collection of fly ash and bottom ash specimens from seven waste incinerators situated in the northern provinces of Vietnam, aimed at assessing the composition and distribution patterns of five chemical fractions of heavy metals (Pb, Cr, As, Cd Cu, and Zn) present in incinerator waste ash. The outcomes reveal that fly ash exhibited a relatively elevated concentration of industrial waste metals (25–66%) such as As, Cd, and Pb primarily in exchangeable (F1) and carbonate fractions (F2), which are mobile forms susceptible to environmental dissolution and consequential bioaccumulation posing health risks to humans. The predominant states of the metals Cr, Cu, and Zn were identified as residual, Fe–Mn oxide, and carbonate, respectively, with their relative proportions showing minimal variation. Conversely, heavy metals were predominantly present in residual residue and Fe–Mn bound form (F3) in bottom ash derived from both residential and commercial waste incineration operations. The non-carcinogenic hazard indices (HI) associated with the examined metals, ranked for both adults and children, were as follows: Pb > Cr > As > Cd > Cu > Zn. Notably, the HI values for Pb, Cr, and As exceeded the permissible threshold (HI > 1) for children. However, the risk of As, Cd, and Pb-related cancer via exposure pathways remained within acceptable limits for both age groups. Conversely, the probability of carcinogenic effects attributable to Cr surpassed the permissible threshold (>10−4), indicating significant health concerns associated with heavy metals in waste incinerators for humans, particularly children.
1. Introduction
In recent years in Vietnam, the total volume of solid waste, encompassing urban, medical, and industrial waste, has experienced a rapid tenfold increase from 3.8 kg to 41 kg during the period 1990–2015. This surge is attributed to the processes of urbanization, industrialization, a robust economy, and population growth.1,2 Annually, Vietnam generates over 15 million tons of waste, a figure expected to escalate rapidly in the coming decade. Despite urban areas constituting only 24% of the country's population, they contribute over 6 million tons, accounting for 50% of the nation's urban waste.3 Out of the 3.6 million tons of plastic waste produced yearly, only 10 to 15% undergo recycling, with the remainder treated through landfilling or incineration.4 Many developing countries face limitations in waste management activities such as collection, sorting, and processing, primarily due to insufficient funds, low technology, loose regulations, and weak community awareness, leading to restricted recycling efforts.5Currently, solid waste is predominantly incinerated, a method capable of reducing waste volume by 90% and weight by approximately 70%.6–8 Tangri (2003) conducted a recent study on the conversion of waste into electrical energy. The research revealed that solid waste incinerators emit the highest level of greenhouse gases per unit of electricity generated (1707 g CO2e kWh−1)9 compared to all other energy sources (ranging from 2.4 to 991 g CO2e kWh−1). Additionally, when compared to alternative energy sources like natural gas, solid waste incinerators produce higher levels of air pollutants. Factors such as poor technology, aging infrastructure, and prolonged operational hours contribute to excessive emissions, including 637.7 million tons of CO2e, 61.9 million tons of NOx, and 161![[thin space (1/6-em)]](https://www.rsc.org/images/entities/char_2009.gif) 200 tons of SO2. Municipal solid waste incinerators are regarded as contentious technologies in the US due to their air pollution impacts, often leading to public outrage.9 Incinerators serve as significant sources of harmful air emissions, encompassing dioxins, lead, mercury, nitrogen and sulfur oxides, particulates, and other organic pollutants, alongside greenhouse gases.9 Moreover, incinerators are identified as the primary contributors to air pollution in certain urban areas.10
200 tons of SO2. Municipal solid waste incinerators are regarded as contentious technologies in the US due to their air pollution impacts, often leading to public outrage.9 Incinerators serve as significant sources of harmful air emissions, encompassing dioxins, lead, mercury, nitrogen and sulfur oxides, particulates, and other organic pollutants, alongside greenhouse gases.9 Moreover, incinerators are identified as the primary contributors to air pollution in certain urban areas.10
Despite the advantages of incinerating urban and industrial waste in reducing toxicity and recovering resources, research indicated that metals underwent complex chemical transformations during high-temperature processes such as oxidation, reduction, chlorination, and other chemical processes within incineration furnaces. Metals can be released through gas pathways or self-trapped in fly ash and bottom ash. Fly ash collected in dust filter bags has a high content of heavy metals and small particle size, making it prone to environmental dispersion.11 The release of heavy metals from fly ash and bottom ash into the environment can have adverse health effects on both humans and the environment.5,12 Recent observations showed that waste incinerators were a source of pollution in urban water and air.13,14 The presence of heavy metals such as As, Cd, Cr, Pb, Cu, Zn… has been reported in incinerator ash with relatively high concentrations.15–18 Previous reports indicated that many heavy metals concentrate in bottom ash during incineration. Metals such as Cu, and Cr, as well as volatile metals like Zn, and Pb, still predominantly remain in bottom ash, ranging from 46 to 94%.19,20 The risk of cancer for both children and adults from metals in ash and the surrounding soil near incinerators exceeds permissible limits, as reported by Shi et al. and Aendo et al.21,22 However, the total metal content alone cannot accurately assess the ecological and environmental risks. The greatest toxicity of heavy metals occurs when they exist in a labile form (or easily exchangeable form) in the environment, as labile metals can be easily released into the surrounding environment, leading to accumulation in organisms and subsequent entry into the human body through the food chain.23
On the other hand, to minimize the large amount of ash from incinerators in solid waste management, fly ash is suggested for use as fertilizer in agriculture, and bottom ash is reused for roads and construction materials like cement and bricks.24,25 Therefore, understanding the characteristics of metals or their chemical bonding forms, especially the labile form, is essential for filtering metals in fly ash and bottom ash. The dynamic nature of metals depends on many factors, including bonding forms, pH, or the amount of organic matter. The Tessier sequential extraction method is widely used to analyze metal bonding forms in solid samples26 This method is widely applied in many studies evaluating the ability of metals in incinerator ash,19,27 soil samples, road dust,28–30 biological reclamation of coal ash, mining waste, and biological sludge.31–34
Understanding the distribution and fractions of heavy metals in ash is crucial for assessing the environmental impact of municipal and industrial incinerators. This knowledge contributes to evaluating potential risks and developing effective mitigation strategies. However, there is limited information related to the chemical fractions of heavy metals in ash from incinerators in Vietnam. Hence, it is urgent to address a gap in existing scientific literature, providing new insights and data that contribute to the overall understanding of heavy metal behavior in incinerator ash. This can stimulate further research and inform future studies in similar contexts.
In this study, four household waste incinerators and three industrial waste incinerators were collected from four large provinces in northern Vietnam. The Tessier sequential extraction procedure was applied to provide an overview of the bonding forms, distribution, and mobility of heavy metals in fly ash and bottom ash from household and industrial waste incinerators. Additionally, the non-carcinogenic and carcinogenic risks to humans were assessed. This research aims to elucidate the characteristics of heavy metals and provides insights into the levels of contaminants that may enter soil, water, and air, impacting human health.
2. Materials and methods
2.1. Materials
A total of 42 samples, comprising fly ash and bottom ash, were collected from 7 waste incineration facilities (3 industrial and 4 municipal incinerations) located in the provinces of Northern Vietnam. Detailed information on the incinerators is presented in Fig. 1 and Table S1.† Sampling occurred in August and September 2020. Fly ash samples, representing fine particulate matter from the combustion process, were obtained from the incinerator's emission control system. Bottom ash consists of coarse particles concentrated at the incinerator's bottom, ranging in size from fine sand to pebbles (0.125 mm to 2 mm). Samples were collected as point samples using manual methods with collection tools such as brushes, shovels, and specialized trays following Vietnamese standards.35 After each sampling process, the collection tools were washed and cleaned with deionized water (18.2 MΩ), acetone, and n-hexane to prevent cross-contamination with previous samples. The collected samples were then transferred to polyethylene (PE) bags with zip locks to avoid environmental contamination.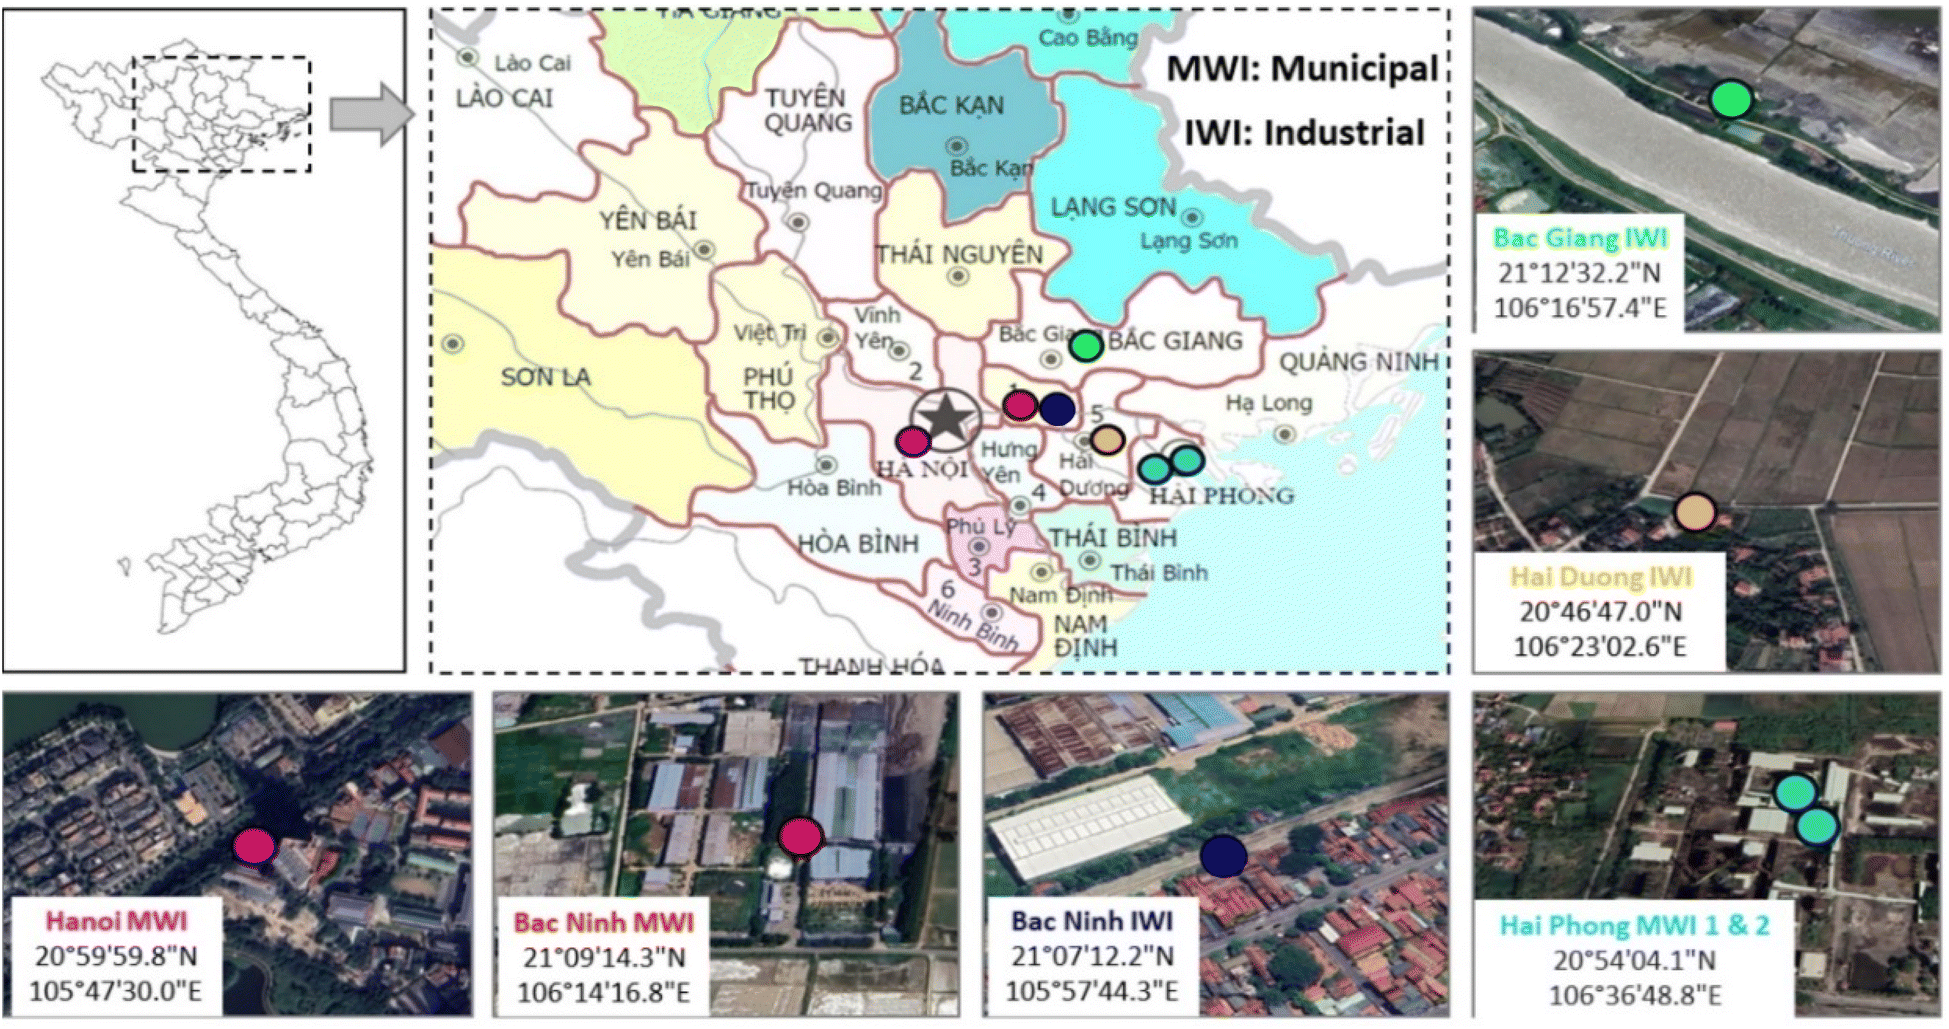 | ||
| Fig. 1 Map of ash sampling area from waste incinerators in northern Vietnam. | ||
2.2. Methods
Scanning electron microscopy (FE-SEM, JSM-6700F, JEOL, Akishima Tokyo, Japan) in conjunction with energy dispersive X-ray spectroscopy (EDX) was used to analyze the morphology and elemental composition of specific areas inside the samples.
| BF = C_Bio/C_total | (1) |
| CF = (F1 + F2 + F3 + F4)/F5 | (2) |
 | (3) |
 | (4) |
 | (5) |
 | (6) |
| HI = ∑HQi | (7) |
| CRi = IDi × CSf | (8) |
| CR = ∑CRi | (9) |
3. Results and discussion
3.1. Concentration and characteristics of metals distribution in municipal solid waste incinerators and industrial waste incinerators
The average concentration and characteristic distribution of six studied metals were assessed in four municipal solid waste incinerators and three industrial waste incinerators (Table S2,† Fig. 2). The average metal concentrations in fly ash were arranged in the following order: Zn (2809 mg kg−1) > Pb (2169 mg kg−1) > Cu (1508 mg kg−1) > Cr (665.8 mg kg−1) > As (30.81 mg kg−1) > Cd (20.95 mg kg−1). These results align with trends found in previous studies.45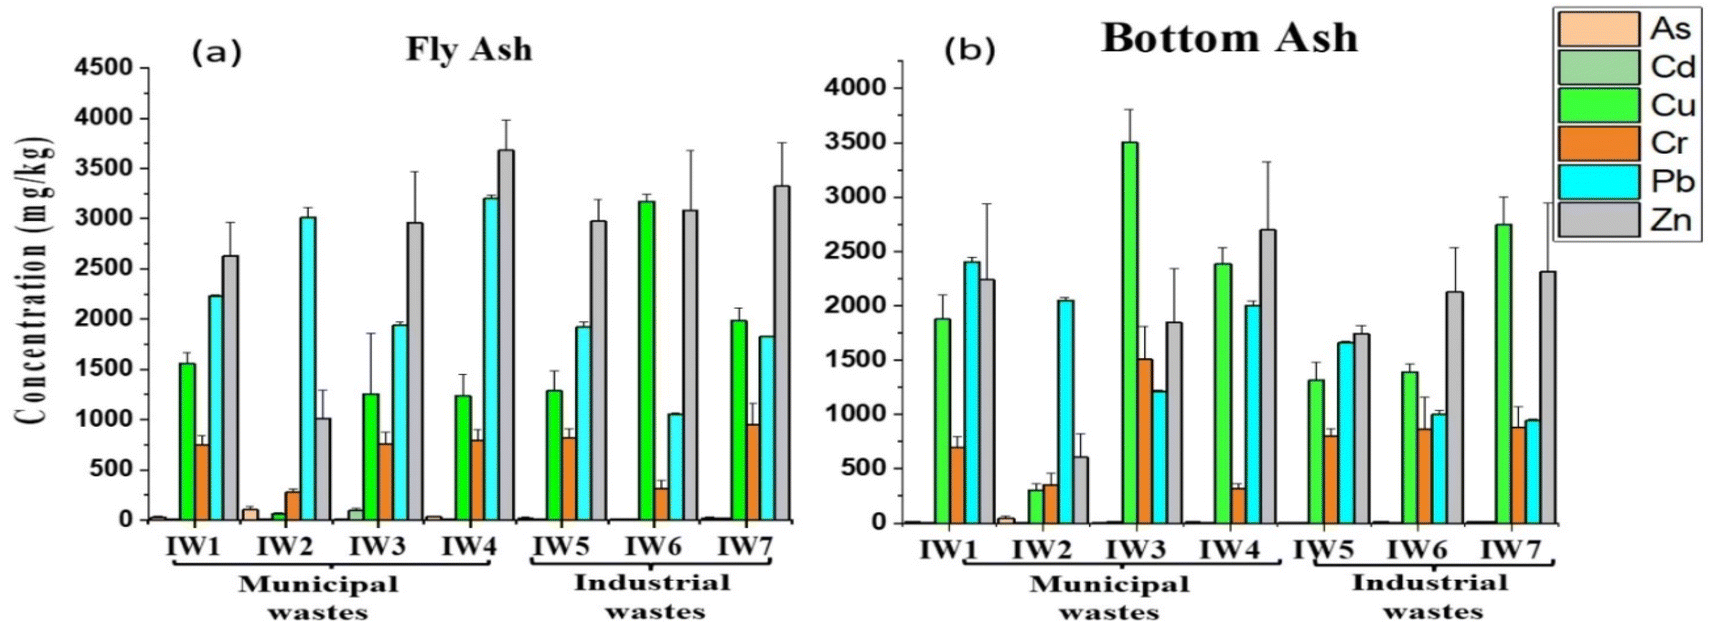 | ||
| Fig. 2 Total concentration of heavy metals (a) in fly ash and (b) bottom ash collected from municipal and industrial waste incinerators (IW1: Bac Ninh 1, IW2: Hai Phong 1, IW3: Ha Noi, IW4: Hai Phong 2, IW5: Bac Ninh 2, IW6: Bac Giang; IW7: Hai Duong). | ||
The concentrations of Cu, Pb, and Cr were similar to the results reported in fly ash from municipal solid waste incinerators in Japan in 2019 (Cu: 1200 mg kg−1, Pb: 3100 mg kg−1, Cr: 490 mg kg−1),15 and in China (Cu: 1710 mg kg−1, Pb: 1537 mg kg−1 in 2020 and Cu: 1055 mg kg−1, Pb: 3374 mg kg−1 in 2019).16,46 However, the concentrations of Zn and Cd were relatively low compared to studies in China (Zn: 12187 mg kg−1, Cd: 119 mg kg−1 in 2019 and Zn: 9612 mg kg−1, Cd: 196.8 mg kg−1 in 2020),16,46 and in Japan.15 In bottom ash, the concentrations of As (14.5 mg kg−1), Cd (6.75 mg kg−1), Pb (1611 mg kg−1), and Zn (1938 mg kg−1) tended to be lower than in fly ash, while Cu (1933 mg kg−1) and Cr (775 mg kg−1) were higher than in fly ash. The metal concentrations in the bottom ash of incinerators in Vietnam were similar to results reported in municipal solid waste incinerators in Japan (Cu: 890–3300 mg kg−1, Pb: 140–2700 mg kg−1, Cd: 2.8–12 mg kg−1, Zn: 1500–2900 mg kg−1),47 and France (386–2825 mg kg−1), but lower than the results in the bottom ash of municipal solid waste incinerators in Hangzhou, Ningbo (Zn: 2825 mg kg−1, Pb: 1900 mg kg−1), and Jinhua (Cd: 7.5 mg kg−1, As: 26.4 mg kg−1), and Wenzhou (As: 119 mg kg−1, Cr: 1224 mg kg−1, Zn: 3347 mg kg−1) of China.12,19 To the best of our knowledge, there is presently scant information concerning heavy metal presence in industrial waste incinerators, rendering comparisons with the data presented in this study difficult.
The average distribution ratios of the six heavy metals (As, Cd, Cu, Cr, Pb, Zn) in fly ash from municipal solid waste incinerators were: (65–79%), (43–92%), (16–45%), (33–71%), (48–62%), (54–62%) (Fig. 3). In corresponding industrial waste incinerators, the ratios were: (42–71%), (46–64%), (42–70%), (27–52%), (51–66%), (59–63%).
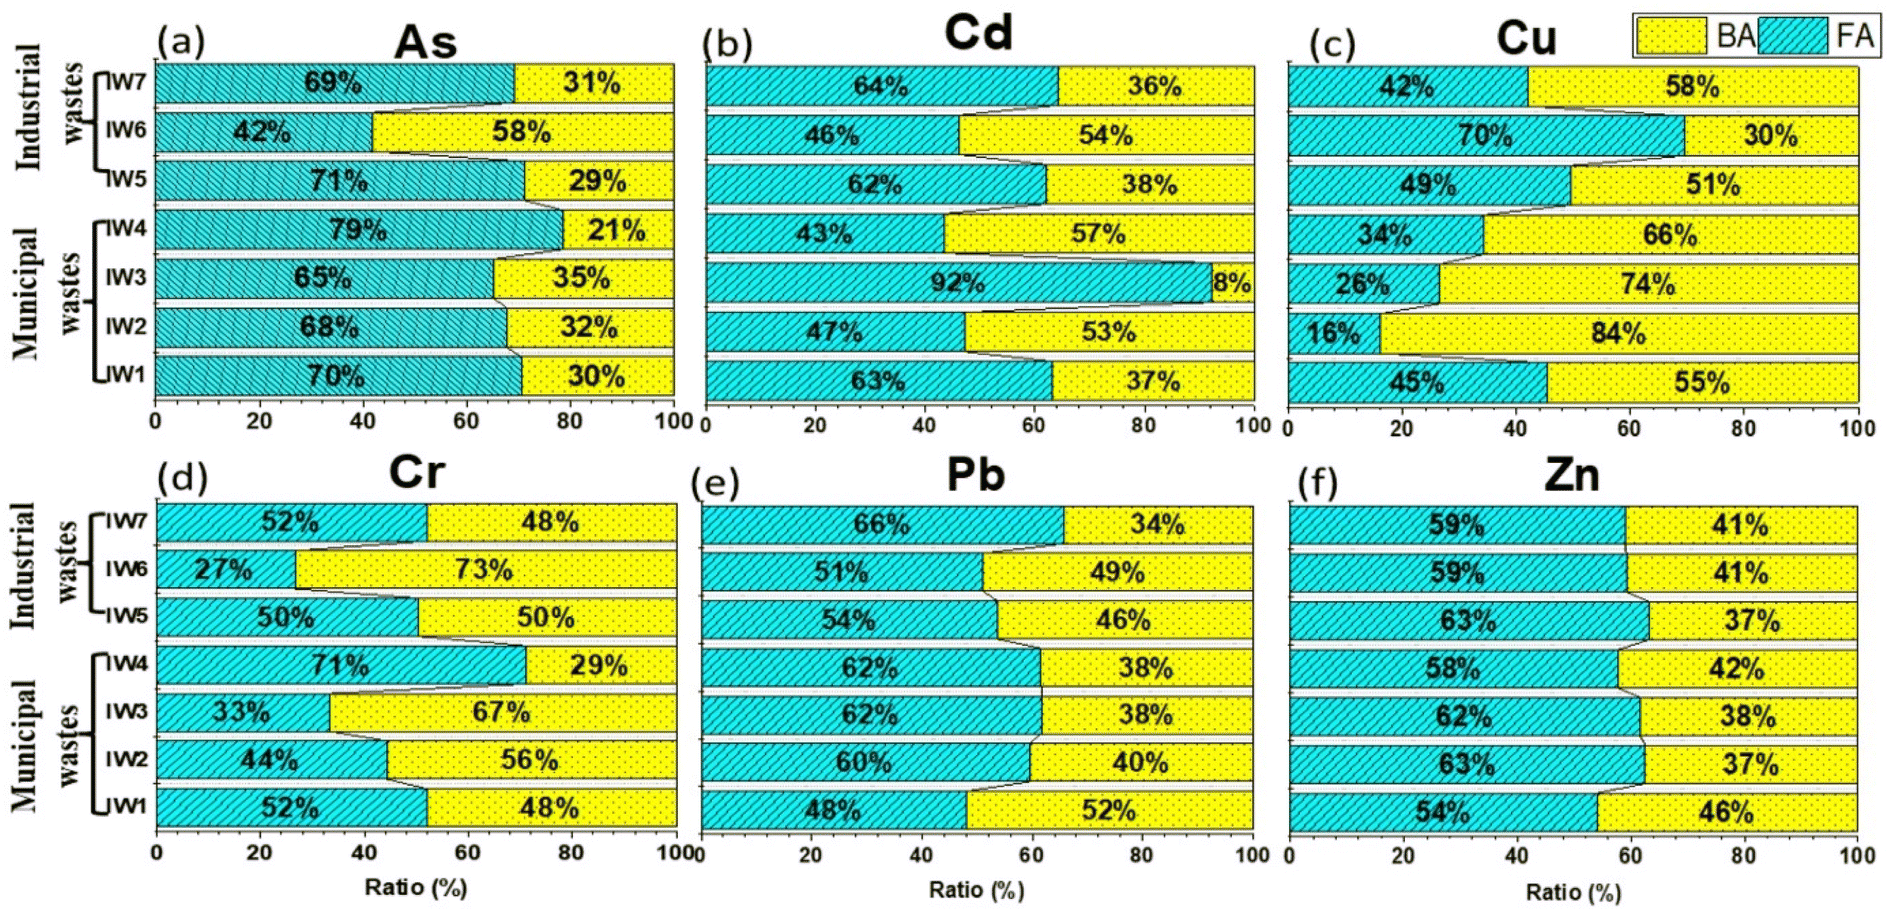 | ||
| Fig. 3 Distribution ratio of total metals As – (a), Cd – (b), Cu – (c), Cr – (d), Pb – (e), and Zn – (f) in fly ash and bottom ash of waste incinerators (IW1: Bac Ninh 1, IW2: Hai Phong 1, IW3: Ha Noi, IW4: Hai Phong 2, IW5: Bac Ninh 2, IW6: Bac Giang; IW7: Hai Duong). | ||
In corresponding industrial waste incinerators, the ratios were: (42–71%), (46–64%), (42–70%), (27–52%), (51–66%), (59–63%). It is noticeable that metals such as As and Cd tended to occupy a higher proportion of fly ash from municipal solid waste incinerators, while metals like Cu dominated in samples collected from industrial waste incinerators. The remaining metals, Cr, Pb, and Zn, had similar percentage ratios in both types of incinerators (Anova, p > 0.05).
In bottom ash, the average distribution ratios of the studied metals in municipal solid waste incinerators were: As (21–35%), Cd (8–57%), Cu (55–84%), Cr (29–67%), Pb (38–52%), Zn (37–46%). For industrial waste incinerators, the corresponding ratios were: (29–58%), (36–54%), (30–58%), (48–73%), (34–49%), (37–41%). In contrast to fly ash, the average distribution ratios of metals showed no significant differences between municipal solid waste incinerators and industrial waste incinerators (p > 0.05). Calculated results also indicated that metals such as As, Cd, Pb, and Zn were prone to vaporize during combustion, subsequently enriching on the surface of fly ash particles, leading to a higher concentration in fly ash. Cu, on the other hand, tended to distribute more in the bottom ash of municipal solid waste incinerators (Anova, p < 0.05). Chromium demonstrated an even distribution between fly ash and bottom ash, consistent with the findings of Fu. et al. 2018.48 Previous studies also revealed that elements (As, Pb, Cd, and Zn) constituted approximately 40–50% of fly ash.48 However, in some incinerators, the distribution did not align with chemical characteristics. The difference in the distribution of the same element between municipal solid waste incinerators and industrial waste incinerators may be closely related to factors such as emissions, types of incinerated waste, and incinerator temperatures. An efficient flue gas treatment system can also reduce the metal content in fly ash.49 High moisture content in municipal solid waste significantly affects the distribution of fly ash and bottom ash.49
3.2. Surface characteristics of fly ash and bottom ash collected from incineration plants
The SEM analysis results indicate that the surface of the bottom ash is irregular (Fig. 4). Bottom ash from industrial incinerators exhibits a surface consisting of particles with more uneven sizes compared to those from municipal waste incinerators. This disparity may stem from the industrial incinerators burning a more diverse array of waste types, resulting in a less uniform surface of ash particles due to variations in composition. In contrast, the particle sizes of fly ash appeared finer than those of bottom ash. Additionally, the fly ash from municipal waste incinerators was more uniform and cohesive compared to that from industrial counterparts. Thus, there was a slight disparity in the surface morphology of fly ash and bottom ash from different incinerators, which may be closely linked to differences in chemical composition as well as the concentration of heavy metals in the ash samples. | ||
| Fig. 4 SEM images of the bottom ash (a, b) and the fly ash (c, d) collected from municipal and industrial waste incinerators. | ||
EDX analysis provides a relatively comprehensive overview of the elemental composition on the surface of the ash samples. The EDX analysis results of fly ash and bottom ash are also depicted in Fig. S2 (see ESI†) and Fig. 5. The EDX analysis indicates that the main components of bottom ash were Fe, C, O, Ca, Cl, Si, S, K, Al, Mg, and Na, while those of fly ash included Fe, C, O, S, Cd, Pb, Zn, Mn, Cl, S, K, Si (Fig. S2†). The presence of these elements was reported in previous research studies.50,51 The EDX mapping of the six heavy metals, including Pb, Zn, As, Cu, Cd, and Cr, in the studied fly ash and bottom ash samples is shown in Fig. 5.
 | ||
| Fig. 5 The EDX map spectrum of fly ash (a) and bottom ash (b); SEM micrographs illustrate the analyzed areas of fly ash (c) and bottom ash (d). EDX mapping for Pb (c1, d1), Zn (c2, d2), Cu (c3, d3), As (c4, d4), Cd (c5, d5), and Cr (c6, d6) for the fly ash and bottom ash collected from the incinerator. | ||
3.3. Speciation characteristics and correlation of metals in fly ash and bottom ash
| Metals | Incinerators | F1 | F2 | F3 | F4 | F5 | Total metal | CF | BF |
|---|---|---|---|---|---|---|---|---|---|
| As | IW1 | 0.502 | 0.83 | 16.54 | 2.963 | 6.17 | 26.99 | 3.382 | 0.773 |
| IW2 | 22.32 | 38.70 | 14.08 | 0.812 | 31.64 | 107.5 | 2.401 | 0.710 | |
| IW3 | 1.773 | 1.582 | 1.173 | 0.742 | 0.990 | 6.241 | 5.322 | 0.844 | |
| IW4 | 1.844 | 3.181 | 14.95 | 2.270 | 11.39 | 33.63 | 1.955 | 0.662 | |
| IW5 | 0.685 | 6.063 | 0.781 | 4.770 | 4.980 | 17.25 | 2.473 | 0.711 | |
| IW6 | 0.451 | 0.142 | 2.434 | 0.743 | 4.355 | 8.122 | 0.874 | 0.462 | |
| IW7 | 1.082 | 12.21 | 1.392 | 1.492 | 1.662 | 17.83 | 9.734 | 0.910 | |
| Mean | 4.093 | 8.962 | 7.333 | 1.970 | 8.741 | 31.09 | 2.560 | 0.724 | |
| Cd | IW1 | 0.841 | 0.921 | 4.102 | 1.102 | 2.341 | 9.305 | 2.981 | 0.753 |
| IW2 | 1.402 | 1.522 | 1.521 | 1.543 | 1.372 | 7.344 | 4.382 | 0.811 | |
| IW3 | 65.69 | 13.59 | 3.753 | 1.034 | 6.384 | 90.43 | 13.19 | 0.913 | |
| IW4 | 1.334 | 1.663 | 0.460 | 1.612 | 0.082 | 5.142 | 62.31 | 0.981 | |
| IW5 | 0.760 | 1.554 | 1.482 | 0.511 | 0.633 | 4.923 | 6.88 | 0.871 | |
| IW6 | 0.042 | 1.961 | 1.141 | 1.646 | 1.336 | 6.110 | 3.59 | 0.780 | |
| IW7 | 0.332 | 11.48 | 0.293 | 1.454 | 2.334 | 15.89 | 5.82 | 0.852 | |
| Mean | 10.06 | 4.672 | 1.822 | 1.273 | 2.063 | 19.88 | 8.63 | 0.902 | |
| Cu | IW1 | 113.8 | 53.25 | 605.3 | 200.8 | 516.9 | 1490 | 1.88 | 0.652 |
| IW2 | 0.852 | 0.520 | 9.892 | 0.77 | 39.81 | 51.83 | 0.304 | 0.230 | |
| IW3 | 322.6 | 310.2 | 335.5 | 103.7 | 303.5 | 1375 | 3.535 | 0.784 | |
| IW4 | 79.13 | 80.44 | 283.3 | 49.23 | 764.9 | 1257 | 0.645 | 0.393 | |
| IW5 | 42.20 | 170.9 | 25.35 | 102.8 | 301.6 | 642.8 | 1.131 | 0.532 | |
| IW6 | 16.80 | 921.6 | 167.8 | 54.23 | 1929 | 3089 | 0.603 | 0.384 | |
| IW7 | 235.6 | 137.8 | 127.4 | 136.0 | 357.4 | 994.3 | 1.784 | 0.640 | |
| Mean | 115.8 | 239.2 | 222.1 | 92.50 | 601.9 | 1272 | 1.113 | 0.532 | |
| Cr | IW1 | 83.80 | 53.15 | 149.9 | 32.97 | 374.9 | 694.8 | 0.852 | 0.465 |
| IW2 | 3.102 | 10.93 | 1.510 | 9.74 | 277.0 | 302.3 | 0.094 | 0.083 | |
| IW3 | 47.91 | 71.34 | 176.9 | 41.22 | 377.4 | 714.7 | 0.890 | 0.474 | |
| IW4 | 39.63 | 90.44 | 209.0 | 39.11 | 466.1 | 844.3 | 0.812 | 0.452 | |
| IW5 | 57.35 | 95.90 | 21.02 | 40.20 | 522.1 | 736.6 | 0.413 | 0.294 | |
| IW6 | 0.263 | 16.54 | 19.61 | 7.160 | 247.6 | 291.1 | 0.183 | 0.155 | |
| IW7 | 1.341 | 94.25 | 52.56 | 8.583 | 727.1 | 883.8 | 0.221 | 0.183 | |
| Mean | 33.34 | 61.79 | 90.07 | 25.57 | 427.5 | 638.2 | 0.495 | 0.335 | |
| Pb | IW1 | 430.3 | 353.1 | 451.1 | 317.3 | 628.9 | 2181 | 2.475 | 0.712 |
| IW2 | 358.6 | 164.6 | 250.3 | 169.7 | 2187 | 3130 | 0.436 | 0.305 | |
| IW3 | 461.2 | 497.3 | 71.04 | 1121 | 1172 | 3322 | 1.840 | 0.651 | |
| IW4 | 377.5 | 30.01 | 133.4 | 223.2 | 70.19 | 834.3 | 10.89 | 0.923 | |
| IW5 | 202.2 | 542.5 | 209.9 | 248.5 | 210.1 | 1413 | 5.731 | 0.850 | |
| IW6 | 414.8 | 4563 | 305.1 | 318.3 | 529.9 | 6131 | 10.57 | 0.914 | |
| IW7 | 55.60 | 23.82 | 37.93 | 23.62 | 59.11 | 200.1 | 2.383 | 0.702 | |
| Mean | 328.6 | 882.1 | 208.4 | 345.9 | 693.9 | 2459 | 2.544 | 0.721 | |
| Zn | IW1 | 244.7 | 4.513 | 710.5 | 763.0 | 735.7 | 2458 | 2.342 | 0.706 |
| IW2 | 32.22 | 72.85 | 22.12 | 5.100 | 792.2 | 924.5 | 0.170 | 0.140 | |
| IW3 | 670.3 | 836.3 | 814.8 | 347.9 | 815.2 | 3485 | 3.274 | 0.773 | |
| IW4 | 118.4 | 937.6 | 1003 | 118.9 | 1192.3 | 3370 | 1.832 | 0.655 | |
| IW5 | 414.6 | 745.9 | 65.95 | 796.4 | 737.1 | 2760 | 2.743 | 0.734 | |
| IW6 | 2.08 | 703.3 | 914.8 | 789.8 | 749.6 | 3159 | 3.226 | 0.760 | |
| IW7 | 457.4 | 904.4 | 952.2 | 547.9 | 613.6 | 3475 | 4.660 | 0.822 | |
| Mean | 277.1 | 600.7 | 640.4 | 481.3 | 805.1 | 2804 | 2.481 | 0.713 |
 | ||
| Fig. 6 Distribution ratio of heavy metals fractions in fly ash (a, b) and bottom ash (c, d) collected from municipal and industrial waste incinerators. | ||
Results indicate that metals such as Cu and Cr were predominantly present in the residual form F5, with ratios of 39–55% and 59–78%, respectively. In fly ash, Cr primarily exists as Cr3+, and both Cu and Cr can form bonds with organic compounds and sulfides, which during combustion transform into stable oxide compounds, therefore, their concentrations were relatively high in the residual form.48,52 In all fly ash samples, As accounted for a relatively high proportion in the carbonate form (F2) with ratios of (25–43%), followed by the residual form (F5) (25–29%), Fe–Mn oxide form F3 at 11–27%, exchangeable form F1, and organic form F4 with similar ratios (4–16%). Cd was mainly present in mobile forms F2 and F1, with the highest percentage ratios reaching 56% and 62%, respectively, while the remaining forms had comparable ratios. This finding suggests that Cd was highly mobile in the environment, and is consistent with findings reported by Chen in 2020 (with 95.90% of Cd in exchangeable and reducing forms).11 Multivariate regression analysis (PCA) of metal binding forms in municipal solid waste and industrial waste incinerators was assessed using Kaiser criteria,53 as shown in Fig. 7. For municipal solid waste incinerators, consisting mainly of food waste and nylon, all five binding forms accounted for the majority in PC1 (86.39%) and PC2 at 12.03%. Fractions F2 and F3 primarily originated from municipal solid waste incinerators for Zn and Cu, while F1, F4, and F5 were more pronounced for Pb. As and Cd, on the other hand, contributed to PC2, mainly in chemical forms F1 and F2, with Cr presented in chemical fraction F5. Conversely, for industrial waste incinerators, predominantly consisting of nylon, packaging, fabric, paper, and pressed sludge, fractions F1 and F2 dominated the structure of PC1 (71.82%) for the metal groups Pb, Cd, and As. Fractions F3, F4, and F5, related to Cu and Zn, contribute to PC2 (17.25%). Thus, it can be observed that in both municipal and industrial waste incinerator fly ash, potential emission sources include mobile forms F1, F2, F3 for metals such as As, Cd, Pb, and forms F4, F5 for metals such as Cr, Zn, and Cu.
 | ||
| Fig. 7 Multivariate PCA analysis of heavy metals fractions in bottom ash from industrial waste (a), municipal incinerators (b) and fly-ash from industrial waste (c), municipal (d) incinerators. | ||
| Metals | Incinerators | F1 | F2 | F3 | F4 | F5 | Total metals | CF | BF |
|---|---|---|---|---|---|---|---|---|---|
| As | IW1 | 0.734 | 0.965 | 4.380 | 0.625 | 4.935 | 11.64 | 1.360 | 0.576 |
| IW2 | 0.731 | 14.16 | 12.43 | 0.465 | 25.01 | 52.79 | 1.110 | 0.526 | |
| IW4 | 0.569 | 0.838 | 0.513 | 0.613 | 0.681 | 3.210 | 3.720 | 0.788 | |
| IW6 | 2.944 | 0.076 | 1.275 | 0.750 | 2.844 | 7.890 | 1.770 | 0.640 | |
| IW3 | 0.630 | 2.625 | 0.735 | 0.520 | 3.635 | 8.150 | 1.240 | 0.554 | |
| IW5 | 0.925 | 0.488 | 7.413 | 0.719 | 1.894 | 11.44 | 5.040 | 0.834 | |
| IW7 | 0.863 | 1.350 | 1.656 | 0.988 | 4.500 | 9.360 | 1.080 | 0.519 | |
| Mean | 1.056 | 2.928 | 4.057 | 0.668 | 6.213 | 14.92 | 1.400 | 0.584 | |
| Cd | IW1 | 2.845 | 0.095 | 1.035 | 1.375 | 0.852 | 6.200 | 6.280 | 0.863 |
| IW2 | 1.240 | 1.520 | 1.525 | 1.520 | 1.355 | 7.160 | 4.280 | 0.811 | |
| IW4 | 1.281 | 1.488 | 1.744 | 1.725 | 1.438 | 7.680 | 4.340 | 0.813 | |
| IW6 | 2.350 | 0.544 | 1.675 | 1.763 | 0.325 | 6.660 | 19.48 | 0.951 | |
| IW3 | 0.460 | 0.235 | 1.295 | 1.525 | 0.070 | 3.590 | 50.21 | 0.980 | |
| IW5 | 1.263 | 1.369 | 1.144 | 1.725 | 0.663 | 6.160 | 8.300 | 0.892 | |
| IW7 | 1.719 | 1.806 | 1.888 | 1.869 | 1.675 | 8.960 | 4.350 | 0.813 | |
| Mean | 1.594 | 1.008 | 1.472 | 1.643 | 0.911 | 6.630 | 6.280 | 0.863 | |
| Cu | IW1 | 619.3 | 423.7 | 171.4 | 59.45 | 539.8 | 1813 | 2.360 | 0.702 |
| IW2 | 0.820 | 5.020 | 4.270 | 0.895 | 263.2 | 274.2 | 0.040 | 0.040 | |
| IW4 | 736.2 | 717.8 | 611.3 | 754.8 | 607.3 | 3427 | 4.640 | 0.823 | |
| IW6 | 734.8 | 340.5 | 360.0 | 90.70 | 731.8 | 2258 | 2.090 | 0.676 | |
| IW3 | 397.8 | 141.2 | 113.0 | 56.80 | 607.8 | 1317 | 1.170 | 0.538 | |
| IW5 | 70.94 | 216.8 | 524.8 | 86.88 | 401.8 | 1301 | 2.240 | 0.691 | |
| IW7 | 582.9 | 663.8 | 766.6 | 312.5 | 424.3 | 2750 | 5.480 | 0.846 | |
| Mean | 448.9 | 358.4 | 364.5 | 194.6 | 510.8 | 1877 | 2.670 | 0.728 | |
| Cr | IW1 | 1.415 | 0.710 | 49.68 | 10.38 | 675.8 | 737.9 | 0.090 | 0.084 |
| IW2 | 0.940 | 3.940 | 0.080 | 6.405 | 304.8 | 316.1 | 0.040 | 0.036 | |
| IW4 | 204.1 | 296.0 | 215.9 | 61.60 | 826.1 | 1604 | 0.940 | 0.485 | |
| IW6 | 73.06 | 22.48 | 10.39 | 5.588 | 235.7 | 347.2 | 0.470 | 0.321 | |
| IW3 | 0.575 | 45.73 | 13.07 | 9.575 | 664.6 | 733.5 | 0.100 | 0.094 | |
| IW5 | 96.00 | 105.3 | 318.1 | 24.40 | 360.3 | 903.9 | 1.510 | 0.601 | |
| IW7 | 2.063 | 67.31 | 27.92 | 9.188 | 827.0 | 933.5 | 0.130 | 0.114 | |
| Mean | 54.00 | 77.30 | 90.70 | 18.20 | 556.3 | 796.6 | 0.430 | 0.302 | |
| Pb | IW1 | 312.4 | 252.6 | 674.4 | 203.1 | 785.9 | 2228 | 1.840 | 0.647 |
| IW2 | 478.6 | 562.2 | 341.7 | 180.2 | 620.4 | 2183 | 2.520 | 0.716 | |
| IW4 | 261.4 | 408.0 | 248.3 | 183.0 | 158.8 | 1260 | 6.930 | 0.874 | |
| IW6 | 725.3 | 664.1 | 310.6 | 350.8 | 71.88 | 2123 | 28.530 | 0.966 | |
| IW3 | 201.4 | 704.6 | 256.4 | 220.4 | 426.7 | 1809 | 3.240 | 0.764 | |
| IW5 | 104.8 | 63.45 | 418.8 | 97.88 | 398.1 | 1083 | 1.720 | 0.632 | |
| IW7 | 89.88 | 314.2 | 86.15 | 75.65 | 307.9 | 873.7 | 1.840 | 0.648 | |
| Mean | 310.5 | 424.2 | 333.7 | 187.3 | 395.7 | 1651 | 3.170 | 0.760 | |
| Zn | IW1 | 518.4 | 528.0 | 443.8 | 323.1 | 510.1 | 2323 | 3.550 | 0.780 |
| IW2 | 11.83 | 76.50 | 26.06 | 4.808 | 504.1 | 623.3 | 0.240 | 0.191 | |
| IW4 | 420.3 | 405.6 | 440.6 | 116.8 | 375.0 | 1758 | 3.690 | 0.787 | |
| IW6 | 605.0 | 650.8 | 587.6 | 56.20 | 661.5 | 2561 | 2.870 | 0.742 | |
| IW3 | 176.6 | 521.2 | 329.9 | 17.30 | 514.8 | 1560 | 2.030 | 0.670 | |
| IW5 | 174.7 | 41.80 | 602.5 | 461.3 | 657.7 | 1938 | 1.950 | 0.661 | |
| IW7 | 669.0 | 603.3 | 659.6 | 76.60 | 494.3 | 2503 | 4.060 | 0.802 | |
| Mean | 368.0 | 403.9 | 441.4 | 150.9 | 531.1 | 1895 | 2.570 | 0.720 |
Cd ratios for chemical forms F1 and F4 were equivalent, ranging from 18–28% and 23–27%, respectively, followed by form F3 (22–23%), and the lowest was F5, with F2 having lower ratios at 13–14% and 13–18%.
The distribution in bottom ash for metals As, Cu, Pb, and Zn was in the residual fraction, with corresponding percentage ratios of (35–44%), (27–28%), (21–30%), and 28%. There was a noticeable difference in the percentage distribution of metals in the Fe–Mn oxide fraction in bottom ash compared to fly ash, with ratios being relatively high and uniform, namely (25–34%), (22–23%), (15–26%), (9–14%), 20%, and (21–27%). This suggests a strong association of metals with Fe–Mn oxides in the combustion waste, especially in industrial waste incinerators. The presence of stable thermal-resistant Fe and Mn oxide compounds in bottom ash contributes to the formation of bonds with metals. Total mobile fractions (F1 + F2) in bottom ash were 40–47%; 36–44%; 39–46%; 23–2 8%; 36–41% for Pb; Zn; Cu, and As, Cd. For Cd and Pb, chlorine compounds were formed during incineration at temperatures between 600–700 °C, easily vaporizing and self-trapping at lower temperatures. This explains the lower percentage of Cd and Pb in the F1 form in fly ash compared to bottom ash.49 In the presence of oxygen in the flue gas, Cu in bottom ash can form carbonate and sulfate compounds, while Zn can form volatile ZnCl2 compounds, which then transform into zinc oxide (ZnO), zinc carbonate, or zinc sulfate, condensing on ash particles.55 Hence, for Cu and Zn, the percentage ratios among binding forms did not differ significantly (Anova, p > 0.05). In waste incinerators, As may bind with minerals (Al or Mg), forming compounds such as AsAlO4 below 850 K and As2Mg3O8 between 850 K and 1050 K. At temperatures higher than 1050 K, AsO(g), a gaseous oxide is the predominant species. As had intermediate solubility, resulting in lower mobility compared to Cd and Zn.53
The binding forms of metals in bottom ash were also evaluated using multivariate regression analysis (PCA) for both municipal and industrial waste. In municipal waste incinerators, binding forms F1 to F4 belong to the main structure of PC1 (88.7%), with F5 in PC2 at 8.38%. Analysis results show that for municipal waste incinerators, Cu is mainly present in forms F2 and F5, while Zn and Cr were in fraction F5. Pb gradually decreased from F2 to F4. As and Cd belonged to the same group in form F1. For industrial waste incinerators, metals Pb, Cu, and Zn were concentrated in forms F1 to F4 in the main structure of PC1 (86.5%), while Cr in form F5 belonged to PC2 (10.3%).
| Metals fractions | Fly ash | Bottom ash | |||||||||||
|---|---|---|---|---|---|---|---|---|---|---|---|---|---|
| Total metal | CF | BF | pH | TC | OC | Total metal | CF | BF | pH | TC | OC | ||
| As | F1 | 0.54 | 0.071 | 0.071 | 0.61 | −0.54 | −0.61 | 0.14 | 0.14 | 0.14 | −0.43 | −0.43 | −0.071 |
| F2 | 0.54 | 0.29 | 0.29 | 0.036 | −0.25 | 0.036 | 0.5 | −0.8 | −0.79 | 0.071 | 0.21 | 0.36 | |
| F3 | 0.68 | −0.32 | −0.32 | −0.14 | −0.75 | −0.43 | 0.93 | −0.2 | −0.18 | 0.18 | −0.21 | −0.39 | |
| F4 | 0.38 | 0.13 | 0.13 | −0.29 | −0.36 | 0.34 | −0.25 | 0.07 | 0.071 | −0.5 | −0.43 | 0.036 | |
| F5 | 0.89 | −0.54 | −0.54 | 0.11 | −0.61 | −0.5 | 0.79 | −0.8 | −0.79 | −0.36 | −0.43 | 0.071 | |
| Cd | F1 | 0.32 | 0.43 | 0.43 | 0.79 | −0.46 | −0.64 | 0.32 | −0 | −0.04 | −0.57 | −0.89 | −0.43 |
| F2 | 0.43 | 0.5 | 0.5 | 0.21 | 0.43 | 0.071 | 0.79 | −0.7 | −0.68 | 0.14 | 0.11 | 0.25 | |
| F3 | 0.29 | −0.36 | −0.36 | 0.25 | −0.071 | −0.14 | 0.82 | −0.4 | −0.36 | −0.29 | −0.036 | 0.54 | |
| F4 | −0.18 | −0.18 | −0.18 | −0.071 | −0.14 | −0.46 | 0.49 | 0.13 | 0.13 | −0.31 | 0.018 | 0.45 | |
| F5 | 0.93 | −0.32 | −0.32 | −0.11 | 0.036 | 0.25 | 0.89 | −0.9 | −0.86 | 0.071 | −0.29 | −0.18 | |
| Cu | F1 | 0.29 | 0.93 | 0.93 | 0 | −0.14 | 0.29 | 0.89 | 0.57 | 0.57 | −0.36 | −0.39 | −0.11 |
| F2 | 0.5 | 0.21 | 0.21 | 0.071 | 0.82 | 0.25 | 0.93 | 0.93 | 0.93 | −0.18 | −0.36 | −0.21 | |
| F3 | 0.79 | 0.68 | 0.68 | 0.071 | −0.29 | −0.11 | 0.75 | 0.89 | 0.89 | −0.036 | −0.071 | −0.036 | |
| F4 | 0.39 | 0.86 | 0.86 | −0.54 | −0.036 | 0.71 | 0.89 | 0.82 | 0.82 | −0.11 | −0.14 | −0.036 | |
| F5 | 0.82 | 0 | 0 | −0.25 | 0.18 | −0.071 | 0.54 | 0.04 | 0.036 | −0.5 | −0.071 | 0.36 | |
| Cr | F1 | 0.29 | 0.74 | 0.74 | 0.18 | −0.32 | 0.071 | 0.64 | 0.86 | 0.86 | 0.29 | −0.036 | −0.43 |
| F2 | 0.88 | 0.31 | 0.31 | −0.11 | 0.071 | 0.5 | 0.75 | 0.82 | 0.82 | 0.5 | 0.61 | 0.11 | |
| F3 | 0.52 | 0.9 | 0.9 | 0.32 | −0.5 | −0.21 | 0.82 | 0.68 | 0.68 | 0.54 | 0.21 | −0.57 | |
| F4 | 0.4 | 0.76 | 0.76 | 0.68 | −0.14 | −0.21 | 0.75 | 0.46 | 0.46 | 0.71 | 0.39 | −0.54 | |
| F5 | 0.9 | 0.19 | 0.19 | −0.14 | −0.14 | 0.46 | 0.82 | 0.07 | 0.071 | 0.036 | 0 | 0 | |
| Pb | F1 | 0.68 | 0 | 0 | 0.43 | −0.036 | −0.43 | 0.82 | 0.54 | 0.54 | −0.29 | −0.46 | −0.18 |
| F2 | 0.75 | 0.21 | 0.21 | 0.14 | 0.75 | 0.071 | 0.25 | 0.82 | 0.82 | −0.36 | 0.21 | 0.75 | |
| F3 | 0.5 | 0.18 | 0.18 | −0.21 | 0 | −0.11 | 0.64 | −0.5 | −0.5 | 0.21 | −0.25 | −0.71 | |
| F4 | 0.75 | 0.14 | 0.14 | 0.36 | 0.43 | −0.14 | 0.61 | 0.64 | 0.64 | −0.39 | −0.14 | 0.14 | |
| F5 | 0.75 | −0.61 | −0.61 | 0.43 | 0.036 | −0.43 | 0.54 | −0.6 | −0.61 | 0.21 | −0.036 | −0.32 | |
| Zn | F1 | 0.61 | 0.61 | 0.61 | −0.071 | 0.036 | 0.43 | 0.86 | 0.86 | 0.86 | −0.79 | −0.61 | 0.21 |
| F2 | 0.79 | 0.36 | 0.36 | 0.29 | −0.11 | −0.11 | 0.75 | 0.61 | 0.61 | −0.96 | −0.64 | 0.39 | |
| F3 | 0.71 | 0.39 | 0.39 | 0.071 | −0.18 | −0.071 | 0.82 | 0.5 | 0.5 | −0.29 | −0.29 | −0.071 | |
| F4 | −0.036 | 0.43 | 0.43 | −0.5 | 0.64 | 0.71 | 0.39 | 0.32 | 0.32 | 0.32 | −0.11 | −0.71 | |
| F5 | 0.18 | −0.43 | −0.43 | 0.93 | −0.21 | −0.93 | 0.32 | −0.5 | −0.5 | −0.21 | 0 | 0.036 | |
The total Pb content correlates positively with all five binding forms in fly ash, while TC values were closely related to the carbonate form. The organic form of Zn had a significant correlation with TC (p = 0.64) and OC (p = 0.71), indicating that an increase in total carbon content led to an increase in the organic form. These results align with the findings reported by Srivastava 2020.56 Correlation analysis of biologically available forms in fly ash revealed insignificant correlations for mobile forms F1, F2, and F3 with volatile metals As, Cd, and Pb. However, for forms F1, F3, and F4 of Cu, Cr, and Zn, the values of BF and CF showed relatively high correlations (p values were 0.93, 0.74, and 0.61, respectively). This suggests that an increase in the concentration of these soluble forms enhances the biological availability of Cu, Cr, and Zn.
In bottom ash samples, Spearman correlation analysis results showed that pH was mostly inversely correlated with binding forms. This finding indicates that pH changes did not significantly affect the binding forms of As, Cd, Cu, Pb, and Zn in bottom ash. For Cr, however, pH had a fairly high correlation with the organic form (p = 0.71) and a mild correlation with the carbonate form (p = 0.50) and Fe–Mn oxide form (p = 0.54). Factors TC and OC had negligible effects on the distribution of metal forms in bottom ash, except for the correlation of TC with the carbonate form of Cr (p = 0.61) and OC with the carbonate form of Pb (p = 0.75). According to our observations, the total metal content had a close correlation with forms F3, and F5 of As, Cd, and Cr, and forms F1, F3 of Pb and Zn. For Cu, the distribution of mobile forms F1, F2, F3, and F4 is dominated by the total metal content. From the analysis results, there was no significant positive correlation between biological availability and binding forms for As and Cd. However, for Pb, there was a high correlation between biological availability (BF, CF) and forms F1, F2, and F4. Meanwhile, Cu, Cr, and Zn had a strong correlation of biological availability with forms F1, F2, and F3.
3.4. Health risk assessment for humans from heavy metals in waste incineration ash
 | ||
| Fig. 8 Hazard quotient (HQ) and hazard index (HI) of heavy metals for children (a, c) and adults (b, d) through three main exposure pathways: ingesting (HQing), inhalation (HQinh), and dermal (HQderaml) in fly ash and bottom ash samples. | ||
The estimated average intake for children through oral ingestion, direct inhalation, and dermal contact is 9.3 times, 6.5 times, and 2.8 times higher, respectively, than the estimated values for adults. Thus, the oral ingestion pathway contributes significantly, aligning with the observed objective differences between children and adults in body weight, work habits, and slight variations in respiratory volume. In fly ash, the non-carcinogenic risk (HI) of metals for both children and adults decreases in the following order (Fig. 8): Pb > Cr > As > Cd > Cu > Zn. Notably, the HI values for Pb, Cr, and As in children are 8.05, 3.16, and 1.32, respectively, significantly exceeding the permissible values (HI > 1). This indicates a high health risk for children in areas near waste incineration facilities and ash disposal sites. The HI values for adults are all below 1 (1.31 × 10⁻² to 8.72 × 10⁻¹). The findings align with various investigations concerning the health hazards associated with metals present in fly ash from municipal solid waste and soils contaminated by municipal solid waste, as reported by Shi et al. (2020). They examined the risks posed by oral ingestion, dermal contact, and inhalation, indicating Hazard Indices (HI) for children: As (1.0612), Pb (2.0676), and Cd (0.975).21 Similarly, Gujre et al. (2021) reported corresponding HI values for children: Cr (2.017) and Zn (0.060).28
The average HI values in bottom ash are lower than those in fly ash, ranging from 5.99 to 0.084 for children and 0.648 to 0.009 for adults. The highest non-carcinogenic risk for both children and adults was still associated with Pb, while Zn poses the lowest risk (ANOVA, p = 0.05, p = 0.756). Specifically, the HI values for children for Pb and Cr are 5.99 and 3.70, respectively, exceeding the permissible threshold (HI > 1). The HI values in this study are higher than the metal risk assessment in the surrounding soil of incinerators conducted by Aendo. et al. 2022 (HI of Pb: 2.0).22
It is evident that both Pb and Cr negatively impact the health of children in proximity to waste incineration facilities. Thus, children living near waste incineration facilities may bear the brunt of the adverse effects of metals such as Pb, Cr, and Cd. These metals are linked to health impacts and genetic alterations (genotoxicity and epigenetic modifications). Prolonged exposure to Pb can lead to chronic and acute toxicity, resulting in immune system imbalances, hypertension, anemia, intellectual impairment, digestive issues, delayed bone development, delayed milk tooth growth, vitamin D deficiency, calcium substitution, infertility, and reduced hearing capacity.22,57 This highlights the need for careful consideration and investigation to propose solutions for reducing the levels of Cr and Pb in waste incineration ash.
| Fly ash | ||||
|---|---|---|---|---|
| Child | As | Cd | Cr | Pb |
| a CRing, CRinh, CRdermal: the cancer risk from ingesting, inhalation, and dermal respectively. | ||||
| CRing | 5.91 × 10⁻⁴ | 2.01 × 10⁻³ | 4.26 × 10⁻³ | 2.35 × 10⁻⁴ |
| CRinh | 1.71 × 10⁻⁷ | 5.64 × 10⁻⁸ | 1.20 × 10⁻⁷ | 3.27 × 10⁻⁸ |
| CRdermal | 1.65 × 10⁻⁶ | 5.63 × 10⁻⁶ | 1.19 × 10⁻⁵ | — |
| ∑CR | 5.93 × 10⁻⁴ | 2.02 × 10⁻³ | 4.27 × 10⁻³ | 2.35 × 10⁻⁴ |
|
||||
| Adult | ||||
| CRing | 6.33 × 10⁻⁵ | 2.16 × 10⁻⁴ | 4.56 × 10⁻⁴ | 2.52 × 10⁻⁵ |
| CRinh | 6.15 × 10⁻⁸ | 2.03 × 10⁻⁸ | 4.29 × 10⁻⁸ | 1.18 × 10⁻⁸ |
| CRdermal | 2.52 × 10⁻⁷ | 8.64 × 10⁻⁷ | 1.82 × 10⁻⁶ | — |
| ∑CR | 6.36 × 10⁻⁵ | 2.16 × 10⁻⁴ | 4.58 × 10⁻⁴ | 2.53 × 10⁻⁵ |
| Bottom ash | ||||
|---|---|---|---|---|
| Child | As | Cd | Cr | Pb |
| CRing | 2.78 × 10⁻⁴ | 1.29 × 10⁻⁴ | 4.96 × 10⁻³ | 1.75 × 10⁻⁴ |
| CRinh | 8.04 × 10⁻⁸ | 3.75 × 10⁻⁸ | 1.39 × 10⁻⁷ | 2.43 × 10⁻⁸ |
| CRdermal | 7.77 × 10⁻⁷ | 3.63 × 10⁻⁷ | 1.39 × 10⁻⁵ | — |
| ∑CR | 2.78 × 10⁻⁴ | 1.30 × 10⁻⁴ | 4.97 × 10⁻³ | 1.75 × 10⁻⁴ |
|
||||
| Adult | ||||
| CRing | 2.97 × 10⁻⁵ | 6.94 × 10⁻⁵ | 1.06 × 10⁻³ | 1.88 × 10⁻⁵ |
| CRinh | 2.90 × 10⁻⁸ | 6.53 × 10⁻⁹ | 9.99 × 10⁻⁸ | 9.28 × 10⁻⁵ |
| CRdermal | 1.19 × 10⁻⁷ | 2.77 × 10⁻⁷ | 4.24 × 10⁻⁶ | — |
| ∑CR | 2.98 × 10⁻⁵ | 6.97 × 10⁻⁵ | 1.06 × 10⁻³ | 1.12 × 10⁻⁴ |
The carcinogenic risk from metals in the waste ash was also assessed for both children and adults, with the risks ranked as follows for both age groups: CRing > CRdermal > CRinh. The cancer risk from oral ingestion accounted for over 99% of the risk compared to the risks from inhalation (CRinh) and dermal contact (CRdermal). The highest cancer risk was found for Cr (ANOVA, p = 0.05, p = 0.602), being 2.1–18 times higher in fly ash and 1.79–3.83 times higher in bottom ash compared to the other metals. The total cancer risk (CR) for all three exposure pathways in children is 1.56–9.3 times higher than in adults, ranging from 2.35 × 10⁻⁴ to 4.27 × 10⁻³ in fly ash and 1.30 × 10⁻⁴ to 4.97 × 10⁻³ in bottom ash. These results are similar to those published in the assessment of metal carcinogenic risks in waste ash and the surrounding soil of incinerators by Shi et al. 2020 (As: 4.09–1.76 × 10⁻⁵; Cd: 2.66–6.20 × 10⁻⁴; Cr: 1.52–3.54 × 10⁻⁵),21 Aendo et al. 2020 (Cd: 2.8 × 10⁻⁴, Cr: 2.0 × 10⁻⁴).22 Thus, in both fly ash and bottom ash, the cancer risks from As, Cd, and Pb for both children and adults fell within acceptable limits (10−6 to 10−4). However, for Cr, the cancer risk exceeded permissible thresholds (>10−4). Long-term exposure to hexavalent chromium compounds (Cr VI) causes gastric ulcers, intestinal ulcers, hepatitis, and nephritis. Particularly for workers directly involved in incineration, inhaling Cr(VI) fumes and dust can lead to lung, nasal, and sinus cancers. Exposure to Cr(VI) can also impact pregnancy and lead to miscarriages. Specifically, children born to mothers exposed to Cr(VI) may experience respiratory issues and congenital defects.57–59 Inorganic forms of arsenic have a high potential to cause cancer in the skin, lungs, bladder, urinary tract, kidneys, and liver. Exposure to Pb and Cd, whether through occupation or the environment, increases the risk of various cancers, especially lung cancer, prostate cancer, and pancreatic cancer. Lead and cadmium poisoning leads to underdeveloped gray matter in the brain, reduced intelligence quotient (IQ) in children, and significantly impacts both physical and mental development. At very high levels, lead toxicity can result in death.60,61 Considering the health risks to humans, strict control policies and waste management plans are essential, especially for developing countries where incineration is a primary waste disposal method. In accordance with a 2002 report from Korea, notable concentrations of Pb and Cr metals are observed in incinerator ash constituents, including paper (Pb: 106 mg kg−1, Cr: 28 mg kg−1), rubber, and leather (Pb: 95 mg kg−1, Cd: 31 mg kg−1), wood (Pb: 33 mg kg−1), plastic (Cr: 68 mg kg−1, Pb: 13 mg kg−1), textile (Pb: 47 mg kg−1), and miscellaneous sources (Cr: 30 mg kg−1, Pb: 219 mg kg−1). This observation underscores the substantial emission of Pb and Cr from paper and plastic materials. Consequently, the implementation of rigorous and effective waste management protocols is imperative. In Vietnam, the annual generation of plastic waste surpasses 1.8 million tons. Per capita plastic waste has surged more than tenfold in the preceding three decades to reach 41.3 kg per capita in 2018, rendering it the third highest in Southeast Asia. Despite the government's aspiration to achieve zero single-use plastic waste nationally by 2025, these endeavors have garnered limited attention. Immediate investment is essential in Vietnam to fortify this sector, entailing measures such as augmenting environmental levies on plastic products and bags, overhauling household waste collection and treatment procedures, and instituting a novel extended producer responsibility scheme. It is imperative to comprehensively grasp public perceptions and responses to plastic pollution to formulate behavioral interventions and awareness campaigns in collaboration with local, national, and international non-governmental organizations and governmental entities.
4. Conclusions
This study represents one of the earliest investigations into the levels of contamination by five chemical fractions of heavy metals present in waste ash originating from both industrial and residential garbage incinerators in Vietnam. Fly ash exhibited a notable concentration of volatile metals (As, Cd, Pb, and Zn) distributed homogeneously within the material, whereas bottom ash from domestic incinerators displays higher quantities of Cr and Cu. In domestic waste incinerators, Cu predominantly existed in carbonate (F2) and residue fractions (F5), while Zn and Cr were primarily present in F5; Pb exhibits a decreasing proportion from F2 to F4. Among the metals studied, As and Cd occupied a larger fraction of the mobile F1 fractions. In industrial furnaces, Pb, Cu, and Zn were predominantly concentrated in F2 and F4, while Cr was mostly found in F5. Moreover, the study demonstrates a significant association between Pb's bioavailability and fractions F1, F2, and F4. Fractions F1, F2, and F3 exhibited a relatively strong correlation with bioavailability for Cu, Cr, and Zn. For both children and adults, lifetime cancer risk (CR) and non-cancer risk (HI) were assessed. The following is the sequence of the daily intake of fly ash and bottom ash through the three exposure pathways: intake > skin contact > breathing directly. Through oral ingestion, direct inhalation, and skin contact, children are predicted to consume an average of 9.3 times, 6.5 times, and 2.8 times more than adults. For the children, the HI values for Pb, Cr, As in fly ash and Pb, Cr in bottom ash were much higher than the allowable limits (HI > 1). Every adult's HI value is less than 1. Children's and adults' carcinogenic risk from metals in the waste ash was also evaluated, and risks were ranked as follows for the two age groups: Dermal > CRing > CRinh. Adult and child As, Cd, and Pb cancer risks were within acceptable limits (10−6 to 10−4) in both fly ash and bottom ash. But for Cr, the risk of cancer was higher than acceptable bounds (>10−4). These findings underscore the substantial health risks posed by incinerator ash, particularly for nearby children, necessitating the implementation of effective waste management strategies for incinerator residues.Author contributions
Conceptualization: [Thi Thu Thuy Nguyen]; methodology: [Thi Thu Thuy Nguyen]; formal analysis and investigation: [Thi Thu Ha Pham, Minh Binh Tu, Thi Hue Nguyen]; writing – original draft preparation: [Truong Xuan Vuong]; writing – review and editing [Truong Xuan Vuong, Thi Thu Thuy Nguyen], [Anh Quoc Hoang]; funding acquisition [Thi Thu Thuy Nguyen]; resources [Thi Thu Thuy Nguyen], [Truong Xuan Vuong]; supervision: [Truong Xuan Vuong], [Minh Binh Tu]; sample preparation and analysis on SEM and EDS mapping [Thi Thu Phuong Nguyen].Conflicts of interest
The authors have no competing interests to declare that are relevant to the content of this article.Acknowledgements
This research was supported by Project of the TNU-University of Sciences in Vietnam under Grant number CS2023-TN06-07.References
- Q. V. Khuc, T. Dang, M. Tran, D. T. Nguyen, T. Nguyen, P. Pham and T. Tran, Household-level strategies to tackle plastic waste pollution in a transitional country, Urban Sci., 2023, 7, 20 CrossRef.
- G. Milne, Plastics a growing concern-a Vietnam perspective. Ipsos|Plastic A Growing Concern, 2019 Search PubMed.
- K. Van Den Berg and T. C. Duong, Solid and Industrial Hazardous Waste Management Assessment: Options and Actions Areas, The World Bank, 2018, 128402, pp. 1–131 Search PubMed.
- K. Hughes and V. N. Thinh, How Viet Nam Can Reduce Marine Plastics by 75% in the Next Decade, available online https://www.weforum.org/agenda/2020/12/how-viet-nam-can-reduce-marine-plastics-by-75-in-the-next-decade/ Search PubMed.
- N. H. Hoang and C. Fogarassy, Sustainability evaluation of municipal solid waste management system for Hanoi (Vietnam)—Why to choose the ‘Waste-to-Energy’ concept, Sustainability, 2020, 12, 1085 CrossRef.
- H. Cheng and Y. Hu, Municipal solid waste (MSW) as a renewable source of energy: current and future practices in China, Bioresour. Technol., 2010, 101, 3816–3824 CrossRef CAS PubMed.
- J. B. Song, Y. Sun and L. L. Jin, PESTEL analysis of the development of the waste-to-energy incineration industry in China, Renewable Sustainable Energy Rev., 2017, 80, 276–289 CrossRef.
- P. Wang, Y. Hu and H. Cheng, Municipal solid waste (MSW) incineration fly ash as an important source of heavy metal pollution in China, Environ. Pollut., 2019, 252, 461–475 CrossRef CAS PubMed.
- N. Tangri, Waste incinerators undermine clean energy goals, PLOS Climate, 2023, 2, e0000100 CrossRef.
- H. McAnult, A Dirty Waste-How Renewable Energy Policies Have Financed the Unsustainable Waste-to-Energy Industry, BCL Rev., 2019, 60, 387 Search PubMed.
- L. Chen, Y. Liao, X. Ma and Y. Niu, Effect of co-combusted sludge in waste incinerator on heavy metals chemical speciation and environmental risk of horizontal flue ash, Waste Manag., 2020, 102, 645–654 CrossRef CAS PubMed.
- V. Bruder-Hubscher, F. Lagarde and M. J. F. Leroy, Application of a sequential extraction procedure to study the release of elements from municipal solid waste incineration bottom ash, Anal. Chim. Acta, 2002, 451, 285–295 CrossRef CAS.
- J. W. Lu, S. Zhang, J. Hai and M. Lei, Status and perspectives of municipal solid waste incineration in China: A comparison with developed regions, Waste Manag., 2017, 69, 170–186 CrossRef PubMed.
- H. Tian, J. Gao, L. Lu, D. Zhao, K. Cheng and P. Qiu, Temporal trends and spatial variation characteristics of hazardous air pollutant emission inventory from municipal solid waste incineration in China, Environ. Sci. Technol., 2012, 46, 10364–10371 CrossRef CAS PubMed.
- T. Fujii, K. Kashimura and H. Tanaka, Microwave sintering of fly ash containing unburnt carbon and sodium chloride, J. Hazard. Mater., 2019, 369, 318–323 CrossRef CAS PubMed.
- Y. Li, X. Min, Y. Ke, D. Liu and C. Tang, Preparation of red mud-based geopolymer materials from MSWI fly ash and red mud by mechanical activation, Waste Manag., 2019, 83, 202–208 CrossRef CAS PubMed.
- C. K. Goh, S. E. Valavan, T. K. Low and L. H. Tang, Effects of different surface modification and contents on municipal solid waste incineration fly ash/epoxy composites, Waste Manag., 2016, 58, 309–315 CrossRef CAS PubMed.
- W. N. Oehmig, J. G. Roessler, N. I. Blaisi and T. G. Townsend, Contemporary practices and findings essential to the development of effective MSWI ash reuse policy in the United States, Environ. Sci. Policy, 2016, 51, 304–312 CrossRef.
- J. Yao, W. B. Li, Q. N. Kong, Y. Y. Wu, R. He and D. S. Shen, Content, mobility and transfer behavior of heavy metals in MSWI bottom ash in Zhejiang province, China, Fuel, 2010, 89, 616–622 CrossRef CAS.
- H. Belevi and H. Moench, Factors determining the element behavior in municipal solid waste incinerators. 1. Field studies, Environ. Sci. Technol., 2000, 34, 2501–2506 CrossRef CAS.
- Y. Shi, Y. Li, X. Yuan, J. Fu, Q. Ma and Q. Wang, Environmental and human health risk evaluation of heavy metals in ceramsites from municipal solid waste incineration fly ash, Environ. Geochem. Health, 2020, 42, 3779–3794 CrossRef CAS PubMed.
- P. Aendo, R. Netvichian, P. Thiendedsakul, S. Khaodhiar and P. Tulayakul, Carcinogenic risk of Pb, Cd, Ni, and Cr and critical ecological risk of Cd and Cu in soil and groundwater around the municipal solid waste open dump in central Thailand, J. Environ. Public Health, 2022, 2022 Search PubMed.
- A. D. K. Banerjee, Heavy metal levels and solid phase speciation in street dusts of Delhi, India, Environ. Pollut., 2003, 123, 95–105 CrossRef CAS PubMed.
- J. Wierzbowska, S. Sienkiewicz, P. Żarczyński and S. Krzebietke, Environmental application of ash from incinerated biomass, Agronomy, 2020, 10, 482 CrossRef CAS.
- C. O. Rusănescu and M. Rusănescu, Application of Fly Ash Obtained from the Incineration of Municipal Solid Waste in Agriculture, Appl. Sci., 2023, 13, 3246 CrossRef.
- A. Tessier, P. G. C. Campbell and M. Bisson, Sequential extraction procedure for the speciation of particulate trace metals, Anal. Chem., 1979, 51, 844–851 CrossRef CAS.
- B. Fu, G. Liu, M. D. M. Mian, M. Sun and D. Wu, Characteristics and speciation of heavy metals in fly ash and FGD gypsum from Chinese coal-fired power plants, Fuel, 2019, 251, 593–602 CrossRef CAS.
- N. Gujre, S. Mitra, A. Soni, R. Agnihotri, L. Rangan, E. R. Rene and M. P. Sharma, Speciation, contamination, ecological and human health risks assessment of heavy metals in soils dumped with municipal solid wastes, Chemosphere, 2021, 262, 128013 CrossRef CAS PubMed.
- H. Wang, Y. Zhao, T. R. Walker, Y. Wang, Q. Luo and H. Wu, Distribution characteristics, chemical speciation and human health risk assessment of metals in surface dust in Shenyang City, China, Appl. Geochem., 2021, 131, 105031 CrossRef CAS.
- A. Jonidi Jafari, M. Kermani, R. R. Kalantary and H. Arfaeinia, The effect of traffic on levels, distribution and chemical partitioning of harmful metals in the street dust and surface soil from urban areas of Tehran, Iran, Environ. Earth Sci., 2018, 77, 1–17 CrossRef CAS.
- A. Bogusz and P. Oleszczuk, Effect of biochar addition to sewage sludge on cadmium, copper and lead speciation in sewage sludge-amended soil, Chemosphere, 2020, 239, 124719 CrossRef CAS PubMed.
- T. X. Vuong, J. Stephen, T. B. Minh, T. T. T. Nguyen, T. H. Duong and D. T. N. Pham, Chemical Fractionations of Lead and Zinc in the Contaminated Soil Amended with the Blended Biochar/Apatite, Molecules, 2022, 27, 8044 CrossRef CAS PubMed.
- S. Yang, X. Zhang, X. Wu, M. Li, L. Zhang, Y. Peng, Q. Huang and W. Tan, Understanding the solid phase chemical fractionation of uranium in soil profile near a hydrometallurgical factory, Chemosphere, 2019, 236, 124392 CrossRef CAS PubMed.
- X. Yang, A. D. Igalavithana, S. E. Oh, H. Nam, M. Zhang, C. H. Wang and Y. S. Ok, Characterization of bioenergy biochar and its utilization for metal/metalloid immobilization in contaminated soil, Sci. Total Environ., 2018, 640, 704–713 CrossRef PubMed.
- MOST, Standard Practice for Sampling Unconsolidated Solids in Drums or Similar Containers, 2017 Search PubMed.
- U. S. EPA, Method 3052: Microwave assisted acid digestion of siliceous and organically based matrices, Revision 0, 1996 Search PubMed.
- USEPA, EPA Method 6010D: Inductively Coupled Plasma-Atomic Emission 734 Spectrometry, Test Methods for Evaluating Solid Waste, Physical/Chemical Methods, SW735 846, 2014 Search PubMed.
- S. M. Almeida, C. A. Pio, M. C. Freitas and M. A. Reis, Source apportionment of atmospheric urban aerosol based on weekdays/weekend variability: evaluation of road re-suspended dust contribution, Atmos. Environ., 2006, 40, 2058–2067 CrossRef CAS.
- J. J. Xie, X. Hu, Y. W. Shen, C. G. Yuan, K. G. Zhang and X. Zhao, Bioavailability and speciation of arsenic in urban street dusts from Baoding city, China, Chem. Speciation Bioavailability, 2017, 29, 135–142 CrossRef CAS.
- Risk Assessment Guidance for Superfund, U. S. EPA, Environmental Protection Agency, 1989, vol. I, EPA/540/1-89/002, https://www.epa.gov/sites/default/files/2015-09/documents/rags_a.pdf Search PubMed.
- U. S. EPA, Environmental Protection Agency, EPA 540-R-02–002, II, 2001, http://www.epa.gov/sites/production/fles/2015-09/documents/rags3adt_complete.pd Search PubMed.
- U. S. EPA, Exposure Factors Handbook, General Factors, United States Environmental Protection Agency, Washington, DC, USA, vol. 1, 1997 Search PubMed.
- L. Pan, Y. Wang, J. Ma, Y. Hu, B. Su and G. Fang, A review of heavy metal pollution levels and health risk assessment of urban soils in Chinese cities, Environ. Sci. Pollut. Res., 2018, 25, 1055–1069 CrossRef CAS PubMed.
- T. T. T. Nguyen, A. Q. Hoang, X. T. Vuong, V. D. Nguyen, G. H. Pham and T. B. Minh, Comprehensive insight into heavy metal (loid)s in road dust from industrial and urban areas in northern Vietnam: concentrations, fractionation characteristics, and risk assessment, Int. J. Environ. Anal. Chem., 2022, 1–20 Search PubMed.
- Y. Pan, Z. Wu, J. Zhou, J. Zhao, X. Ruan, J. Liu and G. Qian, Chemical characteristics and risk assessment of typical municipal solid waste incineration (MSWI) fly ash in China, J. Hazard. Mater., 2013, 261, 269–276 CrossRef CAS PubMed.
- L. Tong, J. He, F. Wang, Y. Wang, L. Wang and D. C. W. Tsang, Evaluation of the BCR sequential extraction scheme for trace metal fractionation of alkaline municipal solid waste incineration fly ash, Chemosphere, 2020, 249, 126115 CrossRef CAS PubMed.
- Y. S. Shim, S. W. Rhee and W. K. Lee, Comparison of leaching characteristics of heavy metals from bottom and fy ashes in Korea and Japan, Waste Manag., 2005, 25, 473–480 CrossRef CAS PubMed.
- B. Fu, G. Liu, M. Sun, J. C. Hower, G. Hu and D. Wu, A comparative study on the mineralogy, chemical speciation, and combustion behavior of toxic elements of coal beneficiation products, Fuel, 2018, 228, 297–308 CrossRef CAS.
- S. Abanades, G. Flamant and D. Gauthier, Kinetics of heavy metal vaporization from model wastes in a 621 fluidized bed, Environ. Sci. Technol., 2002, 36, 3879–3884 CrossRef CAS PubMed.
- W. Li, Z. Ma, Q. Huang and X. Jiang, Distribution and leaching characteristics of heavy metals in a hazardous waste incinerator, Fuel, 2018, 233, 427–441 CrossRef CAS.
- Y. Tang, J. Pan, B. Li, S. Zhao and L. Zhang, Residual and ecological risk assessment of heavy metals in fly ash from co-combustion of excess sludge and coal, Sci. Rep., 2021, 11, 2499 CrossRef CAS PubMed.
- A. F. Stam, R. Meij, H. Te. Winkel and R. J. Eijk, Chromium speciation in coal and biomass co-combustion products, Environ. Sci. Technol., 2011, 45, 2450–2456 CrossRef CAS PubMed.
- H. F. Kaiser, The application of electronic computers to factor analysis, Educ. Psychol. Meas., 1960, 20, 141–151 CrossRef.
- S. Abanades, G. Flamant, B. Gagnepain and D. Gauthier, Fate of heavy metals during municipal solid waste incineration, Waste Manage. Res., 2002, 20, 55–68 CrossRef CAS PubMed.
- J. Yu, L. Sun, J. Xiang, L. Jin, S. Hu, S. Su and J. Qiu, Physical and chemical characterization of ashes from a municipal solid waste incinerator in China, Waste Manage. Res., 2013, 31, 663–673 CrossRef CAS PubMed.
- A. N. Srivastava and S. Chakma, Heavy metals speciation study revealing merits of anaerobic co-disposal of municipal solid waste with discrete paper mill sludges: an experimental investigation in simulated landfill bioreactors, J. Environ. Chem. Eng., 2020, 8, 104337 CrossRef CAS.
- Y. Liu, X. Huo, L. Xu, X. Wei, W. Wu, X. Wu and X. Xu, Hearing loss in children with E-waste lead and cadmium exposure, Sci. Total Environ., 2018, 624, 621–627 CrossRef CAS PubMed.
- S. K. Banu, J. A. Stanley, R. J. Taylor, K. K. Sivakumar, J. A. Arosh, L. Zeng and S. Pennathur, Sexually dimorphic impact of chromium accumulation on human placental oxidative stress and apoptosis, Toxicol. Sci., 2018, 161, 375–387 CrossRef CAS PubMed.
- Y. Peng, J. Hu, Y. Li, B. Zhang, W. Liu, H. Li and H. Zhang, Exposure to chromium during pregnancy and longitudinally assessed fetal growth: findings from a prospective cohort, Environ. Int., 2018, 121, 375–382 CrossRef CAS PubMed.
- P. K. Padmavathiamma and L. Y. Li, Phytoremediation Technology: Hyper-accumulation Metals in Plants, Water, Air, Soil Pollut., 2007, 184, 105–126 CrossRef CAS.
- K. Gustin, F. Tofail, M. Vahter and M. Kippler, Cadmium exposure and cognitive abilities and behavior at 10 years of age: a prospective cohort study, Environ. Int., 2018, 113, 259–268 CrossRef CAS PubMed.
Footnote |
| † Electronic supplementary information (ESI) available. See DOI: https://doi.org/10.1039/d4ra01465k |
| This journal is © The Royal Society of Chemistry 2024 |