 Open Access Article
Synthesis, characterization, and inhibition effects of a novel eugenol derivative bearing pyrrole functionalities on the corrosion of mild steel in a HCl acid solution†
Bahija Rebbah *a,
Abderrahim El Haibb,
Sara Lahmadyc,
Issam Forsalc,
Maryse Gouygoud,
Sonia Mallet-ladeirad,
Abdelouahid Medaghri-alaouia,
El Mostapha Rakiba and
Abdellah Hannioui*a
aMolecular Chemistry, Materials and Catalysis Laboratory, Faculty of Science and Technology, Sultan Moulay Slimane University, B.P. 523, Beni Mellal, Morocco. E-mail: hannioui15@yahoo.fr
bChemical Processes and Applied Materials Laboratory, Polydisciplinary Faculty, Sultan Moulay Slimane University, PB: 592, Beni Mellal, Morocco
cLaboratory of Engineering and Applied Technologies, School of Technology, Beni Mellal, Morocco
dCNRS, Coordination Chemistry Laboratory, Univesty of Toulouse, UPS, Toulouse-INP, 205 Narbonne Road, BP 44099, F-31077 Toulouse Cedex 4, France
First published on 29th April 2024
Abstract
Semi-synthetic modifications of natural products have yielded numerous anti-cancer drugs, antimicrobials, and corrosion inhibitors. In this study, eugenol, a natural product, was synthetically modified to generate a novel heterocyclic compound: pyrrole, which forms crystals. The latter is the outcome of the condensation reaction between eugenol hydrazide and 2,5-hexanedione, conducted under reflux ethanol conditions, without a catalyst, achieving a 96% yield. This compound structure was characterized through spectroscopic methods, such as NMR and FTIR, and validated par the crystal's X-ray diffraction analysis. According to the findings of the electrochemical study, pyrrole demonstrated effective inhibition against the carbon steel's corrosion in a 1 M HCl acid solution.
1. Introduction
Natural products and their semi-synthetic molecules are a rich source of bioactive molecules with high pharmacological1 and anticorrosive potential.2 They play important in the development of anti-cancer therapies,3 offering advantages such as a better pharmacokinetic profile, reduced toxicity, and the possibility of developing more soluble analogs.4,5Clove essential oil is extracted from the Giroflier tree's cloves,6 and the main compound is eugenol, with a yield of between 75 and 90%.7 Eugenol has been extensively studied and found to be a natural aromatic compound in the phenylpropene family, with a variety of biological and therapeutic applications,8 including anticancer,9 antidiabetic, antileishmanial,10 antifungal,11 antibacterial,12 antiviral13 antioxidant14 and anti-inflammatory15 properties. This compound and its derivatives are also recognized as effective inhibitors, capable of preventing or slowing down the corrosion process in acidic environments, with an inhibition rate of up to 70%.16–18 To synthesize eugenol-based heterocyclic derivatives with interesting activities, Syed Nazreen's team developed new 1,3,4-oxadiazole heterocycles with anticancer properties.19 Similarly, Abdelmaoujoud Taia and colleagues have synthesized new heterocycles, 1,2,3-triazoles, with anticorrosive activity, particularly for iron in acid solutions.20 Moreover, heterocyclic pyrrole compounds, characterized by a five-membered ring comprising four adjacent carbon atoms and one nitrogen atom, have recently been prepared by Sergei Boichuk et al.21 These products have found wide therapeutic applications21,22 due to their diverse biological properties,23 including antimicrobial24 and anticancer activities.25 Many pyrrole-based compounds are also widely used as anticorrosion agents to combat the degradation of various metallic materials, such as copper, iron, and aluminum, in corrosive environments.26,27 Our study concentrated on the preparation of a new molecule with an original structure containing eugenol and pyrrole units simultaneously, with an evaluation (assessment) of their corrosion inhibition activities. Compound 4's geometry was obtained exclusively by the action of compound 3 used as an intermediate on 2,5-hexanedione in ethanol. Compound 4 was characterized using single-crystal X-ray diffraction and spectroscopic methods, including 1H and 13C NMR and FTIR.
2. Results and discussion
2.1. Chemistry
The natural product eugenol 1 was used as the starting material for the synthesis of compound 4 (Scheme 1). All intermediate 2–3 were produced using the techniques mentioned in the literature, with minor modifications.28 Compound 1 was reacted with bromoethyl acetate in the existence of anhydrous potassium carbonate in acetone at reflux to generate ethyl 2-(4-allyl-2-methoxyphenoxy) acetate 2, which was then treated with hydrazine monohydrate in ethanol to form 2-(4-allyl-2-methoxyphenoxy) aceto-hydrazide 3 in 90%-yield. All the intermediates used to prepare the target molecule were confirmed by spectroscopic data such as NMR and FTIR. The condensation reaction between compound 3 and 2,5-hexanedione in ethanol afforded 2-(4-allyl-2-methoxyphenoxy)-N-(2,5-dimethyl-1H-pyrrol-1-yl) acetamide 4 in 96%-yield. This condensation was confirmed by NMR (1H & 13C), FTIR and XRD spectral analysis. The FTIR spectrum showed significant signals at 1710 cm−1 and 3460 cm−1, confirming the characteristic C![[double bond, length as m-dash]](https://www.rsc.org/images/entities/char_e001.gif) O's presence and NH functions respectively. Indeed, 1H NMR of product 4 revealed the appearance of a shielded singlet at 1.91 ppm ((CH3)2), featuring the protons linked to the pyrrole ring. Although the two symmetrical protons of the pyrrole ring are present at a chemical shift of 5.59 ppm ((CH)2), they only give a single signal due to their symmetry. The appearance of an unshielded singlet at 10.8 ppm (NH) is also to be pointed out. Peaks at around 10.2, 103.59, and 127.3 ppm in the 13C NMR spectrum are attributed respectively to (CH3)2 linked to the pyrrole ring, CH–CH to the tertiary carbons, and C–N to the quaternary carbons of the pyrrole ring.
O's presence and NH functions respectively. Indeed, 1H NMR of product 4 revealed the appearance of a shielded singlet at 1.91 ppm ((CH3)2), featuring the protons linked to the pyrrole ring. Although the two symmetrical protons of the pyrrole ring are present at a chemical shift of 5.59 ppm ((CH)2), they only give a single signal due to their symmetry. The appearance of an unshielded singlet at 10.8 ppm (NH) is also to be pointed out. Peaks at around 10.2, 103.59, and 127.3 ppm in the 13C NMR spectrum are attributed respectively to (CH3)2 linked to the pyrrole ring, CH–CH to the tertiary carbons, and C–N to the quaternary carbons of the pyrrole ring.
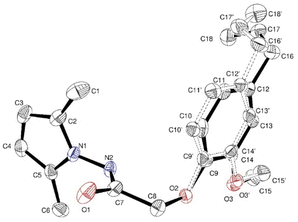
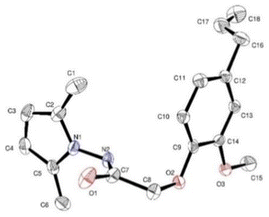
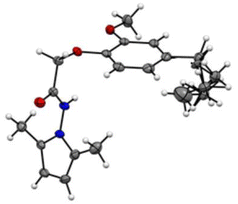
At a temperature of 100 K, X-ray intensity data were recorded for compound 4, 2-(4-allyl-2-methoxyphenoxy)-N-(2,5-dimethyl-1H-pyrrol-1-yl) acetamide, which crystallised as triclinic crystals (4) with space group ![[P with combining macron]](https://www.rsc.org/images/entities/i_char_0050_0304.gif) 1. The experimental results are reported in Table 1, while the asymmetric units are shown in Fig. 1 with atom numbering schemes. The structure of compound 4 (C18H23N2O3) is characterised by the bonding of the 2-(2-methoxyphenyl) acetohydrazide ring (C1–C7/N2/N3) to both an allyl group and a 2,5-dimethyl-pyrrol-1-yl group, as illustrated in Fig. 1. The mid-plane of the main component of the allyl group, exhibiting disorientation in two positions, is substantially perpendicular to the 2-(2-methoxyphenyl) acetohydrazide ring, with a C12–C16–C17′–C18′ twist angle of 107.9° (1). In addition, the pyrrole ring forms a dihedral angle of 125.02° (10) with the 2-(2-methoxyphenyl) acetohydrazide ring system. In the crystal structure, the molecule is stabilised by C2–N1–C5 interactions.
1. The experimental results are reported in Table 1, while the asymmetric units are shown in Fig. 1 with atom numbering schemes. The structure of compound 4 (C18H23N2O3) is characterised by the bonding of the 2-(2-methoxyphenyl) acetohydrazide ring (C1–C7/N2/N3) to both an allyl group and a 2,5-dimethyl-pyrrol-1-yl group, as illustrated in Fig. 1. The mid-plane of the main component of the allyl group, exhibiting disorientation in two positions, is substantially perpendicular to the 2-(2-methoxyphenyl) acetohydrazide ring, with a C12–C16–C17′–C18′ twist angle of 107.9° (1). In addition, the pyrrole ring forms a dihedral angle of 125.02° (10) with the 2-(2-methoxyphenyl) acetohydrazide ring system. In the crystal structure, the molecule is stabilised by C2–N1–C5 interactions.
| The structure of compound 4 has different positions, CCDC number: 2334215 | ||
|---|---|---|
| Compound | 3D view | Chemical schema |
 |
 |
 |
| Crystal data | |
|---|---|
| Empirical formula | C18 H23 N2 O3 |
| Formula weight | 315.38 |
| Temperature | 100(2) K |
| Wavelength | 1.54184 Å |
| Crystal system, space group | Triclinic, ![[P with combining macron]](https://www.rsc.org/images/entities/i_char_0050_0304.gif) 1 1 |
| Unit cell dimensions | a = 9.2975(3) Å, alpha = 73.401(2) deg |
| b = 10.1675(3) Å, beta = 64.496(3) deg | |
| c = 10.6317(2) Å, gamma = 69.395(3) deg | |
| Volume | 838.30 (5) Å3 |
| Z | 2 |
| Calculated density | 1.250 Mg m−3 |
| Absorption coefficient | 0.690 mm−1 |
| F(000) | 338 |
| Crystal size | 0.2 × 0.2 × 0.2 mm |
| Theta range for data collection | 4.667 to 80.000 deg |
| Limiting indices | −11 ≦ h ≦ 11, −12 ≦ k ≦ 12,−13 ≦ l ≦ 11 |
| Reflections collected/unique | 14![[thin space (1/6-em)]](https://www.rsc.org/images/entities/char_2009.gif) 347/3564 [R (int) = 0.0250] 347/3564 [R (int) = 0.0250] |
| Completeness to theta | 67.684 99.9% |
| Refinement method | Full-matrix least-squares on F2 |
| Data/restraints/parameters | 3564/338/318 |
| Goodness-of-fit on F2 | 1.024 |
| Final R indices [I > 2 sigma (I)] | R1 = 0.0415, w R2 = 0.1077 |
| R Indices (all data) | R1 = 0.0433, w R2 = 0.1093 |
| Extinction coefficient | 0.0117(10) |
| Largest diff. Peak and hole | 0.350 and −0.389 e Å−3 |
2.2. Electrochemical
 | (1) |
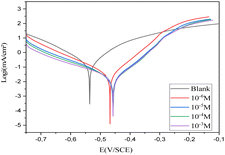 | ||
| Fig. 2 Cathodic and anodic polarisation curves for carbon steel in 1 M HCl in the absence and presence of various concentrations of compound 4 at 293 K. | ||
| C (M) | Icorr (μA cm−2) | −Ecorr (mV vs SCE) | −βa (mV dec−1) | βc (mV dec−1) | η% |
|---|---|---|---|---|---|
| Blank | 322.8 | 536.0 | 99.4 | 117.7 | — |
| 10−6 | 36.1 | 467.4 | 61.9 | 117.8 | 88.81 |
| 10−5 | 28.9 | 458.2 | 66.1 | 142.1 | 91.04 |
| 10−4 | 24.4 | 456.4 | 64.6 | 150.5 | 92.44 |
| 10−3 | 17.0 | 455.2 | 54.3 | 159.41 | 94.73 |
The corrosion current density without an inhibitor is denoted by Icorr, whereas the corrosion current density with an inhibitor is denoted by I′corr.
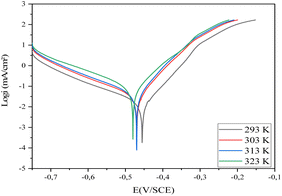
As seen in Fig. 2, Ecorr is moved toward a positive potential when compound 4 is added to the corrosive medium. It is also clear that the anodic and cathodic reactions are inhibited. It should be mentioned that the inhibitor may be classified as either cathodic or anodic type if the displacement of the corrosion potential is larger than 85 mV concerning the corrosion potential of the blank.30 The greatest corrosion potential of carbon steel in the present research was 80 mV, indicating a mixed type of inhibitor. In other words, compound 4's presence in HCl 1 M inhibited the dissolution of both anodic carbon steel and the generation of cathodic hydrogen.31 The literature has previously documented a comparable alteration in Ecorr values, suggesting that the inhibitor is considered a mixed-type inhibitor with a tendency towards anodic dominance.30,31
The results presented in Table 2 indicate that the corrosion current density reduces when compound 4 is present, starting from 322.8 and reaching 17.0 μA cm−2 at 10−3 M at 293 K. Inhibitory molecules attach to active sites on the CS surface to generate this action.29 The inhibitor's inhibition effectiveness (η%) rises with increasing concentration until it reaches 94% at 10−3 M.
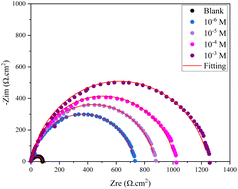
The shapes of the semicircles in the inhibited and uninhibited solutions were the same, suggesting that the addition of inhibitors did not affect the mechanism of carbon steel corrosion.30
It is evident that the semicircles in the Nyquist plots are not perfect; this behavior is typically ascribed to metal surface inhomogeneity carried on by interfacial phenomena or surface roughness.33 The remarkable degree of agreement between the experimental plots and fitting lines (Fig. 3) confirms that the EIS data are accurate. There is a high match between the fitted quality and the comparable circuit model (Fig. 4).
Table 3 lists the impedance characteristics, double layer capacitance (Cdl), solution resistance (Rs), charge transfer resistance (Rct), and inhibition efficiency (η%). The calculation of the inhibition efficiency (η%) came from (eqn (2)):30
 | (2) |
| C (M) | Rs (Ω cm2) | Rct (Ω cm2) | Cdl (μF cm−2) | n | Qdl (μΩ−1 cm−2 Sn) | η% |
|---|---|---|---|---|---|---|
| Blank | 0.58 | 82.33 | 253.1 | 0.86 | 401.6 | — |
| 10−6 | 0.71 | 729.0 | 104.4 | 0.89 | 142.7 | 88.70 |
| 10−5 | 0.85 | 874.3 | 87.1 | 0.89 | 118.6 | 90.58 |
| 10−4 | 0.69 | 1016 | 65.23 | 0.89 | 92.55 | 91.89 |
| 10−3 | 1.20 | 1250.0 | 54.27 | 0.87 | 66.84 | 93.41 |
Table 3 makes it evident that (Rct) increased when inhibitor concentrations were raised. is explained by the inhibitor forming a protective coating over the metal-solution This interface as a result of its adsorption on the most active adsorption sites.31 The (η%) can exceed 93% when the concentration is 10−3 M. Moreover, the Cdl value exhibits a decreasing trend as compound 4 concentration rises; the addition of this inhibitor results in a drop in Cdl double-layer capacitance values from 253.1 to 54.27 μF cm−2. The literature states that the adsorbed inhibitor molecule displaces water molecules at the CS solution interface, allowing a protective layer to form on the carbon steel surface and contributing to the decrease in Cdl values.34 Similarly, the polarization data also confirms the EIS results.
The Arrhenius-type process may be used to depict the corrosion reaction using the following relation:29
 | (3) |
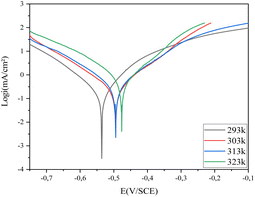
As shown in Fig. 7(a), the apparent activation energy was calculated from the slope of ln(Icorr) vs. 1/T. However, the following equation may be used to determine the entropy (ΔS*a) and enthalpy (ΔH*a) of activation for this inhibitor:35
 | (4) |
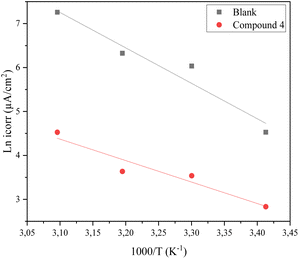 | ||
| Fig. 7 Arrhenius lines obtained from the corrosion current density of steel in 1 M HCl medium and in the presence of inhibitor 4 (a). | ||
| Compounds | T (K) | Icorr (μA cm−1) | −Ecorr (mV vs. SCE) | βa (mV dec−1) | −βc (mV dec−1) | η% |
|---|---|---|---|---|---|---|
| Blank | 293 | 322.8 | 536.0 | 99.4 | 117.7 | — |
| 303 | 417.6 | 494.7 | 106.0 | 132.9 | — | |
| 313 | 557.7 | 494.4 | 121.3 | 145.3 | — | |
| 323 | 1419.0 | 476.5 | 113.7 | 160.4 | — | |
| 4 | 293 | 17.0 | 455.2 | 54.3 | 159.41 | 94.7 |
| 303 | 34.4 | 469.7 | 55.6 | 150.4 | 91.76 | |
| 313 | 37.9 | 470.5 | 52.9 | 142.5 | 93.20 | |
| 323 | 92.4 | 480.0 | 72.6 | 154.6 | 93.48 |
Where T is the absolute temperature, R is the universal gas constant, ΔS*a is the entropy of activation, ΔH*a is the enthalpy of activation, N is Avogadro's number, and icorr is the corrosion current density. The fluctuation of ln(icorr/T) vs. 1/T is shown in Fig. 8(b).
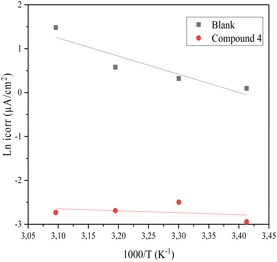 | ||
| Fig. 8 Arrhenius lines obtained from the corrosion current density of steel in 1 M HCl medium and in the presence of Blank (b). | ||
Table 5 shows that compound 4 causes an increase in activation energy relative to the blank. This increase is related to the physisorption of inhibitor molecules.36 The positive value of ΔH*a indicates the endothermic nature of the CS dissolving process. However, the value of the enthalpy in the presence of inhibitors is greater than that obtained in the absence of an inhibitor (36.86 kJ mol−1); this evolution is attributed to the physical adsorption of inhibitor molecules on the CS surface. The negative values of ΔS*a indicate that there is an increase in disorder during the complex active reaction generation process in the solution.
| Compounds | Ea (kJ mol−1) | ΔH*a (kJ mol−1) | ΔS*a (J mol−1 K−1) | Ea − ΔH*a |
|---|---|---|---|---|
| Blank | 36.86 | 34.3 | −80.86 | 2.56 |
| 4 | 40.61 | 38.43 | −91.25 | 2.18 |
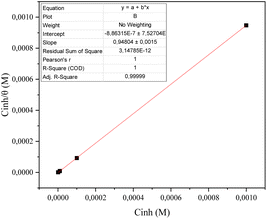 | ||
| Fig. 9 Langmuir adsorption plots for CS in 1 M HCl solution containing different concentrations of compound 4 at 293 K. | ||
According to Boumhara et al.,37 the Langmuir isotherm predicted that the adsorbed molecules would occupy a single site and that they would not interact with other molecules adsorbed on the surface of the metal. The following relation is used for determining the surface coverage (θ):
 | (5) |
The relationship that follows provides the Langmuir isotherm:29,37
 | (6) |
The computed lines and the experimental points show a very excellent match with the regression coefficient, indicating that the Langmuir isotherm and the experimental data are fully compatible. From the intercepts of the straight lines, the value of the equilibrium constant of standard adsorption was calculated; Kads = 1.11 × 10⁻⁷, Kads is related to the standard free energy of adsorption, ΔGads. The values of Gibb's free adsorption energy ( ) were calculated using eqn (7):38
 | (7) |
The adsorption of chemical 4 on the steel surface appears to be spontaneous based on the negative value of ( ). The (
 ) value that was computed is −43.69 kJ mol−1. The energy values of (
 ) that are around −20 kJ mol−1 or less negative are commonly linked to an electrostatic contact (physisorption) between inhibitor molecules and charged metal surfaces.; The negative values, around −40 kJ mol−1 or higher, refer to chemisorptions, which are the formation of coordinate-type bonds by charge sharing or transfer from the inhibitor molecules to the metal surface.29,37 The (
 ) is approximately −40 kJ mol−1, demonstrating that compound 4 molecules adsorb onto the carbon steel surface belong to the chemisorptions class and that the adsorptive film simultaneously possesses an electrostatic character based on the enthalpy value.29
| Compounds | Immersion time | Rs (Ω cm2) | Rct (Ω cm2) | Cdl (μF cm−2) | n | Qdl (μΩ−1 cm−2 Sn) | η% |
|---|---|---|---|---|---|---|---|
| Blank | 30 min | 0.58 | 82.33 | 253.1 | 0.88 | 401.6 | — |
| 1 h | 0.20 | 77.86 | 118.6 | 0.84 | 247.6 | — | |
| 2 h | 0.95 | 57.99 | 261 | 0.92 | 363.4 | — | |
| 4 h | 1.06 | 43.91 | 365.2 | 0.96 | 425.9 | — | |
| 8 h | 0.69 | 38.64 | 472.5 | 0.91 | 669.6 | — | |
| 10 h | 0.70 | 33.46 | 569.1 | 0.95 | 697.1 | — | |
| 24 h | 0.54 | 25.36 | 1510 | 0.87 | 2301 | — | |
| 4 | 30 min | 1.20 | 1250 | 54.27 | 0.87 | 75.2 | 93.41 |
| 1 h | 2.26 | 1261 | 57.22 | 0.810 | 77.3 | 93.82 | |
| 2 h | 1.94 | 1377 | 43.79 | 0.81 | 73.54 | 95.78 | |
| 4 h | 1.5 | 1399 | 37.94 | 0.83 | 61.1 | 96.86 | |
| 8 h | 2.03 | 1614 | 32.14 | 0.80 | 55.48 | 97.60 | |
| 10 h | 1.8 | 1569 | 45.15 | 0.82 | 66.12 | 97.86 | |
| 24 h | 1.11 | 1098 | 42.13 | 0.85 | 66.87 | 97.69 |
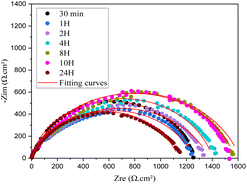
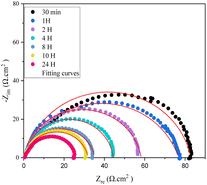
As seen in Fig. 11, the capacitive loops maintained their form in the blank medium and changed in size as the time increased in the 10−3 M compound 4 solutions. As the immersion duration in the blank solution increased. Table 6 shows that the inhibitory effectiveness increases as exposure duration rises. The majority of this behavior is correlated with the quantity of empty locations that exist when the steel is first exposed to the inhibited milieu. As a result, attractive forces will form between the heteroatom molecule's free electrons and the metal surface's active sites, helping to increase efficiency over the immersion period until complete filling.39 We thus conclude that, over time, the inhibitor employed in our study serves as an effective barrier to safeguard the carbon steel.
3. Conclusion
Taking into account our research, using biologically active and anticorrosive eugenol-based natural products, we synthesized a new crystalline molecule, 2-(4-allyl-2-methoxy phenoxy)-N-(2,5-dimethyl-1H-pyrrol-1-yl) acetamide 4 and developed it as a corrosion inhibitor in acidic media. Potentiodynamic polarization and electrochemical impedance spectroscopy tests showed that inhibitor 4 can effectively protect carbon steel from corrosion in 1.0 M HCl solution, with better performance at moderately higher concentrations and temperatures. Adsorption and immersion time allow Inhibitor 4 to form a dense, stable long-term film on mild steel. This suggests that it could become an interesting inhibitor for other materials against corrosion.4. Experimental details of chemicals
4.1. Preparation of ethyl 2-(3-allyl-5-methoxyphenyl) acetate (2)
Anhydrous potassium carbonate (5.528 g, 0.04 mol) was mixed with eugenol 1 (5 g, 0.03 mol) in a flask containing acetone (150 ml) and stirred at room temperature. After 15 minutes, 1 equivalent of ethyl bromoacetate (5.01 g, 0.03 mol) was added to the mixture and the solution refluxed for 24 hours. The mixture was then cooled and the solvent was removed under reduced pressure. The residual mass was triturated with ice-cold water and then extracted with ether (3 × 50 ml). This solution was washed with a 10% sodium hydroxide solution (3 × 30 ml), followed by water (3 × 30 ml). Finally, the solution was evaporated to obtain a brown oil 2. The synthesized product was purified by silica gel chromatography with a hexane/ethyl acetate (8/2) solvent mixture and recrystallized in ethanol. C14H18O4. Rdt: 90%. PM = 250.12 g mol−1. FTIR (n, cm−1, KBr): 1731 (C![[double bond, length as m-dash]](https://www.rsc.org/images/entities/char_e001.gif) O). RMN1H (500 MHz, DMSO-d6, ppm): δ 6.82 (1H, d, CH, J = 4.4 Hz), 6.80 (1H, d, CH, J = 4.4 Hz), 6.70 (1H, s, CH), 5.90 (1H, m, CH), 5.01–4.95 (2H, m, CH2), 4.6 (2H, s, CH2), 4.26 (2H, q, CH2, J = 7.8 Hz), 3.7 (3H, s, CH3), 3.29 (2H, d, J = 6.73 Hz, CH2), 1.16 (3H, t, CH3, J = 7.8 Hz). RMN13C (125 MHz, DMSO-d6, ppm): δ 169.17 (C
O). RMN1H (500 MHz, DMSO-d6, ppm): δ 6.82 (1H, d, CH, J = 4.4 Hz), 6.80 (1H, d, CH, J = 4.4 Hz), 6.70 (1H, s, CH), 5.90 (1H, m, CH), 5.01–4.95 (2H, m, CH2), 4.6 (2H, s, CH2), 4.26 (2H, q, CH2, J = 7.8 Hz), 3.7 (3H, s, CH3), 3.29 (2H, d, J = 6.73 Hz, CH2), 1.16 (3H, t, CH3, J = 7.8 Hz). RMN13C (125 MHz, DMSO-d6, ppm): δ 169.17 (C![[double bond, length as m-dash]](https://www.rsc.org/images/entities/char_e001.gif) O), 149.9 (C), 146.2 (C), 138.8 (CH), 134.5 (C), 122.5 (CH), 115.5 (CH2), 115.2 (CH), 113.8 (CH), 65.7 (O–CH2), 61.11 (O–CH2), 56.1 (O–CH3), 39.8 (
O), 149.9 (C), 146.2 (C), 138.8 (CH), 134.5 (C), 122.5 (CH), 115.5 (CH2), 115.2 (CH), 113.8 (CH), 65.7 (O–CH2), 61.11 (O–CH2), 56.1 (O–CH3), 39.8 (![[double bond, length as m-dash]](https://www.rsc.org/images/entities/char_e001.gif) CH2), 14.1 (–CH3).
CH2), 14.1 (–CH3).
4.2. Synthesis of 2-(3-allyl-5-methoxyphenyl) aceto hydrazide 3
A mixture of ethyl 2-(3-allyl-5-methoxyphenyl) acetate 2 (4.5 g, 0.017 mol), 98% hydrazine monohydrate (2 ml, 0.04 mol), and ethanol (30 ml) in a 100 ml flask was heated under reflux for 24 hours. The reaction mixture was then cooled and the solid formed was filtered, dried, and recrystallized in acetic acid to give compound 3. RT: 76%. P.F:142–143 °C. FTIR (n, cm−1, KBr): 3411.18 (–NHNH2), 1680.66 (C![[double bond, length as m-dash]](https://www.rsc.org/images/entities/char_e001.gif) O). RMN1H (500 MHz, DMSO-d6, ppm): δ 9.01 (1H, s, NH), 6.82 (1H, d, CH, J = 4.4 Hz), 6.80 (1H, d, CH, J = 4.4 Hz), 6.70 (1H, s, CH), 5.80 (1H, m, CH), 5.01–5.02 (2H, m, CH2), 4.9 (2H, s, NH2), 4.39 (2H, s, CH2), 3.7 (3H, s, CH3), 3.2 (2H, d, J = 6.8 Hz, CH2). RMN13C (125 MHz, DMSO-d6, ppm): δ 167.9 (C
O). RMN1H (500 MHz, DMSO-d6, ppm): δ 9.01 (1H, s, NH), 6.82 (1H, d, CH, J = 4.4 Hz), 6.80 (1H, d, CH, J = 4.4 Hz), 6.70 (1H, s, CH), 5.80 (1H, m, CH), 5.01–5.02 (2H, m, CH2), 4.9 (2H, s, NH2), 4.39 (2H, s, CH2), 3.7 (3H, s, CH3), 3.2 (2H, d, J = 6.8 Hz, CH2). RMN13C (125 MHz, DMSO-d6, ppm): δ 167.9 (C![[double bond, length as m-dash]](https://www.rsc.org/images/entities/char_e001.gif) O), 150 (C), 146.2 (C), 138 (CH), 134 (C), 121.9 (CH), 115.9 (CH2), 115 (CH), 113 (CH), 68 (CH2), 56.01 (CH3), 40.01 (CH2).
O), 150 (C), 146.2 (C), 138 (CH), 134 (C), 121.9 (CH), 115.9 (CH2), 115 (CH), 113 (CH), 68 (CH2), 56.01 (CH3), 40.01 (CH2).
4.3. Synthesis of 2-(4-allyl-2-methoxyphenoxy)-N-(2,5-dimethyl-1H-pyrrol-1-yl)acetamide 4
A solution of 2-(3-allyl-5-methoxyphenyl)acetohydrazide 3 (0.6 g, 0.0025 mol) and 2,5-dioxohexane (1.5 eq., 0.428 g, 0.0037 mol) in a 100 ml flask, also containing ethanol, was heated at reflux for 24 hours. After cooling, the solvent was concentrated. The synthesized product 4 was purified by silica gel chromatography using a hexane/ethyl acetate (9/1) solvent mixture. The product was crystallized in DMF. RT: 96%. P.F: 251–252 °C. FTIR (n, cm−1, KBr): 3460 (NH), 1710 (C![[double bond, length as m-dash]](https://www.rsc.org/images/entities/char_e001.gif) O), 3157 (C
O), 3157 (C![[double bond, length as m-dash]](https://www.rsc.org/images/entities/char_e001.gif) CH), 2960 (CH3), 1616 (C
CH), 2960 (CH3), 1616 (C![[double bond, length as m-dash]](https://www.rsc.org/images/entities/char_e001.gif) C), 1503 (C
C), 1503 (C![[double bond, length as m-dash]](https://www.rsc.org/images/entities/char_e001.gif) C). RMN 1H (500 MHz, DMSO-d6, ppm): δ 10.8 (1H, s, NH), 6.88 (1H, d, CH, J = 4.5 Hz), 6.86 (1H, d, CH, J = 4.5 Hz), 6.78 (1H, s, CH), 5.90 (1H, m, CH), 5.59 (2H, s, CH, CH), 5.01-5.02 (2H, m, CH2), 4.67 (2H, s, CH2), 3.68 (3H, s, CH3), 3.30 (2H, d, J = 6.7 Hz, CH2), 1.91 (6H, s, CH3, CH3). RMN13C (125 MHz, DMSO-d6, ppm): δ 169.8 (C
C). RMN 1H (500 MHz, DMSO-d6, ppm): δ 10.8 (1H, s, NH), 6.88 (1H, d, CH, J = 4.5 Hz), 6.86 (1H, d, CH, J = 4.5 Hz), 6.78 (1H, s, CH), 5.90 (1H, m, CH), 5.59 (2H, s, CH, CH), 5.01-5.02 (2H, m, CH2), 4.67 (2H, s, CH2), 3.68 (3H, s, CH3), 3.30 (2H, d, J = 6.7 Hz, CH2), 1.91 (6H, s, CH3, CH3). RMN13C (125 MHz, DMSO-d6, ppm): δ 169.8 (C![[double bond, length as m-dash]](https://www.rsc.org/images/entities/char_e001.gif) O), 150.1 (C), 147.1 (C), 139.1 (CH), 135.8 (C), 127.9 (C, C), 121.5 (CH), 116.2 (CH2), 116 (CH), 113 (CH), 104.7 (CH, CH), 68.1 (CH2), 10.2 (CH3, CH3).
O), 150.1 (C), 147.1 (C), 139.1 (CH), 135.8 (C), 127.9 (C, C), 121.5 (CH), 116.2 (CH2), 116 (CH), 113 (CH), 104.7 (CH, CH), 68.1 (CH2), 10.2 (CH3, CH3).
5. Experimental details of electrochemical measurements
5.1. Materials and electrolyte preparation
In the present investigation, carbon steel (CS) specimens with the following composition (weight%): 0.07 C, 0.19 Mn, 0.03 Si, 0.05 Cr, 0.02 Al, and balance Fe were utilized. Before starting each electrochemical test, the CS electrode was meticulously polished with emery papers ranging in roughness from N° 180 to N° 2500. Then the polished electrode was washed with distilled water, degreased with acetone, and dried with heated air. The aggressive 1 M HCl solution was prepared by diluting HCl grade 37% (purchased from LOBA Chemie Company) with distilled water. Each test was carried out with a freshly obtained solution.5.2. Electrochemical measurements
Electrochemical methods were utilized to assess the immediate rate of corrosion and explain the effect of the inhibitors on the CS corrosion process. All electrochemical experiments were conducted using Potentiostat type OrigaStat 100, controlled by Origamaster5 software. The cell used three electrodes consisting of a working electrode (carbon steel), a platinum electrode as a counter electrode, and a saturated calomel electrode (SCE) as a reference electrode. The working electrode surface area exposed to the electrolyte was 0.64 cm2. Open circuit potential (OCP) surveillance was performed by immersing the working electrode in the corrosive medium in the absence and existence of inhibitors for 30 min. The potentiodynamic polarization (PDP) curves of the CS electrode in 1.0 M HCl, without and with inhibitors, were recorded in the potential range from −750 to −100 mV per SCE, at the scan rate of 1 mV s−1. Electrochemical impedance spectroscopy investigations were carried out by applying a signal amplitude perturbation of 10 mV, in the frequency range of 1 kHz to 100 MHz. The temperature effect on the inhibitor performance was evaluated in the range from 293 to 323 K.Conflicts of interest
The authors state that they have no known financial conflicts of interest or personal relationships that could potentially influence the content of this article.Acknowledgements
The authors would like to thank the Centre National of the Recherche Scientifique and Technique (CNRST) for the NMR 1H and 13C analysis. In addition, they thank Wissal KOTMANI of the Ecole de Technologie-Beni Mellal, Morocco, for his assistance with the electrochemical study, as well as Mehdi Mennani for FTIR analysis and important cooperation in developing the language.References
- M. Huang, J. J. Lu and J. Ding, Nat. Prod. Bioprospect., 2021, 11, 5–13 CrossRef PubMed.
- A. Samontha and K. Lugsanangarm, Prot. Met. Phys. Chem. Surf., 2019, 55, 187–194 CrossRef.
- A. L. Demain and P. Vaishnav, Microb. Biotechnol., 2011, 4, 687–699 CrossRef PubMed.
- Ö. Alver and C. Parlak, Vib. Spectrosc., 2010, 54, 1–9 CrossRef.
- K. C. Nicolaou, J. A. Pfefferkorn, A. J. Roecker, G. Q. Cao, S. Barluenga and H. J. Mitchell, J. Am. Chem. Soc., 2000, 122, 9939–9953 CrossRef CAS.
- F. R. Saber, P. E. S. Munekata, K. Rizwan, H. A. S. El-Nashar, N. M. Fahmy, S. H. Aly, M. El-Shazly, A. H. Bouyahya and J. M. Lorenzo, Crit. Rev. Food Sci. Nutr., 2023, 1–19 CrossRef PubMed.
- A. K. Patra and J. Saxena, Phytochemistry, 2010, 71, 1198–1222 CrossRef CAS PubMed.
- H. Kim, L. Gu, H. Yeo, U. Choi, C. R. Lee, H. Yu and S. Koo, Molecules, 2023, 28, 1–18 CAS.
- A. T. Zari, T. A. Zari and K. R. Hakeem, Molecules, 2021, 26, 7407 CrossRef CAS PubMed.
- S. M. Moraisa, N. S. V. Novaa, C. M. L. Bevilaquaa, F. C. Rondonc, C. H. Lobod, A. A. A. N. Mourad, A. D. Salesa, A. P. R. Rodriguesa, J. R. Figuereidoa, C. C. Campelloa, M. E. Wilsonf and H. F. Andrade, Bioorg. Med. Chem., 2014, 22, 6250–6255 CrossRef PubMed.
- B. Basappa, M. P. Sadashiva, K. Mantelingu, S. Nanjunda Swamy and K. S. Rangappa, Bioorg. Med. Chem., 2003, 11, 4539–4544 CrossRef PubMed.
- A. Taia, M. Essaber, A. Oubella, A. Aatif, J. Bodiguel, B. J. Grégoire, M. Y. A. Itto and H. Morjani, Synth. Commun., 2020, 50, 2052–2065 CrossRef CAS.
- T. Lane, M. Anantpadma, J. S. Freundlich, R. A. Davey, P. B. Madrid and S. Ekins, Pharm. Res., 2019, 36, 2–7 CrossRef PubMed.
- I. Gülçin, J. Med. Food, 2011, 14, 975–985 CrossRef PubMed.
- S. Sehajpal, D. N. Prasad and R. K. Singh, Arch. Pharm., 2019, 352, 2019 CrossRef PubMed.
- K. K. Anupama, K. Ramya, K. M. Shainy and A. Joseph, Mater. Chem. Phys., 2015, 1–14 Search PubMed.
- E. Chaieb, A. Bouyanzer, B. Hammouti and M. Benkaddour, Appl. Surf. Sci., 2005, 246, 199–206 CrossRef CAS.
- M. S. Mahajan, P. P. Mahulikar and V. V. Gite, Prog. Org. Coat., 2020, 148, 105–826 CrossRef.
- S. Nazreen, S. Eldin, I. Elbehairi, A. M. Malebari, N. Alghamdi, R. F. Alshehri, A. A. Shati, N. M. Ali, M. Y. Alfaifi, A. A. Elhenawy and M. M. Alam, ACS Omega, 2023, 8, 18811–18822 CrossRef CAS PubMed.
- A. Taia, B. El Ibrahimi, F. Benhiba, M. Ashfaq, M. N. Tahir, M. Essaber, A. Aatif, T. Hökelek, J. T. Mague, N. K. Sebbar and M. Essassi, J. Mol. Struct., 2021, 1234, 130–189 CrossRef.
- S. Boichuk, K. Syuzov, F. Bikinieva, K. Gankova, S. Igidov, N. Igidov, A. Galembikova and S. Zykova, Molecules, 2022, 27, 2873 CrossRef CAS PubMed.
- M. Pinkiewicz, M. Pinkiewicz, J. Walecki and M. Zawadzki, Front. Oncol., 2022, 12, 1–21 Search PubMed.
- M. Emilio, A. Boristav, K. Magdalena, V. Iva, G. Maya and Z. Alexander, Farmacia, 2022, 70(2), 344–354 CrossRef.
- E. K. Jung, E. Leung and D. Barker, Bioorg. Med. Chem. Lett., 2016, 26, 3001–3005 CrossRef CAS PubMed.
- S. S. Fatahala, M. S. Mohamed, M. Youns and R. H. Abd-El Hameed, Anticancer Agents Med. Chem., 2017, 17, 7 CrossRef PubMed.
- L. Ahmed and R. Omer, J. Phys. Chem. Funct. Mater., 2021, 4, 1–4 Search PubMed.
- L. Hao, K. Zhu, G. Lv and D. Yu, Prog. Org. Coat., 2019, 136, 105–251 CrossRef.
- P. Dhiman, N. Malik and A. Khatkar, BMC Chem., 2019, 13, 1–20 CrossRef CAS PubMed.
- R. Idouhli, A. Oukhrib, Y. Koumya, A. Abouelfida, A. Benyaich and A. Benharref, Corros. Rev., 2018, 36, 373–384 CrossRef CAS.
- S. Lahmady, O. Anor, I. Forsal, B. Mernari, H. Hanin, K. Benbouya and A. Talfana, Port. Electrochim. Acta, 2023, 41, 135–149 CrossRef CAS.
- S. Lahmady, O. Anor, I. Forsal, H. Hanin and K. Benbouya, Anal. Bioanal. Electrochem., 2022, 14, 303–318 CAS.
- H. Boubekraoui, I. Forsal, H. Ouradi, Y. Elkhotfi and H. Hanin, Anal. Bioanal. Electrochem., 2020, 12, 828–840 CAS.
- N. Karki, S. Neupane, Y. Chaudhary, D. K. Gupta and A. P. Yadav, Anal. Bioanal. Electrochem., 2020, 12, 970–988 CAS.
- X. Leia, H. Wang, Y. Fengc, J. Zhanga, X. Sunc, S. Laib, Z. Wangb and S. Kangb, RSC Adv., 2015, 5, 99084–99094 RSC.
- C. B. Verma, M. A. Quraishi and E. E. Ebenso, Int. J. Electrochem. Sci., 2014, 9, 5507–5519 CrossRef.
- I. Chakib, H. Elmsellem, N. K. Sebbar, S. Lahmidi, A. Nadeem, E. M. Essassil, Y. Ouzidan, I. Abdel-Rahman, F. Bentiss and B. Hammouti, J. Mater. Environ. Sci., 2016, 7, 1866–1881 CAS.
- K. Boumhara, M. Tabyaoui, C. Jama and F. Bentiss, J. Ind. Eng. Chem., 2015, 29, 146–155 CrossRef CAS.
- A. F. S. Abdul Rahiman and S. Sethumanickam, Arabian J. Chem., 2017, 10, S3358–S3366 CrossRef CAS.
- M. Chafiq, A. Chaouiki, M. R. Al-Hadeethi, S. K. Mohamed, K. Toumiat, I. H. Ali and R. Salghi, Coatings, 2020, 10, 700 CrossRef CAS.
Footnote |
| † Electronic supplementary information (ESI) available: Eugenol is an essential oil extracted from cloves; the crystallographic structure obtained from X-ray diffraction analysis; electrochemical parameters obtained from Tafel polarization curves and Nyquist plots. CCDC 2334215. For ESI and crystallographic data in CIF or other electronic format see DOI: https://doi.org/10.1039/d4ra01337a |
| This journal is © The Royal Society of Chemistry 2024 |


