 Open Access Article
Creative Commons Attribution 3.0 Unported Licence
Investigation into the impact of CeO2 morphology regulation on the oxidation process of dichloromethane
Hao Wuab,
Xiaoliang Zhaob,
Jian Lia,
Bandna Bhartic,
Yuling Tana,
Hongyan Longa,
Jiuhu Zhaod,
Gang Tiana and
Fan Wang *a
*a
aInstitute of Atmospheric Environment, Chinese Research Academy of Environmental Sciences, Beijing, 100012, China. E-mail: fanwangsd@163.com
bCollege of Environmental Science and Engineering, Liaoning Technical University, Fuxin, 123000, China
cDepartment of Chemistry, DAV University, Jalandhar, Punjab 144001, India
dHarbin Institute of Technology Shenzhen, Shenzhen, 518055, China
First published on 16th April 2024
Abstract
Four distinct CeO2 catalysts featuring varied morphologies (nanorods, nanocubes, nanoparticles, and nano spindle-shaped) were synthesized through a hydrothermal process and subsequently employed in the oxidation of dichloromethane (DCM). The findings revealed that the nano spindle-shaped CeO2 exhibited exposure of crystal faces (111), demonstrating superior catalytic oxidation performance for DCM with a T90 of 337 °C and notably excellent low-temperature catalytic activity (T50 = 192 °C). The primary reaction products were identified as HCl and CO2. Through obvious characterizations, it showed that the excellent catalytic activity presented by CeO2-s catalyst might be related to the higher oxygen vacancy concentration, surface active oxygen content, and superior redox performance caused by specific exposed crystal planes. Meanwhile, CeO2-s catalyst owned outstanding stability, reusability, and water inactivation regeneration, which had tremendous potential in practical treatment.
1 Introduction
Volatile Organic Compounds (VOCs) possess a multifaceted composition, undergoing decomposition upon exposure to light, thereby generating free radicals and peroxyl radicals. These radicals serve as pivotal precursors for the production of ozone and fine particulate matter, posing a substantial threat to the environment.1 Concurrently, VOCs are known to inflict severe damage on the human respiratory, nervous, and immune systems.2,3 Notably, chlorinated volatile organic compounds (CVOCs) are characterized by high toxicity, volatility, and resistance to degradation, emerging as significant pollutants with detrimental impacts on ecological ecosystems and human health.4 DCM, a representative CVOCs, finds widespread application as an organic solvent in sectors such as pharmaceuticals, spray coating, and rubber manufacturing.5 Urgency surrounds the imperative to fortify DCM treatment strategies. Common approaches for conducting the treatment of CVOCs encompass adsorption, absorption, condensation, combustion, low-temperature plasma, and catalytic oxidation.6,7 Catalytic oxidation, propelled by a catalyst, efficiently and comprehensively converts CVOCs into relatively non-toxic substances, including H2O, CO2, and HCl, with minimal energy consumption. It has evolved into the predominant technology applied in the CVOCs treatment sector in both China and internationally.8 Consequently, the preparation of catalysts that are efficient, stable, and cost-effective assumes paramount significance in enhancing the competitiveness of this technology. While precious metal catalysts boast merits such as a low ignition temperature, high activity, and elevated HCl selectivity, their scarcity contributes to prohibitively high costs. Furthermore, the vulnerability of catalyst surfaces composed of precious metals to carbon deposition, coupled with the adsorption of chlorine from CVOCs onto active sites, leads to the phenomenon of chlorine poisoning, ultimately culminating in catalyst deactivation subsequent to chlorine deposition.9,10 In recent years, non-precious metal catalysts have garnered extensive scholarly attention in China and globally due to their relatively high activity, cost-effectiveness, and resilience against chlorine poisoning.In addition, nanomaterials have unique physical, chemical and biological properties that make them promising for a wide range of applications in catalysis. Atul S. Nagpure et al.11 studied the catalytic transfer hydrogenation of 5-hydroxymethylfurfural (HMF) to 2,5-dimethylfuran (DMF) and furfural to 2-methylfuran (MF) using 2-propanol as hydrogen source on nitrogen-doped mesoporous carbon (NMCs) supported Ru, Pd and Au metal catalysts. It was shown that highly dispersed Ru nanoparticles loaded on NMC exhibited excellent catalytic performance for the conversion of HMF to DMF and furfural to MF in the CTH reaction. This is mainly attributed to the smaller nanoparticle size of Ru (1.9 nm) and the good interaction between the metal and the carrier. Zhu et al.12 used Cs3Sb2Br9 perovskite nanoparticles (NPs) as a lead-free photocatalysts for photocontrolled atom transfer radical polymerisation (ATRP). Cs3Sb2Br9 NPs have a high reduction potential, which enables efficient photo-induced reduction and controlls polymerisation of the initiator under blue light irradiation. Meanwhile, the Cs3Sb2Br9 NPs can be recycled four times, showing good reusability.
China boasts abundant reserves of rare earth elements, establishing its position as the leading global rare earth supplier, contributing to over 90 percent of the world's total rare earth production annually. These rare earth elements find extensive utilization in various applications, encompassing magnetic materials, luminescent materials, and catalysts dedicated to environmental protection.13 Among the rare earth materials, cerium dioxide (CeO2) assumes a pivotal role due to its inherent attributes, including a stable cubic fluorite structure. Notably, the facile interconversion between Ce3+ and Ce4+ ions endows CeO2 with remarkable oxygen storage and release capabilities and a pronounced redox performance. Concurrently, this interconversion results in the creation of oxygen vacancies within the original lattice. Oxygen vacancies serve a dual function: firstly, they possess the capacity to adsorb gaseous-phase oxygen and transform it into surface-active oxygen species, and secondly, they serve as active sites for the direct adsorption of chlorinated volatile organic compounds (CVOCs), thereby enhancing catalytic efficiency. Consequently, CeO2 exhibits a distinct advantage in the catalytic oxidation of CVOCs.14–16 Furthermore, in addition to the intrinsic properties of CeO2 delineated previously, the manipulation of CeO2's morphology exerts a significant impact on both the selectivity towards exposed crystal faces and its redox performance capacity. This, in turn, exerts a profound impact on the catalytic oxidation performance.
Tian et al.10 employed a one-step hydrothermal method to meticulously regulate the morphology of CeO2, specifically targeting the exposure of distinct crystal faces. Their investigation revealed that, in comparison to alternative CeO2 morphologies, nano-spherical CeO2, exposing the (111) crystal face, exhibited exceptional redox properties, lattice oxygen mobility, and emerged as the optimal catalyst for dichloroethane catalytic oxidation. In a similar vein, Hu et al.17 manipulated CeO2 morphology to modulate its selectivity towards exposed crystal faces. Their findings indicated that rod-shaped CeO2, selectively exposing (110) and (100) crystal faces, displayed heightened mobility of reactive oxygen species, lower energy for oxygen vacancy generation, and superior catalytic oxidation performance for propane when contrasted with other morphologies. In light of these observations, this study endeavors to explore the modulation of CeO2 selectivity towards exposed crystal faces through the manipulation of its morphology, thereby enhancing its catalytic efficacy on pollutants. Leveraging the hydrothermal synthesis method, four distinct nanomorphologies of CeO2 were prepared, with DCM, an industrially prevalent compound, chosen as the subject of investigation. Conspicuously, nano spindle-shaped CeO2 (CeO2-s) has not been used for catalytic oxidation of DCM. This paper meticulously examines and analyzes the impact of varied selectivities of CeO2, attributed to different nanomorphologies exposing crystal faces, on DCM catalytic performance, product selectivity, stability, reusability, and water resistance. Simultaneously, the catalyst undergoes rigorous physical and chemical characterization, encompassing morphology, crystal structure, specific surface area, average pore size, surface element valence and content, oxygen vacancy concentration, and redox performance. The synthesis of this comprehensive analysis constitutes an initial step in laying the foundation for the design and advancement of efficient catalysts specifically crafted for the mitigation of Chlorinated Volatile Organic Compound (CVOC) pollutants.
2 Experiment
2.1 Catalyst preparation
The synthesis of catalyst is shown in Fig. 1. The synthesis of nano rod-shaped CeO2 (CeO2-r) involved the following sequential steps: 2.17 g of Ce(NO3)3·6H2O solid was dissolved in 20 mL of deionized water, followed by the gradual addition of a pre-prepared 60 mL, 6 mol L−1 NaOH solution to the Ce(NO3)3·6H2O solution using a rubber-tipped dropper. The resulting mixture was stirred at room temperature on a magnetic stirrer for 0.5 h and subsequently transferred to a 100 mL Teflon high-pressure hydrothermal autoclave for hydrothermal synthesis at 125 °C for 24 h. The synthesized product was then filtered, dried, and subjected to a final roasting step in a muffle furnace at 500 °C for 3 h, yielding pale yellow rod-like CeO2 powders. For the preparation of nano cube-shaped CeO2 (CeO2-c), the same procedure as CeO2-r was followed, with the exception that the hydrothermal synthesis temperature was adjusted to 185 °C. The synthesis of nano particle-shaped CeO2 (CeO2-p) involved the addition of 5 mmol of Ce(NO3)3·6H2O and 40 mmol of urea to 80 mL of deionized water. After thorough mixing, the solution was placed in a 100 mL Teflon high-pressure hydrothermal autoclave for hydrothermal synthesis at 180 °C for 10 h. Following natural cooling to room temperature, the product was filtered, dried, and subjected to a final roasting step at 500 °C for 3 h to obtain particle-shaped CeO2 powders. The preparation of nano spindle-shaped CeO2 (CeO2-s) commenced with the addition of 2.4 mmol of Ce(NO3)3·6H2O to 80 mL of deionized water in a microwave ultrasound instrument. Simultaneously, 6.4 mmol of urea was swiftly introduced to the cerium-containing solution and subjected to ultrasound concussion for 0.5 h. The resulting mixture was transferred to a magnetic stirrer, stirred at room temperature for 0.5 h, and then placed in a 100 mL Teflon high-pressure hydrothermal autoclave at 130 °C for hydrothermal synthesis for 8 h. After cooling to room temperature, the product was centrifuged, filtered, and dried. The precursor powder was further calcined at 500 °C in a muffle furnace for 3 h to obtain spindle-shaped CeO2 powders.In summary, the total four different morphologies of CeO2 need to be heated up from room temperature to 500 °C in a muffle furnace at a rate of 2 °C min−1, and roasted at this temperature for 3 h. In this study, the different morphologies of CeO2 were prepared by hydrothermal synthesis, and the morphology of CeO2 was regulated by changing the hydrothermal temperature and time as well as the alkali concentration. Torrente-Murciano et al.18 conducted a careful study of the conditions for the formation of cerium oxide nanomorphology and found that both the temperature and the concentration of alkali had a significant effect on the CeO2 morphology. In particular, lower hydrothermal temperatures favoured the synthesis of nanoparticulate CeO2, while higher temperatures made it easier to synthesize nanocubic CeO2. Liao et al.19 prepared rod-shaped CeO2 by ultrasound-assisted hydrothermal method, and found that cerium precursor, alkali concentration, and ultrasound were the critical to the formation of CeO2 nanorods.
2.2 Catalyst characterization
Scanning electron microscopy (SEM) images of various CeO2 morphologies were acquired using a SU-8020 Scanning Electron Microscope Operating at 30 kV.Transmission electron microscopy (TEM) images, providing insights into the microscopic morphology and exposed crystal surfaces of the samples, were obtained using a JEM-2100HR Transmission Electron Microscope.
For the assessment of crystal structure, a Bruker D8 Advance X-ray powder diffractometer was employed. The analysis utilized a Cu Kα target with a wavelength (λ) of 0.154058 nm, operating at 40 kV and 200 mA. The scanning parameters included a speed of 10° min−1, and a scanning range spanning 2θ = 10–80°.
The N2 adsorption–desorption isotherm curve was generated at 77 K using the ASAP 2020 M automatic surface analyzer, a product of the US-based Micromeritics company. The specific surface area was determined employing the Brunauer–Emmett–Teller (BET) method, and the pore size distribution was analyzed using the Barrett–Joyner–Halenda (BJH) method.
Photoelectron spectroscopy (XPS) of the CeO2 samples was conducted utilizing the Thermo Scientific Escalab 250 Xi X-ray photoelectron spectrometer. The C 1s calibration binding energy was established at 284.8 eV.
Raman spectroscopic analysis (Raman) was executed employing the LabRAM Aramis Raman spectrometer from HYJ, France. The excitation light source had a wavelength of 325 nm (ultraviolet), and the scanning range spanned from 200 to 1400 cm−1.
The temperature programmed reduction (H2-TPR) test was performed using the Auto Chem II 2920 chemisorption instrument. The sample underwent a temperature ramp from room temperature to 300 °C in a nitrogen (N2) atmosphere (30 mL min−1) for 1 hour, followed by a return to room temperature. Subsequently, a 5% H2/Ar mixture was introduced as the reducing gas, and the sample temperature was elevated from room temperature to 800 °C at a heating rate of 10 °C min−1.
2.3 Catalytic activity
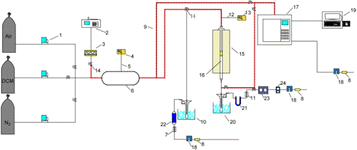
The catalyst activity evaluation device is shown in Fig. 2. A cylindrical silica glass tube, possessing an inner diameter of 12 mm, served as the immobile reactor bed for assessing the catalytic oxidation efficiency of the prepared catalyst towards DCM. A quantity of 0.6 g of the catalyst sample (40–60 mesh) was carefully positioned within a quartz glass tube, affixed both above and below using an appropriate amount of passivated quartz wool. Subsequently, the reactor temperature underwent an incremental rise from room temperature to 150 °C, employing a heating rate of 5 °C min−1, with a continuous flow of nitrogen set at 200 mL min−1. The temperature was sustained for 0.5 h to mitigate the influence of water vapor and other impurities on the experimental outcomes. A consistent concentration of DCM, incorporated into a gas mixture (20 vol% O2, N2 as the equilibrium gas), was introduced into the system at a total gas flow rate of 200 mL min−1. The tubular furnace initiated a programmed temperature ascent from 150 °C to 450 °C at a rate of 5 °C min−1. Samples were extracted at predefined temperature intervals for subsequent analysis. The catalyzed gas underwent bifurcation for analysis. One portion, subsequent to condensation and desiccation, traversed through the CO infrared detector (SGA-700B-CO) and CO2 infrared detector (SGA-700B-CO2) to quantify concentrations of CO and CO2. Subsequently, it was directed towards the portable chlorine-containing gas detector to ascertain concentrations of HCl and Cl2. The remaining portion was introduced into the gas chromatography system (GC-7890A) to identify organic components within the reaction gas. The GC was equipped with an FID detector and an HP series capillary chromatographic column.The calculations for DCM conversion rate and the yields of HCl, Cl2, CO2, and CO are delineated as follows:
 | (1) |
 | (2) |
 | (3) |
 | (4) |
 | (5) |
The reaction rates for different morphologies of CeO2 were compared and calculated as follows:
3 Results and discussion
3.1 Morphology and microstructure of CeO2 catalysts
The SEM was employed to scrutinize the morphological characteristics of the four CeO2 catalysts. Fig. 3(a–f) distinctly illustrates randomly dispersed rods, angular cubes, centrally located particles, and conspicuous spindle-shaped CeO2, respectively, aligning seamlessly with the envisioned design. Simultaneously, all catalyst samples exhibited a uniformly homogeneous morphology within a specified field of view, underscoring the consistent morphological integrity. In Fig. 3(a), CeO2-r was comprised of multiple nanorods with lengths of 40–350 nm. This morphology reveals inherent grain size heterogeneity, and a vertical observation of the nanorods indicates a solid structural configuration. Fig. 3(b and c), CeO2-c comprises numerous nanocubes, with ranging from 25–155 nm of side lengths. The smooth and angular surfaces of these nanocubes denote a high degree of crystallinity and a well-defined crystal structure.20 Fig. 3(d) illustrates CeO2-p, characterized by individual spherical nanoparticles with diameters falling within the range of 60–100 nm. The distribution of these nanoparticles appears more concentrated, with slight agglomeration. Moving on to Fig. 3(e), CeO2-s is depicted with multiple nanospindles, with significantly larger size compared to other morphologies. These spindles exhibit lengths ranging from 4.5–10 μm and widths ranging from 1–2 μm. Upon closer examination of a single nanospindle at relatively high resolution, as depicted in Fig. 3(f), it becomes evident that the two ends of the nanospindles are relatively sharp, with curved edges differing from the smooth surface of the nanocube. Moreover, the surface of the nanospindle reveals a profusion of slits, indicating the presence of abundant defective sites. The nanospindle comprises several closely stacked nano-strips, affirming a non-monocrystalline structure. This tightly stacked framework is prone to inducing planar staggering and generating structural defects.21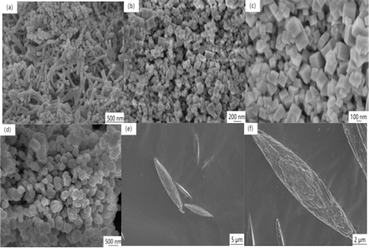 | ||
| Fig. 3 SEM of CeO2 with different nanomorphologies ((a) CeO2-r; (b and c) CeO2-c (d) CeO2-p; (e and f) CeO2-s). | ||
As depicted in Fig. 4(a, c, e and g), the rod-shaped, cubic, particle, and spindle-shaped morphologies of CeO2 are distinctly evident. Notably, each morphology exclusively appears within the visible range, providing additional evidence of the uniformity in morphology across all catalyst samples. Furthermore, the size results of the four distinct CeO2 catalysts align consistently with the SEM findings. For nano rod-shaped CeO2, the lattice fringe spacing predominantly measures 0.192 nm, corresponding to the (110) exposed crystal faces (Fig. 4(b)). Similarly, nano cube-shaped CeO2 exhibits lattice spacing primarily at 0.271 nm, corresponding to the (100) exposed crystal faces of CeO2 (Fig. 4(d)). The lattice spacing of nanoparticle CeO2 is 0.313 nm, aligning with the (111) exposed crystal face (Fig. 4(f)).22,23
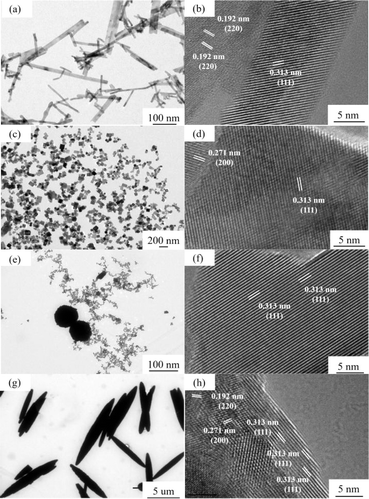 | ||
| Fig. 4 HR-TEM of CeO2 with different nanomorphologies ((a and b) CeO2-r; (c and d) CeO2-c; (e and f) CeO2-p; (g and h) CeO2-s). | ||
In the case of nano spindle-shaped CeO2, the structure comprises densely packed nanocrystals, indicative of a polycrystalline nature. Observations reveal several light spots on the crystal surface, suggesting the presence of defects. The lattice spacing of 0.313 nm corresponds to the (111) exposed crystal faces of CeO2 (Fig. 4(h)). Significant disparities in crystal size and specific exposed crystal faces are evident among CeO2 morphologies.23 By modulating the growth of CeO2 along different crystal faces, the selectivity of CeO2 towards exposed crystal faces can be adjusted. This provides a basis for further exploration into the impact of CeO2 catalysts with varying morphologies on the catalytic oxidation of DCM.
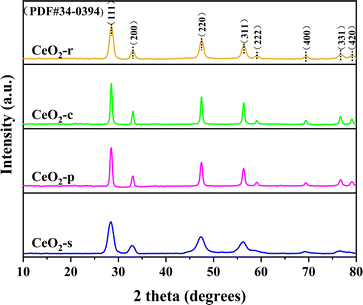
The crystal structures of the four distinct CeO2 catalyst morphologies were meticulously examined through XRD mapping, as illustrated in Fig. 5. Characteristic diffraction peaks manifest at 2θ angles of 28.5°, 33.1°, 47.4°, 56.4°, 59.0°, 69.5°, 76.9°, and 79.1° for CeO2 catalysts with different morphologies. Comparative analysis with the standard card XRD (JCPDS PDF#34-0394) reveals that these diffraction peaks align with (111), (200), (220), (311), (222), (400), (331), and (420) exposed crystal faces, respectively. This unequivocally confirms that the four distinct CeO2 morphologies prepared exhibit a typical cubic fluorite structure with a space group of Fm3m and a cell parameter of α = 5.411 Å.24 Both the intensity and width of diffraction peaks are intimately linked to the material's degree of crystallinity. Peak intensity correlates positively with crystallinity, while peak width correlates negatively.25 Analyzing characteristic diffraction peak intensities and peak half-maximum full widths for all catalyst samples reveals a specific order: CeO2-c > CeO2-p > CeO2-r > CeO2-s for peak intensity, and CeO2-s > CeO2-r > CeO2-p > CeO2-c for peak width. Notably, CeO2-s exhibits the lowest diffraction peak intensity and the highest peak width among the various CeO2 morphologies, signifying relatively low crystallinity and a propensity for lattice defects. This finding aligns consistently with the SEM and TEM results. By applying Scherrer's formula to the full width at half maximum of the diffraction peak at 2θ = 28.5°, the grain sizes of CeO2 with different morphologies were calculated. The resulting order of grain sizes is CeO2-c (26.47 nm) > CeO2-p (22.08 nm) > CeO2-r (12.06 nm) > CeO2-s (8.82 nm), with spindle-shaped CeO2 boasting the smallest grain size. The grain size of CeO2 significantly influences the content of surface oxygen species and the concentration of defective oxygen vacancies.26 Smaller grain size CeO2 catalysts are advantageous for exposing surface-active sites, thereby exhibiting heightened catalytic degradation effects.
The N2 adsorption–desorption isotherms and BJH pore size distribution for CeO2 with various morphologies are elucidated in Fig. 6. The adsorption–desorption isotherms of the four CeO2 catalyst morphologies showcase typical H3-type hysteresis loops within the P/P0 range of 0.4 to 0.97. Following IUPAC classification, the isotherms for all CeO2 catalysts, regardless of morphology, fall under type IV, signifying narrow mesoporous structures for each.27 The starting height of the hysteresis loop is proportionate to the specific surface area of the samples.28 Notably, the loop starting heights follow the order: CeO2-s > CeO2-r > CeO2-p > CeO2-c. This implies that CeO2-s boasts the largest specific surface area, aligning consistently with the findings presented in Table 1. Concurrently, the pore size distribution (BJH) of CeO2 catalysts is depicted in the figure, revealing varying but mesoporous structures for all morphologies. Specific surface area, pore volume, and pore size for the four CeO2 catalysts are detailed in Table 1 Notably, the specific surface area of CeO2-s stands at 107.8 m2 g−1, significantly surpassing CeO2-r (85.9 m2 g−1), CeO2-c (40.5 m2 g−1), and CeO2-p (70.6 m2 g−1). Tamboli et al.29 similarly prepared four different shapes of CeO2, namely sphere, mixed shape, spindles, and rod, where CeO2 spindles exhibited the largest specific surface area (104 m2 g−1), which is consistent with the results tested here. A larger specific surface area facilitates increased exposure of active sites, thereby enhancing pollutant adsorption on the catalyst surface and promoting more thorough oxidative decomposition.30 Pore size analysis indicates similar sizes for CeO2-r (20.7 m2 g−1), CeO2-c (23.2 nm), and CeO2-p (27.9 nm) catalysts, while CeO2-s exhibits a markedly smaller pore size of 3.4 nm. A smaller pore size suggests poorer crystallization effects, rendering the material prone to lattice defects and subsequently elevating the surface concentration of oxygen vacancies. This observation aligns with the combined analysis of SEM and XRD characterizations.
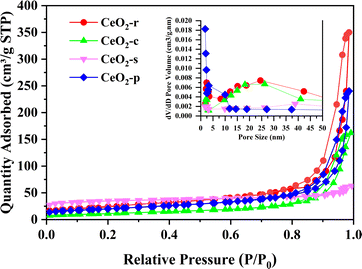 | ||
| Fig. 6 Nitrogen adsorption–desorption isotherms of CeO2-x (x = r, c, p, s), and the corresponding BJH pore size distribution. | ||
| Samples | SBET (m2 g−1) | Pore volume (cm3 g−1) | Pore size (nm) | Grain size (nm) |
|---|---|---|---|---|
| CeO2-r | 85.9 | 0.365 | 20.7 | 12.06 |
| CeO2-c | 40.5 | 0.235 | 23.2 | 26.47 |
| CeO2-p | 70.6 | 0.108 | 27.9 | 22.08 |
| CeO2-s | 107.8 | 0.091 | 3.4 | 8.82 |
3.2 Surface chemical states
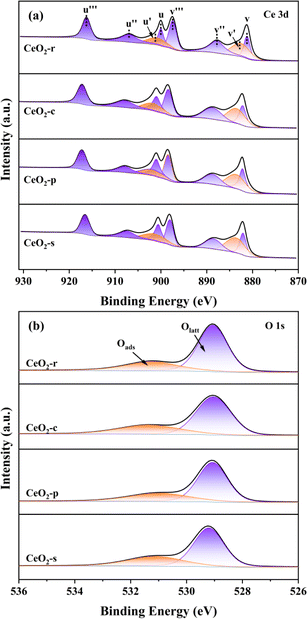
X-ray Photoelectron Spectroscopy (XPS) serves to elucidate the electronic layering of atoms or molecules present on the catalyst surface, facilitating a comprehensive analysis of surface elemental composition and valence states within the catalyst specimen. In Fig. 7(a), the Ce 3d photoelectron spectra of CeO2 catalysts with diverse morphologies are depicted. It is noteworthy, as elucidated in the pertinent literature,31 that the deconvolution process resulted in the identification of eight distinct sets of peaks for Ce 3d, encompassing two spin orbitals, namely 3d5/2 (u) and 3d3/2 (v). This finding signifies the coexistence of two valence states, Ce4+and Ce3+, on the surfaces of CeO2 catalysts with varying morphologies.The distinctive peaks in the Ce 3d spectrum, denoted as u (900.8 eV), u′′ (907.2 eV), u′′ (816.6 eV), v (882.3 eV), v′′ (888.6 eV), and v′′ (897.7 eV), are unequivocally associated with Ce4+. In contrast, the characteristic peaks located at u′ (902.5 eV) and v′ (884.9 eV) correspond to Ce3+. This phenomenon entails the relinquishment of electrons by lattice oxygen atoms, leading to their departure from the lattice site and subsequently giving rise to the generation of oxygen vacancies.
Simultaneously, Ce4+ undergoes electron acquisition, converting into Ce3+, thereby signifying the occurrence of oxygen vacancy generation. The presence of Ce3+ serves as an indicator, and its concentration exhibits a positive correlation with the oxygen vacancy concentration.32 Oxygen vacancies on the catalyst surface facilitate the adsorption of gas-phase oxygen, and a sequential migration process occurs as follows: O2 → 2O → O2− → 2O− → 2O2−.33 This migration mechanism promotes the catalytic oxidation of DCM. To semi-quantitatively assess the ratio of Ce3+ to total Ce in different orbitals, calculations were based on the characteristic peak area ratio of Ce3+ to total Ce. As outlined in Table 2, CeO2-s exhibits the highest Ce3+ content across various orbitals. This observation may be attributed to the nano spindle-shaped CeO2, as revealed in transmission electron microscopy (TEM), featuring a concave–convex interface resulting from extensive planar interlacing. The elevated Ce3+ content indicates a higher concentration of oxygen vacancies in this morphology, which, in turn, adsorb and activate gas-phase oxygen, transforming into highly active surface oxygen species. This process promotes their migration, thereby enhancing the catalytic oxidation performance of DCM. Conversely, CeO2-c demonstrates a lower Ce3+ content compared to the other three morphologies. This observation aligns with the crystallographic analysis using scanning electron microscopy (SEM) and X-ray diffraction (XRD), suggesting that the nano cubic-shaped CeO2 possesses a complete and smoothly oriented surface crystal structure.
| Samples | 3d3/2 Ce3+ | Ce 3d 3d5/2 Ce3+ | Ce3+/(Ce3+ + Ce4+) (%) | O 1s Oads/(Olatt + Oads) (%) |
|---|---|---|---|---|
| CeO2-r | 22.51 | 32.41 | 28.1 | 31.63 |
| CeO2-c | 20.77 | 27.97 | 24.82 | 28.71 |
| CeO2-p | 21.13 | 30.53 | 26.33 | 32.31 |
| CeO2-s | 25.51 | 35.84 | 31.15 | 35.18 |
Fig. 7(b) presents the O 1s photoelectron spectroscopy results for four distinct morphologies of CeO2. Based on the binding energy, these spectra are categorized into two groups of characteristic peaks. Peaks occurring around 529.4 eV are attributed to lattice oxygen (Olatt), those at approximately 531.4 eV correspond to surface adsorbed oxygen (Oads).34,35 Notably, Oads encompasses O2− and O22−, serving as active oxygen species generated on oxygen vacancies, effectively catalyzing the degradation of adsorbed DCM. Consequently, the ratio of Oads/(Olatt + Oads) serves as an indicator of Oads concentration and provides an assessment of oxygen vacancy concentration.36 Quantitative analysis of characteristic peak areas, as detailed in Table 2, reveals the following order for the Oads/(Olatt + Oads) ratio: CeO2-s (35.18%) > CeO2-p (32.31%) > CeO2-r (31.63%) > CeO2-c (28.71%). CeO2-s exhibits a notably higher ratio, indicating a more substantial concentration of surface adsorbed oxygen compared to other CeO2 morphologies. This finding further substantiates that the nano spindle-shaped CeO2 surface features the highest oxygen vacancy concentration, a conclusion consistent with the Ce 3d spectroscopy results.
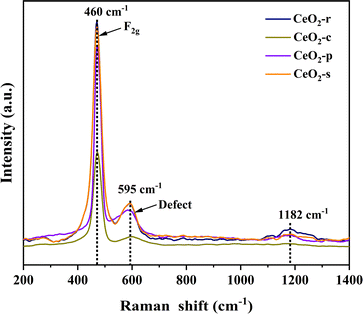
The molecular structure of the prepared catalysts was scrutinized through Raman spectroscopy, and the outcomes of Raman spectroscopic characterization for CeO2 with distinct morphologies are presented in Fig. 8 All four diverse nanomorphologies of CeO2 catalysts exhibit prominent characteristic peaks at 460, 595, and 1182 cm−1. The Raman peak observed at 460 cm−1 corresponds to the symmetric telescopic vibrational peaks (F2g) associated with the Ce4+ cation and the surrounding eight O2− anions in the cubic fluorite structure of CeO2. This observation corroborates the cubic crystalline structure of CeO2, aligning with the X-ray diffraction (XRD) results.37 The Raman peak at 595 cm−1 is attributed to the characteristic peak of oxygen vacancy, specifically the Frenkel defect induction mode (D) induced by the presence of Ce3+.38 Additionally, the Raman peak at 1182 cm−1 corresponds to the second-order longitudinal optical vibration peak (2LO).39 In general, the ratio of peak D to peak F2g intensity (ID/IF2g) allows for the quantitative analysis of the surface oxygen vacancy concentration in CeO2. A higher ratio indicates a greater surface oxygen vacancy concentration.40,41 Oxygen vacancies, as significant structural defects in metal oxides, serve as a pivotal reference index for evaluating catalytic oxidation performance. They not only adsorb gas-phase oxygen molecules, forming highly reactive surface oxygen species in catalytic reactions, but also directly act as adsorption sites for pollutants, enhancing catalytic degradation effectiveness. The ID/IF2g ratios for the four distinct nanomorphologies of CeO2 catalysts follow the order: CeO2-s > CeO2-r > CeO2-p > CeO2-c. This sequence further affirms that the relatively high concentration of oxygen vacancies on the surface of nano spindle-shaped CeO2 is conducive to the catalytic oxidation of DCM, a conclusion consistent with the X-ray photoelectron spectroscopy (XPS) results.
3.3 Temperature programmed characterizations
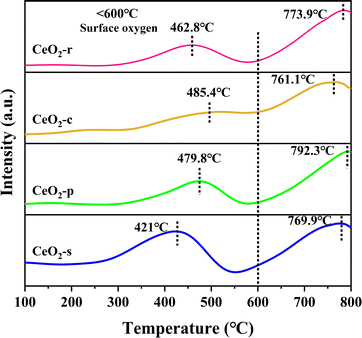
CeO2, owing to its facile interconversion between Ce3+ and Ce4+, possesses exceptional redox properties and finds widespread applications in the field of catalytic oxidation. The low-temperature reduction properties of four distinct nanomorphologies of CeO2 were investigated using H2-TPR spectroscopy. Typically, the reduction of CeO2 can be categorized into three temperature intervals, namely surface oxygen reduction at 250–400 °C, subsurface oxygen reduction at 400–600 °C, and bulk oxygen reduction at 600–1000 °C.42 As depicted in Fig. 9, all four diverse nanomorphologies of CeO2 exhibit two sets of high-resolution reduction peaks. The reduction peak at <600 °C corresponds to the reduction of CeO2 surface oxygen, whereas the peak at >600 °C signifies the reduction of CeO2 bulk-phase oxygen.43 The primary focus centers on the investigation of the reduction peak in the low-temperature range (<600 °C), as it directly reflects the extent of involvement of surface-active oxygen species and is intricately linked to the catalytic performance at low temperatures.Evident from the sequence of reduction peak signals, the temperatures at which the reduction peaks occur follow the order: CeO2-c > CeO2-p > CeO2-r > CeO2-s. CeO2-c exhibits a reduction peak at 485.4 °C, while the reduction peaks for other CeO2 morphologies shift towards lower temperatures. Specifically, CeO2-s registers the lowest peak temperature, with a maximum temperature difference of 64.4 °C compared to CeO2-c. Generally, a lower temperature for the occurrence of the reduction peak signifies superior redox performance. Robust redox properties are advantageous for the catalytic oxidation of DCM.44–46 This observation suggests that the surface oxygen species on the nano spindle-shaped CeO2 catalyst are more active, demonstrating enhanced low-temperature reduction performance. To delve deeper into the reduction performance of the prepared catalyst, hydrogen consumption was analyzed. Based on the peak area of the hydrogen consumed by reduction, the chemisorbent for the test had the peak area of the corresponding hydrogen consumption calibrated, which led to the calculation of the hydrogen consumption during the TPR of different samples.47,48
As shown in Table 3, In the low-temperature interval, the hydrogen consumption of CeO2 with different nanomorphologies follows the order: CeO2-s > CeO2-r > CeO2-p > CeO2-c, with the hydrogen consumption of CeO2-s being 2.13 times that of CeO2-c. It is well-established that hydrogen consumption is directly proportional to the content of surface-active oxygen species.49,50 The hydrogen consumption results further indicates that the spindle-shaped CeO2 catalysts, featuring exposed crystal faces of (111) are abundant in surface-active oxygen species. Consequently, CeO2-s exhibit excellent low-temperature reduction properties and hold significant potential for catalyzing the oxidation of DCM. Notably, this finding aligns with the X-ray photoelectron spectroscopy (XPS) results.
| Samples | Peak position (°C) | H2 consumption (mmol g−1) |
|---|---|---|
| CeO2-r | 462.8 | 0.673 |
| CeO2-c | 485.4 | 0.412 |
| CeO2-p | 479.8 | 0.614 |
| CeO2-s | 421 | 0.878 |
3.4 Evaluation of catalyst activity
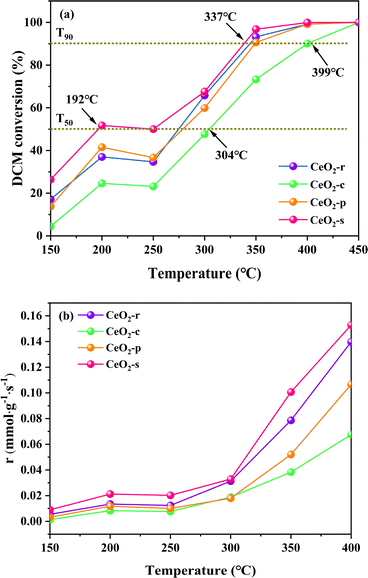
The catalytic degradation effects on DCM by the four prepared catalysts with different nanomorphologies (CeO2-r, CeO2-c, CeO2-p, CeO2-s) in the temperature interval of 150–450 °C are illustrated in Fig. 10. The corresponding temperatures (T50, T90), representing the achievement of 50% and 90% conversion rates of DCM over the different morphologies of CeO2 catalysts, are presented in Table 4. As depicted in Fig. 10(a), the conversion rate of DCM over the four different nanomorphologies of CeO2 catalysts exhibits an ascending trend with increasing temperature. All catalyst samples demonstrate complete catalysis of DCM oxidation at temperatures up to 450 °C. However, during the programmed temperature increase (<450 °C), the catalytic oxidation effects of different nanomorphologies of CeO2 on DCM vary significantly. The order of reaching T50 is as follows: CeO2-c (304 °C) > CeO2-p (277 °C) > CeO2-r (268 °C) > CeO2-s (192 °C), with CeO2-s achieving T50 at less than 200 °C. This temperature is significantly lower than the other three morphologies, and when compared with CeO2-c, the difference between the two-ΔT50 = 112 °C. This result suggests that the nano spindle-shaped CeO2 exhibits superior catalytic activity at low temperatures.| Samples | T50 (°C) | T90 (°C) |
|---|---|---|
| CeO2-r | 268 | 344 |
| CeO2-c | 304 | 399 |
| CeO2-p | 277 | 347 |
| CeO2-s | 192 | 337 |
The order in which different nanomorphologies of CeO2 reach T90 is as follows: CeO2-c (399 °C) > CeO2-p (347 °C) > CeO2-r (344 °C) > CeO2-s (337 °C), with CeO2-s achieving T90 at the lowest temperature, exhibiting a difference of ΔT90 = 62 °C compared to CeO2-c. The nano spindle-shaped CeO2 catalysts results show that featuring exposed crystal faces of (111) is significantly robust catalytic degradation effects on DCM. Considering the aforementioned characterization results, the nano spindle-shaped CeO2 catalysts, in comparison with the other three morphologies of CeO2 catalysts, exhibit characteristics such as a large specific surface area, small pore size, weak crystallinity, robust low-temperature reduction performance, high oxygen vacancy concentration, and abundant surface oxygen species. These characterization results further affirm that nano spindle-shaped CeO2 catalysts exert a more pronounced catalytic oxidation effect on DCM.
In Fig. 10(a), all four CeO2 catalysts with different morphologies exhibit a transient deactivation phenomenon in the temperature interval of 200–250 °C. The conversion rates of DCM decrease to varying degrees with the rise in temperature, a behavior that may be attributed to the strong adsorption of chlorine (Cl) species from DCM at lower temperatures onto active sites on the catalyst surface.51,52 As the reaction temperature increases and oxygen diffuses through the surface lattice, the Cl species adsorbed on the catalyst surface gradually desorb, leading to a restoration of the activities of the various CeO2 catalyst morphologies, with an increasing trend.
Fig. 10(b) shows the reaction rates of CeO2 catalysts with different morphologies at 150–400 °C, the order in which different nanomorphologies of reaction rates are as follows: CeO2-s > CeO2-r > CeO2-p > CeO2-c. Which indicates that CeO2-s has the highest reaction rate for the most efficient conversion of DCM as the temperature increases, and this result is in agreement with Fig. 10(a).
3.5 Product distribution of catalysts
The nature of a catalyst plays a crucial role in determining its product distribution. To investigate the correlation between exposed crystal faces and product selectivity, CeO2 nanomorphologies were deliberately controlled by altering the preparation conditions. This regulation aimed to influence the selectivity towards exposed crystal faces during the catalytic oxidation of DCM using different morphologies of CeO2. The catalytic products, including HCl, Cl2, CO2, and CO in the exhaust gas, were collected, and the yields were calculated and analyzed using the provided equation. The HCl yield of the catalytic products from the four distinct nanomorphologies of CeO2 catalysts is illustrated in Fig. 11(a). It is evident that all catalysts exhibit an increasing trend in HCl yield within the temperature interval of 150–450 °C. The yield follows the order: CeO2-s > CeO2-p > CeO2-r > CeO2-c. The prepared catalysts achieve yields exceeding 50%, indicating robust HCl selectivity. Evidently, the nano spindle-shaped CeO2 catalysts with exposed crystal faces (111) demonstrate the highest HCl yield at 65.67%, underscoring their superior performance in this regard.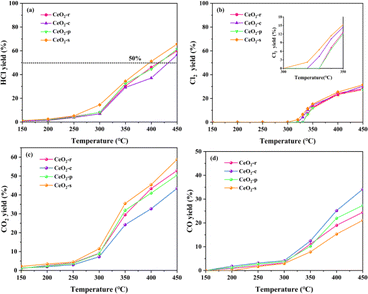 | ||
| Fig. 11 Distribution of HCl (a), Cl2 (b), CO2 (c), CO (d) yields of CeO2 with different nanomorphologies at different temperatures. | ||
The HCl yield of CeO2 catalysts, across all samples, exhibits a gradual increase in the temperature interval of 150–250 °C. During this interval, the HCl yield for all catalysts remains below 10%, potentially attributed to the fact that HCl does not reach its desorption temperature before 250 °C. As the temperature rises to 300 °C, the incline of the HCl yield curves for all catalysts notably intensifies. The distribution of Cl2 yield for different morphologies of CeO2 catalysts is depicted in Fig. 11(b). All catalysts generate a certain amount of Cl2 at higher temperatures (>300 °C), a phenomenon that may be associated with the Deacon reaction (4HCl + O2 → 2Cl2 + 2H2O). CeO2-s exhibits a notably high Cl2 yield. In conjunction with X-ray photoelectron spectroscopy (XPS) and Raman characterization results, CeO2-s demonstrates a higher oxygen vacancy concentration than other morphologies. This characteristic promotes the migration of surface lattice oxygen, facilitating the diffusion of lattice oxygen to the outer surface of the catalyst. This process replaces Cl species on the oxygen vacancy, thereby contributing to the generation of Cl2. Additionally, the Cl2 generation temperature of CeO2-s is 315 °C, lower than that of the other three morphologies. This is attributed to the richer content of surface oxygen species on the surface of the CeO2-s catalyst. The Cl2 generation temperature of CeO2-p is observed to be 335 °C, indicating an increased temperature for Cl2 generation.
The yields of CO2 and CO for all catalyst samples are depicted in Fig. 11(c and d), offering insight into the redox properties by comparing the COx yield of CeO2 with different morphologies. The COx yield for all four nanomorphologies of CeO2 increases with temperature, yet their yields differ. Specifically, CeO2-s exhibits the highest CO2 yield, CeO2-r and CeO2-p demonstrate similar yields, while the CO2 yield of CeO2-c is notably lower than the three aforementioned morphologies. These results indicate that nano spindle-shaped CeO2 catalysts with exposed crystal faces of (111) possess superior redox capacity. Furthermore, the CO yield of all catalysts was analyzed Fig. 11(d), revealing that CeO2-c has a higher CO content than the other three morphologies. This suggests that the lower redox capacity of cubic CeO2 itself results in an inability to efficiently and swiftly oxidize intermediate transition products and CO generated during the reaction process to CO2, leading to a higher CO yield.
3.6 Stability and durability of catalysts
The long-term stability and reusability of CeO2-s in the catalytic oxidation of DCM were examined. The catalytic degradation rate of DCM by CeO2-s, operating continuously at a constant temperature of 340 °C for 48 hours, is illustrated in Fig. 12(a). The results indicate that there is no significant activity loss of the catalyst during the experiment, and the degradation rate of DCM remains stable at about 90% until the end of the experiment. This outcome suggests that CeO2-s exhibits good chlorine resistance and resistance to carbon accumulation, demonstrating stability in the catalytic oxidation of DCM. Additionally, four consecutive cycle tests were conducted on CeO2-s, and the degradation effect of DCM within the temperature interval of 150–450 °C is presented in Fig. 12(b). Throughout the continuous cycle test, the catalytic activity of CeO2-s shows a slight decreasing trend, but this has minimal impact on the overall catalytic reaction. In the four cycles, CeO2-s achieves T50 for DCM catalytic oxidation before 200 °C and T90 before 350 °C. This outcome further emphasizes the good stability of nano spindle-shaped CeO2, making it suitable for reuse in practical catalytic DCM applications and contributing to reduced treatment costs.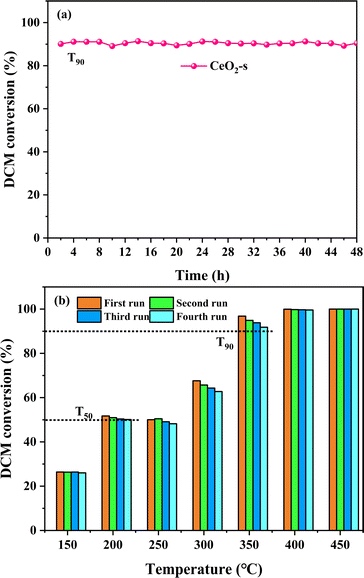 | ||
| Fig. 12 Stability performance test of CeO2-s catalyst for DCM catalytic oxidation (a), durability test of CeO2-s catalyst for DCM catalytic oxidation at 150–450 °C (b). | ||
3.7 Effect of WHSV
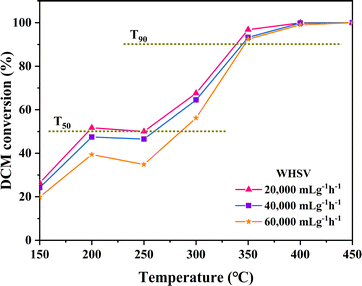
The impact of various airspeed conditions (Weight Hourly Space Velocity-WHSV) on the degradation of DCM over CeO2-s catalysts was investigated, as illustrated in Fig. 13. As the WHSV increases from 20![[thin space (1/6-em)]](https://www.rsc.org/images/entities/char_2009.gif) 000 mL g−1 h−1 to 60
000 mL g−1 h−1 to 60![[thin space (1/6-em)]](https://www.rsc.org/images/entities/char_2009.gif) 000 mL g−1 h−1, a decreasing trend is observed in the activity of CeO2-s catalysts. However, catalysts at different WHSV levels demonstrate the ability to achieve T90 at 350 °C against DCM, indicating enhanced resistance to DCM impact for nano spindle-shaped CeO2 catalysts. Specifically, at WHSV = 20
000 mL g−1 h−1, a decreasing trend is observed in the activity of CeO2-s catalysts. However, catalysts at different WHSV levels demonstrate the ability to achieve T90 at 350 °C against DCM, indicating enhanced resistance to DCM impact for nano spindle-shaped CeO2 catalysts. Specifically, at WHSV = 20![[thin space (1/6-em)]](https://www.rsc.org/images/entities/char_2009.gif) 000 mL g−1 h−1, T50 and T90 are 192 °C and 337 °C, respectively, marking a decrease of 73 °C and 11 °C compared to WHSV = 60
000 mL g−1 h−1, T50 and T90 are 192 °C and 337 °C, respectively, marking a decrease of 73 °C and 11 °C compared to WHSV = 60![[thin space (1/6-em)]](https://www.rsc.org/images/entities/char_2009.gif) 000 mL g−1 h−1. These results suggest that at lower WHSV, DCM exhibits a prolonged residence time on the CeO2-s catalyst surface compared to higher WHSV conditions. This prolonged exposure facilitates the adsorption of DCM on the catalyst surface for activation, thereby promoting the catalytic degradation of DCM.
000 mL g−1 h−1. These results suggest that at lower WHSV, DCM exhibits a prolonged residence time on the CeO2-s catalyst surface compared to higher WHSV conditions. This prolonged exposure facilitates the adsorption of DCM on the catalyst surface for activation, thereby promoting the catalytic degradation of DCM.
3.8 Water resistance of catalysts
CeO2-s catalysts demonstrate effectiveness in the catalytic oxidation of DCM under ideal drying conditions. However, typical industrial exhaust gases often contain approximately 5 vol% moisture, a factor that commonly hampers catalyst activity and influences the catalytic degradation efficiency.53,54 The water resistance of CeO2-s catalysts exhibiting optimal DCM catalytic oxidation performance was investigated by introducing 1 vol% and 5 vol% H2O into the mixed dry gas. As depicted in Fig. 14, at a constant temperature of 400 °C, the CeO2-s catalyst maintains stable activity with DCM conversion hovering around 99.5%. Upon the addition of 1 vol% H2O to the gas mixture, the CeO2-s catalyst experiences show a slight impact on DCM conversion, resulting in a decrease in DCM conversion to approximately 98%. Meanwhile, HCl production increased from 51.17% to 58.21% and Cl2 production decreased from 25.32% to 21.27%. Upon cessation of water vapor addition to the gas mixture, DCM conversion and HCl/Cl2 production gradually reverts to its initial level before reaching stability. Upon the addition of 5 vol% H2O to the gas mixture, the CeO2-s catalyst experiences a noticeable impact, resulting in a decrease in DCM conversion to approximately 93.29%. The results indicate that higher concentrations of water vapour cause slight catalyst deactivation. Despite the continuous introduction of a fixed amount of water vapor, DCM conversion remains stable at around 93%, underscoring the water resistance of nano spindle-shaped CeO2. Meanwhile, HCl production increased to 66.25% and Cl2 production decreased to 18.12%. Upon cessation of water vapor addition to the gas mixture, DCM conversion and HCl/Cl2 production gradually reverts to its initial level before reaching stability. The results indicate that water vapour in the gas mixture promotes the conversion and desorption of chlorine species adsorbed on the catalyst surface to HCl and inhibits the positive operation of the Deacon reaction, leading to an increase in the production of HCl and a decrease in the production of Cl2. At the same time, water molecules readily adsorb on the active sites of the catalyst surface, competing with DCM for adsorption. This competition renders the activation of DCM adsorption on the CeO2-s surface more challenging, consequently diminishing DCM conversion and relating with HCl/Cl2 production. However, it's noteworthy that the inhibition of catalyst activity by water vapor is of a physical nature, and this inhibition dissipates upon the removal of water vapor.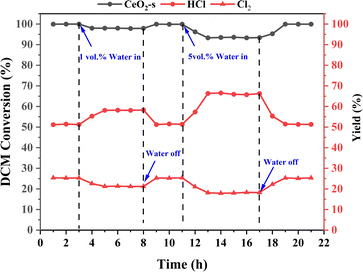 | ||
| Fig. 14 Effect of 1 vol% and 5 vol% H2O on DCM reaction performance over CeO2-s catalysts at 400 °C. | ||
4 Conclusions
In this work, four CeO2 catalysts presented different catalytic performance, and the influence of exposed crystal surface was accordingly investigated. Compared to CeO2-r, CeO2-c and CeO2-p catalysts, CeO2-s catalysts exhibited the best DCM catalytic oxidation (T90 = 337 °C, T50 = 192 °C) and the higher HCl and CO2 production rates. Obvious characterizations included that CeO2-s catalysts owned smaller grain size, higher specific surface area, more surface oxygen species, higher concentration of oxygen vacancies, and low-temperature reductivity. Among them, smaller grain size and larger specific surface area contributed the most in the catalytic oxidation of DCM. Extensive performance tests were conducted on CeO2-s catalysts. Specifically, stability and durability tests suggested that CeO2-s exhibited robust stability and maintained consistently high activity over four usage cycles, showcasing excellent reusability and cost-effectiveness in practical applications. Water resistance and varying airspeed effect tests demonstrated that CeO2-s displayed efficient activity recovery after water vapor removal, while the catalytic activity for DCM performed a decreasing trend with increasing weight hourly space velocity.It has been shown that the shape of CeO2 nanoparticles is influenced by multiple factors, including the nature of the solvent, the concentration of precursors, the use of additives, and the temperature and time of the reaction. The following are several factors that may influence the growth mechanism of CeO2 nanoparticles:
4.1 Solvent effect
The nature of the solvent (e.g. polarity, dielectric constant, etc.) can significantly affect the nucleation and growth process of nanoparticles. Heterogeneous solvents have different effects on the solubility of CeO2 precursors and the diffusion rate of reactants, thus changing the shape and size of particles.4.2 Precursor concentration
The concentration of the precursor will affect the rate of nucleation and growth. Higher concentrations of precursors lead to rapid nucleation and the formation of smaller particles. The lower concentration may promote the growth of particles and form larger particles.4.3 Additives
Additives or surfactants used in the synthesis process can be adsorbed onto specific crystalline surfaces, thereby affecting the direction and shape of particle growth. These molecules promote the formation of particles of specific shapes by selectively hindering the growth of certain crystalline surfaces.4.4 Reaction temperature and time
Reaction temperature and time are crucial elements for the growth of CeO2 nanoparticles. Higher reaction temperatures generally accelerate nucleation and growth processes, while longer reaction times allow for further particle growth, which together determine the final shape and size of the particle.4.5 Crystal growth kinetics
The growth of CeO2 nanoparticles is also affected by crystal growth kinetics. Crystal growth anisotropy (i.e., differences in growth rates at different crystal planes) can lead to the formation of nanoparticles with diverse shapes.Conflicts of interest
The authors declare that they have no known competing financial interests or personal relationships that could have appeared to influence the work reported in this paper.Acknowledgements
This work was supported by the Key Technologies Research and Development Program of China (2022YFC3703403 and 2023YFE0199300) and the Hainan Provincial Department of Science and Technology (ZDKJ202007).Notes and references
- S. Wang and J. Hao, Air quality management in China: Issues, challenges, and options, J. Environ. Sci., 2012, 24, 2–13 CrossRef CAS PubMed.
- H. L. Wang, L. Nie and J. Li, et al, Emission characteristics and evaluation analysis of volatile organic compounds in key industries, Chin. Sci. Bull., 2012, 57, 1739–1746 CrossRef.
- M. S. Kamal, S. A. Razzak and M. M. Hossain, Catalytic oxidation of volatile organic compounds (VOCs) – A review, Atmos. Environ., 2016, 140, 117–134 CrossRef CAS.
- D. S. Richardson, K. Joshua and M. D. Hart, et al, A novel application of a geotechnical soil stabilization technology for improved delivery of remedial amendments, Biorem. J., 2022, 33, 25–38 CrossRef.
- Y. Wang, Y. N. Pei and Y. F. Zhou, et al, Research progress in dichloromethane waste gas treatment technology, Environ. Pollut. Prev. Control, 2023, 45, 1013–1017 Search PubMed.
- S. Li, X. Dang and X. Yu, et al, The application of dielectric barrier discharge non-thermal plasma in VOCs abatement: A review, J. Chem. Eng., 2020, 388, 124275 CrossRef CAS.
- C. Xi, Y. Shinong and L. Wei, et al., Recent advance on cobalt-based oxide catalyst for the catalytic removal of volatile organic compounds: A review, Resour. Chem. Mater., 2022, 1, 27–46 Search PubMed.
- W. Xueqian, H. Rui and L. Qingling, et al, A review of confined-structure catalysts in the catalytic oxidation of VOCs: synthesis, characterization, and applications, Catal. Sci. Technol., 2021, 11, 5374–5387 RSC.
- K. Shen, M. Jiang and X. Yang, Low-temperature catalytic combustion of trichloroethylene over MnOx-CeO2 mixed oxide catalysts, J. Rare Earths, 2023, 41, 523–530 CrossRef CAS.
- M. J. Tian, Y. Huang and Q. Yang, et al, Study on the Morphological Construction of CeO2 and Its Influence on the Oxidation Process of 1,2-dichloroethane, J. Rare Earths res., 2023, 41, 587–596 Search PubMed.
- S. A. Nagpure, P. Gogoi and N. Lucas, et al., Novel Ru nanoparticle catalysts for the catalytic transfer hydrogenation of biomass-derived furanic compounds, Sustainable Energy Fuels, 2020, 4(7), 3654–3667 RSC.
- Y. Zhu and J. Zhang, Antimony-Based Halide Perovskite Nanoparticles as Lead-Free Photocatalysts for Controlled Radical Polymerization, Macromol. Rapid Commun., 2024, e2300695 CrossRef PubMed.
- T. Montini, M. Melchionna and M. Monai, et al., Fundamentals and catalytic applications of CeO2-based materials, J. Chem. Rev., 2016, 116, 5987–6041 CrossRef CAS PubMed.
- Y. Zhang, W. J. Zhu and L. M. Zhang, et al, Progress in the formation and characterisation of oxygen vacancies in CeO2 and its mechanism of action, J. Rare Earths res., 2022, 40, 14–23 Search PubMed.
- S. V. Eliseeva and J. C. G. Bünzli, Rare earths: jewels for functional materials of the future, New J. Chem., 2011, 35, 1165–1176 RSC.
- D. R. Mullins, P. M. Albrecht and F. Calaza, Variations in reactivity on different crystallographic orientations of cerium oxide, Top. Catal., 2013, 56, 1345–1362 CrossRef CAS.
- F. Y. Hu, J. J. Chen, Y. Peng, H. Song, K. Z. Li and J. H. Li, Novel nanowire self-assembled hierarchical CeO2 microspheres for low tem-perature toluene catalytic combustion, Chem. Eng. J., 2018, 31, 425–434 CrossRef.
- L. Torrente-Murciano, A. Gilbank and B. Puertolas, et al., Shape-dependency activity of nanostructured CeO2 in the total oxidation of polycyclic aromatic hydrocarbons, Appl. Catal., B, 2013, 132, 116–122 CrossRef.
- Y. Liao, L. He and M. Zhao, et al., Ultrasonic-assisted hydrothermal synthesis of ceria nanorods and their catalytic properties for toluene oxidation, J. Environ. Chem. Eng., 2017, 5(5), 5054–5060 CrossRef CAS.
- G. Chen, Q. Xu and Y. Wang, et al, Solubility product difference-guided synthesis of Co3O4-CeO2 core–shell catalysts for CO oxidation, Catal. Sci. Technol., 2016, 6, 7273–7279 CAS.
- Y. Liao, L. He and C. Man, et al, Diameter-dependent catalytic activity of ceria nanorods with various aspect ratios for toluene oxidation, Chem. Eng. J., 2014, 256, 439–447 CrossRef CAS.
- H. X. Mai, L. D. Sun and Y. W. Zhang, et al, Shape-selective synthesis and oxygen storage behavior of ceria nanopolyhedra, nanorods, and nanocubes, J. Phys. Chem. B, 2005, 109(51), 24380–24385 CrossRef CAS PubMed.
- S. Song, X. Wang and H. Zhang, CeO2-encapsulated noble metal nanocatalysts: enhanced activity and stability for catalytic application, NPG Asia Mater., 2015, 7, 177–179 CrossRef.
- Y. Lykhach, T. Skála and A. Neitzel, et al, Nanostructure of Cerium based Model Catalysts: Pt Co Nanoparticles on Ordered CeO2 (111) Thin Films, Chin. J. Catal., 2020, 41, 990–1002 Search PubMed.
- J. T. Xu, Q. L. Liu and P. Yang, et al, Research progress of rare earth cerium based materials in catalytic elimination of motor vehicle exhaust, Environ. Chem., 2023, 42, 2003–2017 CAS.
- J. M. López, A. L. Gilbank and T. García, et al, The prevalence of surface oxygen vacancies over the mobility of bulk oxygen in nanostructured ceria for the total toluene oxidation, Appl. Catal., B, 2015, 174, 403–412 CrossRef.
- W. Wang, Q. Zhu and Q. Dai, et al, Fe doped CeO2 nanosheets for catalytic oxidation of 1,2-dichloroethane: Effect of preparation method, Chem. Eng. J., 2017, 307, 1037–1046 CrossRef CAS.
- J. Jones, H. Xiong and A. T. DeLaRiva, et al, Thermally stable single-atom platinum-on-ceria catalysts via atom trapping, Science, 2016, 353, 150–154 CrossRef CAS PubMed.
- A. H. Tamboli, N. Suzuki and C. Terashima, et al., Direct Dimethyl Carbonates Synthesis over CeO2 and Evaluation of Catalyst Morphology Role in Catalytic Performance, J. Catal., 2021, 11(2), 223 CAS.
- G. Chen, F. Rosei and D. Ma, Template engaged synthesis of hollow ceria-based composites, Nanoscale, 2015, 7, 5578–5591 RSC.
- D. Valechha, S. Lokhande and M. Klementova, et al, Study of nano-structured ceria for catalytic CO oxidation, J. Mater. Chem., 2011, 21, 3718–3725 RSC.
- L. M. Guo, Z. Y. Zhou and W. Deng, et al, Research progress on cobalt oxide based catalysts for catalytic combustion of CVOCs, J. Huazhong Univ. Sci. Technol. (Nat. Sci. Ed.), 2022, 50, 26–37 Search PubMed.
- W. Sun, B. Gong and J. Pan, et al, Catalyticcombustion of CVOCs over CrxTi1−x oxide catalysts, J. Catal., 2020, 391, 132–144 CrossRef CAS.
- A. Singhania, High Surface Area M (M= La, Pr, Nd, and Pm)-Doped Ceria Nanoparticles: Synthesis, Characterization, and Activity Comparison for CO Oxidation, Ind. Eng. Chem. Res., 2017, 56, 13594–13601 CrossRef CAS.
- H. N. Zhao, J. Wang and W. Q. Xu, et al, Research progress in the catalytic oxidation of volatile organic compounds (VOCs) by manganese oxides, Environ. Eng., 2019, 37, 157–167 Search PubMed.
- J. S. Elias, M. Risch and L. Giordano, et al, Structure, bonding, and catalytic activity of monodisperse, transition-metal-substituted CeO2 nanoparticles, J. Am. Chem. Soc., 2014, 136, 17193–17200 CrossRef CAS PubMed.
- D. Zhang, X. Du and L. Shi, et al, Shape-controlled synthesis and catalytic application of ceria Nanomaterials, Dalton Trans., 2012, 41, 14455–14475 RSC.
- J. L. Wang, M. Q. Mao and X. F. Shi, et al, Enhancement of Pt particle loading on CeO2 ozone catalyzed oxidation of toluene, J. Environ. Sci., 2020, 40, 1629–1639 CAS.
- L. Han, W. Lu and L. Yuxi, et al, Synergistic removal of NO and chlorinated organics on CeO2-based catalysts, Environ. Funct. Mater., 2023, 2, 57–65 Search PubMed.
- W. X. Tang and P. X. Gao, Nanostructured cerium oxide: preparation, characterization, and application in energy and environmental catalysis, MRS Commun., 2016, 6, 311–329 CrossRef CAS.
- S. Yijun, G. Xiaolin and S. Zhinan, et al, Transition metal doping effect and high catalytic activity of CeO2-TiO2 for chlorinated VOCs degradation, J. Rare Earths, 2022, 40, 745–752 CrossRef.
- Y. Wei, J. Jiao and X. Zhang, et al, Catalysts of self-assembled Pt@CeO2-δ core-shell nanoparticles on 3D ordered macroporous Ce1−xZrxO2 for soot oxidation: nanostructure-dependent catalytic activity, Nanoscale, 2017, 9, 4558–4571 RSC.
- Z. Hu, X. Liu and D. Meng, et al, Effect of ceria crystal plane on the physicochemical and catalytic properties of Pd/ceria for CO and propane oxidation, ACS Catal., 2016, 6, 2265–2279 CrossRef CAS.
- P. W. Lu, Z. P. Liu and G. LiD, et al, Treatment of intermittent VOCs in pharmaceutical companies by multi-effect heat recovery catalytic combustion process and its application, J. Environ. Eng., 2023, 17, 1274–1282 Search PubMed.
- Q. Dai, L. L. Yin and S. Bai, et al, Catalytic total oxidation of 1,2-dichloroethane over VOx/CeO2 catalysts: Further insights via isotopic tracer techniques, J. Environ. Eng., 2016, 182, 598–610 CAS.
- Y. Liao, M. Fu and L. Chen, et al, Catalytic oxidation of toluene over nanorod-structured Mn–Ce mixed oxides, Catal. Today, 2013, 216, 220–228 CrossRef CAS.
- J. A. Rodriguez, D. C. Grinter and Z. Liu, et al, Ceria-based model catalysts: fundamental studies on the importance of the metal–ceria interface in CO oxidation, the water–gas shift, CO2 hydrogenation, and methane and alcohol reforming, Chem. Soc. Rev., 2017, 46, 1824–1841 RSC.
- X. Zhang, Z. Pei, H. Lu and H. Huang, Morphology-Dependent Properties of CeO2 Nano-Catalysts on CH2Cl2 Oxidation, RSC Adv., 2016, 6, 84209–84215 RSC.
- G. Chen, Q. Xu and Y. Wang, et al, Solubility product difference-guided synthesis of Co3O4-CeO2 core-shell catalysts for CO oxidation, Catal. Sci. Technol., 2016, 6, 7273–7279 RSC.
- G. Chen, F. Rosei and D. Ma, Interfacial Reaction-Directed Synthesis of Ce-Mn Binary Oxide Nanotubes and Their Applications in CO Oxidation and Water Treatment, Adv. Funct. Mater., 2012, 22, 3914–3920 CrossRef CAS.
- M. Molinari, S. C. Parker and D. C. Sayle, et al, Water adsorption and its effect on the stability of low index stoichiometric and reduced surfaces of ceria, J. Phys. Chem. C, 2012, 116, 7073–7082 CrossRef CAS.
- H. Arandiyan, H. Dai and K. Ji, et al, Pt nanoparticles embedded in colloidal crystal template derived 3D ordered macroporous Ce0.6Zr0.3Y0.1O2: highly efficient catalysts for methane combustion, ACS Catal., 2015, 5, 1781–1793 CrossRef CAS.
- B. Munisha, B. Mishra and J. Nanda, et al, Enhanced photocatalytic degradation of 4-nitrophenol using polyacrylamide assisted Ce-doped YMnO3 nanoparticles, J. Rare Earths, 2023, 41, 1541–1550 CrossRef CAS.
- C. Chen, X. Fan and C. Zhou, et al., Hydrogen production from ammonia decomposition over Ni/CeO2 catalyst: Effect of CeO2 morphology, J. Rare Earths, 2023, 41, 1014–1021 CrossRef CAS.
| This journal is © The Royal Society of Chemistry 2024 |


