 Open Access Article
Synthesis and study of antibiofilm and antivirulence properties of flavonol analogues generated by palladium catalyzed ligand free Suzuki–Miyaura coupling against Pseudomonas aeruginosa PAO1†
Anjitha Theres Bennya,
Masthan Thamima,
Prakhar Srivastavab,
Sindoora Suresha,
Krishnan Thirumoorthya,
Loganathan Rangasamy c,
Karthikeyan S.d,
Nalini Easwaran*e and
Ethiraj Kannatt Radhakrishnan
 *a
*a
aDepartment of Chemistry, School of Advanced Sciences, Vellore Institute of Technology, Vellore-632014, India. E-mail: ethukr@gmail.com
bDepartment of Pharmacy, The Ohio State University, USA
cCentre for Biomaterials, Cellular and Molecular Theranostics (CBCMT), Vellore Institute of Technology, Vellore-632014, India
dDepartment of Biotechnology, School of Bioscience and Technology, Vellore Institute of Technology, Vellore-632014, India
eDepartment of Integrative Biology, School of Bioscience and Technology, Vellore Institute of Technology VIT, Vellore-632014, India
First published on 16th April 2024
Abstract
The Suzuki–Miyaura coupling is one of the ubiquitous method for the carbon–carbon bond-forming reactions in organic chemistry. Its popularity is due to its ability to undergo extensive coupling reactions to generate a broad range of biaryl motifs in a straightforward manner displaying a high level of functional group tolerance. A convenient and efficient synthetic route to arylate different substituted flavonols through the Suzuki–Miyaura cross-coupling reaction has been explained in this study. The arylated products were acquired by the coupling of a variety of aryl boronic acids with flavonols under Pd(OAc)2 catalyzed reaction conditions in a ligand-free reaction strategy. Subsequently, the antibiofilm and antivirulence properties of the arylated flavonols against Pseudomonas aeruginosa PAO1 were studied thoroughly. The best ligands for quorum sensing proteins LasR, RhlR, and PqsR were identified using molecular docking study. These best fitting ligands were then studied for their impact on gene expression level of P. aeruginosa by RT-PCR towards quorum sensing genes lasB, rhlA, and pqsE. The downregulation in the gene expression with the effect of synthesized flavonols endorse the antibiofilm efficiency of the compounds.
Introduction
Transition metal-catalyzed reactions are well established as a powerful synthetic tool in the generation of a carbon–carbon or carbon–heteroatom bond.1–3 This methodology allows the synthetic chemist great access to more functional and complex molecules. The Suzuki–Miyaura cross-coupling acts as one of the best useful methods for the generation of new carbon–carbon (C sp2–C sp2) bonds. The best achievement of Suzuki–Miyaura coupling is the stability and low toxicity of organoboron reagents. Additionally, organoboron compounds offer a high selectivity in the cross-coupling reactions substantiating that the Suzuki–Miyaura reaction is good enough for the synthesis of medicinally important new pharmacophores.4–12Flavonols I are closed-chain flavonoid subclass most commonly included in our diet. They are generally accepted as exceptional pharmacophores in many biological applications including anticancer,13 antioxidant,14 cardioprotective,15 anti-inflammatory,16,17 hepatoprotective,18 antibacterial,19 and antiviral activities.20 The additional biological properties exhibited by the flavonols with aryl groups on either A or B ring of the parent flavonol structure generated through Suzuki–Miyaura coupling are the crux of concern in the current study. Among the various biological activities of flavonol the antibiofilm activity is less explored and perhaps best to study due to their significant antibacterial activity. Taking into consideration on the reports of antibiofilm potential of flavonols, a very few flavonols are identified as antibiofilm efficient compounds. Myricetin II (ref. 21–25) quercetin III,26,27 morin IV,28 kaempferol V (ref. 26 and 27) and isorhamnetin VII (ref. 29) are the most studied flavonols with antibiofilm and antivirulence activities (Fig. 1).
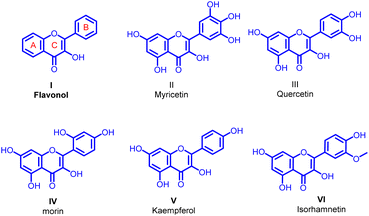 | ||
| Fig. 1 The general structure of flavonol and reported flavonols with antibiofilm and antivirulence activities. | ||
Biofilm is a stable and complex system with different bacterial colonies or a single type of bacterial group aggregates together in an extracellular polymeric matrix. It can acts as a substantial obstacle to the successful treatment of infectious diseases.30 They are enclosed in extracellular matrix made up of eDNA, proteins, and polysaccharides that is both protective and impermeable to supplied antibiotics.31 The physical permeability barrier of the biofilm resists the antibiotics and host immune responses, which makes the antibiotic drugs take a much longer duration to reach their target making the infection more severe.32 This is the main cause of the development of multidrug-resistant pathogens in the infection site. Biofilm-associated bacteria are particularly difficult to eradicate as they are potent to both host immune responses and common antibiotics. In fact, compared to planktonic bacteria, biofilm removal frequently necessitates treatment with antibiotic doses that are roughly 10–1000 times higher.33 Quorum sensing (QS) is the process through which bacterial colonies communicate via chemical signals, playing a critical role in the development and maturation of biofilms.34 Therefore, drugs that can disrupt quorum sensing signals hold promise in inhibiting bacterial biofilm development.
Among different biofilm forming bacteria Pseudomonas aeruginosa PAO1 is a highly infective pathogenic Gram negative bacteria with high metabolic versatility which will colonize on biotic and abiotic surfaces forming a biofilm.35 It is an opportunistic bacteria which can cause healthcare infections, such as ventilator-associated pneumonia (VAP), infections in intensive care units, infections at surgical sites, urinary tract infections, burn wound infections, otitis media and keratitis.36,37 In the case of P. aeruginosa the mutants which lack an active QS system are mostly avirulent and incapable of developing into full biofilms.38 Hence drugs capable of distracting the QS circuits can acts as good biofilm inhibitors. The QS systems of P. aeruginosa includes las, rhl and quinolone-based pqs as the most studied systems.39
Effective biofilm modulators are still significantly underdeveloped, despite advances in the evaluation of antibacterial efficacy. As a result, we herein describe the generation of a few unreported biaryl flavonols obtained by Suzuki–Miyaura coupling and the evaluation of their anti-biofilm efficiency against P. aeruginosa PAO1. We put forward the synthesis, in vitro testing, and molecular docking analysis of flavonols against biofilm forming P. aeruginosa PAO1. All the synthesized compounds were characterized using various spectroscopic techniques, and utilized for in vitro and molecular docking studies. The plausible mechanism of biofilm inhibition was screened by gene expression study of quorum sensing regulated genes rhlA, lasB and pqsE by real time polymerase chain reaction.
Result and discussion
Synthesis of Suzuki-coupled flavonols
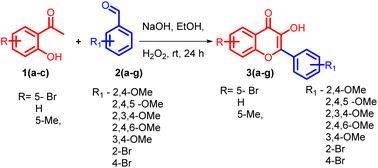
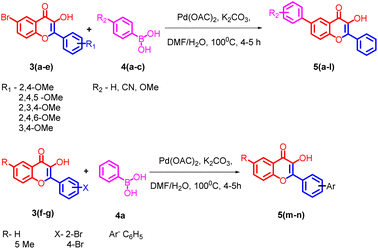
5-bromo-2-hydroxyacetophenone 1a, 2-hydroxyacetophenone 1b, 5-methyl-2-hydroxyacetophenone 1c and different substituted benzaldehydes 2(a–g) were used for the synthesis of flavonols 3(a–g). The flavonols were synthesized by the reported Algar–Flynn–Oyamada AFO mechanism with sodium hydroxide as the base and hydrogen peroxide as the oxidizing agent in ethanol–water system40,41 as depicted in Scheme 1. The reaction proceeded in a one-pot synthetic protocol with chalcone as the intermediate.The flavonols synthesized were further utilized for the synthesis of biaryl compounds by a ligand-free palladium-catalyzed Suzuki coupling reaction using previous reports.42 As depicted in Scheme 2 flavonols 3(a–g) reacts with 1 equiv. of substituted arylboronic acids 4(a–c) with palladium acetate as catalyst to obtain biaryl flavonols 5(a–n). It was further found that the highest yield of 85% was obtained for the generation of biaryl flavonol 5j (Scheme 3) when the reaction proceeded with K2CO3 as the base with 1![[thin space (1/6-em)]](https://www.rsc.org/images/entities/char_2009.gif) :
:![[thin space (1/6-em)]](https://www.rsc.org/images/entities/char_2009.gif) 1 mixture of water DMF as solvent system at 100 °C for 4 h (entry 1, Table 1) and this condition was selected as the optimum condition for the reaction. Other parameters such as reaction time solvent systems with various bases were tried during the optimizations.
1 mixture of water DMF as solvent system at 100 °C for 4 h (entry 1, Table 1) and this condition was selected as the optimum condition for the reaction. Other parameters such as reaction time solvent systems with various bases were tried during the optimizations.
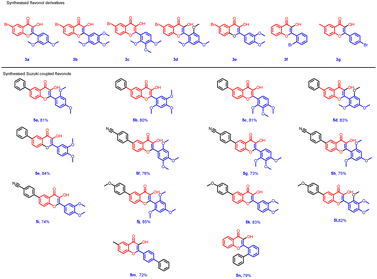
Based on the preliminary results, under optimized conditions, the scope of the reaction was explored by synthesising a series of Suzuki coupled products 5(a–n) from the respective flavonols 3(a–g) in good yield. All the compounds synthesised were characterized by spectroscopic methods such as FTIR, 1H NMR, 13C NMR, and HRMS, and the spectral data are provided in ESI Fig. S1–84† The compounds 5f and 5j were characterized by single crystal XRD and the ORTEP diagram for the compounds are depicted in Fig. 2 and 3. The structures of synthesized flavonols 3(a–d) and Suzuki coupled products 5(a–n) are represented in Fig. 4.
 | ||
| Fig. 2 ORTEP diagram of compound 5f (CCDC no. 2054733).† | ||
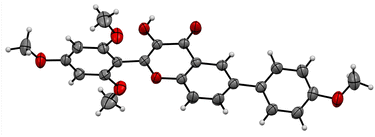 | ||
| Fig. 3 ORTEP diagram of compound 5j (CCDC no. 2122702).† | ||
Determination of minimum inhibitory concentration (MIC)
Table 2 represents the MIC values of all the tested compounds against the bacterial strain. Compounds 5j, 5l and 5f, 5h show the least minimum inhibitory concentration of 35.9 μM and 36.3 μM against the tested bacterial strain. Gentamicin which was used as the positive control in the experiment shows a minimum inhibitory concentration of 16.3 μM. In detail, the majority of the tested compounds exhibited MIC values below 200 μM. All the further studies including biofilm formation assay and the virulence factor testing were done with the ¼ MIC dose of the compounds.| Flavonols | Minimum inhibitory concentration (μM) |
|---|---|
| 5a | 165.6 |
| 5b | 154.5 |
| 5c | 154.5 |
| 5d | 154.5 |
| 5e | 165.6 |
| 5f | 36.3 |
| 5g | 145.5 |
| 5h | 36.3 |
| 5i | 156.4 |
| 5j | 35.9 |
| 5k | 77.2 |
| 5l | 35.9 |
| 5m | 190.3 |
| 5n | 198.8 |
| Gentamicin | 16.3 |
Evaluation of the growth curve
The growth curve of the test microbe at varying concentrations including 1/2 MIC, 1/4 MIC, 1/8 MIC of all the compounds 5(a–n) was noted in equal intervals for 24 hours. The results for all the compounds are provided in ESI Fig. S85.† The growth curve shows that the compounds did not hamper the normal growth kinetics of the test bacteria with an initial lag phase, subsequent exponential phase and final stationary phase when compared with the untreated control. Hence, the sub-MIC level of the compounds 5(a–n) was found safe for further assays and we selected ¼ MIC dose for all the following experiments.Prevention of biofilm formation by compounds 5(a–n)
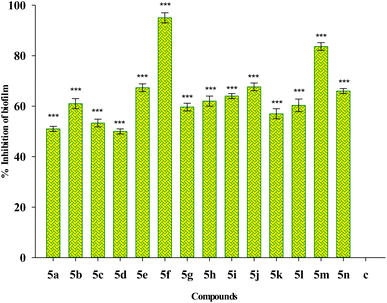
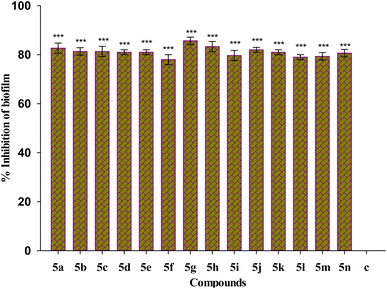
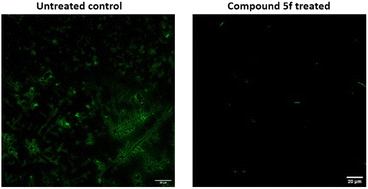
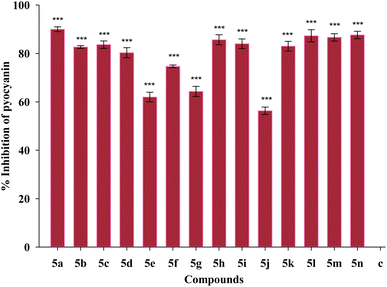
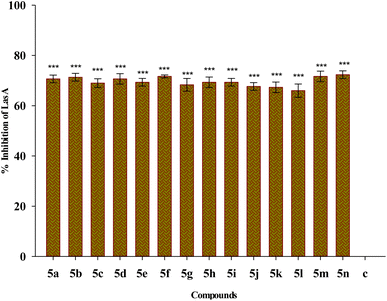
Fig. 5 depicts the impact of sub-MIC levels of compounds 5(a–n) on inhibiting the formation of biofilm by P. aeruginosa, a potent biofilm producer. The results of the biofilm prevention test suggest that the sub-MIC dose of test compounds considerably reduces the ability of tested bacteria to produce biofilms. Greater biofilm formation in drug-untreated wells was noticed with a higher absorbance associated with the drug-untreated microorganisms. However, the relatively lower absorbance in the wells treated with a sub-MIC dose of test compounds demonstrates a decrease in the production of biofilm. Compound 5f shows the highest percentage inhibition of 95% among the studied compounds, followed by compound 5m with a percentage inhibition of 80%. The percentage inhibition of biofilm in other sub MIC concentrations including 1/2 MIC and 1/8 MIC are also included in the ESI Table S1.† The result shows that the higher concentration of the compounds shows a higher percentage reduction in biofilm.Eradication of preformed biofilm
Biofilm eradication efficiency of Suzuki coupled compounds 5(a–n) in their sub-MIC doses on preformed biofilm was investigated. All the tested compounds show eradication of the preformed biofilm biomass as represented in Fig. 6. The compound 5g shows the maximum percentage inhibition of 86%. All the tested compounds show biofilm eradication above 76%.Analysis of biofilm architecture
Screening of antibiofilm activity of the compounds
| Compound | IC50 at 24 h (μM) | IC50 at 48 h (μM) |
|---|---|---|
| 5f | >100 μM | >100 μM |
| Cisplatin | >50 μM | >50 μM |
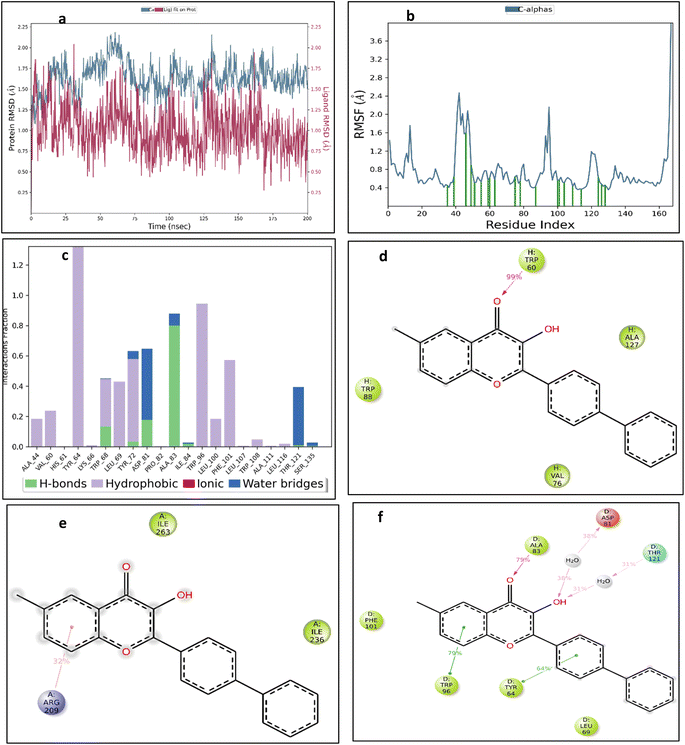
To further understand the conformational change, we studied the RMSF to evaluate the protein residue fluctuation and the RMSF plot of 2UV0 protein with binding site is depicted in Fig. 15b.The RMSF plots of other proteins are included in ESI Fig. S86(c and d).† It was noted that structural alterations to the binding site had an impact on the RMSD of the 4JVI-5m and 8DQ0-5m complexes. Since the important factor for producing activity and structural stability is the interaction between protein and ligand, we have assessed the bonded interaction of the complexes. The protein ligand interaction of the complex 8DQ0-5m is represented in the histogram Fig. 15c and the protein ligand interactions of other complexes are included in ESI Fig. S87(a and b).† Among all the three complexes, 8DQ0-5m was more stable. It has hydrophobic interaction with TYR64 and TRP96, hydrogen bonding with ALA83, and water-mediated hydrogen bonding with ASP81, and THR121. We observed that the 2UV0-5m and 4JVI-5m complexes were having TRP60 and ARG209 respectively as maintained interaction throughout the 200 ns simulation.
| Frame | ΔG coulomb | ΔG covalent | ΔG H-bond | ΔG lipo | ΔG packing | ΔG Solv_GB | ΔG vdW | ΔG bind | |
|---|---|---|---|---|---|---|---|---|---|
| 8DQ0-5m | 0 ns | −5.82 | 4.62 | −1.50 | −36.51 | −9.29 | 17.35 | −50.74 | −81.91 |
| 8DQ0-5m | 20 ns | −20.18 | 6.94 | −2.44 | −37.28 | −9.00 | 20.26 | −54.18 | −95.90 |
| 8DQ0-5m | 40 ns | −13.73 | 5.91 | −2.46 | −34.62 | −10.98 | 20.15 | −61.61 | −97.35 |
| 8DQ0-5m | 60 ns | −14.06 | 6.62 | −2.21 | −34.73 | −9.84 | 13.15 | −59.03 | −100.12 |
| 8DQ0-5m | 80 ns | −35.39 | 6.65 | −1.55 | −37.34 | −11.80 | 24.78 | −53.93 | −108.60 |
| 8DQ0-5m | 100 ns | −24.54 | 3.55 | −2.80 | −31.80 | −13.25 | 22.19 | −51.80 | −98.47 |
| 8DQ0-5m | 120 ns | −27.80 | 3.19 | −1.71 | −34.25 | −14.46 | 24.59 | −54.84 | −105.29 |
| 8DQ0-5m | 140 ns | −39.59 | 10.64 | −1.54 | −35.76 | −13.19 | 30.67 | −55.81 | −104.58 |
| 8DQ0-5m | 160 ns | −18.34 | 5.34 | −1.17 | −37.23 | −15.03 | 21.31 | −58.42 | −103.56 |
| 8DQ0-5m | 180 ns | −14.41 | 5.99 | −1.43 | −36.45 | −13.58 | 15.51 | −62.39 | −106.77 |
| 8DQ0-5m | 200 ns | −27.49 | 6.07 | −1.08 | −36.76 | −11.65 | 26.45 | −58.32 | −102.79 |
The molecular docking analysis failed to demonstrate any pose between 5f and the receptor proteins 2UV0 and 4JVI in the in silico tests, which is in contrast to the in vitro results where 5f shown the best antibiofilm action. The compound 5m which shows 80% inhibition in the biofilm formation was showing interesting results in the molecular docking and molecular dynamic studies. Even though the molecular docking results give a more negative binding affinity for the interaction of 5m with 2UV0, the molecular dynamic study shows the 5m-8DQ0 complex as more stable. It can possibly due to the more stable and strong interactions between the ligand and protein. Similarly the effect of compound 5m on gene expression of the P. aeruginosa also supports the molecular dynamic results with a very high downregulation of rhlA gene.
Materials and methods
General
All the reactions were carried out in oven-dried glasswares. 2-Hydroxyacetophenones, substituted benzaldehydes, palladium acetate, and substituted boronic acids were purchased from Sigma Aldrich and used as received. Progress of reactions was monitored by the silica gel Thin Layer Chromatography (TLC) technique. Purification of crude compounds was done by column chromatography using silica gel (mesh size 100–200). The NMR spectra were recorded on Bruker-400 MHz NMR spectrometer (400 MHz for 1H NMR and 100 MHz for 13C NMR) with CDCl3 as the solvent and TMS as an internal reference. Integrals are in accordance with assignments; coupling constants (J) were reported in Hertz (Hz). All 13C spectra are proton-decoupled. Multiplicity is indicated as follows: s (singlet), d (doublet), t (triplet), q (quartet), m (multiplet), dd (doublet of doublet), br s (broad singlet). HRMS analyses were recorded using high-resolution mass spectrometer. Yields refer to quantities obtained after chromatography. All the commercial solvents were purified before use.6-Bromo-2-(2,4-dimethoxyphenyl)-3-hydroxy-4H-chromen-4-one (3a). Yellow solid; yield: 90%; FTIR (KBr) νmax: 3446, 1573, 1496, 1278, 1107, 927, 790 cm−1; 1H NMR (400 MHz, CDCl3/TMS): δ 8.39 (d, J = 2.4 Hz, 1H), 7.73 (dd, J = 11.2 Hz, 1H), 7.52 (d, J = 8.4 Hz, 1H), 7.40 (d, J = 8.8 Hz, 1H), 6.64 (dd, J = 10.4 Hz, 1H), 6.59 (d, J = 2 Hz, 1H), 6.35 (s, 1H), 3.87 (s, 3H), 3.85 (s, 3H); 13C NMR (100 MHz, CDCl3/TMS): 172.1, 163.2, 158.9, 154.7, 146.8, 138.9, 136.2, 132.5, 128.0, 122.8, 120.5, 117.7, 112.1, 105.2, 99.3, 56.0, 55.7; HRMS: C17H13BrO5 m/z [M + H]+: calculated: 377.0024, found: 377.0046.
6-Bromo-3-hydroxy-2-(2,4,5-trimethoxyphenyl)-4H-chromen-4-one (3b). Yellow solid; yield: 85%; FTIR (KBr) νmax: 3294, 2937, 1600, 1570, 1209, 1161, 1107, 813, 721, 680 cm−1; 1H NMR (400 MHz, CDCl3/TMS): 8.39 (s, 1H), 7.72 (d, J = 8.8 Hz, 1H), 7.40 (d, J = 7.6 Hz, 1H), 7.10 (s, 1H), 6.64 (s, 1H), 6.52 (s, 1H), 6.45 (s, 1H), 3.96 (s, 3H), 3.87 (s, 6H); 13C NMR (100 MHz, CDCl3/TMS): 170.9, 153.5, 151.5, 151.1, 145.3, 142.2, 137.7, 135.1, 126.9, 121.7, 119.3, 116.5, 112.2, 109.5, 96.9, 55.9, 55.5, 55.1; HRMS: C18H15BrO6 m/z [M + H]+: calculated: 407.013, found: 407.0128.
6-Bromo-3-hydroxy-2-(2,3,4-trimethoxyphenyl)-4H-chromen-4-one (3c). Yellow solid; yield: 88%; FTIR (KBr) νmax: 3363, 2937, 1591, 1440, 1400, 1282, 1097, 864, 794 cm−1; 1H NMR (400 MHz, CDCl3/TMS): δ 8.40 (s, 1H), 7.75 (d, J = 8.6 Hz, 1H), 7.41 (d, J = 9.2 Hz, 1H), 7.35 (d, J = 8.8 Hz, 1H), 6.82 (d, J = 8.4 Hz, 1H), 6.68 (d, J = 8.4 Hz, 1H), 3.96 (s, 3H), 3.93 (s, 3H), 3.91 (s, 1H); 13C NMR (100 MHz, CDCl3/TMS): 152.3, 146.2, 136.2, 128.0, 125.6, 122.7, 120.2, 107.3, 61.6, 60.9, 56.1, 29.7; HRMS: C18H15BrO6 m/z [M + H]+: calculated: 407.0130, found: 407.0130.
6-Bromo-3-hydroxy-2-(2,4,6-trimethoxyphenyl)-4H-chromen-4-one (3d). Yellow solid; yield: 89%; FTIR (KBr) νmax: 3269, 2933, 1598, 1583, 1452, 1203, 1114, 815, 661 cm−1; 1H NMR (400 MHz, CDCl3/TMS): δ 8.40 (s, 1H), 7.724 (d, J12 = 2.4 Hz, J14 = 9.2 Hz, 1H), 7.40 (d, J = 9.2 Hz, 1H), 6.22 (s, 2H), 6.15 (s, 1H), 3.95 (s, 3H), 3.87 (s, 3H), 3.78 (s, 3H); 13C NMR (100 MHz, CDCl3/TMS): 172.0, 163.8, 159.6, 155.1, 144.3, 140.2, 135.9, 127.8, 122.9, 120.6, 117.3, 90.8, 56.0, 55.5; HRMS: C18H15BrO6 m/z [M + H]+: calculated: 407.0130, found: 407.0136.
6-Bromo-2-(3,4-dimethoxyphenyl)-3-hydroxy-4H-chromen-4-one (3e). Yellow solid; yield 86%; FTIR (KBr) νmax: 3271, 1587, 1471, 1220, 864, 736, 680 cm−1; 1H NMR (400 MHz, CDCl3/TMS): δ 8.39 (d, J = 2.4 Hz, 1H), 7.74 (dd, J = 2.4 Hz, 8.8 Hz, 1H), 7.53 (d, J = 8.4 Hz, 1H), 7.41 (d, J = 9.2 Hz, 1H), 6.65 (dd, J = 2 Hz, 8.4 Hz, 1H), 6.59 (d, J = 2.0 Hz, 1H), 6.39 (s, 1H), 3.88 (s, 3H), 3.85 (s, 3H); 13C NMR (100 MHz, CDCl3/TMS): 172.1, 163.2, 158.9, 154.7, 146.8, 138.9, 136.2, 132.0, 128.0, 122.8, 120.5, 117.7, 112.1, 105.2, 99.3, 56.0, 56.7; HRMS: C17H13BrO5 m/z [M + H]+: cal.:377.0024; found: 377.0017.
2-(2-bromophenyl)-3-hydroxy-4H-chromen-4-one (3f). Yellow solid; yield: 85%; FTIR (KBr) νmax: 1598, 1456, 1305, 1207, 831, 771 cm−1; 1H NMR (400 MHz, CDCl3/TMS): δ 8.26 (dd, J = 1.2 Hz, 8 Hz, 1H), 8.16 (d, J = 8.8 Hz, 2H), 7.7 (m, 1H), 7.68 (d, J = 8.8 Hz, 2H), 7.604 (d, J = 8.4 Hz, 1H), 7.45 (t, J = 7.2 Hz, 1H), 7.07 (s, 1H); 13C NMR (100 MHz, CDCl3/TMS): 155.4, 143.8, 138.5, 133.8, 131.9, 130.0, 129.2, 125.5, 124.7, 120.6, 118.2. HRMS: C15H9BrO3 m/z [M + H]+: calculated: 316.9814, found: 316.9809.
2-(4-Bromophenyl)-3-hydroxy-6-methyl-4H-chromen-4-one (3g). Yellow solid; yield: 87%; FTIR (KBr) νmax: 3072, 2927, 1579, 1558, 1421, 1271, 835, 704 cm−1; 1H NMR (400 MHz, CDCl3/TMS): δ 8.14 (d, J = 8.4 Hz, 2H), 8.01 (s, 1H), 7.66 (d, J = 8.8 Hz, 2H), 7.54 (m, 2H), 2.47 (s, 3H); 13C NMR (100 MHz, CDCl3/TMS): 173.3, 153.7, 143.6, 138.5, 135.3, 134.6, 131.8, 130.1, 129.1, 124.6, 124.5, 120.2, 118.0, 20.9; HRMS: C16H11BrO3 m/z [M + H]+: calculated: 330.9971, found: 330.9963.
![[thin space (1/6-em)]](https://www.rsc.org/images/entities/char_2009.gif) :
:![[thin space (1/6-em)]](https://www.rsc.org/images/entities/char_2009.gif) 1 DMF
1 DMF![[thin space (1/6-em)]](https://www.rsc.org/images/entities/char_2009.gif) :
:![[thin space (1/6-em)]](https://www.rsc.org/images/entities/char_2009.gif) water mixture in a sealed tube. 1 mm of K2CO3 was added to it and stirred for a few minutes at room temperature. To this 10 mol percent of Pd(OAc)2 was added and the reaction was kept for stirring at 100 °C for 5 h in a preheated oil bath. The reaction was monitored by thin-layer chromatography. After completion of the reaction, it was quenched with distilled water and separated by ethyl acetate. The crude product was purified by silica gel column chromatography to afford pure products 5(a–n). Eluent (hexane/ethyl acetate 12–15%). The products 5(a–n) obtained were characterized by spectroscopic techniques.
water mixture in a sealed tube. 1 mm of K2CO3 was added to it and stirred for a few minutes at room temperature. To this 10 mol percent of Pd(OAc)2 was added and the reaction was kept for stirring at 100 °C for 5 h in a preheated oil bath. The reaction was monitored by thin-layer chromatography. After completion of the reaction, it was quenched with distilled water and separated by ethyl acetate. The crude product was purified by silica gel column chromatography to afford pure products 5(a–n). Eluent (hexane/ethyl acetate 12–15%). The products 5(a–n) obtained were characterized by spectroscopic techniques.
2-(2,4-Dimethoxyphenyl)-3-hydroxy-6-phenyl-4H-chromen-4-one (5a). White solid; yield: 81%; FTIR (KBr) νmax: 3300, 2924, 2852, 1712, 1606, 1463, 1386, 1294, 1193, 1029, 761, 611 cm−1; 1H NMR (400 MHz, CDCl3/TMS): δ 8.47 (s, 1H), 7.92 (d, J = 8.8 Hz, 1H), 7.69 (d, J = 8 Hz, 2H), 7.59 (m, 2H), 7.50 (t, J = 7.6 Hz, 2H), 7.41 (d, J = 6.4 Hz, 1H), 6.66 (d, J = 8.4 Hz, 1H), 6.60 (s, 1H), 6.44 (s, 1H), 3.89 (s, 3H), 3.87 (s, 1H); 13C NMR (100 MHz, CDCl3/TMS): 162.9, 158.8, 155.3, 146.2, 139.4, 138.7, 137.4, 132.2, 131.9, 129.0, 127.8, 127.2, 123.1, 121.5, 118.9, 105.0, 99.2, 55.9, 55.5; HRMS: C23H18O5 m/z [M + H]+: calculated: 375.1232, found: 375.1254.
3-Hydroxy-6-phenyl-2-(2,4,5-trimethoxyphenyl)-4H-chromen-4-one (5b). White solid; yield: 80%; FTIR (KBr) νmax: 3271, 2931, 2845, 1734, 1600, 1562, 1467, 1438, 1379, 1201, 1163, 1026, 827, 759, 694, 603 cm−1; 1H NMR (400 MHz, CDCl3/TMS): δ 8.49 (d, J = 2.4 Hz, 1H), 7.94 (d, J12 = 2.4 Hz, J14 = 8.8 Hz, 1H), 7.70 (d, J = 7.2 Hz, 2H), 7.61 (d, J = 8.8 Hz, 1H), 7.50 (t, J = 7.6 Hz, 2H), 7.41 (t, J = 7.6 Hz, 1H), 7.14 (s, 1H), 6.67 (s, 1H), 6.51 (s, 1H), 3.97 (s, 3H), 3.90 (s, 3H), 3.89 (s, 3H); 13C NMR (100 MHz, CDCl3/TMS): 173.1, 152.5, 152.0, 143.2, 138.3, 137.5, 132.3, 129.0, 127.8, 127.2, 123.2, 118.9, 113.3, 110.9, 98.0, 57.1, 56.6, 56.1; HRMS: C24H20O6 m/z [M + H]+: calculated: 405.1338, found: 405.1365.
3-Hydroxy-6-phenyl-2-(2,3,4-trimethoxyphenyl)-4H-chromen-4-one (5c). White solid; yield: 81%; FTIR (KBr) νmax: 3230, 2918, 2848, 1703, 1602, 1566, 1462, 1392, 1263, 1170, 1105, 840, 808, 763, 692 cm−1; 1H NMR (400 MHz, CDCl3/TMS): δ 8.49 (d, J = 2.4 Hz, 1H), 7.94 (d, J = 2.4 Hz, 8.8 Hz, 1H), 7.70 (d, J = 8.9 Hz, 2H), 7.60 (d, J = 8.8 Hz, 1H), 7.50 (t, J = 7.2 Hz, 2H), 7.41 (t, J = 8 Hz, 2H), 6.84 (d, J = 8.8 Hz, 1H), 6.59 (s, 1H), 4.00 (s, 3H), 3.94 (s, 3H); 13C NMR (100 MHz, CDCl3/TMS): 173.4, 155.9, 155.4, 152.5, 146.0, 142.7, 139.4, 138.8, 137.7, 132.5, 129.1, 128.1, 128.1, 128.0, 127.3, 125.7, 123.3, 121.6, 119.0, 117.5, 107.5, 61.7, 61.0, 56.3; HRMS: C24H20O6 m/z [M + H]+: calculated: 405.1338, found: 405.1363.
3-Hydroxy-6-phenyl-2-(2,4,6-trimethoxyphenyl)-4H-chromen-4-one (5d). White solid; yield: 83%; FTIR (KBr) νmax: 3273, 2918, 2848, 1724, 1631, 1604, 1581, 1467, 1294, 1224, 1201, 1109, 1035, 948, 806, 759, 690 cm−1; 1H NMR (400 MHz, CDCl3/TMS): δ 8.493 (d, J = 2.4 Hz, 1H), 7.914 (d, J = 2.4 Hz, 8.8 Hz, 1H), 7.69 (d, J = 8.8 Hz, 2H), 7.59 (d, J = 8.8 Hz, 1H), 7.50 (t, J = 7.6 Hz, 2H), 7.41 (d, J = 7.2 Hz, 1H), 6.32 (s, 1H), 6.23 (s, 2H), 3.88 (s, 3H), 3.80 (s, 3H); 13C NMR (100 MHz, CDCl3/TMS): 173.4, 163.8, 159.8, 156.0, 144.0, 140.2, 139.1, 137.4, 132.1, 129.1, 127.8, 127.3, 123.3, 121.8, 119.3, 91.0, 56.2, 55.6; HRMS: C24H20O6 m/z [M + H]+: calculated:. 405.1338, found: 405.1361.
2-(3,4-Dimethoxyphenyl)-3-hydroxy-6-phenyl-4H-chromen-4-one (5e). White solid; yield: 84%; FTIR (KBr) νmax: 3153, 2926, 2868, 1714, 1598, 1554, 1514, 1436, 1384, 1261, 1022, 765, 698 cm−1; 1H NMR (400 MHz, CDCl3/TMS): δ 8.45 (d, J = 1.6 Hz, 1H), 7.95 (t, J = 8 Hz, 2H), 7.88 (s, 1H), 7.70 (m, 3H), 7.51 (t, J = 7.6 Hz, 2H), 7.42 (d, J = 8 Hz, 1H), 7.04 (d, J = 8.4 Hz, 2H), 4.01 (s, 3H), 3.98 (s, 3H); 13C NMR (100 MHz, CDCl3/TMS): 173.1, 154.6, 150.8, 148.8, 145.2, 139.2, 137.7, 132.4, 129.0, 127.9, 127.2, 123.1, 121.5, 120.8, 118.7, 110.9, 110.7, 56.0, 56.0; HRMS: C23H18O5 m/z [M + H]+: calculated: 375.1232, found: 375.1255.
4-(3-Hydroxy-4-oxo-2-(2,4,5-trimethoxyphenyl)-4H-chromen-6-yl)benzonitrile (5f). White solid; yield: 76%; FTIR (KBr) νmax: 3305, 2922, 2852, 2223, 1722, 1602, 1568, 1514, 1460, 1415, 1261, 1209, 1159, 1020, 819, 786, 644 cm−1; 1H NMR (400 MHz, CDCl3/TMS): δ 8.51 (d, J = 2.4 Hz, 1H), 7.92 (dd, J = 2 Hz, 8.8 Hz, 1H) 7.78 (s, 4H), 7.65 (d, J = 8.8 Hz, 1H), 7.14 (s, 1H), 6.67 (s, 1H), 6.49 (s, 1H), 3.98 (s, 3H), 3.90 (s, 6H); 13C NMR (100 MHz, CDCl3/TMS): 156.0, 152.7, 143.9, 143.4, 135.5, 132.9, 132.0, 127.9, 124.1, 119.6, 113.5, 111.6, 98.1, 57.2, 56.7, 56.3; HRMS: C25H19NO6 m/z [M + H]+: calculated: 430.129, found: 430.130.
4-(3-Hydroxy-4-oxo-2-(2,3,4-trimethoxyphenyl)-4H-chromen-6-yl)benzonitrile (5g). White solid; yield: 73%; FTIR (KBr) νmax: 3633, 3302, 2924, 2862, 2225, 1705, 1595, 1566, 1290, 1209, 1097, 819, 785 cm−1; 1H NMR (400 MHz, CDCl3/TMS): δ 7.98 (s, 1H), 7.40 (d, J = 8.8 Hz, 1H), 7.37 (s, 1H), 7.11 (s, 1H), 7.10 (s, 1H), 6.87 (d, J =, 2H), 6.73 (s, 1H), 6.48 (s, 1H), 6.32 (s, 1H), 3.47 (s, 3H), 3.42 (s, 3H), 3.40 (s, 3H); 13C NMR (100 MHz, CDCl3/TMS): 173.1, 155.9, 152.5, 143.9, 142.7, 138.9, 135.6, 132.9, 132.1, 129.6, 127.9, 125.7, 124.1, 121.8, 119.5, 117.3, 111.7, 107.5, 61.8, 61.0, 56.3; HRMS: C25H19NO6 m/z [M + H]+: calculated: 430.129, found: 430.1299.
4-(3-Hydroxy-4-oxo-2-(2,4,6-trimethoxyphenyl)-4H-chromen-6-yl)benzonitrile (5h). White solid; yield: 75%; FTIR (KBr) νmax: 3288, 2945, 2225, 1600, 1568, 1483, 1408, 1292, 1095, 815, 642 cm−1; 1H NMR (400 MHz, CDCl3/TMS): δ 8.50 (d, J = 2 Hz, 1H), 7.92 (dd, J = 2.4 Hz, J = 8.8 Hz, 1H), 7.78 (s, 4H), 7.64 (d, J = 8 Hz), 7.39 (d, J = 8.8 Hz, 1H), 6.84 (d, J = 8.8 Hz, 1 Hz), 6.59 (s, 1H), 4.00 (s, 3H), 3.95 (s, 3H), 3.93 (s, 3H); 13C NMR (100 MHz, CDCl3/TMS): 173.1, 155.9, 152.5, 143.9, 142.7, 138.9, 135.6, 132.9, 132.1, 129.6, 127.9, 125.7, 124.1, 121.8, 119.5, 117.3, 111.7, 107.5, 61.8, 61.0, 56.3; HRMS: C25H19NO6 m/z [M + H]+: calculated: 430.1291, found: 430.1296.
Characterization data of 4-(2-(3,4-dimethoxyphenyl)-3-hydroxy-4-oxo-4H-chromen-6-yl)benzonitrile (5i). White solid; yield: 74%; FTIR (KBr) νmax: 3265, 3005, 2839, 1600, 1558, 1516, 1483, 1408, 1350, 1282, 1261, 1209, 1176, 1020, 858, 756, 705, 630 cm−1; 1H NMR (400 MHz, CDCl3/TMS): δ 8.46 (s, 1H), 7.92 (m, 2H), 7.87 (s, 1H), 7.78 (s, 4H), 7.72 (d, J = 8.8 Hz, 1H), 7.05 (d, J = 8.4 Hz, 2H), 4.00 (s, 3H), 3.98 (s, 3H); 13C NMR (100 MHz, CDCl3/TMS): 172.9, 155.2, 151.0, 148.9, 145.5, 143.7, 137.9, 135.5, 132.1, 127.7, 123.8, 123.4, 121.6, 121.0, 119.2, 118.7, 111.6, 110.9, 110.7, 56.08, 56.03; HRMS: C24H17NO5 m/z [M + H]+: calculated: 400.1185, found: 400.1200.
3-Hydroxy-6-(4-methoxyphenyl)-2-(2,4,6-trimethoxyphenyl)-4H-chromen-4-one (5j). White solid; yield: 85%; FTIR (KBr) νmax: 2922, 2852, 1712, 1602, 1460, 1377, 1247, 1159, 908, 734 cm−1; 1H NMR (400 MHz, CDCl3/TMS): δ 8.43 (d, J = 2 Hz, 1H), 7.87 (dd, J = 2.4 Hz, 8.8 Hz, 1H), 7.63 (d, J = 8.4 Hz, 2H), 7.56 (d, J = 8.8 Hz, 1H), 7.02 (d, J = 8.4 Hz, 3H), 6.23 (s, 2H), 3.87 (s, 3H), 3.87 (s, 3H), 3.79 (s, 3H); 13C NMR (100 MHz, CDCl3/TMS): 173.4, 163.8, 159.8, 155.7, 144.0, 140.2, 136.1, 131.8, 128.4, 124.9, 122.5, 121.8, 119.2, 114.5, 91.0, 56.2, 55.6, 55.5; HRMS: C25H22O7 m/z [M + H]+: calculated: 435.1645, found: 435.1461.
2-(3,4-Dimethoxyphenyl)-3-hydroxy-6-(4-methoxyphenyl)-4H-chromen-4-one (5k). White solid; yield: 82%; FTIR (KBr) νmax: 3277, 3219, 3176, 2954, 2922, 2852, 1726, 1597, 1560, 1512, 1462, 1379, 1246, 1174, 804, 765, 611 cm−1; 1H NMR (400 MHz, CDCl3/TMS): δ 8.39 (d, J = 2 Hz, 1H), 7.92 (m, 2H), 7.87 (s, 1H), 7.65 (m, 3H), 7.025 (t, J = 7.2 Hz, 3H), 4.00 (s, 3H), 3.98 (s, 3H), 3.87 (s, 3H); 13C NMR (100 MHz, CDCl3/TMS): 173.3, 159.7, 154.4, 150.9, 149.4, 145.4, 137.9, 137.4, 132.3, 131.8, 128.3, 123.8, 122.4, 121.6, 120.9, 118.7, 114.60, 111.0, 110.8, 56.19, 56.13, 55.5; HRMS: C24H20O6 m/z [M + H]+: calculated: 405.1338, found: 405.1385.
3-Hydroxy-6-(4-methoxyphenyl)-2-(2,3,4-trimethoxyphenyl)-4H-chromen-4-one (5l). White solid; yield: 83%; FTIR (KBr) νmax: 3307, 2943, 2841, 1602, 1566, 1463, 1409, 1298, 1180, 941, 823, 640 cm−1; 1H NMR (400 MHz, CDCl3/TMS): δ 8.432 (d, J = 2 Hz, 1H), 7.87 (d, J = 2 Hz, J = 8.8 Hz, 1H), 7.63 (d, J = 8.8 Hz, 2H), 7.56 (d, J = 8.8 Hz, 1H), 7.02 (d, J = 8.4 Hz, 3H), 6.23 (s, 2H), 3.88 (s, 3H), 3.87 (s, 3H), 3.79 (s, 3H); 13C NMR (100 MHz, CDCl3/TMS): 173.4, 163.8, 159.8, 155.7, 144.0, 140.2, 136.1, 131.8, 128.4, 124.9, 122.5, 121.8, 119.2, 114.5, 91.0, 56.2, 55.6, 55.5; HRMS: C25H22O7 m/z [M + H]+: calculated: 435.1445, found: 435.1449.
Characterization data of 2-([1,1′-biphenyl]-4-yl)-3-hydroxy-6-methyl-4H-chromen-4-one (5m). White solid; yield: 79%; FTIR (KBr) νmax: 3234, 2918, 2848, 1703, 1604, 1566, 1487, 1454, 1392, 1261, 1170, 1105, 840, 810, 763, 688 cm−1; 1H NMR (400 MHz, CDCl3/TMS): δ 8.35 (d, J = 8 Hz, 2H), 8.038 (s, 1H), 7.77 (d, J = 8 Hz, 1H), 7.68 (d, J = 8 Hz, 2H), 7.52 (m, 4H), 7.41 (d, J = 12 Hz, 1H), 7.16 (s, 1H), 2.49 (s, 3H); 13C NMR (100 MHz, CDCl3/TMS): 173.3, 153.8, 144.7, 142.7, 140.1, 138.5, 135.1, 134.5, 130.0, 128.9, 128.1, 127.9, 127.2, 127.1, 124.5, 120.4, 118.0, 20.9; HRMS: C22H16O3 m/z [M + H]+: calculated: 329.1177, found: 329.1206.
2-([1,1′-Biphenyl]-2-yl)-3-hydroxy-4H-chromen-4-one (5n). White solid; yield: 72%; FTIR (KBr) νmax: 3078, 2922, 2852, 1708, 1597, 1552, 1473, 1436, 1249, 1193, 1114, 8.6, 758, 696 cm−1; 1H NMR (400 MHz, CDCl3/TMS): δ 8.37 (d, J = 12 Hz, 2H), 8.28 (d, J = 8 Hz, 1H), 7.79 (d, J = 8 Hz, 2H), 7.75 (t, J = 8 Hz, 1H), 7.69 (d, J = 8 Hz, 2H), 7.64 (d, J = 8 Hz, 1H), 7.51 (t, J = 8 Hz, 2H), 7.45 (m, 2H), 7.09 (s, 1H); 13C NMR (100 MHz, CDCl3/TMS): 163.9, 155.7, 134.0, 133.8, 131.2, 130.5, 130.0, 128.6, 128.3, 126.2, 125.2, 123.7, 118.5; HRMS: C21H14O3 m/z [M + H]+: calculated: 315.1021, found: 315.1031.
Preparation of test compounds
Fourteen novel compounds were tested 5(a–n). The compounds were synthesized at the Department of Chemistry, School of Advanced Sciences, Vellore Institute of Technology (VIT), Vellore, India.Determination of minimum inhibitory concentrations (MIC)
The broth dilution method described by the Clinical and Laboratory Standards Institute (CLSI) was used to determine the minimum inhibitory concentration (MIC).48 The MIC of the compounds was determined to be the lowest concentration of the Suzuki-linked compounds 5(a–n) which prevented the test bacterium Pseudomonas aeruginosa PAO1 from growing visibly. In a nutshell, 1 mg mL−1 of the compounds 5(a–n) were dissolved in DMSO. Serial dilutions were performed in sterile Luria–Bertani broth in 96 well plate for the determination of MIC value. Gentamicin was used as the positive control of the experiment due to its reported antibiofilm activity and additionally due to its efficiency towards Gram-negative bacterial inhibition. 100 μL of bacterial culture was added to 100 μL of serially diluted compounds in 96 well plates. Later the plates were incubated for 24 h at 35 °C. Each test was done in triplicates.Evaluation of the growth curve
A growth assay was performed to find the effect of ½ MIC, 1/4 MIC, and 1/8 MIC dosages of test compounds on the growth of P. aeruginosa. Overnight grown test organism was treated with different concentrations including ½ MIC, ¼ MIC, and 1/8 MIC doses of compounds 5(a–n). All the cultures including the untreated control were incubated at 37 °C and OD was noted each 2 h starting from 0 h at 600 nm.49Biofilm prevention assay
Biofilm prevention assay was done by previously reported protocol.50 P. aeruginosa bacterial strain was cultured in LB medium at 37 °C for 24 hours. A 1![[thin space (1/6-em)]](https://www.rsc.org/images/entities/char_2009.gif) :
:![[thin space (1/6-em)]](https://www.rsc.org/images/entities/char_2009.gif) 100 dilution of these bacterial suspensions in LB broth with a turbidity of 0.1 OD was used for the assay. To evaluate the antibiofilm activity of the compounds, diluted bacterial suspension and MIC dose of test compounds were added to the flat bottom 96 well plate. To enable biofilm formation, the plates were incubated for 24 hours at 37 °C. The contents of each well were taken out after incubation, and the wells were then washed twice with a sterile LB medium. The plate was then air-dried and stained for 30 minutes at room temperature with 0.1 percent w/v crystal violet (CV) solution. The excess stain of CV was then rinsed with distilled water. 125 μL of 30% acetic acid was added to this well to solubilize the CV dye stained on the biofilm biomass and left for 15 minutes. A microplate reader was then used to measure the absorbance at 570 nm. Comparisons of the optical densities of drug-treated and untreated bacterial cultures were conducted and the percentage inhibition of biofilm biomass was determined by the following equation.
100 dilution of these bacterial suspensions in LB broth with a turbidity of 0.1 OD was used for the assay. To evaluate the antibiofilm activity of the compounds, diluted bacterial suspension and MIC dose of test compounds were added to the flat bottom 96 well plate. To enable biofilm formation, the plates were incubated for 24 hours at 37 °C. The contents of each well were taken out after incubation, and the wells were then washed twice with a sterile LB medium. The plate was then air-dried and stained for 30 minutes at room temperature with 0.1 percent w/v crystal violet (CV) solution. The excess stain of CV was then rinsed with distilled water. 125 μL of 30% acetic acid was added to this well to solubilize the CV dye stained on the biofilm biomass and left for 15 minutes. A microplate reader was then used to measure the absorbance at 570 nm. Comparisons of the optical densities of drug-treated and untreated bacterial cultures were conducted and the percentage inhibition of biofilm biomass was determined by the following equation.Eradication activity of the compounds against preformed biofilms
Compounds 5(a–n) were studied for their effect on eradicating preformed biofilms at their ¼ MIC doses by previously reported protocol.51 A bacterial suspension of 0.1 OD was obtained and 100 μL of test bacterial suspension was added to the wells of a 96-well plate, and incubated for 24 h to allow initial bacterial adhesion and biofilm formation. Further, the content of the wells was removed, washed with sterile LB broth twice, and then filled with fresh LB broth containing ¼ MIC doses of compounds 5(a–n). Further, the plates were sealed and incubated at 37 °C for another 24 h. After the incubation, 96 well plate was processed and the percentage biofilm biomass reduction was calculated as reported above.Analysis of biofilm architecture
Anti-virulence testing
| Primers | ||
|---|---|---|
| Forward | Reverse | |
| rpoD | TCCACCGACAACAG | GAGCTGGAAACCGTGGACT |
| lasB | CGCAAGACCGAGAATGACA | AGACCAGTTGGGCGATGTT |
| rhlA | AAGCCAGCAACCATCAGC | GCACCTGGTCGATGTGAAA |
| pqsE | ATGATGACCTGTGCCTGTTG | CAGTGGTCGTAGTGCTTGTG |
IC50 values were calculated using dose response inhibition curves in Graphpad prism.
The MM-GBSA is calculated as
| ΔGbind = Gcomplex − Gprotein − Gligand |
Conclusion
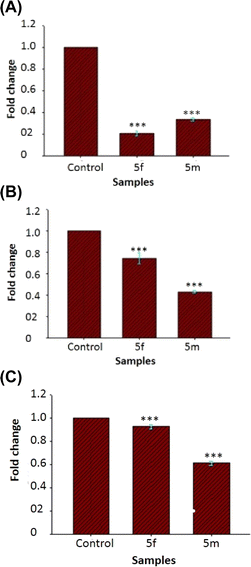
A set of biaryl flavonols were synthesized from substituted flavonols using a Suzuki–Miyaura cross-coupling reaction. The reaction gives excellent yields of the product in a ligand-free reaction methodology in DMF/aqueous solvent system using palladium acetate as the catalyst. All the products synthesized using this reaction methodology were utilized for the screening of antibiofilm and antivirulence activity against the opportunistic pathogen Pseudomonas aeruginosa. Compounds exhibited good antibiofilm and antivirulence activity against the test strain of bacteria. Virulence factors including pyocyanin, LasA protease, cell surface hydrophobicity and rhamnolipid were evaluated after treatment of the compounds. A molecular docking study was conducted to find the best ligands for LasR, RhlR, and PqsR. The molecular docking study revealed that contradictory to the in vitro studies, 5f did not shows any pose towards the receptor proteins 2UV0 and 4JVI. But, the compound 5m which was showing 80% biofilm inhibition was showing good binding affinity towards the receptor proteins and the compound was having high binding free energy in molecular dynamics study. Taking into consideration of the good binding affinity and high binding free energy, the compound 5m was selected for the gene expression study and based on the highest antibiofilm activity of compound 5f in in vitro study compound 5f was also selected for gene expression study. The RT-PCR study of compounds 5f and 5m against rhlA, lasB, and pqsE shows downregulation in gene expression compared to the control. The gene expression study suggests that the anti-biofilm and antivirulence activity of the compounds are possibly due to the downregulation of genes and thereby inhibiting quorum sensing and biofilm formation. The cytotoxicity of the best compound 5f was evaluated by MTT assay and found that the compound is nontoxic to living cells at their ¼ MIC dosage.Conflicts of interest
The results of this paper are not affected by any competing financial interests or personal relationships.Acknowledgements
The authors acknowledge the VIT management for providing lab and instrumental facilities, SIF and HOME for characterization techniques and VIT-SEED GRANT (No. SG20230044) for the financial support for completion of this project. ATB acknowledges VIT for awarding TRA fellowship.References
- C. C. C. J. Seechurn, M. O. Kitching, T. J. Colacot and V. Snieckus, Angew. Chem., Int. Ed., 2012, 51, 5062–5085 CrossRef PubMed.
- F.-S. Han, Chem. Soc. Rev., 2013, 42, 5270–5298 RSC.
- J. Magano and J. R. Dunetz, Chem. Rev., 2011, 111, 2177–2250 CrossRef CAS PubMed.
- N. Miyaura and A. Suzuki, J. Chem. Soc. Chem. Commun., 1979, 866–867 RSC.
- N. Miyaura and A. Suzuki, Chem. Rev., 2002, 95, 2457–2483 CrossRef.
- A. Suzuki, J. Organomet. Chem., 1999, 576, 147–168 CrossRef CAS.
- A. J. J. Lennox and G. C. Lloyd-Jones, Chem. Soc. Rev., 2013, 43, 412–443 RSC.
- J. P. G. Rygus and C. M. Crudden, J. Am. Chem. Soc., 2017, 139, 18124–18137 CrossRef CAS PubMed.
- C. Torborg and M. Beller, Adv. Synth. Catal., 2009, 351, 3027–3043 CrossRef CAS.
- V. Chandrasekhar, R. S. Narayanan and P. Thilagar, Organometallics, 2009, 28, 5883–5888 CrossRef CAS.
- B. Bhayana, B. P. Fors and S. L. Buchwald, Org. Lett., 2009, 11, 3954–3957 CrossRef CAS PubMed.
- C. A. James, A. L. Coelho, M. Gevaert, P. Forgione and V. Snieckus, J. Org. Chem., 2009, 74, 4094–4103 CrossRef CAS PubMed.
- Y. J. Moon, X. Wang and M. E. Morris, Toxicol. Vitro, 2006, 20, 187–210 CrossRef CAS PubMed.
- M. T. L. Ielpo, A. Basile, R. Miranda, V. Moscatiello, C. Nappo, S. Sorbo, E. Laghi, M. M. Ricciardi, L. Ricciardi and M. L. Vuotto, Fitoterapia, 2000, 71, S101–S109 CrossRef CAS PubMed.
- C. X. Qin, X. Chen, R. A. Hughes, S. J. Williams and O. L. Woodman, J. Med. Chem., 2008, 51, 1874–1884 CrossRef CAS PubMed.
- L. Wang, T. Yi-Chen, T. Lian, H. Jing-Ting, Y. Jui-Hung and W. Ming-Jiuan, J. Agric. Food Chem., 2006, 54, 9798–9804 CrossRef CAS PubMed.
- S. Chirumbolo, Inflammation Allergy: Drug Targets, 2010, 9, 263–285 CrossRef CAS PubMed.
- H. Matsuda, K. Ninomiya, H. Shimoda and M. Yoshikawa, Bioorg. Med. Chem., 2002, 10, 707–712 CrossRef CAS PubMed.
- L. Silver and K. Bostian, Eur. J. Clin. Microbiol. Infect. Dis., 1990, 97(9), 455–461 CrossRef PubMed.
- C. Mouffouk, S. Mouffouk, S. Mouffouk, L. Hambaba and H. Haba, Eur. J. Pharmacol., 2021, 891, 173759 CrossRef CAS PubMed.
- L. Gao, Z. Tang, T. Li and J. Wang, Microb. Pathog., 2023, 182, 106165 CrossRef CAS PubMed.
- K. I. Arita-Morioka, K. Yamanaka, Y. Mizunoe, Y. Tanaka, T. Ogura and S. Sugimoto, Sci. Rep., 2018, 8, 1–11 CAS.
- L. Gao, Z. Tang, T. Li and J. Wang, Pathog. Dis., 2021, 79, 1–10 Search PubMed.
- L. N. Silva, G. C. A. Da Hora, T. A. Soares, M. S. Bojer, H. Ingmer, A. J. Macedo and D. S. Trentin, Sci. Rep., 2017, 7, 1–16 CrossRef PubMed.
- P. Krzyżek, P. Migdał, E. Paluch, M. Karwańska, A. Wieliczko and G. Gościniak, Int. J. Mol. Sci., 2021, 22, 1–19 Search PubMed.
- X. Wu, G. L. Ma, H. W. Chen, Z. Y. Zhao, Z. P. Zhu, J. Xiong, G. X. Yang and J. F. Hu, J. Ethnopharmacol., 2023, 306, 116177 CrossRef CAS PubMed.
- D. Ming, D. Wang, F. Cao, H. Xiang, D. Mu, J. Cao, B. Li, L. Zhong, X. Dong, X. Zhong, L. Wang and T. Wang, Front. Microbiol., 2017, 8, 1–11 Search PubMed.
- L. Slobodníková, S. Fialová, K. Rendeková, J. Kováč and P. Mučaji, Molecules, 2016, 21, 1–15 CrossRef PubMed.
- P. A. M. Gómez, L. Y. T. C. Jon, D. J. M. Torres, R. E. B. Amaranto, I. E. C. Díaz and C. A. M. Medina, F1000Research, 2021, 10, 1–23 Search PubMed.
- R. Frei, A. S. Breitbach and H. E. Blackwell, Angew. Chem., Int. Ed., 2012, 51, 5226–5229 CrossRef CAS PubMed.
- P. Di Martino, AIMS Microbiol., 2018, 4, 274–288 CAS.
- H. C. Flemming and J. Wingender, Nat. Rev. Microbiol., 2010, 89(8), 623–633 CrossRef PubMed.
- A. H. Broderick, A. S. Breitbach, R. Frei, H. E. Blackwell and D. M. Lynn, Adv. Healthcare Mater., 2013, 2, 993–1000 CrossRef CAS PubMed.
- L. Lu, W. Hu, Z. Tian, D. Yuan, G. Yi, Y. Zhou, Q. Cheng, J. Zhu and M. Li, Chin. Med., 2019, 14, 1–17 CrossRef CAS PubMed.
- S. P. Diggle and M. Whiteley, Microbiology, 2020, 166, 30–33 CrossRef CAS PubMed.
- J. P. Clancy, L. Dupont, M. W. Konstan, J. Billings, S. Fustik, C. H. Goss, J. Lymp, P. Minic, A. L. Quittner, R. C. Rubenstein and K. R. Young, Thorax, 2013, 68, 818–825 CrossRef CAS PubMed.
- F. F. Tuon, L. R. Dantas, P. H. Suss and V. S. T. Ribeiro, Pathogens, 2022, 11, 300–319 CrossRef CAS PubMed.
- K. P. Rumbaugh, J. A. Griswold and A. N. Hamood, Microbes Infect., 2000, 2, 1721–1731 CrossRef CAS PubMed.
- M. Malešević, F. D. Lorenzo, B. Filipić, N. Stanisavljević, K. Novović, L. Senerovic, N. Polović, A. Molinaro, M. Kojić and B. Jovčić, Sci. Rep., 2019, 9, 1–13 CrossRef PubMed.
- N. R. Kishore, D. Ashok, M. Sarasija and N. Y. S. Murthy, Chem. Heterocycl. Compd., 2018, 53, 1187–1191 CrossRef.
- D. Ashok, S. Ravi, B. V. Lakshmi and A. Ganesh, J. Serb. Chem. Soc., 2015, 80, 1361–1366 CrossRef.
- H. Hu, C. Ge, A. Zhang and L. Ding, Mol, 2009, 14, 3153–3160 CrossRef CAS PubMed.
- G. W. Lau, D. J. Hassett, H. Ran and F. Kong, Trends Mol. Med., 2004, 10, 599–606 CrossRef CAS PubMed.
- S. Hall, C. McDermott, S. Anoopkumar-Dukie, A. J. McFarland, A. Forbes, A. V. Perkins, A. K. Davey, R. Chess-Williams, M. J. Kiefel, D. Arora and G. D. Grant, Toxins, 2016, 8, 236–250 CrossRef PubMed.
- S. Lindsay, A. Oates and K. Bourdillon, Int. Wound J., 2017, 14, 1237–1247 CrossRef PubMed.
- T. B. Anjitha, P. Shanmugam and K. R. Ethiraj, ChemistrySelect, 2021, 6, 12074–12081 CrossRef CAS.
- L. Giordano, V. V. Shvadchak, J. A. Fauerbach, E. A. Jares-Erijman and T. M. Jovin, J. Phys. Chem. Lett., 2012, 3, 1011–1016 CrossRef CAS PubMed.
- J. B. Patel, G. M. Eliopoulos, S. G. Jenkins, F. S. J. Lewis II, P. B. Limbago, D. P. Nicolau, F. R. Patel, M. Powell, F. S. S. Richter, D. M. J. Swenson, M. M. M. Traczewski, M. D. J. Turnidge, M. P. Weinstein, B. L. Zimmer, D. M. A. Bobenchik, D. S. Campeau, D. K. S. Cullen, R. F. M. G. H. Gold, F. M. R. Humphries, D. J. T. Kirn, J. S. Lewis II, F. B. Limbago, A. J. Mathers, D. T. Mazzulli, F. S. S. Richter, F. M. Satlin, M. N. A. Schuetz and M. D. P. Tamma, Performance standards for antimicrobial susceptibility testing, Clinical and Laboratory Standards Institute (CLSI), 2016, vol. 40, pp. 100–125 Search PubMed.
- G. Maisetta, A. M. Piras, V. Motta, S. Braccini, D. Mazzantini, F. Chiellini, Y. Zambito, S. Esin and G. Batoni, Microorganisms, 2021, 9, 912–930 CrossRef CAS PubMed.
- P. Rathinam and P. Viswanathan, Int. J. Pharm. Pharmaceut. Sci., 2014, 6, 85–90 Search PubMed.
- L. Kumar, S. Chhibber and K. Harjai, Fitoterapia, 2013, 90, 73–78 CrossRef CAS PubMed.
- J. Zhou, S. Bi, H. Chen, T. Chen, R. Yang, M. Li, Y. Fu and A. Q. Jia, Front. Microbiol., 2017, 8, 769 CrossRef PubMed.
- J. Rajkumari, C. M. Magdalane, B. Siddhardha, J. Madhavan, G. Ramalingam, N. A. Al-Dhabi, M. V. Arasu, A. K. M. Ghilan, V. Duraipandiayan and K. Kaviyarasu, J. Photochem. Photobiol., B, 2019, 201, 111667 CrossRef CAS PubMed.
- V. Huerta, K. Mihalik, S. H. Crixell and D. A. Vattem, Int. J. Appl. Res. Nat. Prod., 2008, 1, 9–15 Search PubMed.
- M. Chatterjee, S. D'Morris, V. Paul, S. Warrier, A. K. Vasudevan, M. Vanuopadath, S. S. Nair, B. Paul-Prasanth, C. G. Mohan and R. Biswas, Appl. Microbiol. Biotechnol., 2017, 101, 8223–8236 CrossRef CAS PubMed.
- J. Luo, B. Dong, K. Wang, S. Cai, T. Liu, X. Cheng, D. Lei, Y. Chen, Y. Li, J. Kong and Y. Chen, PLoS One, 2017, 12, e0176883 CrossRef PubMed.
- B. Pejin, A. Ciric, J. Markovic, J. Glamoclija, M. Nikolic, B. Stanimirovic and M. Sokovic, Curr. Pharm. Biotechnol., 2015, 16, 733–737 CAS.
- R. Kartikeyan, D. Murugan, T. Ajaykamal, M. Varadhan, L. Rangasamy, M. Velusamy, M. Palaniandavar and V. Rajendiran, Dalton Trans., 2023, 52, 9148–9169 RSC.
- S. Genheden and U. Ryde, Expert Opin. Drug Discovery, 2015, 10, 449–461 CrossRef CAS PubMed.
- S. V. Pattar, S. A. Adhoni, C. M. Kamanavalli and S. S. Kumbar, Beni-Suef Univ. J. Basic Appl. Sci., 2020, 9, 1–10 CrossRef.
Footnote |
| † Electronic supplementary information (ESI) available: Fig. S1–S28. Spectroscopic characterization data of compounds 3(a–g). Fig. S29–S84. Spectroscopic characterization data of compounds 5(a–n). Fig. S85. Growth curve analysis of P. aeruginosa in ½ MIC, ¼ MIC, 1/8 MIC dosages of compounds 5(a–n). Fig. S86–S90. Molecular docking and molecular dynamic study. CCDC 2054733 and 2122702. For ESI and crystallographic data in CIF or other electronic format see DOI: https://doi.org/10.1039/d3ra08617h |
| This journal is © The Royal Society of Chemistry 2024 |

