
 Open Access Article
 This Open Access Article is licensed under a Creative Commons Attribution-Non Commercial 3.0 Unported Licence
Achievement of waste sludge deep dehydration under acidic conditions with polydimethyldiallylammonium chloride and ferric chloride: performance and mechanism
Yong-Tao Lv abc,
Kaichong Wangabc,
Jiaxin Liuabc,
Xudong Wangabc,
Le Liabc,
Junqi Qiua and
Lei Wang*abc
abc,
Kaichong Wangabc,
Jiaxin Liuabc,
Xudong Wangabc,
Le Liabc,
Junqi Qiua and
Lei Wang*abc
aSchool of Environmental and Municipal Engineering, Xi'an University of Architecture and Technology, No. 13 Yanta Road, Xi'an 710055, China. E-mail: wl0178@126.com; Tel: +86 2982202729
bKey Laboratory of Membrane Separation of Shaanxi Province, Research Institute of Membrane Separation Technology of Shaanxi Province, No. 13 Yanta Road, Xi'an 710055, China
cKey Laboratory of Environmental Engineering of Shaanxi Province, No. 13 Yanta Road, Xi'an 710055, China
First published on 8th May 2024
Abstract
The biological treatment of wastewater generates a substantial amount of waste sludge that requires dewatering before final disposal. Efficient sludge dewatering is essential to minimize storage and transportation costs. In this study, the sludge conditioners polydimethyldiallylammonium chloride (PDMDAAC) and ferric chloride (FeCl3) were sequentially dosed, and the pH was adjusted to 3. As a result, the sludge moisture content (MC) was reduced to 59.4%, achieving deep dewatering. After conditioning, the tightly bound extracellular polymeric substances (TB-EPS) were reduced from 34.5 to 10.2 mg g−1 VSS, with the majority of the reduced fractions being composed of protein (PN). In contrast, soluble EPS increased more than 8 times. Subsequent studies revealed that the decrease in PN from TB-EPS primarily involved tryptophan and tyrosine proteins, accompanied by a significant reduction in the N–H and C![[double bond, length as m-dash]](https://www.rsc.org/images/entities/char_e001.gif) C absorption peaks. These results highlight the critical role of TB-EPS dissolution in achieving deep dehydration, with the N–H in PN was identified as the key group influencing sludge dewatering. Combined with the changes in sludge particle size and morphology, the dewatering mechanism can be summarized as follows: PDMDAAC dissolves TB-EPS, simultaneously disrupting the floc structure and refining the sludge. Subsequently, FeCl3 reconstructs these elements, forming larger particle sizes. Finally, hydrochloric acid reduces TB-EPS once again, releasing bound water. This study offers alternative methods and new insights for achieving deep dewatering of waste sludge.
C absorption peaks. These results highlight the critical role of TB-EPS dissolution in achieving deep dehydration, with the N–H in PN was identified as the key group influencing sludge dewatering. Combined with the changes in sludge particle size and morphology, the dewatering mechanism can be summarized as follows: PDMDAAC dissolves TB-EPS, simultaneously disrupting the floc structure and refining the sludge. Subsequently, FeCl3 reconstructs these elements, forming larger particle sizes. Finally, hydrochloric acid reduces TB-EPS once again, releasing bound water. This study offers alternative methods and new insights for achieving deep dewatering of waste sludge.
1. Introduction
The activated sludge process is the most widely used method for wastewater treatment, playing an important role in purifying wastewater and improving water environments.1 However, it inevitably generates a significant amount of waste sludge.2,3 These sludges contain a substantial amount of organic matter and must be appropriately disposed of (e.g., landfill or incineration) to prevent secondary pollution of soil and groundwater.4–6 Due to their high moisture content (MC), sludge dewatering is necessary before disposal to reduce the storage and transportation costs.7,8 To enhance the efficiency of sludge dewatering, chemical reagents are commonly introduced for conditioning.3,7,9 Traditional chemical conditioning agents, such as polymeric FeCl3, polymeric aluminum chloride, and polyacrylamide, work to improve sludge dewatering performance by primarily removing free water through electrical neutralization and bridging mechanisms.10,11 However, they face limitations as they cannot effectively release the bound water within the sludge, restricting their effectiveness in achieving deep dehydration.12Extracellular polymeric substances (EPS) are organic polymers secreted by microorganisms, tightly bound to water molecules through chemical bonding, thereby influencing the deep dewatering of sludge.13–15 Previous studies have demonstrated that advanced conditioning processes, such as oxidation and heat treatment, can disrupt the EPS structure, releasing bound water and effectively improving sludge dewatering performance.16,17 However, the high treatment cost and harsh operating conditions associated with these methods limit their large-scale applications.
Surfactants have been identified as agents capable of dissolving EPS, but their impact on sludge dewatering remains a topic of debate. Ye et al. found that sodium dodecyl sulfate can release EPS from sludge, but this led to a deterioration in sludge dewatering performance.9,18 In contrast, He et al. observed that the sequential addition of polydimethyldiallylammonium chloride (PDMDAAC) and tannic acid enhanced sludge dewatering performance, reducing the MC to 67.8%.16 These differences highlight the challenge of achieving optimal dewatering performance using surfactants alone. Consequently, exploring the combined use of surfactants is anticipated to offer new insights for enhancing sludge dewatering. In addition, EPS components and structure are complex, with extracellular protein (PN) and exopolysaccharide (PS) collectively accounting for 70–80%.19 EPS exhibits spatial layering characteristics, divided into tightly bound EPS (TB-EPS), loosely bound EPS (LB-EPS), and soluble EPS (S-EPS) in order from the inside to the outside.20,21 However, the component that plays a dominant role in sludge dewatering (PS or PN), as well as the spatial subcomponent (TB-EPS, LB-EPS, or S-EPS), remains to be further clarified.22–25
In this study, PDMDAAC, ferric chloride (FeCl3), and HCl were utilized as conditioning agents for achieving deep sludge dewatering. Initially, the effects of different combinations on sludge MC and capillary suction time (CST) were examined to determine the optimal parameters. Simultaneously, variations in EPS components and structures, sludge surface properties, and morphology during the conditioning process were characterized and correlated with the sludge dewatering performance. The goal is to provide alternative methods and new insights for realizing deep sludge dewatering.
2. Materials and methods
2.1. Chemical reagents
In this study, PDMDAAC, FeCl3 and HCl were used as sludge conditioners, and all three were of analytical purity. PDMDAAC and FeCl3 were procured from Shanghai Aladdin Biochemical Technology Co., while HCl was obtained from Sinopharm Chemical Reagent Co. In addition, the bovine serum albumin (BSA) and glucose used in the experiments were analytically pure and were obtained from Tianjin Komeo Chemical Reagent Co.2.2. Wasted sludge sources and dewatering tests
The wasted sludge was obtained from the 5th Wastewater Treatment Plant in Xi'an, with specific characteristics detailed in Table 1. Sludge samples were collected and tested on the same day. Initially, 500 mL of sludge was sampled and placed in a beaker. The conditioner was then added, and the mixture was stirred using a magnetic stirrer (KDM thermoregulation type, Huaru Electric Heating Apparatus, Shandong, China) for 10 min. Subsequently, the mixture was poured into a filter bag (180 × 430–0.5 micron, Bifilter, Zhejiang, China), hand-twisted until no more water dripped, and the MC of the sludge was determined. Each test was conducted three times.| pH | 6.7 ± 0.2 | |
| WC (%) | 98.0 ± 2.0 | |
| Zeta potential (mV) | −19.76 ± 2.0 | |
| Particle size (μm) | 43.61 ± 2.0 | |
| CST (s) | 84.2 ± 3.0 | |
| PN (mg g−1 VSS) | TB-EPS | 30.72 ± 1.73 |
| LB-EPS | 0.82 ± 0.09 | |
| S-EPS | 1.36 ± 0.03 | |
| PS (mg g−1 VSS) | TB-EPS | 12.13 ± 1.32 |
| LB-EPS | 0.35 ± 0.01 | |
| S-EPS | 0.34 ± 0.01 | |
The optimal dosage of PDMDAAC, FeCl3, and HCl was determined individually at 0.375 g g−1 dry sludge (DS), 2.0 g g−1 DS, and pH 3.0, respectively. Subsequent tests (Table 2) were conducted to identify the optimum dewatering parameters.
| No. | Sludge conditioning agents | ||
|---|---|---|---|
| PDMDAAC (g g−1 DS) | FeCl3 (g g−1 DS) | pH | |
| 1 | 0.375 | 0, 0.5, 1.0, 1.5, 2.0, 2.5 | 7.0 |
| 2 | 0, 0.125, 0.25, 0.375, 0.5, 0.625 | 2.0 | 7.0 |
| 3 | 0.375 | 2.0 | 7.0, 6.0, 5.0, 4.0, 3.0, 2.0 |
2.3. Conventional analytical methods
The sludge MC was determined using the drying and weighing method,26 while the CST was measured using a portable CST tester (CST DP-304B, Asia-Eurodepen Technology, Beijing, China). The pH of the sludge samples was measured with a standard acidity meter (ST2100, Ohaus, New Jersey, US). The zeta potential and particle size of the sludge were determined using a zeta potential meter (ZS90, Malvern PANalytical, Malvern, UK) and a laser particle size distribution meter (Sync, Microtrac, Pennsylvania, US), respectively. Sludge morphology was examined using scanning electron microscopy (SEM) (JSM-6510LV, JEOL, Tokyo, Japan) after the samples underwent dehydration and plating.2.4. EPS extraction and analysis
![[thin space (1/6-em)]](https://www.rsc.org/images/entities/char_2009.gif) 000 nm min−1 and 600 V, respectively.
000 nm min−1 and 600 V, respectively.Absorption peaks in the 3D-EEM include the following components: tyrosine-like proteins (Ex, 220–250 nm; Em, 280–330 nm); tryptophan-like proteins (Ex, 220–250 nm; Em, 330–380 nm); xanthic acid-like organics (Ex, 240–255 nm; Em, 380–550 nm); microbial-like by-product material (Ex, 250–450 nm; Em, 280–380 nm); humic acid-like organics (Ex, 340–450 nm; Em, 380–550 nm).
:1. To analyze the major functional groups of the three EPS subfractions, FTIR spectra of EPS were obtained using a FTIR spectrometer (Nicolet 5700, Applied Separations, USA) with wavenumbers ranging from 500 cm−1 to 4000 cm−1.292.5. Statistical analysis
Statistical analysis was carried out by using the software of SPSS version 19.0. Correlations are considered statistically significant at 95% confidence interval (p < 0.05).3. Results and discussion
3.1. Variation in sludge dewatering performance
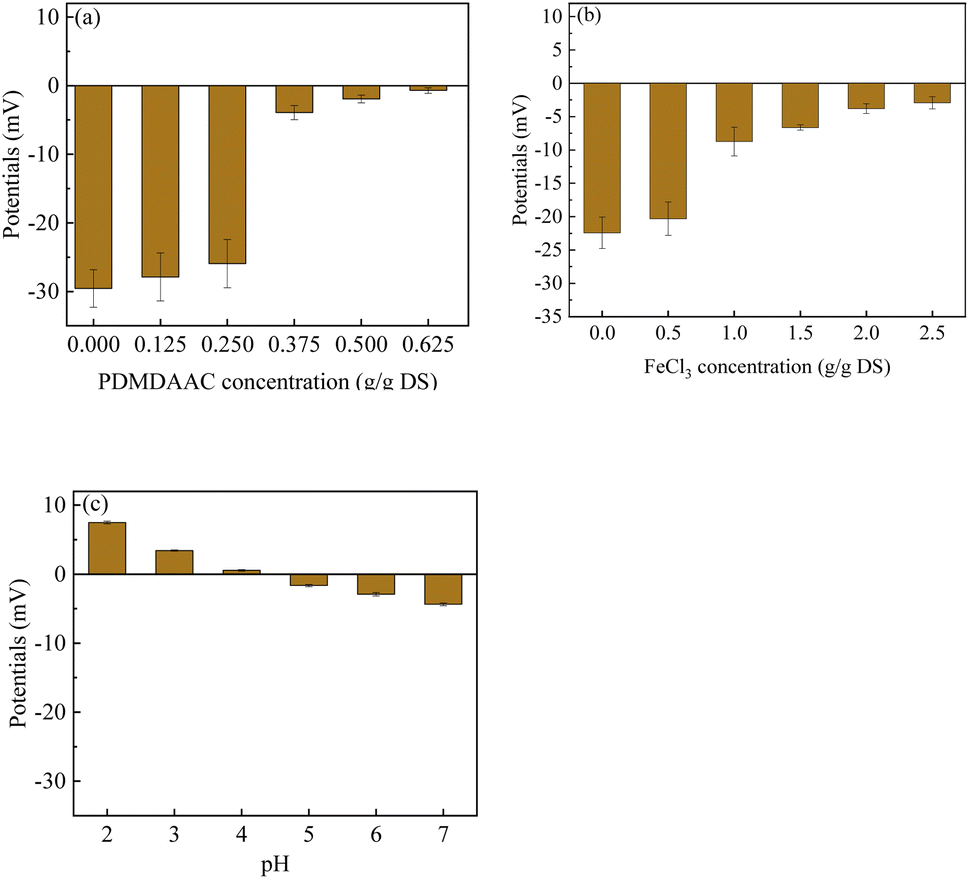
The sludge MC and CST exhibited a decreasing and then increasing trend with the increase in PDMDAAC dosage (Fig. 1a). As the PDMDAAC dosage increased from 0 to 0.375 g g−1 DS, the sludge MC decreased from 74.86% to the minimum 64.81%, accompanied by a decrease in CST from 71.85 s to 22.00 s. This suggests that a low dosage of PDMDAAC effectively reduces the MC of the sludge and enhances its water permeability. However, dosages exceeding 0.375 g g−1 DS led to an increase in sludge viscosity,11 resulting in higher CST and posing challenges for dewatering.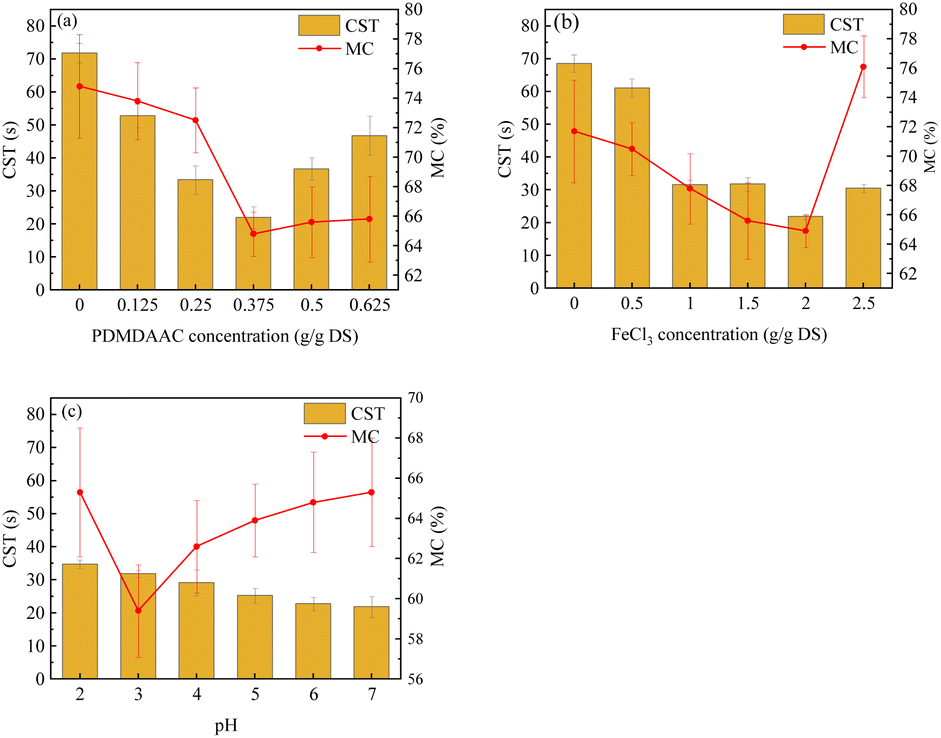 | ||
| Fig. 1 Variation of sludge MC and CST under different conditions: (a) FeCl3 dosage of 2.0 g g−1 DS; (b) PDMDAAC dosage of 0.375 g g−1 DS; (c) PDMDAAC and FeCl3 at 0.375 and 2.0 g g−1 DS, respectively. | ||
The sludge dewatering performance exhibited a trend of increasing and then decreasing with the rise in FeCl3 dosage (Fig. 1b). At a dosage of 2.0 g g−1 DS, the sludge MC decreased to 64.91%, and the CST was 21.85 s, representing the optimal dewatering performance. However, when the dosage exceeded 2.0 g g−1 DS, noth the sludge MC and CST decreased, indicating a decline in sludge dewatering performance. The excessive FeCl3 appeared to impact the aggregation performance of the sludge and could potentially disrupt its structure, thereby affecting dewatering performance.30
The sludge MC tends to decrease and then increase with decreasing pH from 7.0 to 2.0 (Fig. 1c), aligning with the findings from He et al. who studied sludge dewatering using PDMDAAC in combination with tannic acid.16 The acidic conditions lower the negative charge of the sludge, destabilizing it. Furthermore, acidification can potentially disrupt the sludge structure and even induce cell lysis.31,32 Additionally, the acidic pH is known to reduce the viscosity of the polymer, enhancing the water permeability of the sludge.8,33
In summary, the sludge MC could be reduced to 64.8% by using PDMDAAC and FeCl3 as sludge conditioners. Building upon this, the addition of HCl to adjust the pH to 3.0 further lowered the sludge MC to 59.4%, achieving deep dewatering of the sludge.
3.2. Variation in EPS before and after sludge conditioning
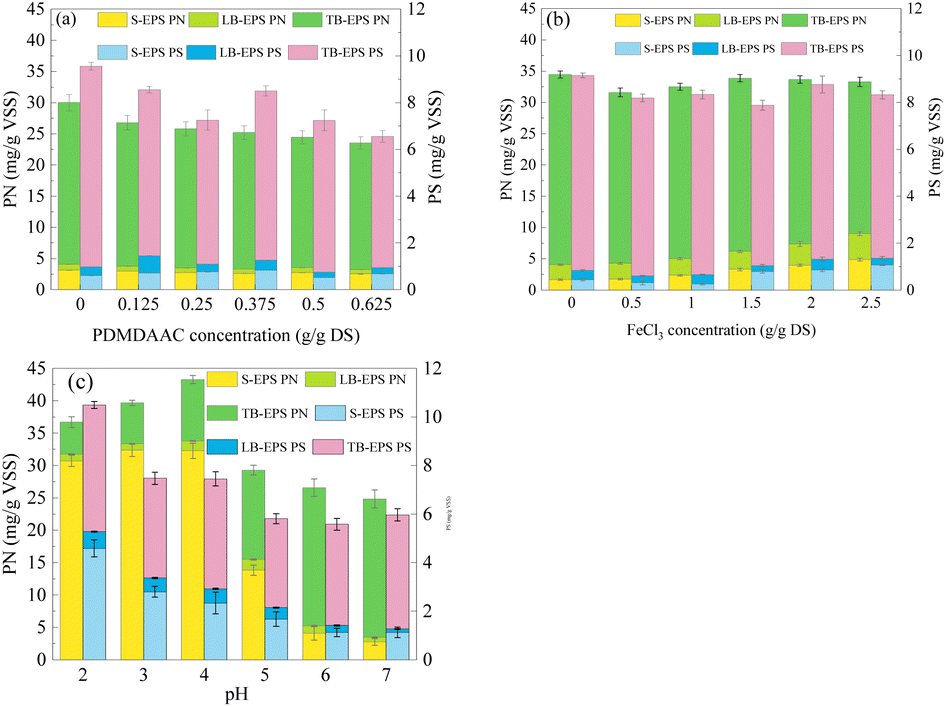 | ||
| Fig. 2 Variation of EPS components and contents under different conditions: (a) FeCl3 dosage of 2.0 g g−1 DS; (b) PDMDAAC dosage of 0.375 g g−1 DS; (c) PDMDAAC and FeCl3 at 0.375 and 2.0 g g−1 DS, respectively. | ||
The impact of FeCl3 on total EPS (39.8–43.6 mg g−1 VSS) was less pronounced compared to PDMDAAC (Fig. 2b). With increasing FeCl3 dosage, TB-EPS decreased from 38.7 to 31.2 mg g−1 VSS. In contrast, both LB-EPS and S-EPS increased, rising from 2.8 and 2.1 to 4.4 and 5.9 mg g−1 VSS, respectively. Considering the acidic nature of FeCl3, the increase in dosage led to the production of hydrogen ions, which in turn dissolved TB-EPS into LB-EPS and S-EPS.34
The EPS increased dramatically when the pH was decreased from 7.0 to 2.0 (Fig. 2c), reaching a maximum of 50.7 mg g−1 VSS at pH 4, where the PNs rose to 43.3 mg g−1 VSS, marking a 1.7 times increase compared to pH 7. The strongly acidic pH caused cell lysis, leading to the release of intracellular substances,35–37 as evident from the significant increase in PNs. Additionally, with decreasing pH (from 7 to 2), TB-EPS decreased from 26.1 to 10.2 mg g−1 VSS, and the major decrease was attributed to PNs. In contrast, S-EPS increased drastically from 3.9 to 35.3 mg g−1 VSS, representing more than 8-fold increase. The conditioning method employed in this study promoted a significant dissolution of TB-EPS, resulting in the achievement of deep dehydration in the sludge (Fig. 1c).38–40
EPS, with its water-holding function, was highlighted in this study, emphasizing that TB-EPS played a key role in influencing sludge dewatering. Positioned in the inner layer of the sludge, the dissolution of TB-EPS was found to release bound water, thereby positively contributing to enhanced sludge dewatering.41 Notably, the optimal sludge dewatering performance did not coincide when the minimum TB-EPS content, indicating that its content alone was not the sole factor influencing sludge dewatering performance. Moreover, the reduction in TB-EPS observed in this study was predominantly attributed to PN, suggesting that PN is a key component affecting sludge dewatering.
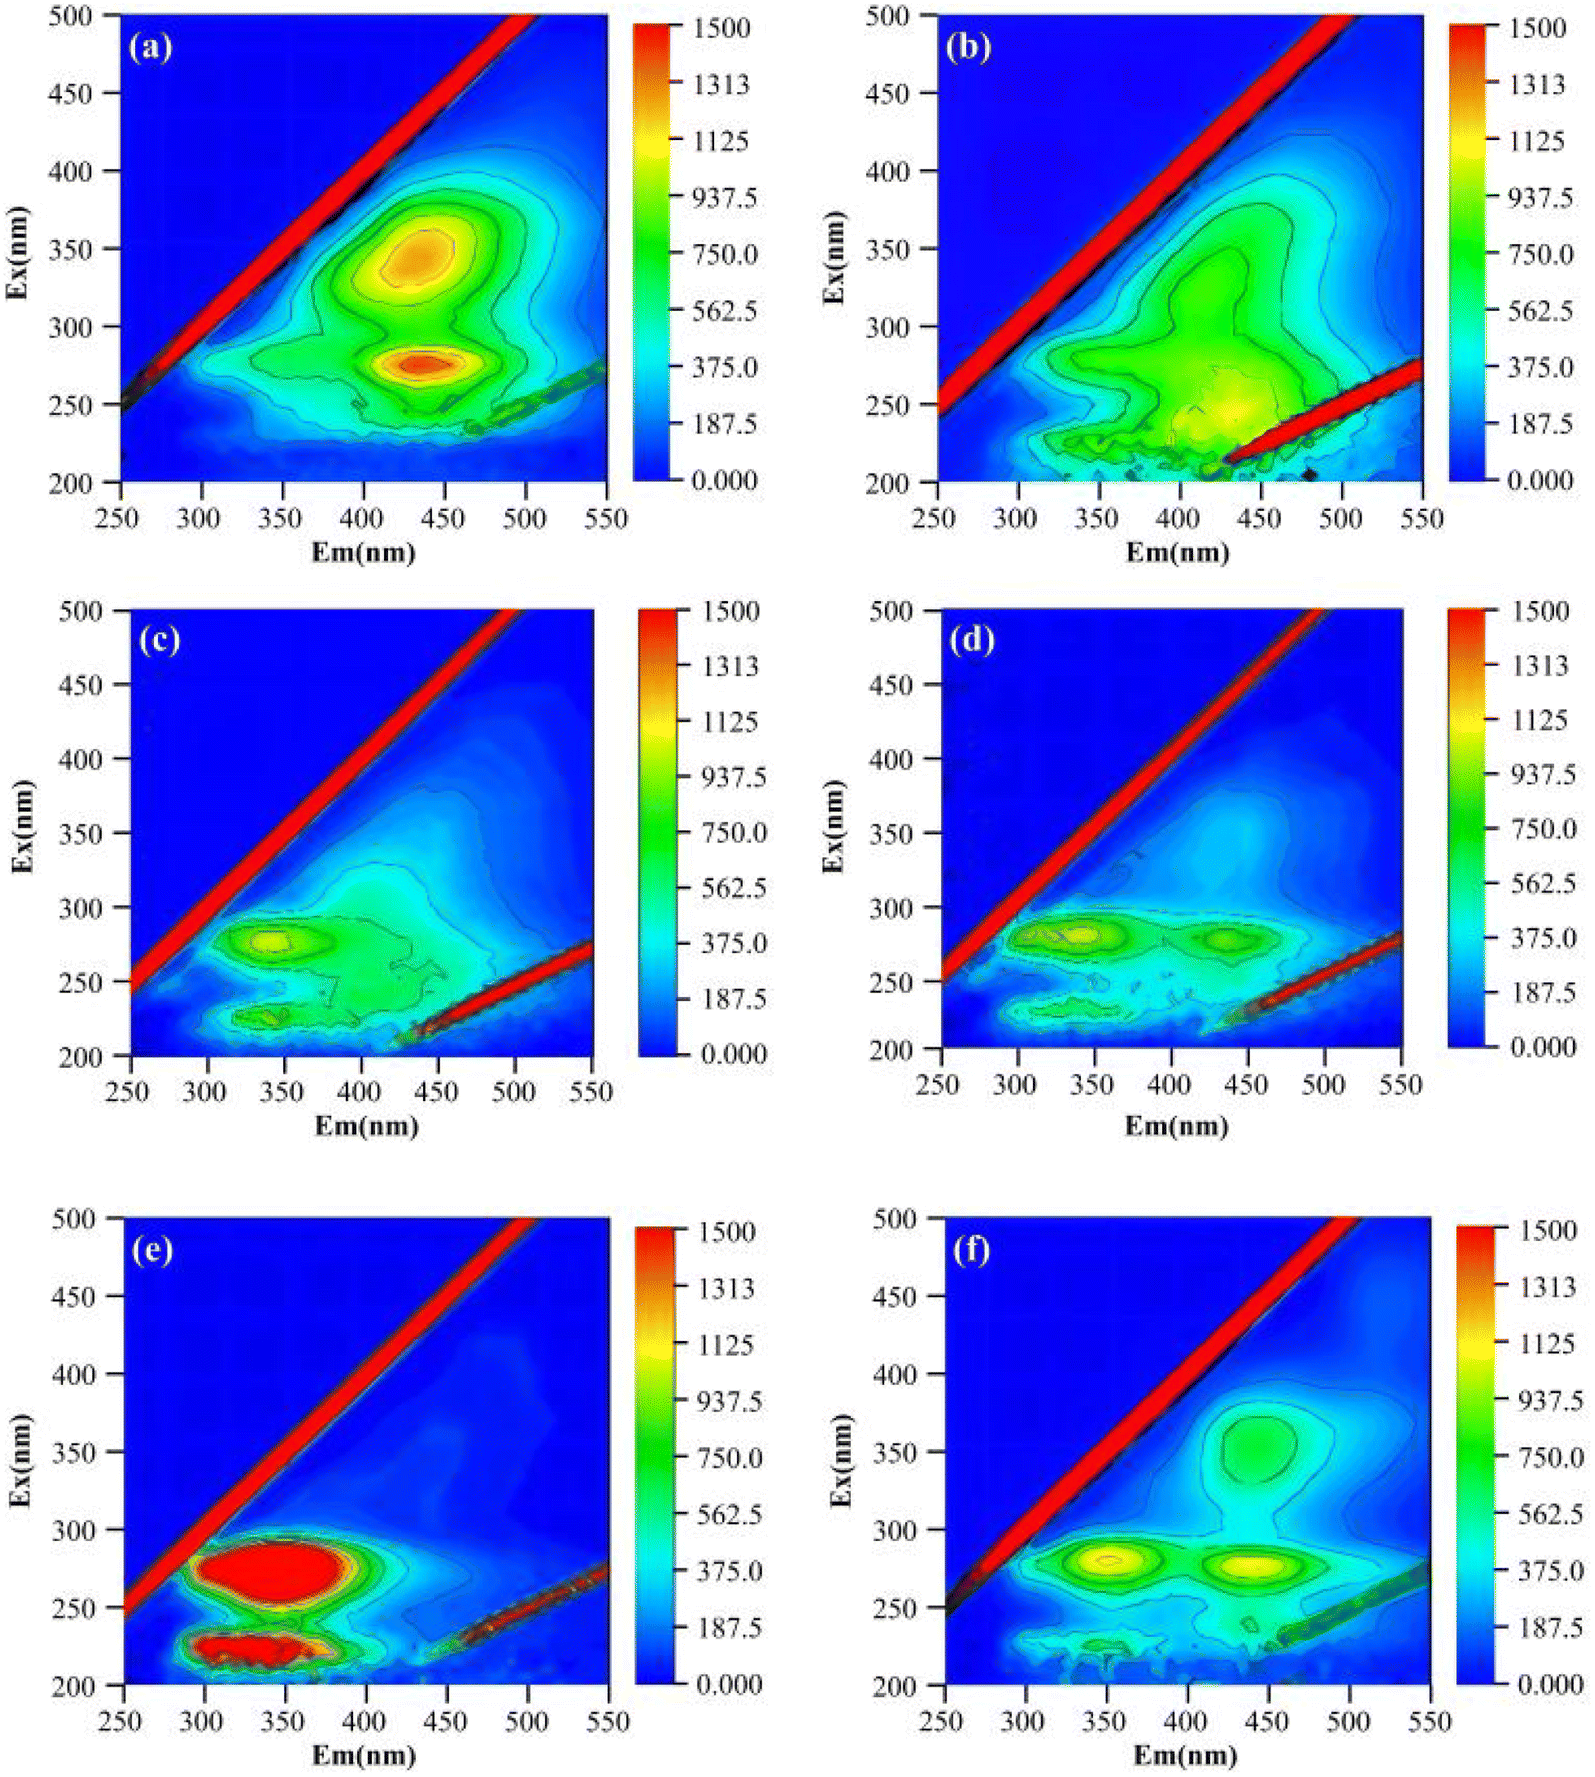 | ||
| Fig. 3 Variation in fluorescence substances in EPS, where (a, c and e) represent S-EPS, LB-EPS, and TB-EPS of the original sludge; and (b, d and f) represent S-EPS, LB-EPS, and TB-EPS of the sludge after conditioning. | ||
Furthermore, compared with the original sludge, both TB-EPS and LB-EPS contain higher amounts of humic acid organic compounds. These compounds are likely released from intracellular organic matter due to cell lysis.42–44 However, there is currently no evidence to certify that changes in humic acid are associated with sludge dewatering.
O (amide I), and the CC functional group (located in the 1660–1630 cm−1 band) in PNs. Additionally, EPS includes the CC functional group in carbohydrates (within the 1300–1500 cm−1 band) and the C–OH and C–O–C functional groups in PS (within the 1080–1030 cm−1 band).45
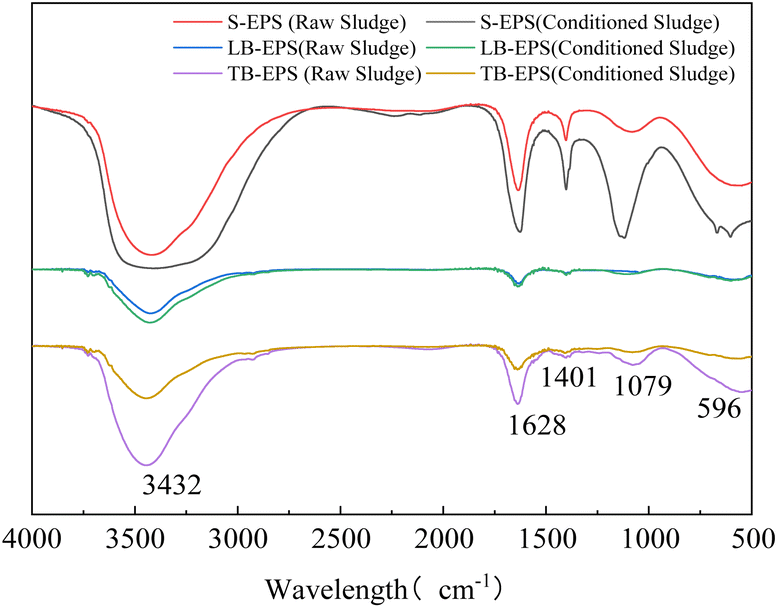 | ||
| Fig. 4 Variation of the functional groups in EPS before and after conditioning. | ||
After conditioning, LB-EPS exhibited no significant changes in its characteristic peaks, except for a slight weakening of the N–H absorption peak at 3432 cm−1. Conversely, the absorption peaks of S-EPS were all enhanced, particularly the CC functional group at 1628 cm−1 and C–OH at 1079 cm−1, indicating an increase in soluble PN and PS. In contrast, the absorption peaks of TB-EPS were significantly weakened, especially the N–H (3432 cm−1) and CC functional groups (1628 cm−1) in PNs. This aligned with the sharp decrease in the content of PNs in TB-EPS (Fig. 2c). Since CC is a hydrophobic functional group, in this study, the functional group affecting sludge dewatering is N–H. This highly hydrophilic functional group has a more substantial effect on the water-holding capacity of the EPS compared to, for example, CO and OH–.46 When present in TB-EPS, they can effectively lock water through hydrogen bonds.47,48
3.3. Changes in sludge characteristics
 | ||
| Fig. 5 Variation in sludge particle size under different conditions: (a) FeCl3 dosage of 2.0 g g−1 DS; (b) PDMDAAC dosage of 0.375 g g−1 DS; (c) PDMDAAC and FeCl3 dosages of 0.375 and 2.0 g g−1 DS, respectively. | ||
The sludge particle size exhibited a continuous decrease as the pH was decreased from 7 to 2 (Fig. 5c), reaching a minimum value of 46.3 μm. This trend elucidates the observed increase in CST as the pH decreased (Fig. 1c). Overall, the pH exerted little influence on the sludge particle size, indicating the formation of a more stable large particle size structure after conditioning with PDMDAAC and FeCl3. Despite the TB-EPS at pH 2 being reduced to a minimum (Fig. 2c), the structural disruption of sludge aggregates and the concurrent reduction in particle size both increased the challenges associated with sludge dewatering.
 | ||
| Fig. 6 Variation in zeta potential under different conditions: (a) FeCl3 dosage of 2.0 g g−1 DS; (b) PDMDAAC dosage of 0.375 g g−1 DS; (c) PDMDAAC and FeCl3 dosages of 0.375 and 2.0 g g−1 DS, respectively. | ||
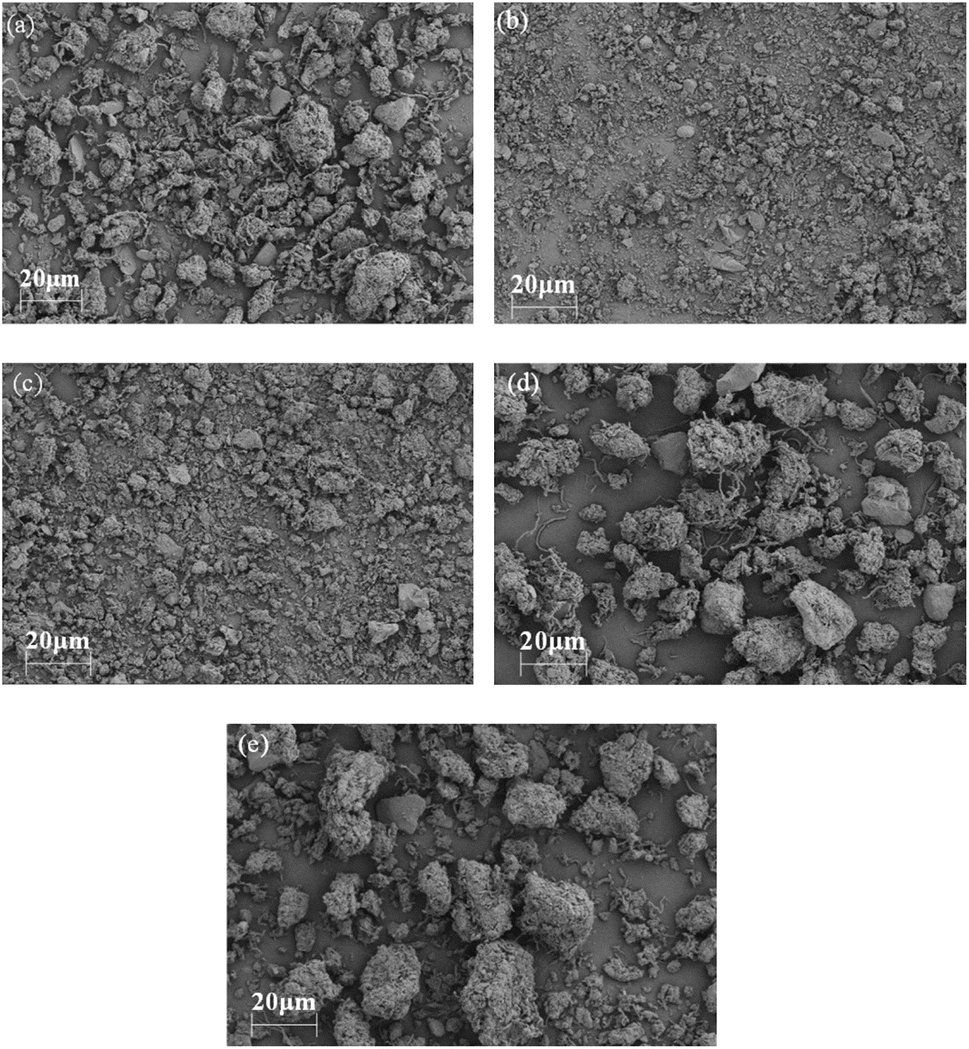 | ||
| Fig. 7 Changes in sludge morphology under various conditions: (a) original sludge, (b) PDMDAAC alone, (c) HCl alone, (d) FeCl3 alone, and (e) PDMDAAC + FeCl3 + HCl. | ||
3.4. Possible mechanisms of sludge dewatering
In this study, a comprehensive approach to deep dehydration was employed using PDMDAAC, FeCl3, and HCl as conditioners. The results demonstrated that all three conditioners effectively dissolved EPS and destabilized the sludge by reducing the zeta potential. However, their primary roles differed: PDMDAAC primarily dissolved TB-EPS, releasing a portion of the bound water. Nevertheless, this led to the destruction of the sludge structure, resulting in the formation of finer sludge and an increase in viscosity. In contrast, FeCl3 predominantly acted as a flocculant, promoting the aggregation of fine sludge particles to form larger sizes. HCl, on the other hand, contribute to the dissolution of TB-EPS, leading to the release of substantial bound water. Additionally, the acidic pH induced by HCl played a role in reducing the viscosity of the sludge.In summary, the sludge dewatering mechanisms in this study can be outlined as follows: first, the addition of PDMDAAC dissolved and decomposed TB-EPS, releasing bound water. Secondly, FeCl3 facilitated the reconstruction of fine sludge into a stable, larger particle size structure, reducing bound water. Finally, the addition of HCl induced cell lysis, releasing bound water, and transformed TB-EPS into S-EPS, further releasing bound water. Consequently, HCl addition maximized the release of bound water while maintaining a large sludge particle size. In summary, the quantity of TB-EPS and sludge particle size emerged as key factors influencing sludge deep dehydration. PN in TB-EPS played a major role in sludge dewatering, with the N–H functional group identified as the key factor affecting the water-holding properties of EPS.
3.5. Significance of sludge dewatering using PDMDAAC and FeCl3 under acidic condition
The large amount of waste sludge produced by the activated sludge process must be dewatered before final disposal. In this study, deep sludge dewatering was achieved under acidic condition through the use of PDMDAAC and FeCl3 as conditioning agents. Compared with conventional agents (polymeric FeCl3, polymeric aluminum chloride, and polyacrylamide etc.) that reduce sludge MC to 80%, this study can reduce the volume of sludge by half, and therefore, storage and transportation costs can be reduced by 50% or more. In addition, if the sludge is subsequently disposed of by incineration, the combustion calorific value can be enhanced by more than 20%. Therefore, this study provides a new idea for sludge reduction treatment and disposal. However, the process of sludge dewatering inevitably introduces chemical reagents into the sludge dewatering solution, especially the impact of PDMDAAC on the environment is still unclear, which will be a limiting factor for the application of this method.4. Conclusions
In this study, deep sludge dewatering at pH 3 was achieved through the use of PDMDAAC and FeCl3 as conditioning agents. Further analysis revealed a remarkable 70% reduction in the TB-EPS of the conditioned sludge, with the diminished fractions primarily consisting of PNs, specifically tryptophan and tyrosine proteins. Simultaneously, the absorption peaks of N–H and CC in TB-EPS saw a significant decrease. These findings highlight the importance of substantial TB-EPS reduction in enhancing sludge dewatering performance, with the N–H group in PNs identified as the key factor influencing the water-holding capacity of EPS. Furthermore, the particle size also plays a critical role in sludge dewatering. PDMDAAC contributes to a finer sludge, FeCl3 causes these fine particles to aggregate into larger sizes, and hydrochloric acid maximizes the release of bound water while maintaining the large particle size. This study presents an alternative method for achieving deep dewatering of residual sludge.
Conflicts of interest
There were no conflicts to declare.Acknowledgements
This work was supported by the Shaanxi Province key industry chain (group) project [Grant number 2022ZDLSF06-05], Shaanxi Province Key R&D Program Project [Grant number 2023-YBSF-596] and the Science and Technology Innovative Team Plan of Shaanxi Province [Grant number 2024RS-CXTD-51].Notes and references
- Z.-j Xu, J. Zhou, Y.-D. Liu, L.-F. Gu, J. Xu, C. Wu and X.-Y. Zhang, RSC Adv., 2018, 8, 38574–38581 RSC.
- L. Świerczek, B. M. Cieślik and P. Konieczka, J. Cleaner Prod., 2018, 200, 342–356 CrossRef.
- N. Lin, W. Zhu, X. Fan, C. Wang, C. Chen, H. Zhang, L. Chen, S. Wu and Y. Cui, Chemosphere, 2020, 249, 126108 CrossRef CAS PubMed.
- W. Yu, Y. Wan, Y. Wang, Y. Zhu, S. Tao, Q. Xu, K. Xiao, S. Liang, B. Liu, H. Hou, J. Hu and J. Yang, Environ. Res., 2021, 196, 110328 CrossRef CAS PubMed.
- X. Cao, R. He and M. Jia, Environ. Res., 2023, 239, 117226 CrossRef CAS PubMed.
- J. Hu, Z. Li, A. Zhang, S. Mao, I. R. Jenkinson and W. Tao, Environ. Res., 2020, 188, 109764 CrossRef CAS PubMed.
- X. Zhou, W. Jin, H. Chen, C. Chen, S. Han, R. Tu, W. Wei, S.-H. Gao, G.-J. Xie and Q. Wang, Water Sci. Technol., 2017, 76(9), 2427–2433 CrossRef CAS PubMed.
- B. Cao, T. Zhang, W. Zhang and D. Wang, Water Res., 2021, 189, 116650 CrossRef CAS PubMed.
- Y.-H. Zhou, H.-L. Zheng, B.-Y. Gao, Y.-P. Guab, X. Li, Z.-B. Liu and A. M. Jiménez, RSC Adv., 2017, 7, 28733–28745 RSC.
- H. Wei, J. Ren, A. Li and H. Yang, Chem. Eng. J., 2018, 349, 737–747 CrossRef CAS.
- D.-Q. He, H.-W. Luo, B.-C. Huang, C. Qian and H.-Q. Yu, Bioresour. Technol., 2016, 218, 526–532 CrossRef CAS PubMed.
- Q. Zhang, G. Cui, X. He, Z. Wang, T. Tang, Q. Zhao and Y. Liu, Environ. Res., 2022, 212, 113490 CrossRef CAS PubMed.
- S. He, L. Feng, W. Zhao, J. Li, Q. Zhao and L. Wei, Chem. Eng. J., 2023, 462, 142234 CrossRef CAS.
- W. Bi, M. Chen, C. Hu, H. Sun, S. Xu, J. Jiang, L. Wang, X. Li and J. Deng, J. Environ. Manage., 2023, 344, 118450 CrossRef CAS PubMed.
- H.-J. Kim, K. Chon, Y.-G. Lee, Y.-K. Kim and A. Jang, Environ. Res., 2020, 188, 109746 CrossRef CAS PubMed.
- D. He, M. Sun, B. Bao, J. Chen, H. Luo and J. Li, J Water Process Eng., 2022, 47, 102744 CrossRef.
- B. Wu, X. Dai and X. Chai, Water Res., 2020, 180, 115912 CrossRef CAS PubMed.
- L.-F. Wang, L.-L. Wang, W.-W. Li, D.-Q. He, H. Jiang, X.-D. Ye, H.-P. Yuan, N.-W. Zhu and H.-Q. Yu, Chem. Eng. Sci., 2014, 116, 228–234 CrossRef CAS.
- A. Li, C. Huang, X. Feng, Y. Li, H. Yang, S. Wang and J. Li, Environ. Res., 2022, 211, 113024 CrossRef CAS PubMed.
- M. Basuvaraj, J. Fein and S. N. Liss, Water Res., 2015, 82, 104–117 CrossRef CAS.
- J. Xing, Q. Tang, M. Gan, Z. Ji, X. Fan, Z. Sun and X. Chen, J. Environ. Manage., 2023, 332, 117403 CrossRef CAS PubMed.
- D.-Q. He, J.-Y. Chen, B. Bao, X.-L. Pan, J. Li, C. Qian and H.-Q. Yu, J. Environ. Sci., 2020, 88, 21–30 CrossRef CAS PubMed.
- C. Feng, T. Lotti, R. Canziani, Y. Lin, C. Tagliabue and F. Malpei, Sci. Total Environ., 2021, 753, 142051 CrossRef CAS PubMed.
- Z. Wei, D. Li, S. Li, T. Hao, H. Zeng and J. Zhang, Bioresour. Technol., 2023, 370, 128558 CrossRef CAS PubMed.
- W. Yang, L. Cheng, H. Liang, A. Xu, Y. Li, M. Nabi, H. Wang, J. Hu and D. Gao, J. Environ. Manage., 2023, 344, 118460 CrossRef CAS PubMed.
- S. Getahun, S. Septien, J. Mata, T. Somorin, I. Mabbett and C. Buckley, J. Environ. Manage., 2020, 261, 110267 CrossRef CAS PubMed.
- L.-F. Wang, C. Qian, J.-K. Jiang, X.-D. Ye and H.-Q. Yu, Environ. Pollut., 2017, 231, 1388–1392 CrossRef CAS PubMed.
- P. H. Nielsen, B. K. Frølund and K. Keiding, Appl. Microbiol. Biotechnol., 1996, 44, 823–830 CrossRef CAS PubMed.
- Y.-T. Lv, X. Chen, X. Zhang, Y. Li, Q. Lv, R. Miao, L. Nie and L. Wang, Chem. Eng. J., 2023, 454, 140314 CrossRef CAS.
- Z. Chen, W. Zhang, D. Wang, T. Ma and R. Bai, Water Res., 2015, 83, 367–376 CrossRef CAS PubMed.
- D. Ge, Y. Dong, W. Zhang, H. Yuan and N. Zhu, Sci. Total Environ., 2020, 733, 139146 CrossRef CAS PubMed.
- Z. Wang, H. Song, L. Song, Z. Yin, K. Hui, W. Gao and L. Xuan, Chemosphere, 2022, 306, 135484 CrossRef CAS PubMed.
- M. Citeau, O. Larue and E. Vorobiev, Water Res., 2011, 45(6), 2167–2180 CrossRef CAS PubMed.
- J. Yu, K. Xiao, H. Xu, Y. Li, Q. Xue, W. Xue, A. Zhang, X. Wen, G. Xu and X. Huang, Water Res., 2023, 235, 119866 CrossRef CAS PubMed.
- E. Neyens, J. Baeyens, R. Dewil and B. De Heyder, J. Hazard. Mater., 2004, 106(2), 83–92 CrossRef CAS PubMed.
- R. Zhang, Y. Mao and L. Meng, Sep. Purif. Technol., 2021, 276, 119359 CrossRef CAS.
- N. Chen, S. Tao, K. Xiao, S. Liang, J. Yang and L. Zhang, Chemosphere, 2020, 238, 124598 CrossRef CAS PubMed.
- Y. Liu and H. H. P. Fang, Crit. Rev. Environ. Sci. Technol., 2003, 33(3), 237–273 CrossRef CAS.
- Y. Zhang, B. Cao, R. Ren, Y. Shi, J. Xiong, W. Zhang and D. Wang, Sci. Total Environ., 2021, 801, 149753 CrossRef CAS PubMed.
- H. Li, J. Chen, J. Zhang, T. Dai, H. Yi, F. Chen, M. Zhou and H. Hou, J. Environ. Manage., 2022, 316, 115210 CrossRef CAS PubMed.
- K. Xiao, K. Pei, H. Wang, W. Yu, S. Liang, J. Hu, H. Hou, B. Liu and J. Yang, Water Res., 2018, 140, 232–242 CrossRef CAS PubMed.
- K. Xiao, G. Abbt-Braun and H. Horn, Water Res., 2020, 187, 116441 CrossRef CAS PubMed.
- Y. Chen, F. Bai, Z. Li, P. Xie, Z. Wang, X. Feng, Z. Liu and L.-Z. Huang, Chem. Eng. J., 2020, 383, 123165 CrossRef CAS.
- H. Wei, Y. Tang, A. Li and H. Yang, Chemosphere, 2019, 227, 269–276 CrossRef CAS PubMed.
- M. Raynaud, J. Vaxelaire, J. Olivier, E. Dieudé-Fauvel and J.-C. Baudez, Water Res., 2012, 46(14), 4448–4456 CrossRef CAS PubMed.
- B. Wu, H. Wang, W. Li, X. Dai and X. Chai, Water Res., 2022, 213, 118169 CrossRef CAS PubMed.
- X. Liu, Y. Zhai, Z. Xu, L. Liu, W. Ren, Y. Xie, C. Li, Y. Zhu and M. Xu, Chem. Eng. J., 2023, 457, 141106 CrossRef CAS.
- L. Yuan, Y. Li, T. Zeng, D. Wang, X. Liu, Q. Xu, Q. Yang, F. Yang and H. Chen, Chem. Eng. J., 2021, 411, 128465 CrossRef CAS.
- X. Y. Cao, Q. Y. Yue, L. Y. Song, M. Li and Y. C. Zhao, J. Hazard. Mater., 2007, 147(1), 133–138 CrossRef CAS PubMed.
- S. Hu, J. Hu, B. Liu, D. Wang, L. Wu, K. Xiao, S. Liang, H. Hou and J. Yang, Water Res., 2018, 145, 162–171 CrossRef CAS PubMed.
- M. S. Kim, K.-M. Lee, H.-E. Kim, H.-J. Lee, C. Lee and C. Lee, Environ. Sci. Technol., 2016, 50(13), 7106–7115 CrossRef CAS PubMed.
- R. Deng, J. Lai, Z. Liu, B. Song, H. Liu, D. Chen, G. Zuo, Z. Yang, F. Meng, T. Gong and M. Song, Chemosphere, 2023, 326, 138443 CrossRef CAS PubMed.
| This journal is © The Royal Society of Chemistry 2024 |