 Open Access Article
Solid state engineering of Bi2S3/rGO nanostrips: an excellent electrode material for energy storage applications†
Vijay B. Autadeab,
Kaustav Bhattacharjeeb,
Ranjit S. Kate b,
Sudhir S. Arbuj
 b,
Ramchandra S. Kalubarmeb,
Sanjay K. Apte*b,
Bharat B. Kale
 *c and
Sandeep A. Arote*a
aDepartment of Physics, S.N. Arts, D.J.M. Commerce and B.N.S. Science College (Autonomous), Sangamner, Ahmednagar, 422 605, M.S., India. E-mail: sandeeparote@sangamnercollege.edu.in
bNanocrystalline Laboratory, Centre for Material for Electronic Technology (CMET), Govt. of India, Panchawati, Off Pashan Road, Pune 411007, India
cMIT World Peace University (MIT-WPU), Paud Rd, Kothrud, Pune, Maharashtra 411038, India
First published on 16th April 2024
Abstract
The study presents a novel, one-pot, and scalable solid-state reaction scheme to prepare bismuth sulphide (Bi2S3)-reduced graphene oxide (rGO) nanocomposites using bismuth oxide (Bi2O3), thiourea (TU), and graphene oxide (GO) as starting materials for energy storage applications. The impact of GO loading concentration on the electrochemical performance of the nanocomposites was investigated. The reaction follows a diffusion substitution pathway, gradually transforming Bi2O3 powder into Bi2S3 nanostrips, concurrently converting GO into rGO. Enhanced specific capacitances were observed across all nanocomposite samples, with the Bi2S3@0.2rGO exhibiting the highest specific capacitance of 705 F g−1 at a current density of 1 A g−1 and maintaining a capacitance retention of 82% after 1000 cycles. The superior specific capacitance is attributed to the excellent homogeneity and synergistic relation between rGO and Bi2S3 nanostrips. This methodology holds promise for extending the synthesis of other chalcogenides-rGO nanocomposites.
1. Introduction
Currently, energy and environmental-related challenges capture global attention. To address the growing need for energy storage, considerable research efforts have been directed toward the development and usage of Lithium-ion batteries (LIB), fuel cells (FC), and supercapacitors (SC).1–3 SCs are distinct either from the traditional capacitors or batteries, capable of delivering higher power density, speedy charging, and relatively longer life-span riveting them as suitable candidates for a variety of energy storage applications.4–10The selection of electrode material for SC depends on the type of application in hand and often involves a trade-off between factors such as specific capacitance, energy density, and the cost of material synthesis and processing. Metal sulphides have emerged as a prominent class of SC material compared to the metal oxides due to their, (i) higher electronic conductivity (arising from the lower electronegativity of S-atom) allowing faster electron transfer during the charging–discharging cycles, (ii) larger pseudocapacitance (due to the reversible faradaic redox-reaction) behaviour that provides additional capacitive storage of energy, (iii) better cycling stability which leads to the long-term reliability, and (iv) higher energy density offering faster storage and release of energy for suitable application.11 To date, many metal-sulphides (metal = Co, Ni, Mo, Cu, Bi, etc.) are reported to have SC properties.12–16 Bismuth sulphide (Bi2S3) is one of the most versatile materials on the list having diverse applications in LIBs, SC, photocatalysis, and electrochemical conversion reaction.17–20
Several synthesis methods have been developed to produce nanostructured Bi2S3 materials including chemical vapor deposition (CVD), hydrothermal/solvothermal methods, template-directed procedures, and organometallic complex precursor decomposition techniques.21–24 To guarantee effective electron transport through the material (as required for SC application), researchers often design Bi2S3 nanocomposite systems mixed with carbon-based conducting substances.25–30 In contrast to the aforementioned synthesis approaches, a cost-effective method for large-scale material preparation must adhere to the solid-state route. Keeping the requirements for SC application in mind, herein, we have developed a one-pot solid-state reaction scheme to prepare Bi2S3@rGO nanocomposite materials from bismuth oxide (Bi2O3), thiourea (TU), and graphene oxide (GO) as the starting materials. The reaction scheme can be understood as a diffusion-substitution mechanism resulting in phase pure bismuth-sulphide nanomaterials. It is important to mention here that, the amount of GO used in this study is significantly lesser compared to the other reports.7,27 During the course of solid–solid phase transformation (from Bi2O3 to Bi2S3) with excess TU, the simultaneous reduction of GO to rGO increases both the electrochemical surface area and the contact region between Bi2S3 and rGO, in the nanocomposite. We showcase the characterization of the materials and then present the specific capacitance results of the nanocomposite materials and compare these values with both the pristine Bi2S3 sample and those reported by others.
2. Experimental
2.1. Materials
Analytical grade bismuth oxide (Bi2O3, BO), thiourea (CH4N2S, TU), potassium hydroxide (KOH), and graphene oxide (GO) powders were procured from Fisher Scientific and were used as received without further purification. Nickel foam, Ag/AgCl electrodes, and Pt-wire electrodes were purchased from Global Nanotech Company (Mumbai, India). Deionized water obtained from the Millipore water purification plant was used as a solvent throughout the synthesis process.2.2. One-pot solid-state synthesis of pristine Bi2S3
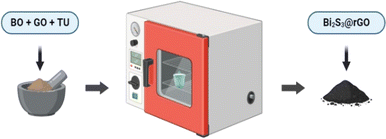
Pristine Bi2S3 powder was synthesized by a simple solid-state transformation of a one-pot mixture of BO and TU at sufficiently lower temperatures. In a typical method, the calculated amount of BO and TU powders were thoroughly mixed in an agar mortar and ground well for 15 min before being transferred into a porcelain crucible. Next, the crucible was covered with a porcelain lid and heat-treated at 140 °C in a hot-air oven. The precursor's amount, reaction temperatures, and reaction times were varied for the optimization of the synthesis process.2.3. Design of experiment and optimization of reaction parameters
The effect of the three process parameters namely, reaction temperature (A), reaction time (B), and precursors ratio (C), on the phase purity of the pristine Bi2S3 phase and thereby optimizing the same, was studied using response surface methodology (RSM). We used a central composite design (CCD) technique with three-factors (A, B, and C) and three-levels (−1, 0, and 1) classification which resulted in a total of 20 reaction trials, as formulated by design expert 13, tabulated in the Table S1, in the ESI.† Each sample was then examined for phase purity by XRD which was designated as the response (Y). In cases, where the phase pure Bi2S3 was obtained we labelled the response as 1, otherwise, we marked it as 0. All the responses are populated in Table S1.† A second-order polynomial equation was considered to fit the CCD results.| Yresponse = β0 + β1A + β2B + β3C + β12AB + β23BC + β13AC + β11A2 + β22B2 + β33C2 | (1) |
In the above equation, β0 represents the regression coefficient, βi is the linear coefficient, βii represents the quadratic coefficient, and βij denotes the interaction coefficient (i, j = 1, 2, 3). A, B, and C are the coded values of the parameters. Analysis of variance (ANOVA) for the chosen model was examined and finally, the optimization tests were performed.
![[thin space (1/6-em)]](https://www.rsc.org/images/entities/char_2009.gif) :
:![[thin space (1/6-em)]](https://www.rsc.org/images/entities/char_2009.gif) 6 mol ratio) thoroughly with calculated amount of GO powders in an agar mortar and transferred into a porcelain crucible to put into a hot-air oven at 140 °C for 16 h. After completion of the reaction, the final product was washed carefully with distilled water and ethanol several times. Finally, the reaction products were dried at 100 °C overnight in a vacuum oven to obtain the final nanocomposite powders. As a control experiment, GO and TU powders were mixed (with a 1
6 mol ratio) thoroughly with calculated amount of GO powders in an agar mortar and transferred into a porcelain crucible to put into a hot-air oven at 140 °C for 16 h. After completion of the reaction, the final product was washed carefully with distilled water and ethanol several times. Finally, the reaction products were dried at 100 °C overnight in a vacuum oven to obtain the final nanocomposite powders. As a control experiment, GO and TU powders were mixed (with a 1![[thin space (1/6-em)]](https://www.rsc.org/images/entities/char_2009.gif) :
:![[thin space (1/6-em)]](https://www.rsc.org/images/entities/char_2009.gif) 6 mol ratio) and similarly heat-treated at 140 °C for 16 h.
6 mol ratio) and similarly heat-treated at 140 °C for 16 h.
2.4. Characterization
The thermochemistry of the solid–solid reaction was monitored by Differential Scanning Calorimetry (DSC Q10 V9.9 Build303, US instrument) in a temperature range of 30–300 °C with a ramp rate of 5° per min in air. The phase analyses of the synthesized samples were performed by X-ray diffractometer (XRD-D8, Advance, Bruker-AXS) using Cu-Kα radiation (λ = 1.5418 Å) in the 2θ range of 10–80° with step size 0.02. Surface morphology analyses and microstructural study of the samples were performed using Field Emission Scanning Electron Microscopy (FESEM; Hitachi, S-4800 II) and Transmission Electron Microscopy (TEM; FE-TEM Philips EM-CM-12) at an operating voltage of 5 kV and 200 kV, respectively. Laser Raman spectroscopy was carried out using a Lab RAM HR800 from JY Horiba equipped with a 532 nm He–Ne Laser radiation. All electrochemical measurements were performed by Auto Lab (model PGSTAT 30, eco-chemie) work station.2.5. Electrochemical measurement
The electrochemical properties of the pristine and the nanocomposite samples were investigated using a three-electrode cell configuration in the 6 M KOH aqueous electrolyte solution. In each case, the sample material was used as the working electrode while, Ag/AgCl electrode was used as the reference electrode and platinum wire as the counter electrode. The working electrode was prepared by mixing the prepared sample with acetylene black and polyvinylidene fluoride in a mass ratio of 8![[thin space (1/6-em)]](https://www.rsc.org/images/entities/char_2009.gif) :
:![[thin space (1/6-em)]](https://www.rsc.org/images/entities/char_2009.gif) 1
1![[thin space (1/6-em)]](https://www.rsc.org/images/entities/char_2009.gif) :
:![[thin space (1/6-em)]](https://www.rsc.org/images/entities/char_2009.gif) 1, blended with a few drops of N-methyl-2-pyrrolidone. The slurry mixture was then coated onto the Ni-foam (NF) substrate. Finally, the as-fabricated electrode was left to vacuum dry in an oven at 80 °C for 24 h. The mass loading density of the active material in all electrodes was calculated using weight difference method and found about 1–1.5 mg cm−2. A potential window ranging from −0.2 to −0.85 was chosen for the cyclic voltammetry (CV) measurements and galvanometric charge–discharge tests. The electrochemical impedance spectroscopy (EIS) measurements were conducted over a frequency range of 0.01 Hz to 100 kHz with an AC potential amplitude of 5 mV. All electrochemical characterizations were conducted under room temperature conditions.
1, blended with a few drops of N-methyl-2-pyrrolidone. The slurry mixture was then coated onto the Ni-foam (NF) substrate. Finally, the as-fabricated electrode was left to vacuum dry in an oven at 80 °C for 24 h. The mass loading density of the active material in all electrodes was calculated using weight difference method and found about 1–1.5 mg cm−2. A potential window ranging from −0.2 to −0.85 was chosen for the cyclic voltammetry (CV) measurements and galvanometric charge–discharge tests. The electrochemical impedance spectroscopy (EIS) measurements were conducted over a frequency range of 0.01 Hz to 100 kHz with an AC potential amplitude of 5 mV. All electrochemical characterizations were conducted under room temperature conditions.
3. Results & discussion
3.1. Optimization of pristine Bi2S3 synthesis parameters using response surface methodology
Each of the 20 samples obtained from the CCD trial runs was thoroughly analysed by XRD to identify the crystallographic phases present in the final products. The obtained diffraction patterns are compared with the standard JCPDS files using X′ Pert High Score Plus software. The detailed design of experiments, analysis of variance (ANOVA) test, and optimization of solutions were shown in the ESI, Section S1.† From Table S1,† the formation of phase pure Bi2S3 phase was detected in the trial run 1, 11, 18, and 20. Multiple regression models were tried to perform the ANOVA tests and a quadratic polynomial model was selected for accurately describing our experimental results. The estimated values obtained from the model fitting are summarized in Table S2.† From Table S2,† the obtained model F-value of 71.34 implies the model is significant and the P-values less than 0.0500 indicate the model terms (in this case A, C, AC, A2, and C2) are important. The fit statistics are displayed in Table S3, in the ESI (ESI)† indicating the predicted R2 of 0.8840 is in reasonable agreement with the adjusted R2 of 0.9709. Fig. S1a† shows the normalised probability plot of the studentized residuals and Fig. S1b† shows the correlation between the predicted and actual values of the response. Fig. S2† shows various interaction effects among the process parameters using a 3D surface plot, where one of the parameters is fixed at a particular value while the other two are allowed to vary. From the curvature of the surface plots presented in Fig. S2,† it is concluded that the interaction between temperature (A) and precursors ratio (C) is the most vital of all. Optimized calculation (a list of constraints for the optimization method is given in Table S4, in the ESI†) has predicted a total of 100 possible solutions for the reaction parameters, as described in Table S5, in the ESI.† From Table S5,† the most significant of them was selected as the best conditions for the phase pure Bi2S3 synthesis, which are ∼140 °C temperature, ∼13 h reaction time, and ∼1![[thin space (1/6-em)]](https://www.rsc.org/images/entities/char_2009.gif) :
:![[thin space (1/6-em)]](https://www.rsc.org/images/entities/char_2009.gif) 6 BO to TU molar ratio.
6 BO to TU molar ratio.
3.2. Formation of pristine Bi2S3 from Bi2O3 precursor using XRD and DSC studies
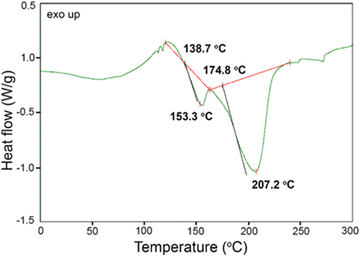
The conversion of the BO phase into the Bi2S3 phase in the presence of TU using solid-state reaction is involved at a temperature below the melting points of both components. The precursor BO powder was first thoroughly analysed by XRD technique (Fig. S3, in the ESI†). Two different polymorphs of BO, such as alfa (monoclinic type) and beta (cubic type) were identified by X'Pert High Score Plus software. The whole XRD profile was then refined by the Rietveld method to quantify corresponding phases and to analyze their crystal lattice structures (Fig. S3, in ESI†). A major portion of the alfa phase (91.2%) with a small amount of beta (8.8%) phase was measured. From the refinement, a considerable amount of deficiency in the oxygen site occupancy factors was found for the BO powder. The solid–solid reaction between the precursor powders can be highly complex with the possibility for multiple dynamical components operating at the same time. It is known that imperfection in the host crystal lattice facilitates the diffusion of incoming ions/molecules during the solid-state reaction. To understand the effect of heat treatment, we have performed a DSC study of the powder mixture in the temperature range 30–300 °C, as shown in Fig. 2. The broad endothermic valley in the temperature range 30–100 °C, signifies the loss of water molecules and/or volatile compounds physisorbed to the precursor powders. TU starts decomposing at a temperature range of 120–140 °C into an active sulphidation agent (H2S) and cyanamide (NH2CN) according to eqn (2). We posited that the presence of excess TU in the synthetic melt of BO-TU probably lowers the melting temperature of TU by forming a eutectic mixture.31 The in situ formed sulphur source is then diffused through the solid BO particulates and results in solid–solid phase transition (from monoclinic BO to orthorhombic Bi2S3, according to eqn (3)) at a temperature range of 120–140 °C, detected as a broad exothermic peak in the DSC measurement. This is followed by the elimination of gaseous cyanamide molecules which are detected as an endothermic peak at 140–160 °C. Above 180 °C, the excess unreacted TU started melting which was captured as a strong endothermic peak at 180–220 °C in the corresponding DSC spectrum.The reactions are summarized as follows, Decomposition of TU:
| 3(NH2)2CS(s) = 3NH2CN(g) + 3H2S(g) | (2) |
Phase transition:
| Bi2O3(s) + 3H2S(g) = Bi2S3(s) + 3H2O(g) | (3) |
3.3. Crystal structure study of the Bi2S3@rGO nanocomposite
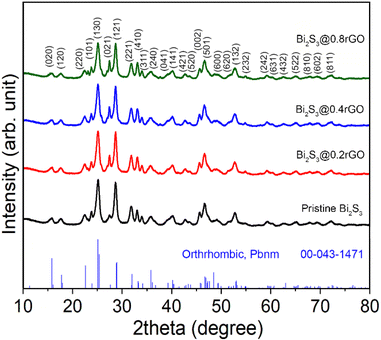
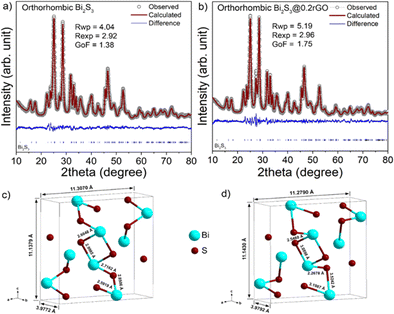
The XRD patterns of the nanocomposite samples synthesized with different rGO content (0.2, 0.4, and 0.8 wt%) are shown in Fig. 3. All the diffraction peaks are well matched with the orthorhombic Bi2S3 phase (space group, Pbnm) against the JCPDS card No. 00-043-1471. The XRD signal of rGO is overwhelmed by the presence of highly crystalline Bi2S3 peaks and hence remains undetected. However, by analyzing the XRD profile and Raman spectra of the sample (Fig. S4a and b, in the ESI†) we concluded that thiourea can reduce GO into rGO at the chosen experimental conditions. A noticeable fact we observed in the XRD patterns for the nanocomposite samples is that the relative intensity of the (021) plane keeps increasing with an increase in the GO content.The electrochemical measurements of the pristine Bi2S3 sample and all the as-synthesized Bi2S3@rGO nanocomposite were performed (results are shown in the ESI, see Fig. S5 and S6†). Comparing the results, we observed that all the nanocomposite samples show enhanced electrochemical performance for the pristine sample (288 F g−1 at 1 A g−1), particularly, the 0.2% sample (designated as Bi2S3@0.2rGO) shows the best values amongst the all. Therefore, we have carefully characterized and compared the Bi2S3@0.2rGO nanocomposite sample with pristine Bi2S3, henceforth, in the manuscript. Fig. 4 shows the Rietveld crystal structure refinement analyses (using MAUD32) of the two samples. In the refinement, Figure circles represent experimental points while the solid line represents Rietveld refined data. The reliability parameters (Rwp, Rexp, and GoF) for the fitting analyses are shown in the insets.
The resulting refined process achieved a very good match between the computed and observed patterns. The anisotropic size-strain model as proposed by Popa et al.33 was considered for fitting the microstructural properties of the Bi2S3@0.2rGO nanocomposite sample.33 The step-wise refined parameters are as follows, (1) background and scale parameters, (2) basic phase parameters, (3) microstructure (anisotropic size and strain), and (4) crystal structure (lattice parameters, occupancy, atomic coordinate, and isotropic displacement factors) parameters.
After the refinements, the crystallography information files (CIF) were generated from MAUD and imported into ‘Diamond’ software to visualize the refined crystal lattices. The metal–oxygen bond lengths were calculated and shown in Fig. 4c and d along with the two refined crystal lattices (orthorhombic, Space group: Pnma). A slight increase in the crystal lattice parameters and considerable changes in the Bi–S bond lengths were measured in the Bi2S3@0.2rGO nanocomposite.
3.4. Morphological study by FESEM and TEM
FESEM images of the precursor BO powder, the pristine Bi2S3, and the Bi2S3@0.2rGO nanocomposite samples are shown in Fig. 5. From the images (Fig. 5a and b) it is observed that the precursor BO powder has an arbitrary morphology with no specific size and shape.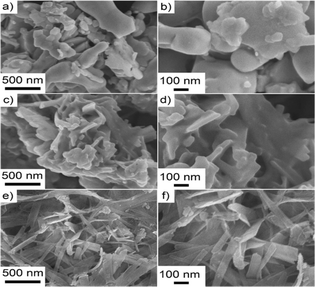 | ||
| Fig. 5 FESEM images of (a) and (b) precursor BO powder, (c) and (d) pristine Bi2S3, and (e) and (f) Bi2S3@0.2rGO nanocomposite samples. | ||
After the solid-state reaction, the pristine Bi2S3 powder shows a slightly elongated, rod-like morphology (Fig. 5c and d).
While, the Bi2S3@0.2rGO nanocomposite sample shows 2D nanostrip-like morphology (Fig. 5e and f). No separate rGO sheets are observed in the FESEM.
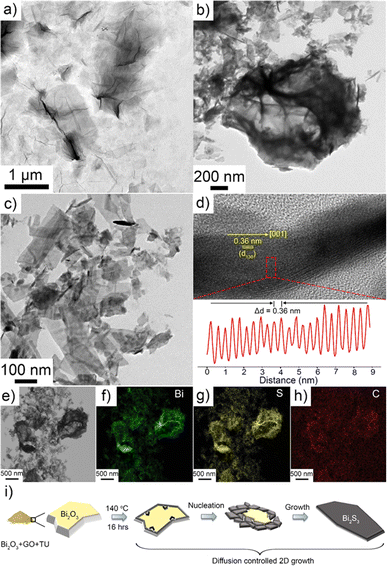
The structural and microstructural analyses of the Bi2S3@0.2rGO nanocomposite sample were further carried out by TEM and HRTEM respectively, as shown in Fig. 6. Fig. 6a shows the typical TEM image of the starting GO powder while Fig. 6b shows the aggregated structure of the Bi2S3@0.2rGO nanocomposite sample. The sheet-like material covering the particulates is considered as rGO. 2D-nanostrip morphology of Bi2S3 is visible in Fig. 6c.
A typical twisted Bi2S3 nanostrip is shown in the upper part of Fig. 6d. The HRTEM image of the nanostrips shows the single crystalline nature of the sample and the periodic arrangement of lattice fringes parallel to the growth axis, suggesting the nanostrip has [001] directional growth. Line profile analysis of the selected area of the nanostrip shown in the lower part of Fig. 6d was performed with the help of ImageJ software showing an average interplaner distance (Δd) of 0.36 nm, which corresponds to the (130) plane of orthorhombic Bi2S3. EDS elemental analyses were also performed for the Bi2S3@0.2rGO nanocomposite sample, as shown in Fig. 6e–h. Characteristic signals for Bi, S, and C were detected which were then mapped separately. The signal of carbon is detected due to the presence of rGO in the sample and from the background carbon film as well.
Based on the above discussion, we proposed the plausible growth mechanism of the Bi2S3 nanostrips in Fig. 6i. At first, BO, GO, and TU form an intimate physical mixture at room temperature upon grinding. The powder mixture was then heat treated at 140 °C for 16 h in an electric oven resulting in the formation of dark greyish nanocomposite powder. TU decomposes at this temperature range into H2S and acts as a fairly strong reducing agent, as well as the source of sulphur. The in situ generated sulphur source then diffuses through the solid BO particulates under a constant inward flux and results in solid–solid phase transition (from monoclinic BO to orthorhombic Bi2S3) and at the same time it reduces the oxygen-containing functionalities of GO to form rGO. Nucleation of layered Bi2S3 material starts from the surface of the solid particulate and as it grows according to the Wolf's construction of the orthorhombic crystal habit, anisotropic Bi2S3 nanostrips are formed. Mechanism-wise, the present scheme can be considered a diffusion-controlled 2D sacrificial growth process as reported earlier.
3.5. Raman study
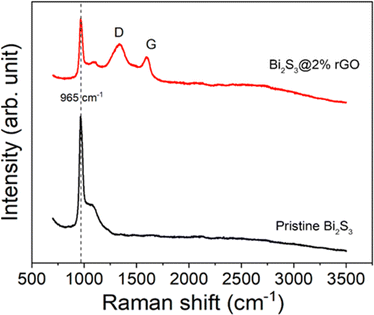
Raman spectra for the pristine Bi2S3 and Bi2S3@0.2rGO nanocomposite samples were recorded at room temperature in the range of 500–3000 cm−1 and are shown in Fig. 7. The D-band at 1335 cm−1 and the G-band at 1596 cm−1 of carbon-related material are visible in the Raman spectra of the Bi2S3@rGO nanocomposite.34The highly intense peak at ∼965 cm−1 in the Raman spectrum corresponds to Bi–S stretching vibration35 of the Bi2S3 phase. No additional peaks for Bi–O bond vibration corresponding to the Bi2O3 phase are detected, which approves the purity of Bi2S3 and the as-prepared Bi2S3@0.2rGO nanocomposite sample.
3.6. XPS study
XPS measurements were carried out for the Bi2S3@0.2rGO nanocomposite sample to study the chemical nature and oxidation states of various elements present at the surface of the material. As shown in Fig. 8a, the survey scan demonstrates the presence of C, Bi, S, N, and O elements in the nanocomposite.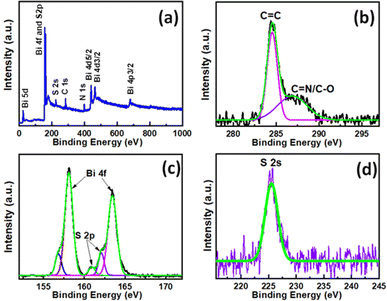 | ||
| Fig. 8 (a) XPS survey scan of the Bi2S3@0.2rGO nanocomposite sample. (b) Core level XPS spectra and deconvolution analyses for (b) C, (c) Bi, and (d) S. | ||
The peaks for Bi and S signify the occurrence of the Bi2S3 phase while peaks other than Bi and S are responsible for the presence of rGO functionalities in the nanocomposite sample. No characteristic peak for O is detected here, signifying the absence of the Bi2O3 phase or any oxygen-functionalities in the nanocomposite sample. High-resolution XPS scans were also performed in the core energy region of C, Bi, and S, as represented in Fig. 8b–d, respectively. Deconvolution of the C core-level spectrum generates peaks corresponding to the C![[double bond, length as m-dash]](https://www.rsc.org/images/entities/char_e001.gif) C and C
C and C![[double bond, length as m-dash]](https://www.rsc.org/images/entities/char_e001.gif) N/C–O bonds, which are characteristic of the minute amount of rGO functional moieties present in the sample. Deconvolution of the Bi–S core-level region results in the identification of Bi 4f5/2 and Bi 4f7/2 peaks with characteristic spin–orbit coupling of 5.3 eV, corresponding to the Bi3+ ion. This is accompanied by S 2p3/2 and S 2p1/2 at 161.0 eV and 162.3 eV, respectively, with characteristic spin–orbit coupling of 2.3 eV, corresponding to the S2− ion. S 2s orbital peak was observed at 225.3 eV, corresponding to the S2− ion.
N/C–O bonds, which are characteristic of the minute amount of rGO functional moieties present in the sample. Deconvolution of the Bi–S core-level region results in the identification of Bi 4f5/2 and Bi 4f7/2 peaks with characteristic spin–orbit coupling of 5.3 eV, corresponding to the Bi3+ ion. This is accompanied by S 2p3/2 and S 2p1/2 at 161.0 eV and 162.3 eV, respectively, with characteristic spin–orbit coupling of 2.3 eV, corresponding to the S2− ion. S 2s orbital peak was observed at 225.3 eV, corresponding to the S2− ion.
3.7. BET surface area study
Fig. 9a and b show the typical nitrogen adsorption–desorption isotherms for the pristine Bi2S3 and Bi2S3@0.2rGO nanocomposite samples, respectively. The specific surface area is calculated according to the Brunauer–Emmett–Teller (BET) equation.36
 | (4) |
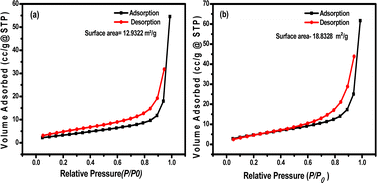 | ||
| Fig. 9 BET surface area measurement analysis for, (a) pristine Bi2S3, and (b) Bi2S3@0.2rGO nanocomposite sample. | ||
3.8. Electrochemical study
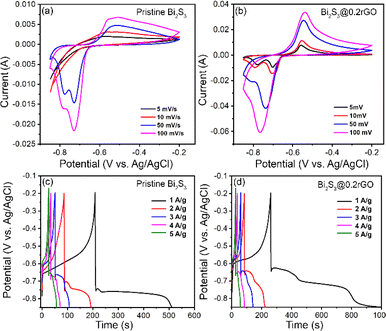
The electrochemical studies were performed using a three-electrode cell configuration set-up where the as-synthesized pristine Bi2S3 and all the Bi2S3@rGO nanocomposite samples were separately studied as the working electrodes. The electrode fabrication technique is already elaborated in the characterization section. Fig. 10a and b represent the CV curves of the pristine Bi2S3 and Bi2S3@0.2rGO samples at scan rate 5–100 mV s−1 within a potential range of −0.85 to −0.2 V in 6 M KOH electrolyte. CV curves in Fig. 10a and b show the well-resolved redox peaks indicating the capacitance characteristics are mainly governed by faradaic redox reactions. Moreover, compared with pristine Bi2S3, Bi2S3@0.2rGO nanocomposite exhibits relatively larger current responses at the same scan rates, showing higher capacitance. The redox peaks for Bi2S3@0.2rGO are symmetric at the scan rate of 1 mV s−1, indicating good redox reactions. However, the minor shift in the oxidation and reduction peaks in Fig. 10b with an increase in scan rate implies the irreversibility of the redox reaction in the Bi2S3@0.2rGO nanocomposite sample. The possible reaction mechanism between Bi2S3 and the OH− ions in the KOH electrolyte is as follow:37| Bi2S3 + OH− ↔ Bi2S3OH + e− | (5) |
Fig. 10c and d shows the GCD curves of the pristine Bi2S3 and Bi2S3@0.2rGO nanocomposite samples at different current densities (1–5 A g−1) in the range of −0.85 to −0.2 V.
GCD curves depict the non-linear discharge curves with multiple segments for both samples at various current densities. Interestingly, the Bi2S3@0.2rGO nanocomposite sample displays a longer plateau at a lower current density (A g−1) than pristine Bi2S3, indicating a higher capacitance value. During discharging, a sharp potential drop is observed at first which is related to the internal resistance of the active material, then follows a prolonged discharge plateau associated with the pseudocapacitive behavior of the electrode.38 The specific capacitance values were calculated from the respective discharge curves using the following equation:
| Csp = (I × Δt)/(m × ΔV) | (6) |
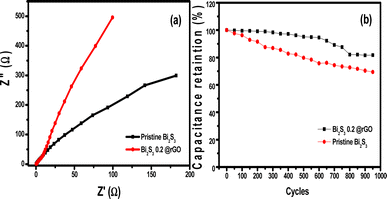 | ||
| Fig. 11 (a) Nyquist plots of pristine Bi2S3 and Bi2S3@0.2rGO (b) Cyclic stability of the pristine Bi2S3 and Bi2S3@0.2rGO nanocomposite at 1 A g−1. | ||
Nyquist plots show less semi-circular curves leading to obtained lesser charge-transfer resistance that is favorable for supercapacitor materials. The mass and charge transfer areas can be identified by a straight line in the low-frequency region and a quasi-semicircle in the high-frequency region. Amongst the prepared nanocomposites, Bi2S3@0.2rGO possesses the largest slope, which infers that it has the lowest Warburg impedance. Fig. 11b compares the cycle performances of the pristine Bi2S3 and Bi2S3@0.2rGO nanocomposite samples at the current density of 1 A g−1. Between both the samples, Bi2S3@0.2rGO confirms the good cycle performance with a capacitance retention of 81% after 1000 cycles, whereas the pristine Bi2S3 possesses 76% capacity retention after 1000 cycles.
The results obtained are in good agreement with the previously reported results.7,28 Table 1 shows a comparison between the electrochemical performances of the as-synthesized Bi2S3@0.2rGO nanocomposite with the previously reported data. It is to be noted that the present work showed excellent electrochemical performance even for a very small amount (0.2%) of GO in the nanocomposite, as compared to the earlier report, which as more than 15% rGO (Table 1). The better electrochemical performance for Bi2S3@0.2rGO is attributed to the increased effective surface area and the synergistic relation between rGO and Bi2S3. Fig. S7† illustrates the synergistic interaction between rGO and Bi2S3.
| Sr. no. | Electrode materials | Bi2S3/rGO wt% | Synthesis method | Morphology | Specific capacitance (at 1 A g−1) | Stability cycles | Ref. |
|---|---|---|---|---|---|---|---|
| 1 | Bi2S3-rGO | 32% | Hydrothermal | Nanorods | 396 F g−1 | 100 | 7 |
| 2 | Bi2S3/FGS | 16% | Hydrothermal | Nanosheets | 292 F g−1 | 5000 | 29 |
| 3 | Bi2S3 | Nil | Solvothermal | Hollow microtubes | 532 F g−1 | 3000 | 15 |
| 4 | Bi2S3 | Nil | Solvothermal | — | 432 F g−1 | 1000 | 39 |
| 5 | Bi2S3 | Nil | Solvothermal | Nanoparticles | 342 F g−1 | 500 | 37 |
| 6 | Bi2S3/rGO | 2% | One pot precipitation | Nanorods | 290 F g−1 | 500 | 28 |
| 7 | Bi2S3/C-3 | 24% | Hydrothermal | Nanospheres | 419 F g−1 | — | 40 |
| 8 | sg-C3N4/Bi2S3 | 43% | Coprecipitation/calcination | Porous morphology | 670 F g−1 | 3000 | 41 |
| 9 | Bi2S3/rGO | 0.18% | Solid state | Nanostrips | 705 F g−1 | 1000 | This work |
As depicted in the figure, the CV curve of Bi2S3@0.2rGO at a scan rate of 50 mV s−1 displays distinct redox peaks when compared to the GO and pristine Bi2S3 counterparts, indicating efficient electron transfer within the materials.
4. Conclusion
In summary, we present a scalable one-pot solid-state method for the preparation of Bi2S3@rGO nanocomposites designed for supercapacitor applications. The process involves a low-temperature diffusion-controlled growth of an orthorhombic crystal habit featuring the 2D nanostrip morphology of the as-synthesized Bi2S3 particles. The incorporation of rGO enhances the effective surface area and establishes a synergistic relationship with Bi2S3 nanostrips. The nanocomposite materials after synthesis, were consecutively processed and applied as the working electrode for conducting the CV, GCD, and EIS measurements. The superior specific capacitance (705 F g−1 at 1 A g−1), excellent cyclic stability, and significant capacitance retention (81%) validate the suitability of the fabricated Bi2S3@0.2rGO nanocomposites as electrode material for supercapacitor applications.Author contributions
(1) Vijay B Autade-performed experiments, analysed data, data interpretation, writing the paper. (2) Kaustav Bhattacharjee-design of experiments, analysis of results, writing the paper. (3) Ranjit S. Kate-analysed data, data interpretation, writing the paper. (4) Sudhir S. Arbuj-resources for characterization. (5) Sanjay K. Apte-conceptualization and supervision. (6) Ramchandra S. Kalubarme – resources for characterization. (7) Bharat B. Kale – investigation, writing the draft, editing. (8) Sandeep A. Arote – research and data interpretation, editing, overall supervision.Conflicts of interest
“There are no conflicts to declare”.Acknowledgements
Vijay B. Autade is grateful to the Department of Science and Technology (DST, Nano Mission), India for the financial support (project no. DST/NM/NT/2021/02-1G-CMET). All the authors are thankful to C-MET, Pune for providing facilities.References
- V. Autade, S. Tekale, R. Kate, C. Mistari, M. More, S. Apte and B. Kale, Systematic synthesis of Bi2S3 nanoplates by template free solid-state approach and its field emission behaviour, Mater. Sci. Eng. B, 2023, 296, 116683 CrossRef CAS.
- P. Roy and S. K. Srivastava, Nanostructured anode materials for lithium ion batteries, J. Mater. Chem. A, 2015, 3, 2454–2484 RSC.
- A. M. Zardkhoshoui and S. S. H. Davarani, Ultra-high energy density supercapacitors based on metal–organic framework derived yolk–shell Cu–Co–P hollow nanospheres and CuFeS 2 nanosheet arrays, Dalton Trans., 2020, 49, 3353–3364 RSC.
- M. Cheng, H. Fan, Y. Song, Y. Cui and R. Wang, Interconnected hierarchical NiCo 2 O 4 microspheres as high-performance electrode materials for supercapacitors, Dalton Trans., 2017, 46, 9201–9209 RSC.
- J. Liu, M. Zheng, X. Shi, H. Zeng and H. Xia, Amorphous FeOOH quantum dots assembled mesoporous film anchored on graphene nanosheets with superior electrochemical performance for supercapacitors, Adv. Funct. Mater., 2016, 26, 919–930 CrossRef CAS.
- X. Zhai, J. Gao, X. Xu, W. Hong, H. Wang, F. Wu and Y. Liu, 3D interconnected Bi2S3 nanosheets network directly grown on nickel foam as advanced performance binder-free electrode for hybrid asymmetric supercapacitor, J. Power Sources, 2018, 396, 648–658 CrossRef CAS.
- G. Nie, X. Lu, J. Lei, L. Yang and C. Wang, Facile and controlled synthesis of bismuth sulfide nanorods-reduced graphene oxide composites with enhanced supercapacitor performance, Electrochim. Acta, 2015, 154, 24–30 CrossRef CAS.
- Y. J. Yang, Facile preparation of CuS-coated multiwalled carbon nanotubes for supercapacitor application: A study on the effect of electrolyte, Fullerenes, Nanotubes Carbon Nanostruct., 2017, 25, 497–503 CrossRef CAS.
- S. Najib and E. Erdem, Current progress achieved in novel materials for supercapacitor electrodes: mini review, Nanoscale Adv., 2019, 1, 2817–2827 RSC.
- A. K. Noordeen, S. Sambasivam, S. Chinnasamy, J. Ramasamy and T. Subramani, Hierarchical flower structured Bi 2 S 3/reduced graphene oxide nanocomposite for high electrochemical performance, J. Inorg. Organomet. Polym. Mater., 2018, 28, 73–83 CrossRef CAS.
- R. S. Kate, S. A. Khalate and R. J. Deokate, Overview of nanostructured metal oxides and pure nickel oxide (NiO) electrodes for supercapacitors: A review, J. Alloys Compd., 2018, 734, 89–111 CrossRef CAS.
- X. Rui, H. Tan and Q. Yan, Nanostructured metal sulfides for energy storage, Nanoscale, 2014, 6, 9889–9924 RSC.
- K.-J. Huang, J.-Z. Zhang, G.-W. Shi and Y.-M. Liu, One-step hydrothermal synthesis of two-dimensional cobalt sulfide for high-performance supercapacitors, Mater. Lett., 2014, 131, 45–48 CrossRef CAS.
- Z. Zhang, Z. Huang, L. Ren, Y. Shen, X. Qi and J. Zhong, One-pot synthesis of hierarchically nanostructured Ni3S2 dendrites as active materials for supercapacitors, Electrochim. Acta, 2014, 149, 316–323 CrossRef CAS.
- X. Yu, J. Zhou, Q. Li, W.-N. Zhao, S. Zhao, H. Chen, K. Tao and L. Han, Bi 2 S 3 nanorod-stacked hollow microtubes self-assembled from bismuth-based metal–organic frameworks as advanced negative electrodes for hybrid supercapacitors, Dalton Trans., 2019, 48, 9057–9061 RSC.
- Y. Ma, Y. Jia, L. Wang, M. Yang, Y. Bi and Y. Qi, One-pot synthesis of hierarchical Bi2S3-MoS2 nanosheet array with high electrochemical performance, J. Power Sources, 2017, 342, 921–928 CrossRef CAS.
- I. K. Durga, S. S. Rao, A. E. Reddy, C. V. Gopi and H.-J. Kim, Achieving copper sulfide leaf like nanostructure electrode for high performance supercapacitor and quantum-dot sensitized solar cells, Appl. Surf. Sci., 2018, 435, 666–675 CrossRef CAS.
- W. Chen, C. Xia and H. N. Alshareef, One-step electrodeposited nickel cobalt sulfide nanosheet arrays for high-performance asymmetric supercapacitors, ACS Nano, 2014, 8, 9531–9541 CrossRef CAS PubMed.
- H. Jung, C.-M. Park and H.-J. Sohn, Bismuth sulfide and its carbon nanocomposite for rechargeable lithium-ion batteries, Electrochim. Acta, 2011, 56, 2135–2139 CrossRef CAS.
- A. K. Rath, M. Bernechea, L. Martinez and G. Konstantatos, Solution-Processed Heterojunction Solar Cells Based on p-type PbS Quantum Dots and n-type Bi2S3 Nanocrystals, Adv. Mater., 2011, 23, 3712–3717 CrossRef CAS PubMed.
- Z. Fang, Y. Liu, Y. Fan, Y. Ni, X. Wei, K. Tang, J. Shen and Y. Chen, Epitaxial growth of CdS nanoparticle on Bi2S3 nanowire and photocatalytic application of the heterostructure, J. Phys. Chem. C, 2011, 115, 13968–13976 CrossRef CAS.
- Z. Liu, S. Peng, Q. Xie, Z. Hu, Y. Yang, S. Zhang and Y. Qian, Large-scale synthesis of ultralong Bi2S3 nanoribbons via a solvothermal process, Adv. Mater., 2003, 15, 936–940 CrossRef CAS.
- L. Cademartiri, F. Scotognella, P. G. O'Brien, B. V. Lotsch, J. Thomson, S. Petrov, N. P. Kherani and G. A. Ozin, Cross-linking Bi2S3 ultrathin nanowires: A platform for nanostructure formation and biomolecule detection, Nano Lett., 2009, 9, 1482–1486 CrossRef CAS PubMed.
- A. A. Tahir, M. A. Ehsan, M. Mazhar, K. U. Wijayantha, M. Zeller and A. Hunter, Photoelectrochemical and photoresponsive properties of Bi2S3 nanotube and nanoparticle thin films, Chem. Mater., 2010, 22, 5084–5092 CrossRef CAS.
- W. N. Kun, S. Mlowe, L. D. Nyamen, P. T. Ndifon, M. A. Malik, O. Q. Munro and N. Revaprasadu, Heterocyclic Bismuth (III) Dithiocarbamato Complexes as Single-Source Precursors for the Synthesis of Anisotropic Bi2S3 Nanoparticles, Chem. –A Euro. J., 2016, 22, 13127–13135 CrossRef CAS PubMed.
- A. K. Geim and K. S. Novoselov, The rise of graphene, Nat. Mater., 2007, 6, 183–191 CrossRef CAS PubMed.
- Z. Zhang, X. Liu, X. Qi, Z. Huang, L. Ren and J. Zhong, Hydrothermal synthesis of Ni 3 S 2/graphene electrode and its application in a supercapacitor, RSC Adv., 2014, 4, 37278–37283 RSC.
- S. Vadivel, A. N. Naveen, V. Kamalakannan, P. Cao and N. Balasubramanian, Facile large scale synthesis of Bi2S3 nano rods–graphene composite for photocatalytic photoelectrochemical and supercapacitor application, Appl. Surf. Sci., 2015, 351, 635–645 CrossRef CAS.
- H. Lu, Q. Guo, F. Zan and H. Xia, Bi2S3 nanoparticles anchored on graphene nanosheets with superior electrochemical performance for supercapacitors, Mater. Res. Bull., 2017, 96, 471–477 CrossRef CAS.
- K. Ghosh and S. K. Srivastava, Superior supercapacitor performance of Bi 2 S 3 nanorod/reduced graphene oxide composites, Dalton Trans., 2020, 49, 16993–17004 RSC.
- E. Martins and A. Abrão, Straightfforward Solid-Solid Synthesis of Metallic Sulfides, Extract of the 17° CBECIMat - Congresso Brasileiro de Engenharia e Ciência dos Materiais, 2006 Search PubMed.
- L. Lutterotti, Total pattern fitting for the combined size–strain–stress–texture determination in thin film diffraction, Nucl. Instrum. Methods Phys. Res. B, 2010, 268, 334–340 CrossRef CAS.
- N. Popa, The (hkl) dependence of diffraction-line broadening caused by strain and size for all Laue groups in Rietveld refinement, J. Appl. Crystallogr., 1998, 31, 176–180 CrossRef CAS.
- W. J. Li, C. Han, S. L. Chou, J. Z. Wang, Z. Li, Y. M. Kang, H. K. Liu and S. X. Dou, Graphite-Nanoplate-Coated Bi2S3 Composite with High-Volume Energy Density and Excellent Cycle Life for Room-Temperature Sodium–Sulfide Batteries, Chem. –A Euro. J., 2016, 22, 590–597 CrossRef CAS PubMed.
- L. Heshmatynezhad, F. Jamali-Sheini and A. Monshi, UV-assisted sonochemical synthesis and optoelectrical properties of Bi2S3/rGO nanocomposites, Ceram. Int., 2019, 45, 13923–13933 CrossRef CAS.
- H. Sun, G. Yang, J. Chen, C. Kirk and N. Robertson, Facile synthesis of BiSI and Bi 13 S 18 I 2 as stable electrode materials for supercapacitor applications, J. Mater. Chem. C, 2020, 8, 13253–13262 RSC.
- E. Miniach and G. Gryglewicz, Solvent-controlled morphology of bismuth sulfide for supercapacitor applications, J. Mater. Sci., 2018, 53, 16511–16523 CrossRef CAS.
- N. Devi, S. Ghosh and K. Mallick, Supercapacitive performance of highly dispersed bismuth sulfide nanoparticles in organic matrix: The role of sulphur source, Inorg. Chem. Commun., 2019, 103, 93–99 CrossRef CAS.
- C. Sambathkumar, V. Manirathinam, A. Manikandan, M. Krishna Kumar, S. Sudhahar and P. Devendran, Solvothermal synthesis of Bi 2 S 3 nanoparticles for active photocatalytic and energy storage device applications, J. Mater. Sci.: Mater. Electron., 2021, 32, 20827–20843 CrossRef CAS.
- X. Xu, S. Wu, Y. Liu, C. Liu, X. Sun, S. Tian, L. Wu, Y. Sun, Z. Wang and Q. Yang, Rational design of tubular-like NiMoO4· xH2O microspheres and ZIF-67 derived Bi2S3/C for asymmetric supercapacitor, J. Energy Storage, 2023, 62, 106869 CrossRef.
- H. A. El-Sabban, S. Y. Attia, M. Diab and S. G. Mohamed, Facile one-pot synthesis of template-free porous sulfur-doped g-C3N4/Bi2S3 nanocomposite as efficient supercapacitor electrode materials, J. Energy Storage, 2023, 60, 106593 CrossRef.
Footnote |
| † Electronic supplementary information (ESI) available. See DOI: https://doi.org/10.1039/d4ra01304b |
| This journal is © The Royal Society of Chemistry 2024 |

