
 Open Access Article
 This Open Access Article is licensed under a Creative Commons Attribution-Non Commercial 3.0 Unported Licence
The phase behavior of CO2 injection in shale reservoirs with nano-pores
Tao Wan *a,
Kun Dingb,
Qiyong Xiongb and
Jing Guoc
*a,
Kun Dingb,
Qiyong Xiongb and
Jing Guoc
aFaculty of Petroleum, China University of Petroleum (Beijing) at Karamay, China. E-mail: 2017592002@cupk.edu.cn; Fax: +86990 6633510; Tel: +86990-6633531
bXinjiang Oilfield Company, PetroChina, China
cChina University of Petroleum (Beijing), China
First published on 27th August 2024
Abstract
The main purpose of this paper is to study the solubility of CO2 in oil and water phase under high temperature and pressure. Firstly, CO2-crude oil PVT experiments were carried out to determine the physical parameters of the reservoir fluid in the study field in order to clarify the interaction mechanism of CO2 with the crude oil. Secondly, the solubility of CO2 in the reservoir fluid under different pores and the minimum mixed-phase pressure of the CO2–crude oil system were calculated by the improved Peng–Robinson equation of state. In this paper, the effects of nano-pores limitation on CO2 solubility were studied. The results show that pressure increase is favorable to CO2 dissolution, the solubility increases with the increase of the oil–water ratio. CO2 solubility decreases with temperature increase. The greater the mineralization of formation water, the lower the CO2 solubility. Nanopore confinement causes the phase envelope to contract and the minimum mixed-phase pressure to decrease. When the pore radius is smaller, the restriction of the phase envelope is stronger. In this paper, the minimum mixing pressure of crude oil and carbon dioxide is reduced from 31.25 MPa at 50 nm to 21.25 MPa at 5 nm, thus it is beneficial for enhanced oil recovery (CO2-EOR). Nanopore confinement favors CO2 to enhance shale oil recovery. The results of this study are critical to evaluate the effect of CO2 sequestration, solubility and phase behavior changes of CO2 in shale reservoirs with nano-pores.
1 Introduction
Shale oil is mature oil stored in shale formations with nanometer pore size and rich with organic matter. Efforts have been made in recent decades to improve oil recovery of unconventional shale reservoirs. Gas injection is one of the most used methods for shale oil production because of its high displacement efficiency.1,2 It is believed that CO2 tends to adhere to the shale surface and therefore has a higher adsorption capacity in shale reservoirs.3,4 CO2 adsorption is key to improving CO2 geological storage capacity. Previous studies have shown that reservoir fluids and reservoir thermodynamics affect CO2 adsorption capacity.5 Studies on the application of CO2 gas injection to unconventional shale reservoirs have shown that cyclic CO2 injection can greatly improve shale oil recovery rates.6,7 Early studies have shown that shale reservoirs are potential places for geological storage of CO2.8 With a serious environmental impact and long-term detrimental effect on the atmospheric balance caused by CO2 emissions in recent years, CO2 enhanced oil recovery (EOR) and storage of CO2 in the formation is undoubtedly an effective way to reduce carbon emissions. However, there are still many uncertainties regarding CO2 injection, such as complex phase behavior, hydraulic/natural fracture system, and geomechanically effects.There are three mechanisms for CO2 storage in saline aquifers: dissolution, mineralization, and gas capture. The literature shows that solubility trapping is more effective than mineralization. CCUS is one of the promising options for long-term storage of large quantities of CO2. Too much dissolved CO2 will change the chemical characteristics of the formation water. A previous study investigated the solubility of CO2 in formation water. The solubility of CO2 increased with the increase of pressure. When the temperature and pressure are constant, the solubility of CO2 decreases with the increase of formation water salinity. Therefore, the solubility of CO2 in aquifers is very important for the CCUS project.9
As the main recovery mechanism of CO2 enhanced oil recovery (EOR) is miscibility, Welker (1963) studied the solubility of CO2 in crude oil, and measured crude oil expansion factor and viscosity under different CO2 injection amounts.10 Results showed that the solubility of CO2 in crude oil was very high. The expansion factor and solubility of CO2 were positively correlated with pressure and negatively correlated with temperature. When crude oil has less heavy component contents, the solubility of CO2 in it is greater. Viscosity reduction effect caused by CO2 injection is more obvious when the viscosity of crude oil is higher. Therefore, the study on the solubility of CO2 in crude oil has a certain guiding significance for CO2 flooding enhanced oil recovery.
The fluid phase changes with the change in temperature and pressure during reservoir production. Depending on formation temperature and pressure, CO2 can be injected in gas, liquid or supercritical phases. Experimental testing of fluid PVT phase characteristics is an important step in the engineering design of CO2 flooding and storage. Suo (2021) conducted a series of CO2 displacement of water-saturated cores. The effect of different CO2 phase state, purity and pore structure on residual water was investigated.11 It is concluded that the larger viscosity of liquid CO2 will reduce the diffusion coefficient and lead to a longer breakthrough time. The storage capacity will be larger when the liquid phase CO2 is used for storage. The identification of the CO2 phase is an important guiding for cap leakage monitoring, CO2 effective storage evaluation, cap rock integrity.
The pore size of shales commonly ranges from 5 to 100 nm. The fluid phase behavior in the nano-pore of shales is complex, and the distribution of nano-pore sizes affects the phase equilibrium of the reservoir fluid, resulting in a reduction of the minimum miscible pressure (MMP). It has been pointed out that due to the nano-pore confining effect, the critical pressure and critical temperature of shale gas have changed, which is different from that of conventional formations. During gas injection process, phase equilibrium is crucial to determine the vapor–liquid equilibrium volume, swelling effect, gas solubility and minimum miscible pressure (MMP), where the influence of the nanoscale confining effect needs to be considered.12
The solubility of CO2 in crude oil is inseparably connected to the phase behavior.13 Therefore, it is of practical significance to study the phase behavior of reservoir fluid in nano pores during CO2 flooding. The combination of equations of state and capillary pressure has been explored to explain the effect of nano confining on the behavior of the fluid phase.14 The effects of nano pores, adsorption and diffusion on the condensate phase behavior were considered in the simulation process. Results showed that nano-confinement became significant when the pore size was less than or equal to 4 nm.
A survey of the literature found that pore geometry and wettability also affect fluid behavior. The porous medium of shale reservoirs is strongly non-homogeneous, and its pore geometry has a large impact on fluid transport. In conventional oil and gas reservoirs, the use of circular pore approximation to represent the pore type is reasonable in many applications, whereas in shale reservoirs, the pores have a large surface-to-volume ratio, and therefore fluid flow in shale systems depends more on the shape of the pores.15
Interfacial wettability affects the mass transfer process of a fluid in a solid–liquid phase transition, and a high degree of wettability promotes the mass transfer process. A change in the wetting angle affects the heat transfer process between the fluid and the solid. Stronger wettability means that the fluid is more likely to expand on the solid surface, which will change the flow pattern of the fluid.
1.1 Problem context and challenge
Most of the research on the solubility of CO2 in oil–water systems remains in single-phase oil and water.6 Nano-restriction effects lead to an inability to determine the phase behavior of reservoir fluids in shales under nano porosity.161.2 Research gap
In this study, we carried out indoor experiments and numerical simulations for the Jimsar shale oil field in Xinjiang, to investigate the solubility of CO2 in formation fluids under different formation conditions as well as the phase changes, the oil repelling effect of CO2 and the feasibility of CO2 sequestration in shale reservoirs, so as to provide preliminary theoretical support for selecting a more efficient development method and sequestration site. And it can provide a basis or computational model for dissolution sequestration.1.3 Main contributions
In this paper, the phase behavior of reservoir fluids are investigated by using four different oil samples. The solubility of CO2 in reservoir fluids was simulated and fitted the experimental results. The critical properties of components are used to represent the phase behavior of reservoir fluids in nano-pores. CMG-Winprop simulator was used to model the influence of nano-pore sizes on the solubility and phase behavior of CO2 during CO2 injection.The samples selected in this study are degassed crude oil from four horizontal wells in Jimsar Shale, Xinjiang. Since the large-scale development of Jimsar shale oil in 2018, the annual oil production of Jimsar shale oil has exceeded 500![[thin space (1/6-em)]](https://www.rsc.org/images/entities/char_2009.gif) 000 tons. However, due to high oil viscosity, complex distribution of nano-pore size, and petrophysical heterogeneity among different crudes, the solubility and phase behavior experiments of CO2–oil–water are carried out. The salinity of formation water in Jimsar is about 15000 mg L−1. The reservoir temperature is about 80 °C, and the reservoir pressure is about 40 MPa. The properties of crude oil components used in this research are shown in Table 1. The physical properties of crude oil are shown in Table 2, and the chemical composition of formation water is shown in Table 3.
000 tons. However, due to high oil viscosity, complex distribution of nano-pore size, and petrophysical heterogeneity among different crudes, the solubility and phase behavior experiments of CO2–oil–water are carried out. The salinity of formation water in Jimsar is about 15000 mg L−1. The reservoir temperature is about 80 °C, and the reservoir pressure is about 40 MPa. The properties of crude oil components used in this research are shown in Table 1. The physical properties of crude oil are shown in Table 2, and the chemical composition of formation water is shown in Table 3.
| Components | MW | Composition | |||
|---|---|---|---|---|---|
| J41H | JHW07121 | JHW5815 | JHW051 | ||
| CH4 | 16.043 | 9 × 10⁻⁹ | 9 × 10⁻⁹ | 9 × 10⁻⁹ | 9 × 10⁻⁹ |
| C2H6 | 30.07 | 9 × 10⁻⁹ | 9 × 10⁻⁹ | 9 × 10⁻⁹ | 9 × 10⁻⁹ |
| C3H8 | 44.097 | 0.0056 | 0.0051 | 0.0167 | 0.0058 |
| IC4 | 58.124 | 0.0041 | 0.0237 | 0.0112 | 0.0047 |
| NC4 | 58.124 | 0.0122 | 0.0212 | 0.0218 | 0.0143 |
| IC5 | 72.151 | 0.0646 | 0.0443 | 0.0613 | 0.0504 |
| NC5 | 72.151 | 0.0550 | 0.0350 | 0.0439 | 0.0435 |
| C6 | 86 | 0.0600 | 0.0516 | 0.0579 | 0.0519 |
| C7–C11 | 111.275 | 0.1325 | 0.1208 | 0.1418 | 0.1452 |
| C12–C19 | 214.522 | 0.2426 | 0.2394 | 0.2199 | 0.2394 |
| C20–C29 | 324.000 | 0.2423 | 0.2572 | 0.2333 | 0.2572 |
| C30+ | 609.365 | 0.1811 | 0.2017 | 0.1922 | 0.1876 |
| JHW051 | JHW5815 | JHW07121 | J41H | ||
|---|---|---|---|---|---|
| Density, (20 °C) g cm−3 | 0.9037 | 0.9001 | 0.8934 | 0.8834 | |
| Viscosity, mPa s | 20 °C | 487 | 286 | 203 | 83.2 |
| 80 °C | 68.3 | 65.3 | 47.5 | 24.7 | |
| Water type | PH | HCO3−(mg L−1) | Cl− (mg L−1) | SO42− (mg L−1) | Ca2+ (mg L−1) | Mg2+ (mg L−1) | Na+ (mg L−1) | K+ (mg L−1) |
|---|---|---|---|---|---|---|---|---|
| NaHCO3 | 8.0 | 3527.68 | 1146.2 | 177.3 | 17.72 | 7.06 | 2124.53 | 7000.49 |
2 Experiment and simulation
2.1 Experimental setup
The system shown in Fig. 1 was used in the experiment, which is composed of PVT cell determining phase behavior at high temperature and high-pressure, vacuum pumping system, PVT high-pressure viscometer, piston type accumulators, positive displacement pumps, syringe pump, gas sampling cylinder and gas flow meter. The experimental materials mainly used crude oil from four Lusaogou formation in Jimsar, ether, CO2 and N2, among this, ether and carbon dioxide and nitrogen with 99.99 percent purity. | ||
| Fig. 1 Experimental equipment system. | ||
2.2 Experimental procedures
Prior to conducting the experiments, the PVT instrument, pumps, accumulators and viscometer were cleaned with petroleum ether, and then dried with high-pressure nitrogen. The PVT chamber was vacuumed for 2 hours. Then, preheat the PVT instrument to formation temperature (80 °C). Crude oil was pumped into the PVT chamber by syringe pump. After stabilizing for a period of time, pressure, temperature and volume of fluid in the PVT chamber were recorded. CO2 was subsequently transferred to the PVT cylinder by the syringe pump through accumulators. Specially designed magnetic stirrer was equipped with on top of piston. Rotate the PVT cell so that CO2 can be fully dissolved in the crude oil.(1) Constant expansion experiment: a sample of CO2 dissolved reservoir fluid was placed in the PVT cell. Pressure of the PVT cell is raised above the formation pressure (40 MPa) to make sure that injected CO2 was completely dissolved in the crude oil. Temperature was set to reservoir temperature (80 °C). The PVT cell volume was then increased resulting in a decreased pressure. The cell volume and pressure were measured at each step of pressure reduction (such as 5 MPa). No gas or liquid is removed from the cell.
(2) Flash vaporization: pressurize the PVT cell to the reservoir pressure, and measure the fluid volume of the PVT cell. Maintain the pressure of the PVT cell equal to initial reservoir pressure, and transfer a certain amount of CO2–oil mixture from the PVT cell to the separator. Measure the volume and weight of released gas–oil mixture. Then calculate the bubble point pressure and gas–oil ratio.
(3) Viscosity measurement: PVT-viscometer was used to measure the high-pressure and high temperature reservoir fluids dissolved with CO2. Firstly, the viscometer was heated to reservoir temperature, then a certain volume of fully mixed reservoir fluid sample was transferred to the viscometer.
After one set of experiments was completed, PVT cell and viscometers were cleaned up with petroleum ether. Then the experiments were repeated with different CO2–oil ratios.
2.3 Simulation
CMG-Winprop can simulate the solubility of CO2 in oil and water phases with different levels of salinity and perform thermodynamic calculations. The mineralization of formation water is expressed by the NaCl concentration, Units of formation water can be specified prior to the calculation. The Henry's law constant is a function of pressure, temperature, and salinity, there are two correlations in Winprop to calculate the Henry's law constant, the correlation chosen for this chapter is the Harvey method. The Henry's constant for CO2 is calculated as follows:where
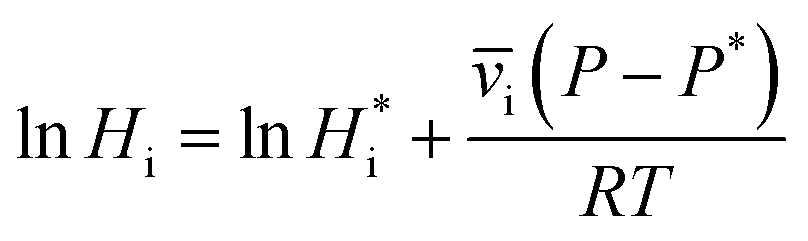
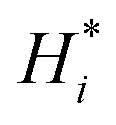 denotes the Henry's constant for component ‘i’ at reference pressure and temperature, and
 ![[v with combining macron]](https://www.rsc.org/images/entities/i_char_0076_0304.gif) i denotes the offset molar volume of component ‘i’.
i denotes the offset molar volume of component ‘i’.
From the above, the definition of the fugacity coefficient can be introduced, the fugacity coefficient is an uncaused quantity that measures the degree of fugacity offset pressure of a real fluid. From this, combined with Henry's law, the solubility of the gas component in the aqueous phase can be expressed as:
| xi = fi/Hi |
Due to the nano-pore confining effect, the critical pressure and critical temperature of fluids in the pores have changed, which is different from that of conventional formations. In the simulation process, the change of fluid components' critical properties was calculated by the correlations used by Lopez et al. (2018).17 The change of critical temperature was calculated by the correlation proposed by Zarragoicoechea and Kuz.18 The relative critical temperature shift with the quadratic ratio of the Lennard-Jones collision diameter to the throat radius:

σLJ is the Lennard-Jones (LJ) collision diameter which was calculated based on the volumetric critical properties of each component:
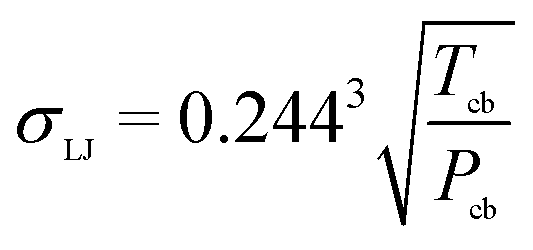
Pcb and Tcb are the critical pressure and critical temperature of each component in normal state, respectively. The critical pressure change simulation was improved:
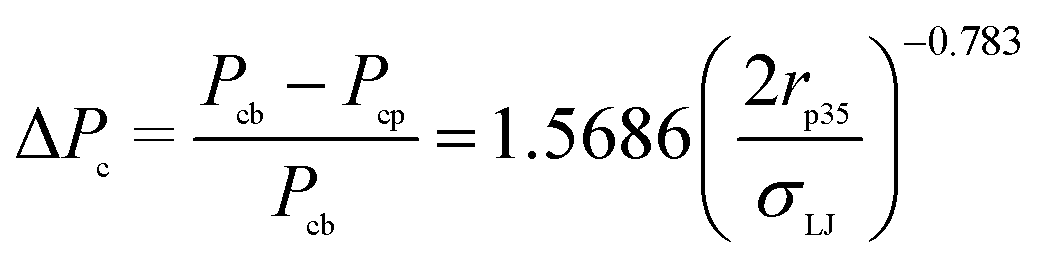
| Components | Pc (atm) | Tc (K) | σLJ (nm) | Pcp (atm) | Tcp (K) |
|---|---|---|---|---|---|
| H2O | 217.6 | 647.3 | 0.350918 | 192.822 | 605.3251 |
| CO2 | 72.8 | 304.2 | 0.393006 | 63.74146 | 282.1565 |
| CH4 | 45.4 | 190.6 | 0.393622 | 39.74393 | 176.7672 |
| C2H6 | 48.2 | 305.4 | 0.451506 | 41.51408 | 280.0533 |
| C3H8 | 41.9 | 369.8 | 0.504244 | 35.56285 | 335.6185 |
| IC4 | 36 | 408.1 | 0.548123 | 30.18759 | 367.1906 |
| IC5 | 33.4 | 460.4 | 0.585041 | 27.72501 | 411.2354 |
| C6 | 32.46 | 507.5 | 0.610125 | 26.76041 | 451.0572 |
| C7–C11 | 28.377 | 577.772 | 0.666272 | 23.03898 | 507.8091 |
| C12–C19 | 17.716 | 726.245 | 0.841323 | 13.71539 | 616.2318 |
| C20–C29 | 12.40 | 822.449 | 0.987692 | 9.224989 | 677.3358 |
| C30+ | 8.678 | 913.673 | 1.150851 | 6.189957 | 726.9363 |
The critical nature of the components affects the solubility of carbon dioxide in the fluid, and the Fig. 2 and 3 show the variation of carbon dioxide solubility with the critical temperature and critical pressure of the fluid components respectively.
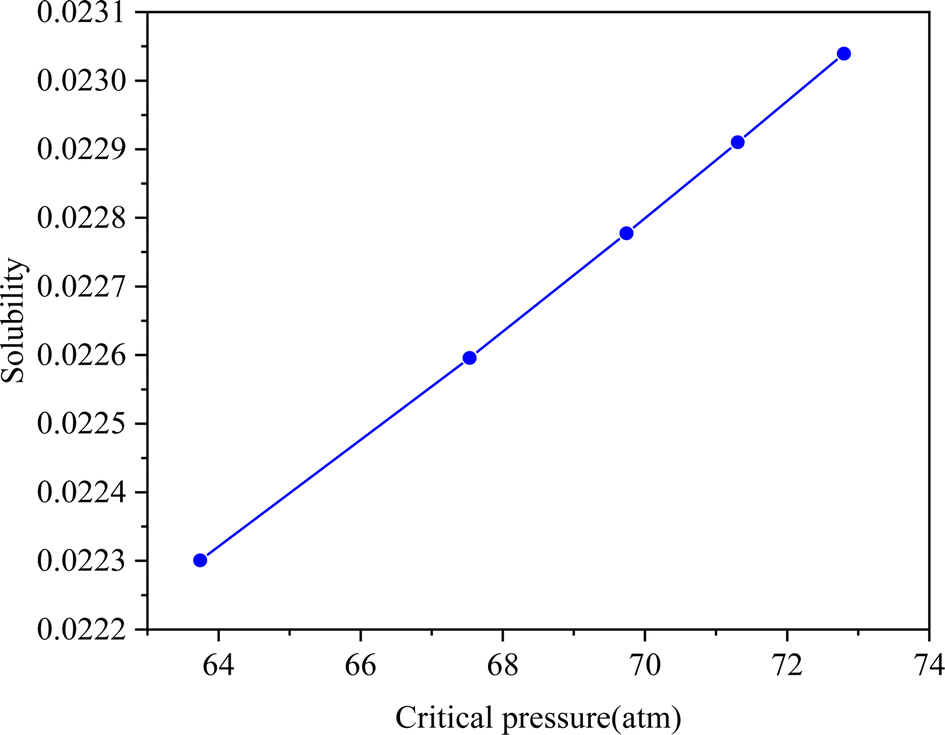 | ||
| Fig. 2 Variation of carbon dioxide solubility with critical pressure. | ||
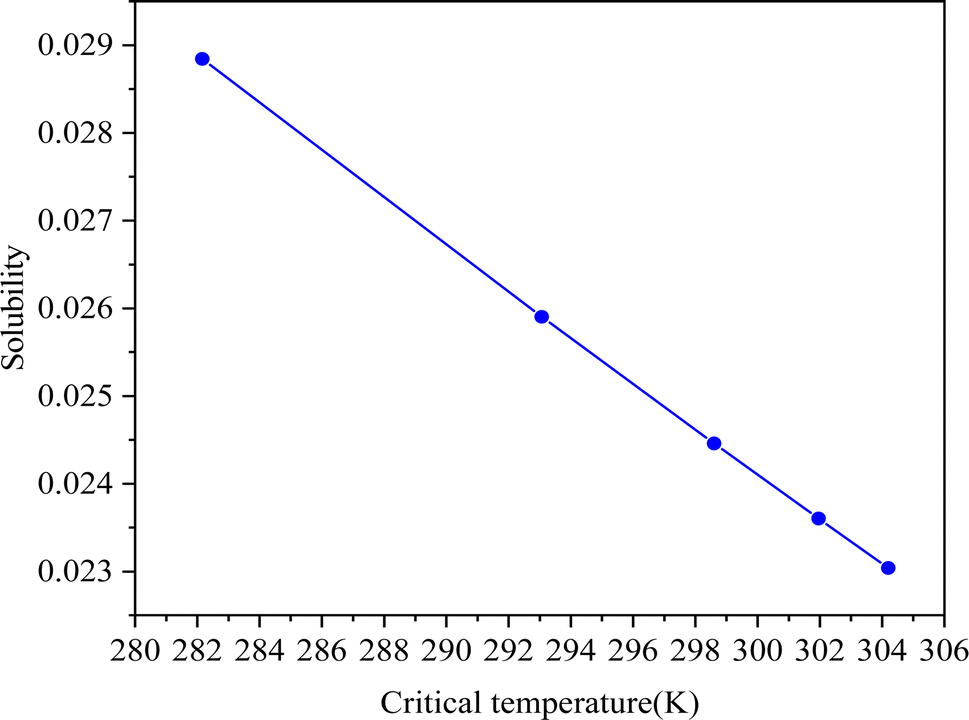 | ||
| Fig. 3 Variation of carbon dioxide solubility with critical temperature. | ||
3 Results and discussion
3.1 Phase behavior of reservoir fluid-CO2 by PVT test
Shale oil samples presented in Table 1 was used to investigate the phase behavior of CO2–oil interaction. Four oil samples from Xinjiang shale oil reservoirs were used for CO2–oil–water phase behavior in the experimental processes, as shown in Fig. 4. CO2 dissolved in crude oil can significantly change the properties of the crude oil, especially oil formation volume and viscosity, which can reduce the flow resistance of crude oil. In this paper, different CO2–oil ratios were conducted to measure the changes in crude oil viscosity, expansion factor, bubble point pressure and oil density.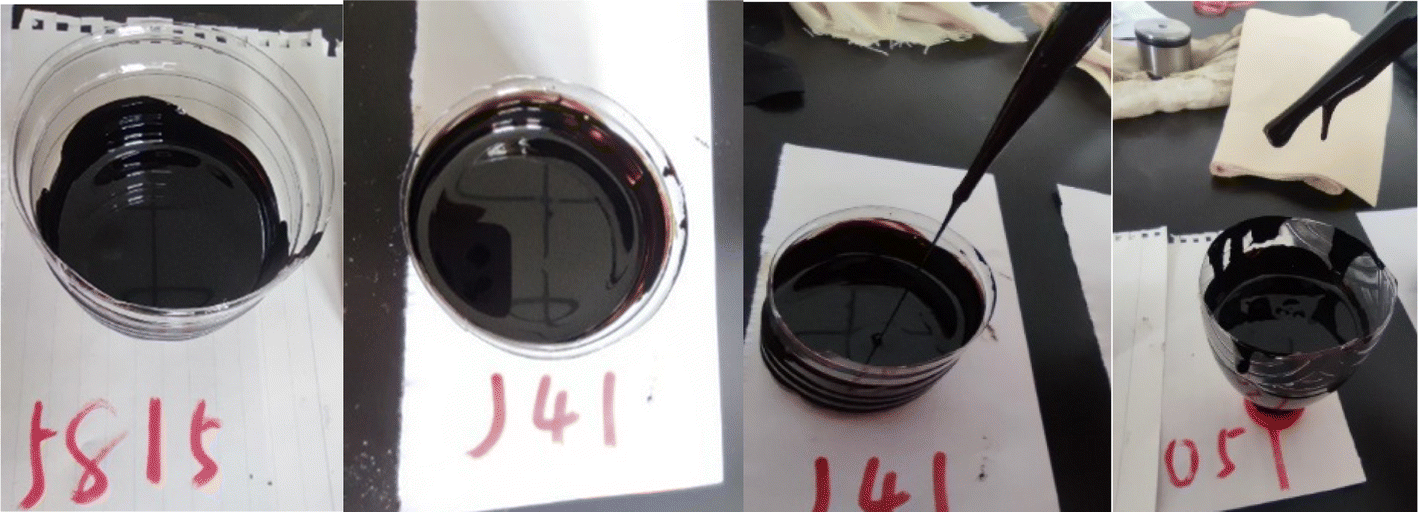 | ||
| Fig. 4 Shale oil from Xinjiang were used in the experimental processes. | ||
Fig. 5 shows the relationship of fluids volume variations with pressure at different gas–oil ratios when oil saturation is 100%. Fig. 6 shows the relationship between relative volume and pressure at different oil saturations. It can be seen from Fig. 5 that with the increase of gas–oil ratio, the bubble point pressure of crude oil continues to rise. From Fig. 6, it is observed that the bubble point pressure is decreased with an increase of oil saturation. The rationale behind this is that is more preferably dissolved in oil than water, thus fluid with a lower oil saturation has a higher bubble point pressure.
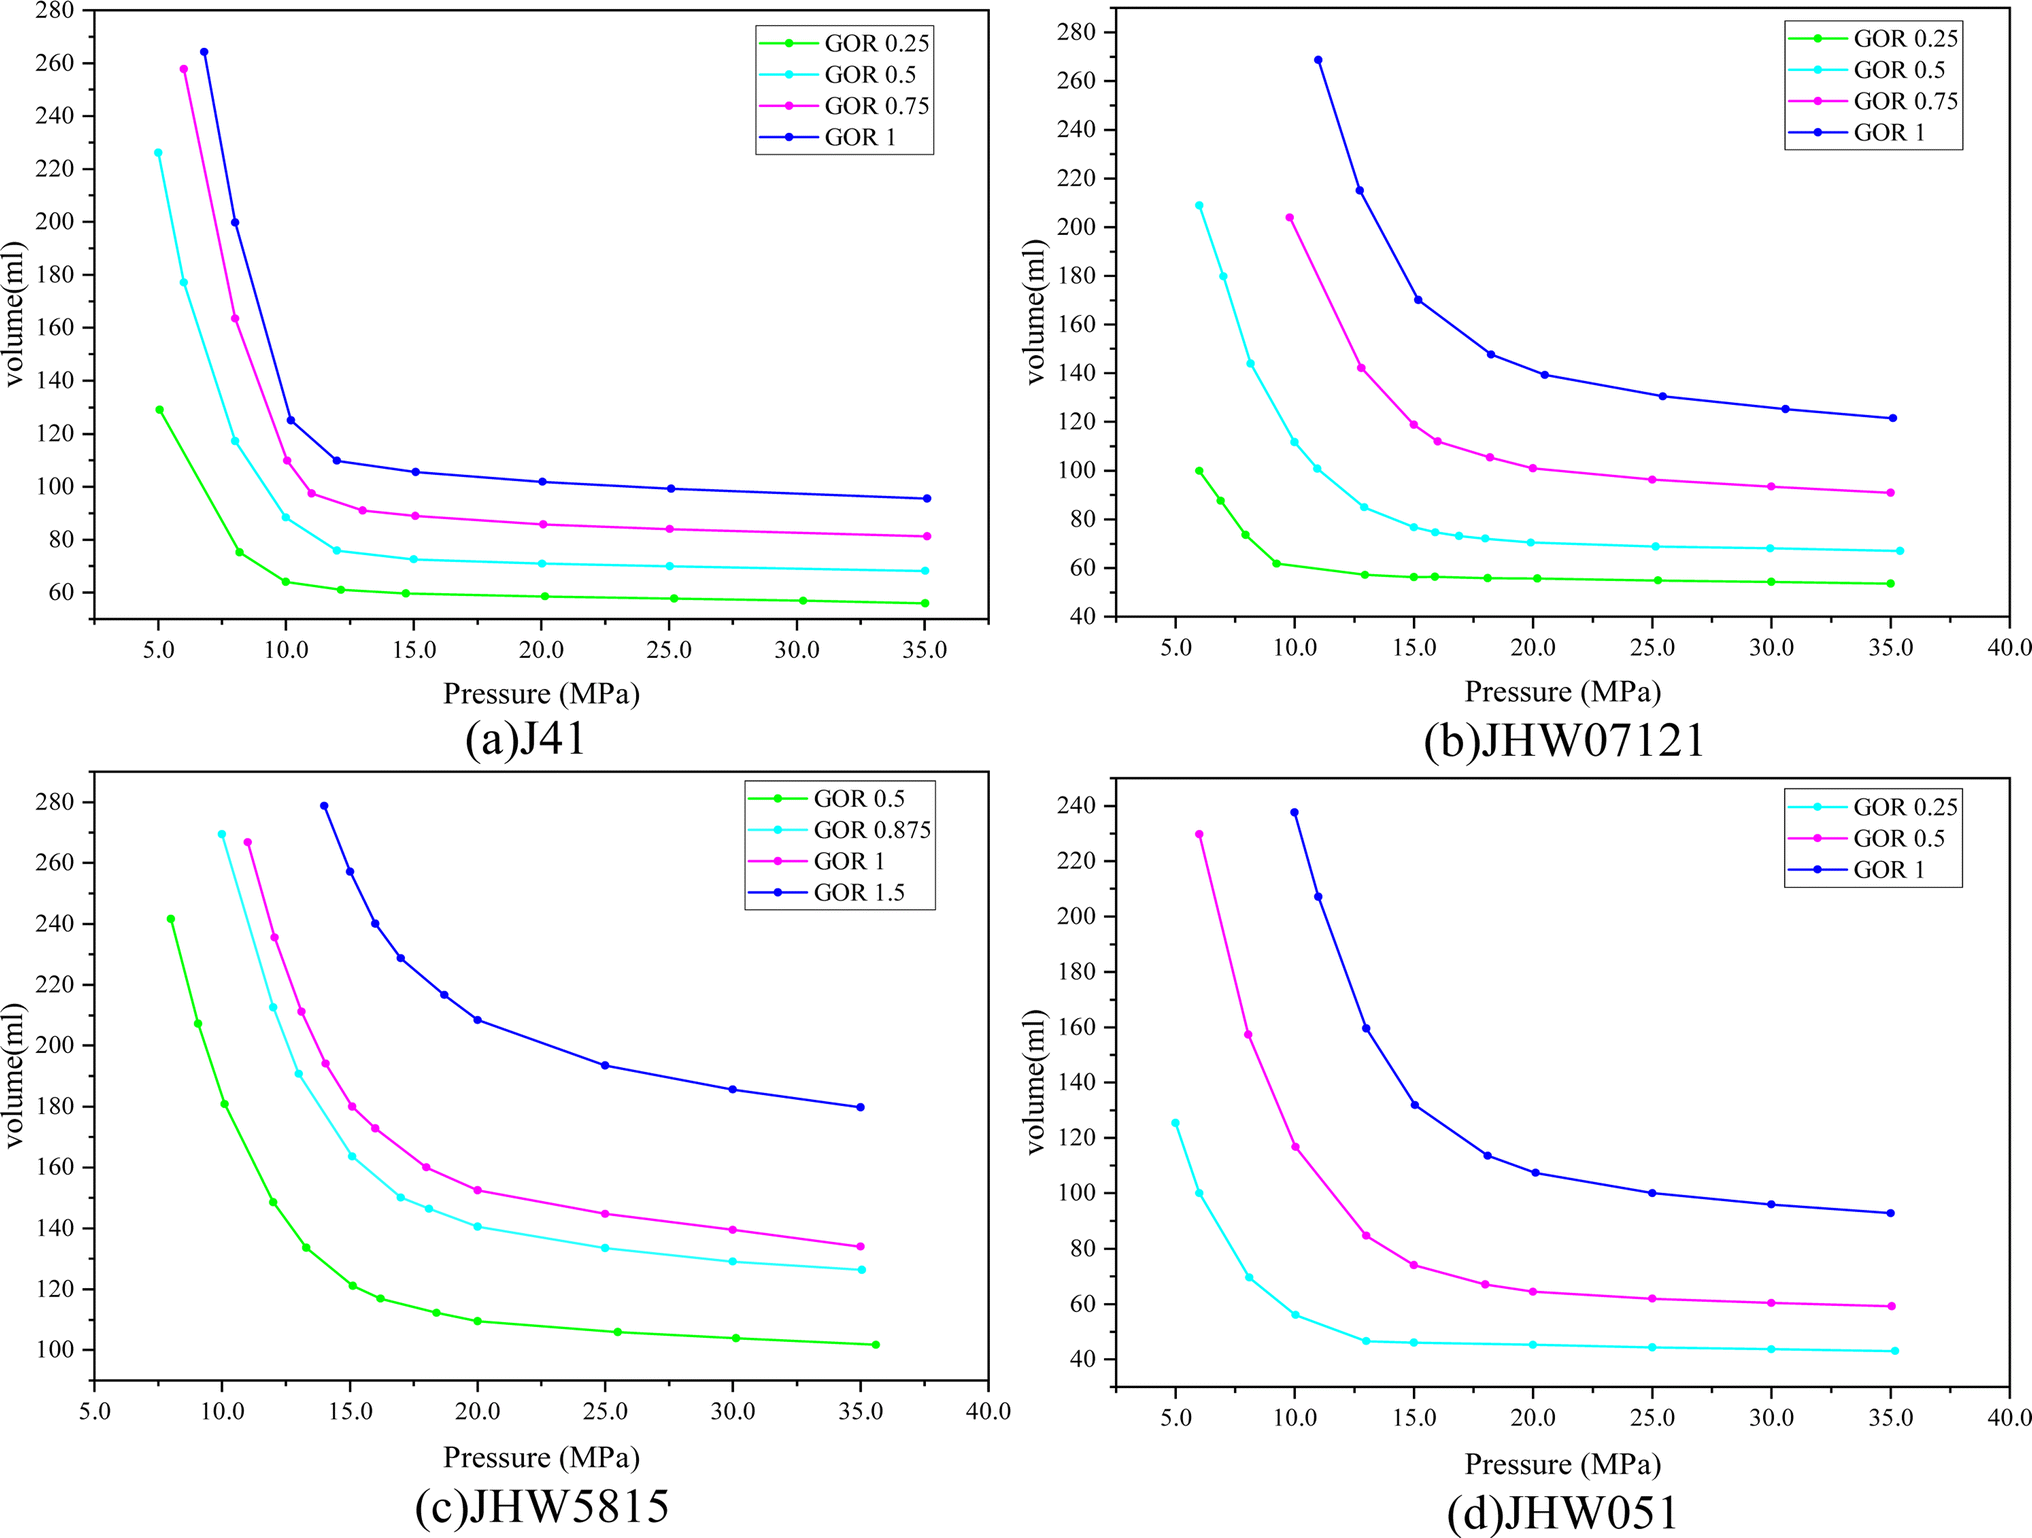 | ||
| Fig. 5 P–V relationship under different gas–oil ratios for different wells: (a) J41, (b) JHW07121, (c) JHW5815, (d) JHW051. | ||
 | ||
| Fig. 6 The relationship between relative volume and pressure under different oil saturation: (a) J41, (b) JHW5815. | ||
Fig. 7 shows the variation of saturation pressures of the CO2–crude oil system with the amount of CO2 injection. It can be seen that the saturation pressure of the well JHW051 shale oil–CO2 system is the highest, indicating that CO2 is more easily separated to form gas–liquid two phases in the production process of this well. That is because the viscosity of JHW051 oil is the heaviest, the saturation pressure is greater, and the solubility of CO2 in crude oil is smaller. The viscosity of J41 is the smallest, meanwhile the saturation pressure is the smallest. The ratio of light components to heavy components is high for crude oil of J41, which makes it easier for CO2 to form miscibility with oil. It can be seen from these four wells that with the increase of CO2 injection volume, the saturation pressures of the system also increase.
 | ||
| Fig. 7 Saturation pressure of CO2–crude oil system changes with CO2 injection. | ||
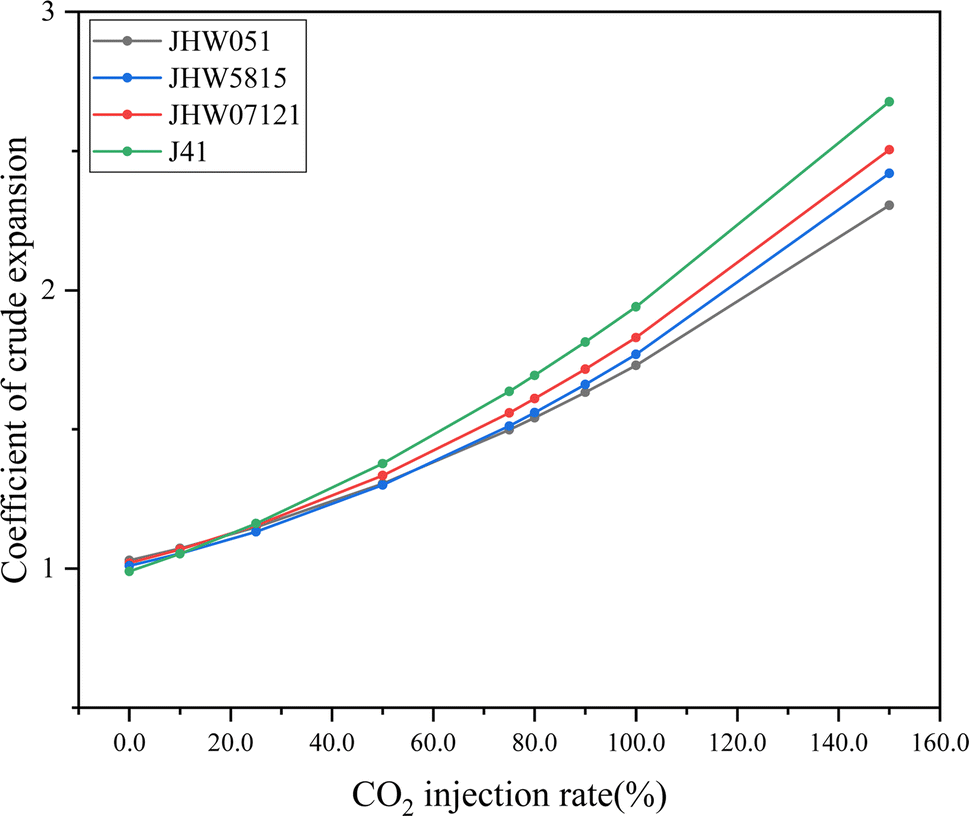
Fig. 8 shows the variation of crude oil expansion coefficient with CO2 injection volume. As can be seen from the figure, the expansion coefficient of crude oil increases with the increase of CO2 injection volume. The crude oil expansion coefficient of J41 is the largest, and that of JHW051 is the smallest. It suggests that CO2 has a strong expansion capacity in crude oil, and the expansion factor is nearly twice after CO2 injection.
 | ||
| Fig. 8 Variation of crude oil expansion coefficient with CO2 injection volume. | ||
Fig. 9 shows the change of crude oil viscosity with the amount of CO2 injection. As can be seen from the figure, CO2 injection has a renounced viscosity reduction effect in the early injection stage. After CO2 injection exceeds 50% injection volume, the crude oil viscosity contains decrease, but the decline rate decreases with CO2 injection. The viscosity of each crude oil decreased by more than 70%, It can be concluded that CO2 has a very good viscosity reduction effect on crude oil. As CO2 is dissolved in the crude oil, the lighter components are extracted, which leads to a reduction in the viscosity of the crude oil. The decreasing trend of J41 crude oil viscosity is gentler due to the fact that J41 crude oil has a higher content of lighter components, and is more miscible with CO2.
 | ||
| Fig. 9 Variation of crude oil viscosity with CO2 injection. | ||
Crude oil components of Jimsar shale oil in Table 1 was used to simulate the phase behavior with CO2 injection. CMG's WINPROP was employed to calculate the phase behavior and fluid properties of the flowing fluid at reservoir temperature and pressure. Fig. 10 shows the comparing results of numerical simulation with experimental results. It is seen that the regression values of the relative volume have good agreement with the experimental values, and the overall deviations are less than 5%.
 | ||
| Fig. 10 Numerical model validation by regression with experimental results for different wells: (a) J41, (b) JHW07121, (c) JHW5815, (d) JHW051. | ||
3.2 Solubility change of CO2 under conventional conditions
After CO2, oil and water injection process is completed, magnetic stirring is activated to ensure CO2 was fully dissolved into the liquid system. The pressure of PVT chamber will continue to decrease as the dissolution proceeds. After the CO2 gas and liquid phases reach equilibrium, stirring will be stopped. If the pressure no longer changes, record the equilibrium pressure Pe and corresponding equilibrium volume Ve. The liquid volume Vl can be directly observed from the chamber.
Fig. 11 shows the change of the solubility of CO2 at different water salinity from 5000 to 25000 mg L−1 at different temperatures. When the temperature and the mineralization of the water are kept constant, the solubility of CO2 in water shows a gradual increase with increasing pressure, but the magnitude of the increase in CO2 solubility gradually decreases.
 | ||
| Fig. 11 The effect of salinity on CO2 solubility in water at different temperatures: (a) 50 °C, (b) 60 °C, (c) 70 °C, (d) 80 °C. | ||
Fig. 12 shows the change of solubility of CO2 with temperature in water with a salinity from 5000 to 25000 mg L−1. As you can see from the graph, when the pressure and mineralization are certain, the solubility of CO2 shows a gradual decrease with increasing temperature; when the pressure and temperature are constant, the solubility of CO2 in water decreases with increasing mineralization. With the increasing temperature, the magnitude of the change of CO2 solubility with temperature also decreases gradually. When the temperature and pressure were kept constant, the solubility of CO2 decreased with the increase of water mineralization, and the greater the pressure, the greater the difference in the solubility of CO2 in the water of different mineralization strata, indicating that the effect of water mineralization on the solubility of CO2 was more obvious under high pressure.
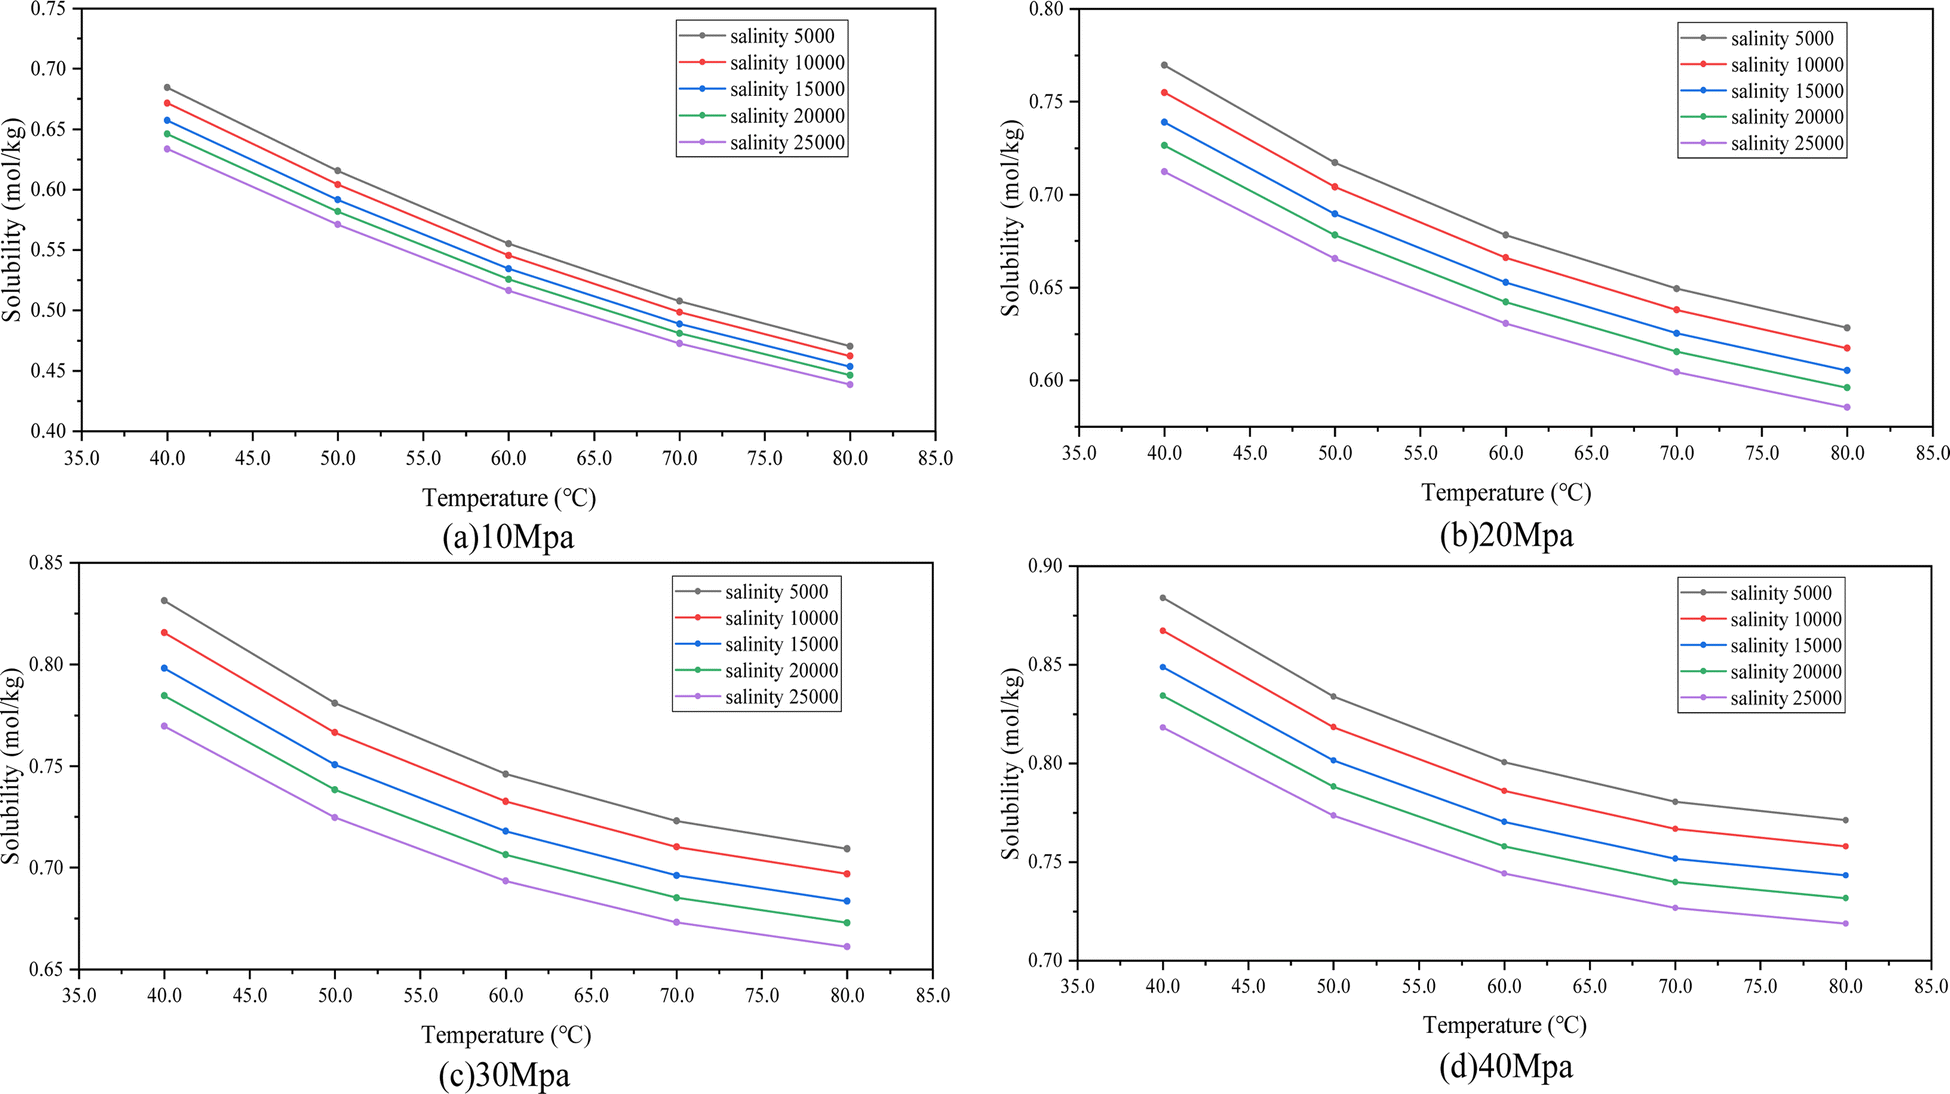 | ||
| Fig. 12 The effect of temperature on CO2 solubility in water at different pressures: (a) 10 MPa, (b) 20 MPa, (c) 30 MPa, (d) 40 MPa. | ||
Elevated pressure increases the density of gas molecules and the frequency of collisions between gas molecules and solvent molecules, which is conducive to the dissolution of CO2. An increase in temperature accelerates the movement of solvent molecules, leading to an increase in the frequency of collisions, the gas molecules are surrounded by solvent molecules at a slower rate, and solubility is consequently reduced. Since CO2 dissolves in water mainly in ionic form, when the mineralization of the formation water is greater, the ionic concentration in the water is higher, leading to a decrease in CO2 solubility.
It can be concluded that the solubility of CO2 in water is affected by reservoir pressure, reservoir temperature and formation water salinity.
:1, 1:1 and 1:2 oil–water ratios. The influence of pressure on the solubility of CO2 follows the similar trend as CO2 solubility in water. With the increase of injection pressure, the solubility of CO2 in oil–water mixture increases as well. When the oil–water ratio is 2:1, the solubility of CO2 in the oil–water mixture is the highest. When the oil–water ratio is 1:2, the solubility of CO2 is the lowest. It is preferably for CO2 to be dissolved in shale oil than water.
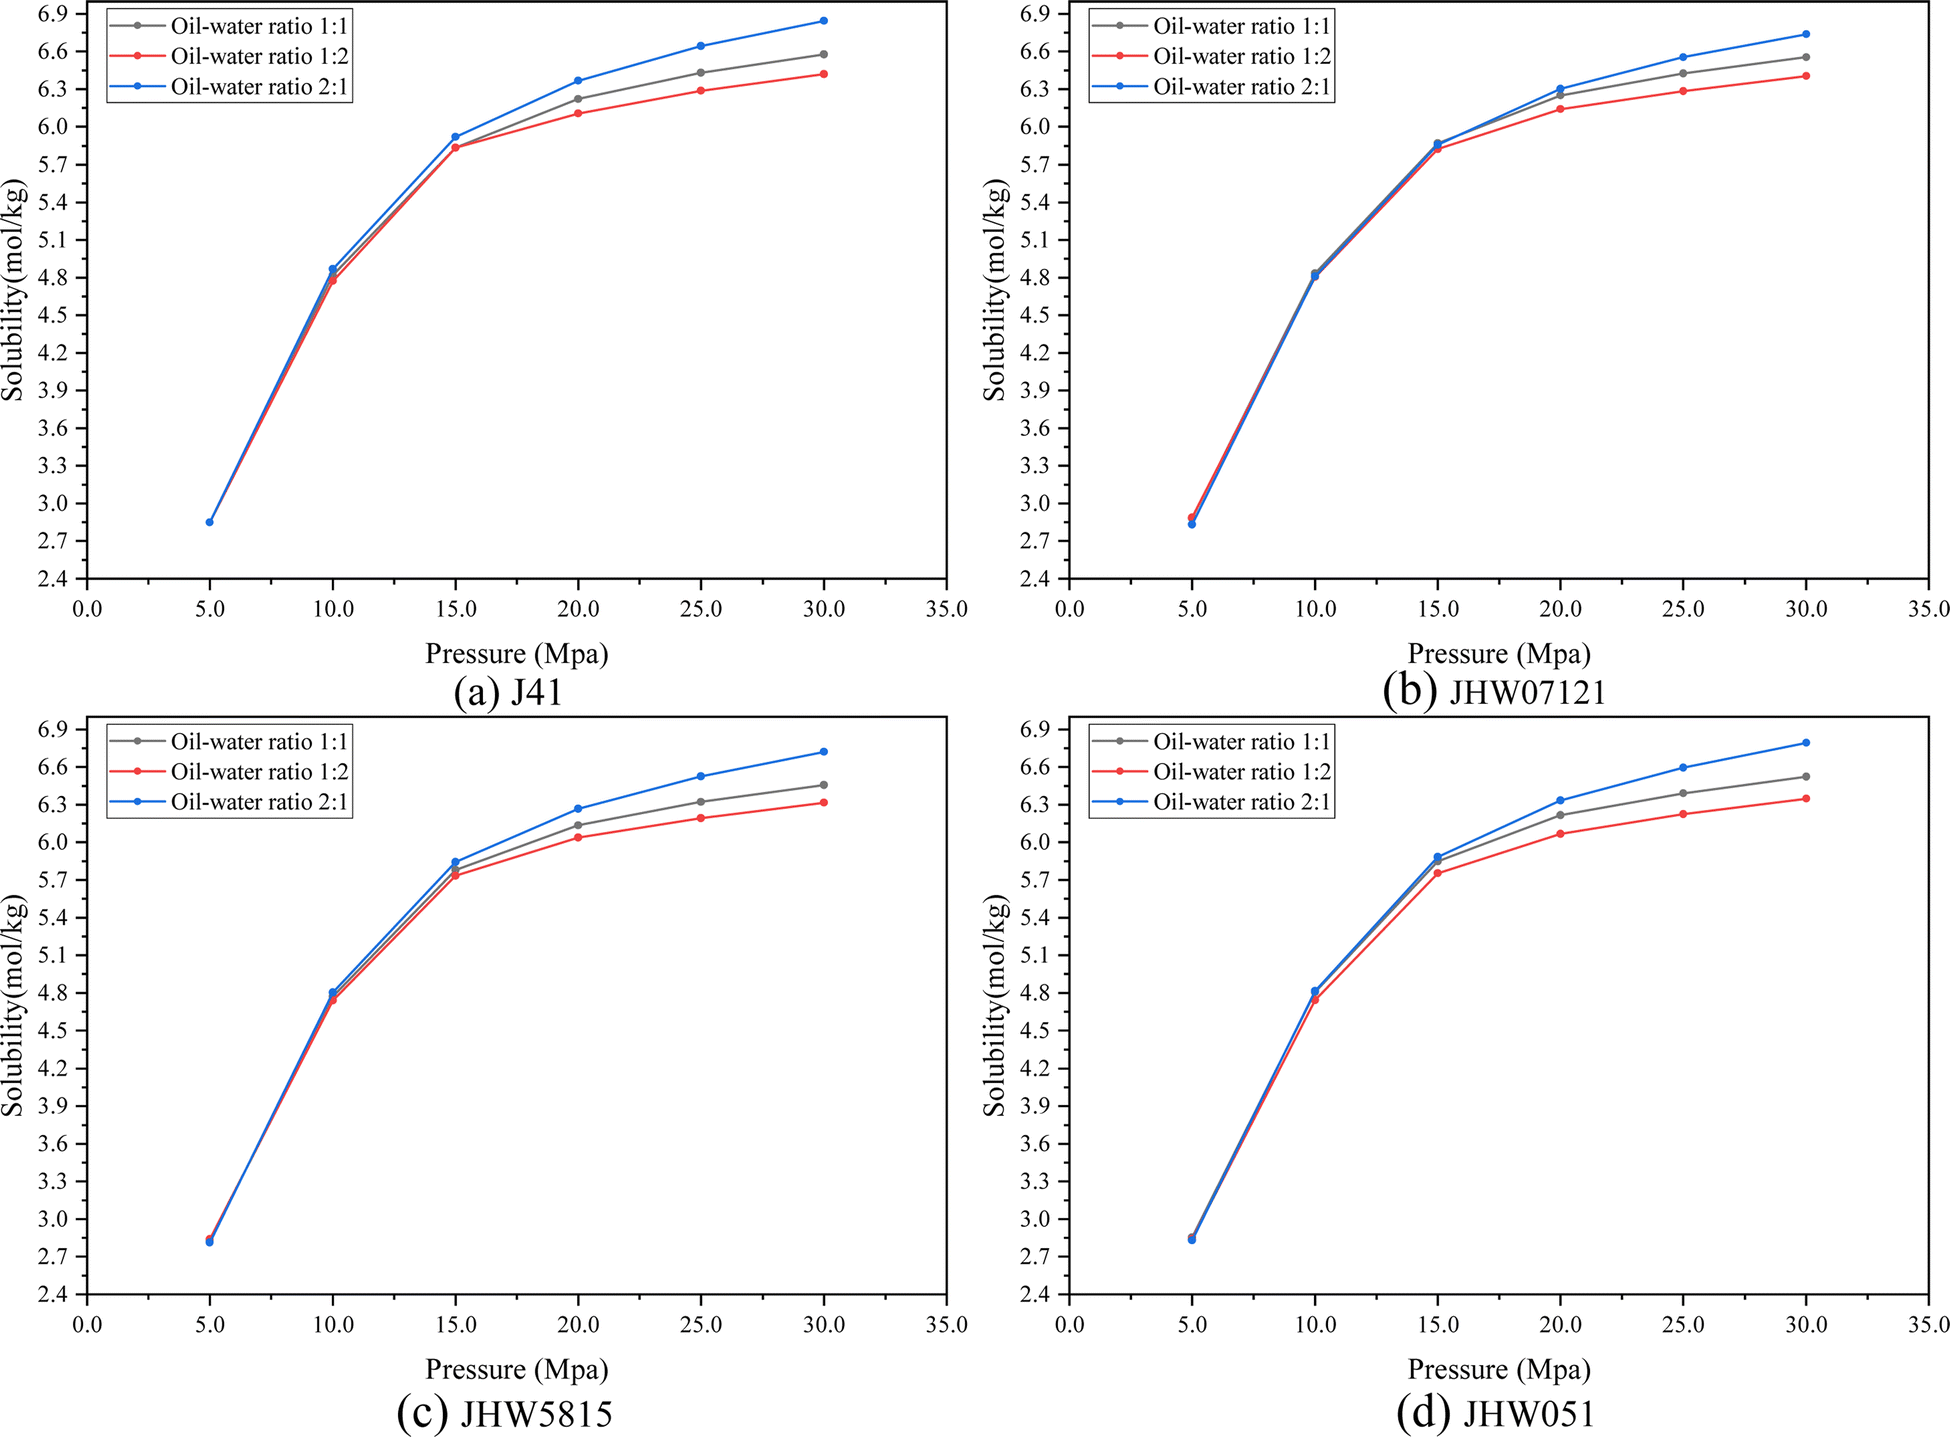 | ||
| Fig. 13 The effect of oil–water ratio on the solubility of CO2 in oil–water mixture: (a) J41, (b) JHW07121, (c) JHW5815, (d) JHW051. | ||
Fig. 14 shows the variation of CO2 solubility with temperature in four different oil and water mixtures. It can be seen that the solubility of CO2 in the oil–water mixture decreases with the increase in temperature. Results indicate that the solubility of CO2 in the oil–water mixture is mainly affected by temperature, pressure and oil composition.
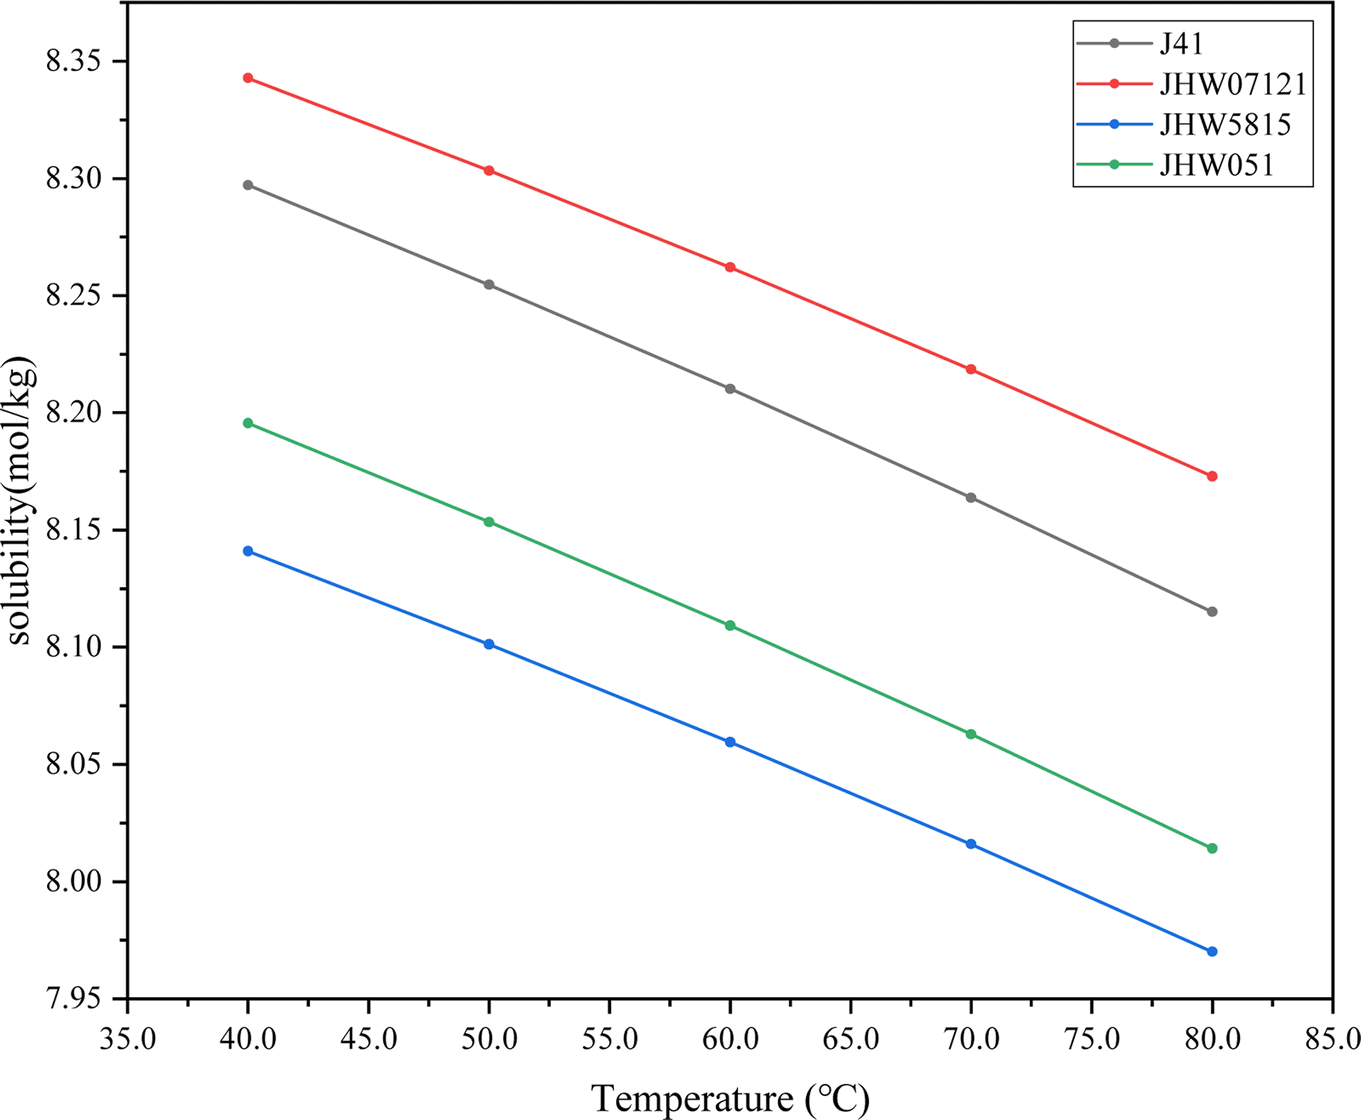 | ||
| Fig. 14 CO2 solubility in different oil–water mixtures. | ||
3.3 Solubility and phase state analysis of CO2 under nanometer conditions
Fig. 15 compares the phase envelopes corresponding to different pore apertures. The phase behavior of fluids in shale reservoirs is difficult to obtain through direct experimental methods. To elucidate the influence of pore wall interaction on fluid phase behavior in nano-pores of shale reservoirs, the critical properties of fluid components confined at 5 nm, 10 nm, 20 nm, 50 nm were calculated by preceding method in Table 4. It can be seen from Fig. 15 that the phase envelope shrinkage is the largest when the pore aperture is at 5 nm. The strong surface–fluid interaction in the confinement pore space substantially shrinkage the P–T phase envelope from the bulk state.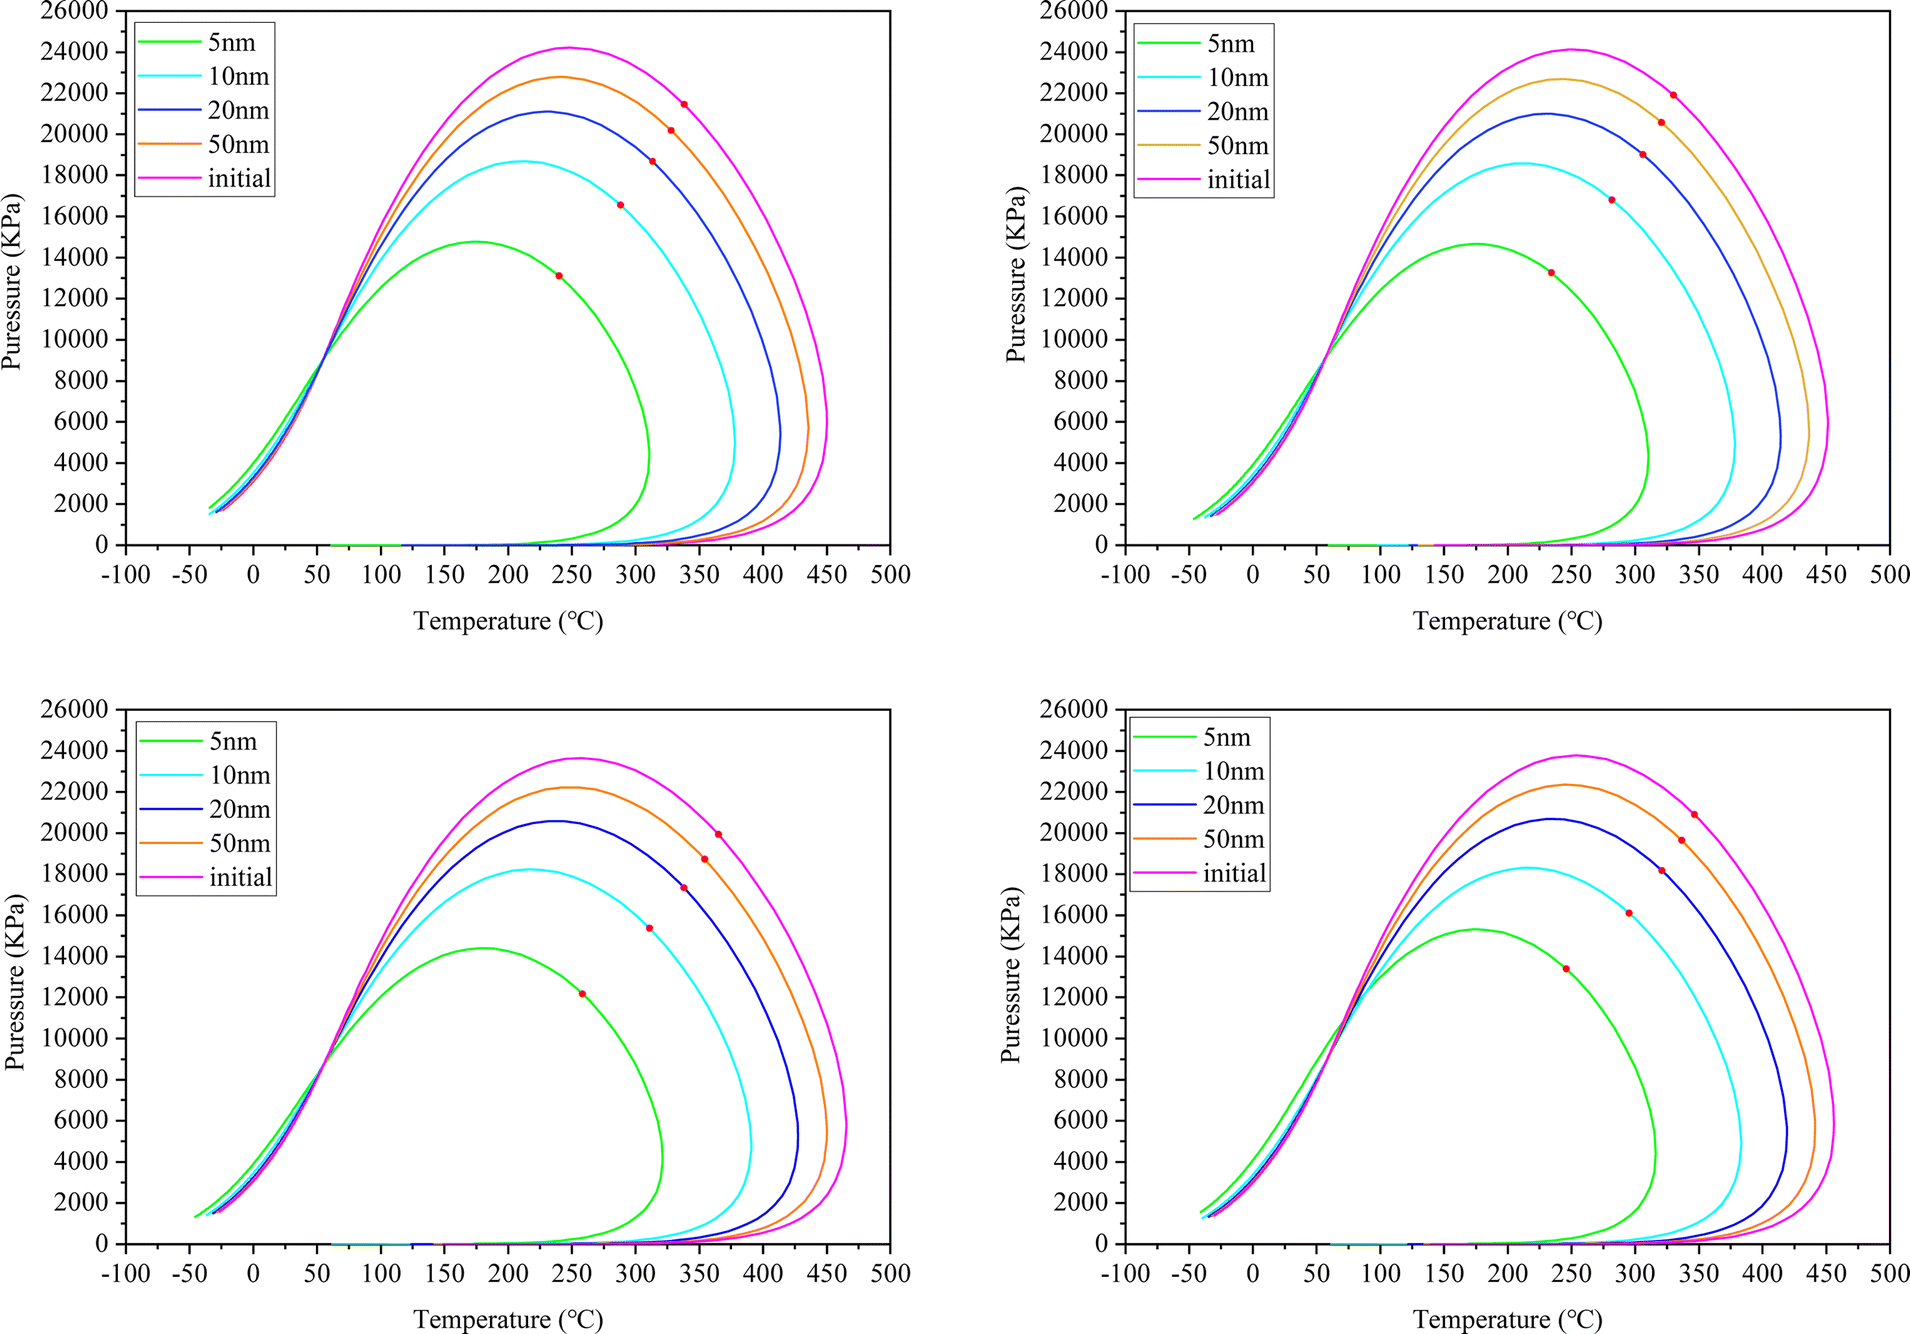 | ||
| Fig. 15 Phase envelope of four different crude oils at different pore sizes. | ||
The effect of nano-pore size on CO2 solubility in water is shown in Fig. 16. Simulation results indicate that the pore confinement effect contributes to an increase of CO2 solubility in water phase. Smaller pore sizes lead to a confined P–T phase envelope, thus the bubble point pressure of CO2 injection was reduced. More volume of CO2 can be dissolved in reservoir fluid compared to bulk state because of confined P–T envelope. It can be seen from Fig. 16 that under the same temperature and pressure, when the pore aperture is smaller, the solubility of CO2 is higher.
 | ||
| Fig. 16 The effect of nano-pore size on CO2 solubility in water at different temperatures: (a) 50 °C, (b) 60 °C, (c) 70 °C, (d) 80 °C. | ||
The effect of salinity on solubility of CO2 in water under different pore sizes at 40 MPa is shown in Fig. 17. Briefly, the trend of CO2 solubility decreases with an increase of temperature and salinity. An increase of water salinity results in a reduction of CO2 solubility in water. Under the same salinity, when the reservoir temperature is higher, the solubility of CO2 in water is lower. From results shown in Fig. 17, when the pore aperture is smaller, the solubility of CO2 in water is higher.
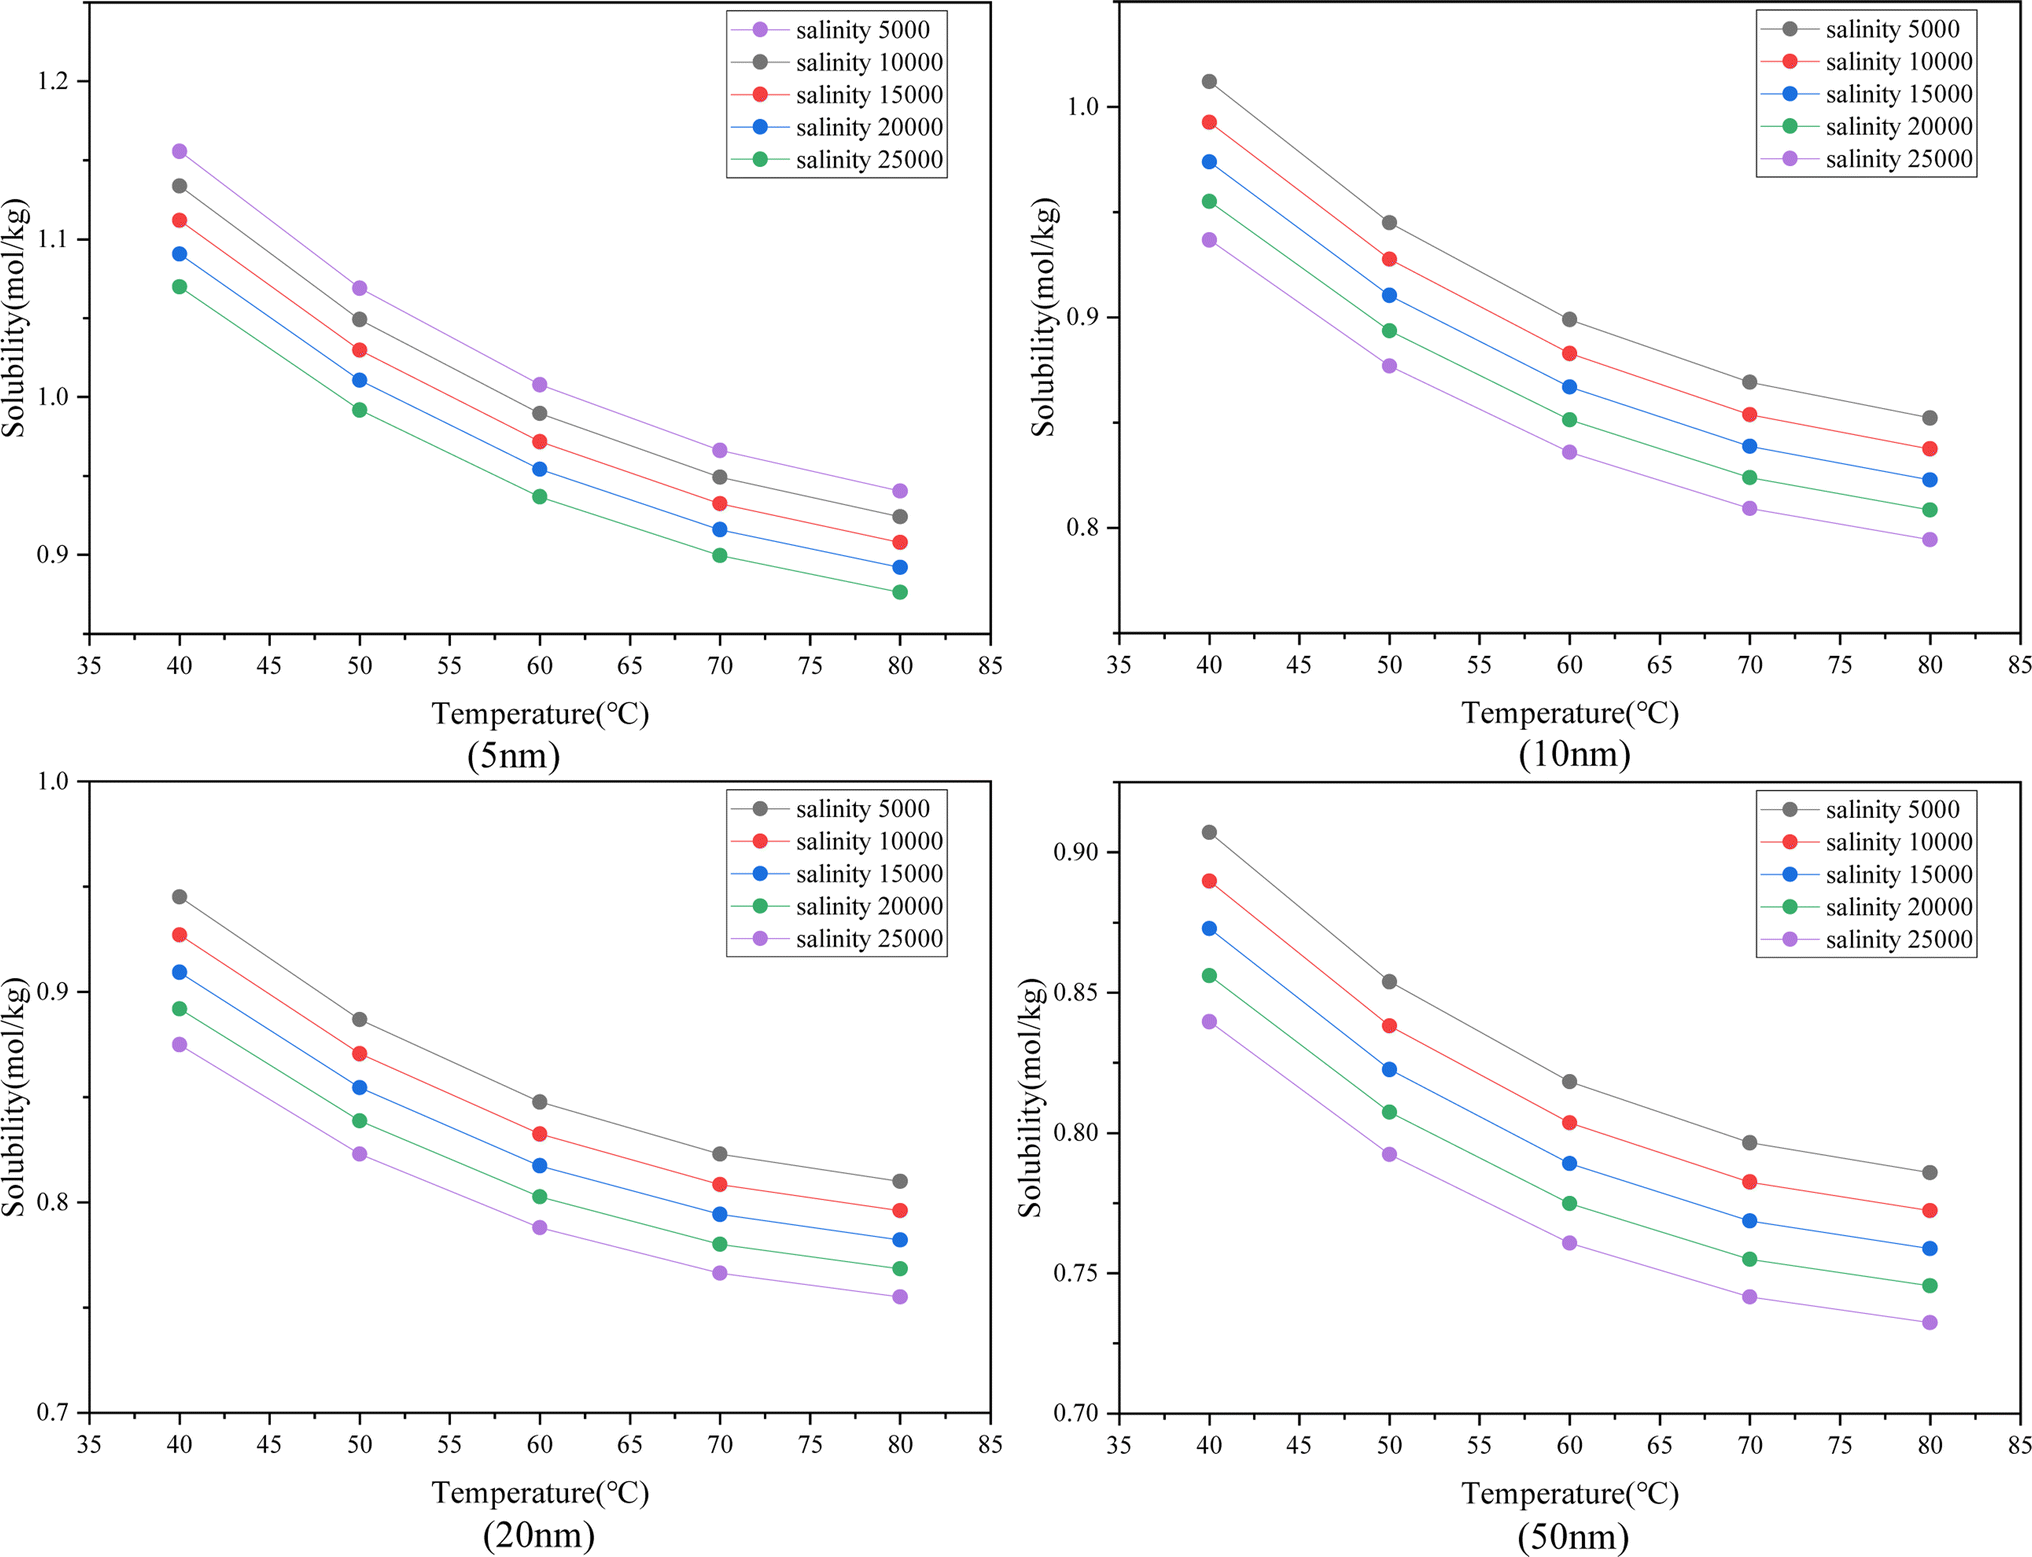 | ||
| Fig. 17 The solubility of CO2 in water varies with salinity under different pore sizes. | ||
In comparison, the changes of CO2 solubility in crude oil with different pore sizes is shown in Fig. 18. It can be seen that the solubility of CO2 in crude oil increases with the increase of pressure. From results in Fig. 16–18, the overall trend of CO2 solubility increases with the decrease of pore sizes. The reduction of pore size to nano-scale contributes to forming mixture of oil and CO2, but when the pore size is smaller than the length of crude oil molecules, CO2 molecules are less likely to interact with crude oil in the pores. Competitive adsorption of CO2 and oil molecules at the pore wall where CO2 strip the light oil molecules off the shale surface, it leads to the encapsulation of CO2 molecules in the oil phase, which improves the dissolution of CO2 to oil phase. The solubility of CO2 in water and oil is affected by temperature, pressure, water salinity and pore sizes. By comparing CO2 solubility in crude oil and water, the solubility of CO2 in crude oil is much higher than water. It indicates that the storage of CO2 in solution state primarily consisted in oleic phase.
 | ||
| Fig. 18 The effect of pore sizes on CO2 solubility in crude oil. | ||
It has been shown in the literature that the nano-restriction effect can reduce the light hydrocarbon extraction coefficient, which is conducive to the full contact of CO2 with crude oil. Therefore, the nanopore restriction effect can improve the crude oil recovery to some extent. From Fig. 19 it can be seen that the highest degree of crude oil recovery is achieved when the nanopore size is 5 nm, which indicates that nanopores are favorable for CO2 oil drive. It can be known that the solubility of CO2 in the formation fluid decreases with the increase of nanopore size, and CO2 drives the crude oil mainly by extracting the light components therein and thus reduces the viscosity of the crude oil, and the higher the solubility of CO2 in the crude oil, the higher the efficiency of extracting the components of the crude oil and thus improves the efficiency of the oil drive.
 | ||
| Fig. 19 Crude oil recovery degree at different pore sizes. | ||
4 Conclusion
In this study, the phase behavior of CO2–water oil experiments was carried out to provide the key parameters for numerical simulation. In addition, numerical simulations were performed to investigate the influencing factors of CO2 solubility in different reservoir fluids. The dissolution of CO2 in interstitial water, crude oil and oil–water mixture was simulated. The effect of nano-pore confinement on the solubility of CO2 was analyzed.(1) A component model that can reflect the real fluid in the reservoir is obtained by phase fitting based on the experimental data, which provides a component basis for the subsequent establishment of the CO2 oil drive model. It is found that the nanopore restriction will make the critical nature of the components smaller, which can lead to the contraction of the phase envelope. The smaller the nanopore diameter, the larger the contraction amplitude, the smaller the bubble point pressure of the system, and the smaller the minimum mixing pressure, so that CO2 and crude oil can reach the mixing phase more easily, which can effectively improve the oil driving efficiency.
(2) The solubility of CO2 in formation water, crude oil and oil–water mixtures is proportional to pressure and inversely proportional to temperature. It is found that the solubility of CO2 in water is also related to the mineralization of formation water, which shows that the greater the mineralization of water, the lower the solubility of CO2; The solubility of CO2 in oil–water mixtures is also affected by the composition of the liquid phase, and the rule of change is that the larger the oil–water volume ratio is, the larger the CO2 solubility is.
(3) Nanopores have a certain effect on the solubility of CO2 in the formation fluid, the smaller the nanopore diameter, the greater the solubility of CO2.
Abbrevation
| Pcb | Critical pressure of the bulk fluid, atm |
| Pcp | Critical pressure of the confined fluid, atm |
| Tcb | Critical temperature of bulk fluid, K |
| Tcp | Critical temperature of confined fluid, K |
| rp | Pore throat radius, nm |
| σLJ | Lennard-Jones size parameter, nm |
| Ve | Volume of fluids at equilibrium |
| Vl | Volume of liquid at equilibrium |
| Ve–Vl | Volume of gaseous CO2 at equilibrium |
| P0 | Pressure of CO2 at initial condition |
| Pe | Pressure at equilibrium condition; |
Data availability
The data that supports the findings of this study are available within the article.Conflicts of interest
There are no conflicts to declare.Acknowledgements
This work was support from Xinjiang Tianshan talent training program (2023TSYCJC0002), Xinjiang Tianshan Innovation Team, Xinjiang Natural Science Fund (2022D01E55) and Xinjiang Uygur Region ‘One Case, One Policy’ strategic talent introduction project No. XQZX20240054 is highly appreciated.References
- L. Wang L, Y. Tian and X. Yu, Advances in improved/enhanced oil recovery technologies for tight and shale reservoirs, Fuel, 2017, 210, 425–445 CrossRef.
- K. Enab and H. Emami-Meybodi, Effects of diffusion, adsorption, and hysteresis on huff-n-puff performance in ultratight reservoirs with different fluid types and injection gases, Energies, 2021, 14(21), 7379 CrossRef CAS.
- A. Fatah, Z. Bennour, Z. Mahmud, R. Gholami and M. Hossain, A review on the influence of CO2/shale interaction on shale properties: Implications of CCS in shales, Energies, 2020, 13(12), 3200 CrossRef CAS.
- S. Fakher, H. Abdelaal, Y. Elgahawy and A. El-Tonbary, A Review of Long-Term Carbon Dioxide Storage in Shale Reservoirs, SPE/AAPG/SEG Unconventional Resources Technology Conference, 2020 Search PubMed.
- S. Fakher and A. Imqam, A data analysis of immiscible carbon dioxide injection applications for enhanced oil recovery based on an updated database, SN Appl. Sci., 2020, 2, 448 CrossRef CAS.
- T. Wan and Z. J. Mu, The use of numerical simulation to investigate the enhanced Eagle Ford shale gas condensate well recovery using cyclic CO2 injection method with nano-pore effect, Fuel, 2018, 233, 123–132 CrossRef CAS.
- R. Heller and M. Zoback, Adsorption of methane and carbon dioxide on gas shale and pure mineral samples, Journal of Unconventional Oil and Gas Resources, 2020, 8, 14–24 CrossRef.
- Z. Jin and A. Firoozabadi, Thermodynamic modeling of phase behavior in shale media, SPE J., 2016, 21(01), 190–207 CrossRef CAS.
- Y. B. Jiang, Experiment and characterization of porous media on Phase State of CO2 injected crude oil, Reservoir evaluation and development, 2020, 10(3), 23–27 Search PubMed.
- J. P. Welker, Physical properties of carbonated oils, J. Pet. Technol., 1963, 15(08), 873–876 CrossRef CAS.
- R. T. Suo, Effect of CO2 Phase and Purity in Different Cores on Residual Water in CO2 Geologic Storage, Inner Mongolia: Inner Mongolia University, 2021 Search PubMed.
- S. Luo, J. L. Lutkenhaus and H. Nasrabadi, Effect of Nano-Scale Pore Size Distribution on Fluid Phase Behavior of Gas IOR in Shale Reservoirs, In SPE Improved Oil Recovery Conference, 2018 Search PubMed.
- S. Verdier, H. Carrier, S. I. Andersen and J. L. Daridon, Study of Pressure and Temperature Effects on Asphaltene Stability in Presence of CO2, Energy Fuels, 2006, 20, 1584–1590 CrossRef CAS.
- B. Nojabaei, R. T. Johns and L. Chu, Effect of capillary pressure on phase behavior in tight rocks and shales, SPE Reservoir Eval. Eng., 2013, 16(03), 281–289 CrossRef CAS.
- G. L. Sheng, H. Zhao and Y. Su, An analytical model to couple gas storage and transport capacity in organic matter with noncircular pores, Fuel, 2020, 268, 117288 CrossRef CAS.
- Y. L. Song, Z. J. Song and J. Guo, Phase Behavior and Miscibility of CO2–Hydrocarbon Mixtures in Shale Nanopores, Ind. Eng. Chem. Res., 2021, 60(14), 5300–5309 CrossRef CAS.
- B. A. Lopez, G. Hernandez and B. Czernia, Effects of thermodynamic and rock properties on the performance of liquids-rich nano-porous shale reservoirs, In SPE Argentina Exploration and Production of Unconventional Resources Symposium, 2018 Search PubMed.
- G. J. Zarragoicoechea and V. A. Kuz, Critical shift of a confined fluid in a nanopore, Fluid Phase Equilib., 2004, 220(1), 7–9 CrossRef CAS.
| This journal is © The Royal Society of Chemistry 2024 |