
 Open Access Article
 This Open Access Article is licensed under a Creative Commons Attribution-Non Commercial 3.0 Unported Licence
On the temperature dependent photoluminescence of nanoscale LuPO4:Eu3+ and their application for bioimaging
Jan Kappelhoff *a,
Burkhard Greveb and
Thomas Jüstela
*a,
Burkhard Greveb and
Thomas Jüstela
aDepartment of Chemical Engineering, Münster University of Applied Sciences, Stegerwaldstraße 39, D-48565 Steinfurt, Germany. E-mail: jan-kappelhoff@fh-muenster.de; tj@fh-muenster.de
bDepartment of Radiotherapy – Radiooncology, University Hospital Münster, Albert-Schweitzer-Campus 1, D-48149 Münster, Germany. E-mail: burkhard.greve@ukmuenster.de
First published on 20th September 2024
Abstract
This work concerns a synthesis method for efficiently luminescent LuPO4:Eu3+ nanoscale particles (∼100 nm) as well as their temperature (77–500 K) and time dependent photoluminescence. In addition, the incubation of these particles into cells of a human lung adenocarcinomic cell line A549 is briefly presented. This points to the application for bioimaging and detection of cancer cells in the field of medical diagnostics. The emission spectra of Eu3+ doped LuPO4 nanoparticles show four [Xe]4f6 → [Xe]4f6 transition multiplets between 580 and 720 nm, which are typically for Eu3+ comprising luminescent materials, however the most intense one is the 5D0 → 7F4 (696.40 nm, 1.78 eV) transition due to the crystallographic position point symmetry D2d of Eu3+ in xenotime LuPO4. Such an Eu3+ spectrum is rather useful for diagnostics due to the high penetration depth of 700 nm radiation into tissue.
Introduction
Rare earth doped orthophosphate nanoparticles are of increasing interest and application in biomedicine.1–3 For example, in cancer treatment,4 theranostics,5 and bioimaging6 different nanomaterials like lanthanide doped LuPO4 or HfO2 are used. They provide high chemical stability, resistance to radiation damage and a low solubility in water. This makes LuPO4, whose high density (6.53 g cm−3) and effective nuclear charge Zeff (63.7 (ref. 7)) to an potentially attractive powder material for scintillation applications. In addition, scintillator materials require a high scintillation efficiency which correlates with a high light yield. For cancer therapy should be in the UV spectral range (<280 nm), here the tumour cells absorbing very efficiently. Unfortunately, orthophosphates, like LuPO4 do not melt congruently, the single crystal cannot be procedures with the Czochralski technique.8 Since the technology of producing high-quality LuPO4 crystals has not been evolved, their polycrystalline powder materials seems to be the sole prospective alternative for their applications in bioimaging.An improvement in detection of ionizing particles requires a constant development of scintillator materials – their performance and optical quality. It was demonstrated that for phosphors emitting in the red spectral range the imaging resolution properties are optimal.9 Nevertheless, the scintillation and luminescence efficiency in the nanometer scale gets reduced, but lutetium based scintillator materials were reported as efficient scintillators.10
In the present work, nanoscale LuPO4 particles with a concentration range of Eu3+ (0.1–40 mol%) are presented, while the temperature and time dependent photoluminescence is discussed as well. Furthermore, these particles were incubated for the first time in A549 lung cancer cells and made them visible with excitation by an UV-A emitting LED (λexc. = 365 nm).
Experimental section
Particle synthesis
The nanoscale LuPO4 particles with a fixed Eu3+ concentration (0.1–40 mol%) were prepared by a modified sedimentation nucleation method.First of all, LuCl3·7 H2O (>99.99%, Jiayuan Advanced Materials Co., Ltd) and Eu(CH3COO)3·4 H2O (99+%, Nanosolutions GmbH) were dissolved in a stoichiometric ratio in 81 ml dest. H2O. Further, 60 mmol NH4H2PO4 (Merck KGaA, min. 99.99%) were dissolved in 300 ml dest. H2O and with NaOH solution (1 mol l−1) the pH value was adjusted to 12 (pH meter). Then the solution was added dropwise to the mixture with dissolved LuCl3·7 H2O and Eu(CH3COO)3·4 H2O under continuous stirring for 3.5 h. As a result, a white fine-dispersed precipitate was obtained. The precipitate was separated by centrifugation, washed by using distilled water several times until a pH 7 was attained, and finally dried by washing with ethanol. The obtained LuPO4:Eu3+ nanoparticles were dried under vacuum to constant weight. For appropriate crystallisation, the precipiced particles were annealed for 2 h at 1000 °C.
For the removal of secondary phases, the precipitate was washed under continuous stirring for 5 h at 60 °C in HNO3/H2O (1![[thin space (1/6-em)]](https://www.rsc.org/images/entities/char_2009.gif) :7), followed by washing to a neutral pH value and dried at 60 °C under vacuum. The last step is the separation of the nanoparticles by means of centrifugation.
:7), followed by washing to a neutral pH value and dried at 60 °C under vacuum. The last step is the separation of the nanoparticles by means of centrifugation.
X-ray diffraction patterns
The phase formation and phase purity of the prepared nanoparticles were investigated by powder X-ray diffraction (PXRD). Accordingly, a Rigaku MiniFlex II diffractometer was used. The samples were measured in Bragg–Brentano geometry upon using x-rays at 0.15406 nm (Cu Kα1 radiation). The diffractograms were recorded between 2θ = 10–80° with a step width of 0.02° and a speed of 5° min−1.Diffuse reflectance spectroscopy
The diffuse reflectance spectra were recorded upon employing an Edinburgh Instruments FLS920 spectrometer equipped with a custom build spectralon coated integrating sphere, a xenon arc lamp (450 W) and a cooled (−20 °C) single-photon counting photomultiplier (Hamamatsu R928). A BaSO4 sample (99.99%, Sigma Aldrich) was used as a white reflectance standard (100%). The device is operated with two TMS300 monochromators (Czerny-Turner Optics) equipped with 1800 grooves per millimeter (Gr/mm).Transmission electron microscopy (TEM)
TEM images of the nanoparticles were performed on a JEOL JEM-2100Plus transmission electron microscope. The images were detected with a resolution of 0.14 nm applying an acceleration voltage of 200 kV and different magnifications (10–100 nm).Temperature and time resolved spectroscopy
Temperature dependent luminescence spectra were recorded on a Edinburgh Instruments FLS920 spectrometer with a liquid nitrogen cryostat from Oxford Instruments for cooling the samples to 77 K (±3 K). Temperature stabilization time was 30 s and the samples were measured between 77 and 500 K in 25 K steps.Temperature dependent decay measurements were done on the same spectrometer and in the same time temperatures ranges and steps. The samples were excited at 390.05 nm with a pulsed Xe-arc lamp (μF920H) (450 W) flash lamp. Decay curves were recorded at 697.10 nm and was observed for 20 ms (Eu3+) with 2000 channels. With an initial intensity of 4000 counts, the decay measurement was started and for detection a single photon detector (R2658P) from Hamamatsu was used.
Nanoparticle uptake and light microscopy
About 1 × 10⁶ cells of the human lung adenocarcinomic cell line A549 (LGC-Petrochem/ATCC, Wesel, Germany) cultured in Petri dishes containing 4 ml DMEN (Sigma, Merck-Millipore, Darmstadt, Germany) based culture medium were treated either with 0.5 mg ml−1 LuPO4:Eu3+ (5 mol%) nanoparticles or with 0.5 mg ml−1 LuPO4 control nanoparticles without europium. Cells were incubated for 24 h in an incubator under humidified atmosphere of 5% CO2 at 37 °C. Afterwards cells were washed three times with 2 ml PBS containing 0.5% (w/v) bovin serum albumin (BSA) to remove free nanoparticles.Microscopic analysis was performed using an inverse microscope (Inverso, Cytecs, Münster, Germany). A 365 nm UV-LED was used for excitation and emission was measured at 610 nm with an exposure time of 500 ms.
Results and discussion
Phase purity of nanoscale particles
From all samples, which are comprising nanoscale LuPO4 particles with a varying Eu3+ concentration (0.1–40 mol%) powder X-ray diffraction patterns have been recorded. These patterns are plotted in Fig. 1. To proof the presence of single phase materials, the recorded X-ray diffraction patterns (black) were compared to a reference pattern (red) of undoped LuPO4 from the Pearson's Crystal Database (PCD). | ||
| Fig. 1 Powder X-ray diffraction patterns of LuPO4:Eu3+ (0.1–40 mol%) compared to the reference database pattern of tetragonal LuPO4 (mineral type: xenotime). | ||
The structure of Lutetium orthophosphate LuPO4 is well investigated, while all powders are crystallized regardless of the Eu3+ ion concentration in a tetragonal crystal system belonging to the space group I41/amd ( , #141). The structure thus comprise solely one metal site where at the Lu3+ ions are 8-fold coordinated by oxygen atoms with a D2d local symmetry, which is adopted from Eu3+ ions. The local site symmetry D2d affects the Eu3+ [Xe]4f6 → [Xe]4f6 transition intensity and splitting, which finally determines the obtained Eu3+ emission pattern. The phosphate groups (PO43−) form a slightly distorted tetrahedron.
Nanoparticle morphology
An embodiment of an average particle dize distribution of all prepared nanoparticle batches with a mean median diameter of around 120 nm is shown in Fig. 2. The results of these dynamic light scattering measurements (DLS) are not in agreement with crystal size calculations by using the Debye–Scherrer equation (20 nm). The images below show a typical impression of the agglomerates as obtained by transmission electron microscopy (TEM). | ||
| Fig. 2 TEM images of LuPO4:Eu3+(15 mol%) nanoparticles which forms agglomerates in a diameter of around 100 nm (a) while the crystallite size is about 20 nm (b). | ||
Concentration quenching & luminescence spectroscopy
The emission specta of as-prepared LuPO4:Eu3+ samples as function of the activator concentration (0.1–40 mol%) are shown in Fig. 3. In order to investigate the concentration quenching, the integrated emission intensities for the transitions (7F1,2,3) were calculated but just the integral of the 5D0 → 7F4 transitions is shown by the right graph. For the other transitions (7F1,2,3) similar results were observed, however, these are not depicted here. Concentration quenching for Eu3+ is well-known in solid state compounds, for example in Gd2O3 (ref. 11) and La2O3.12 The optimal integral intensity is observed at an Eu3+ content of 15 mol% and thus the following measurements were made with this sample.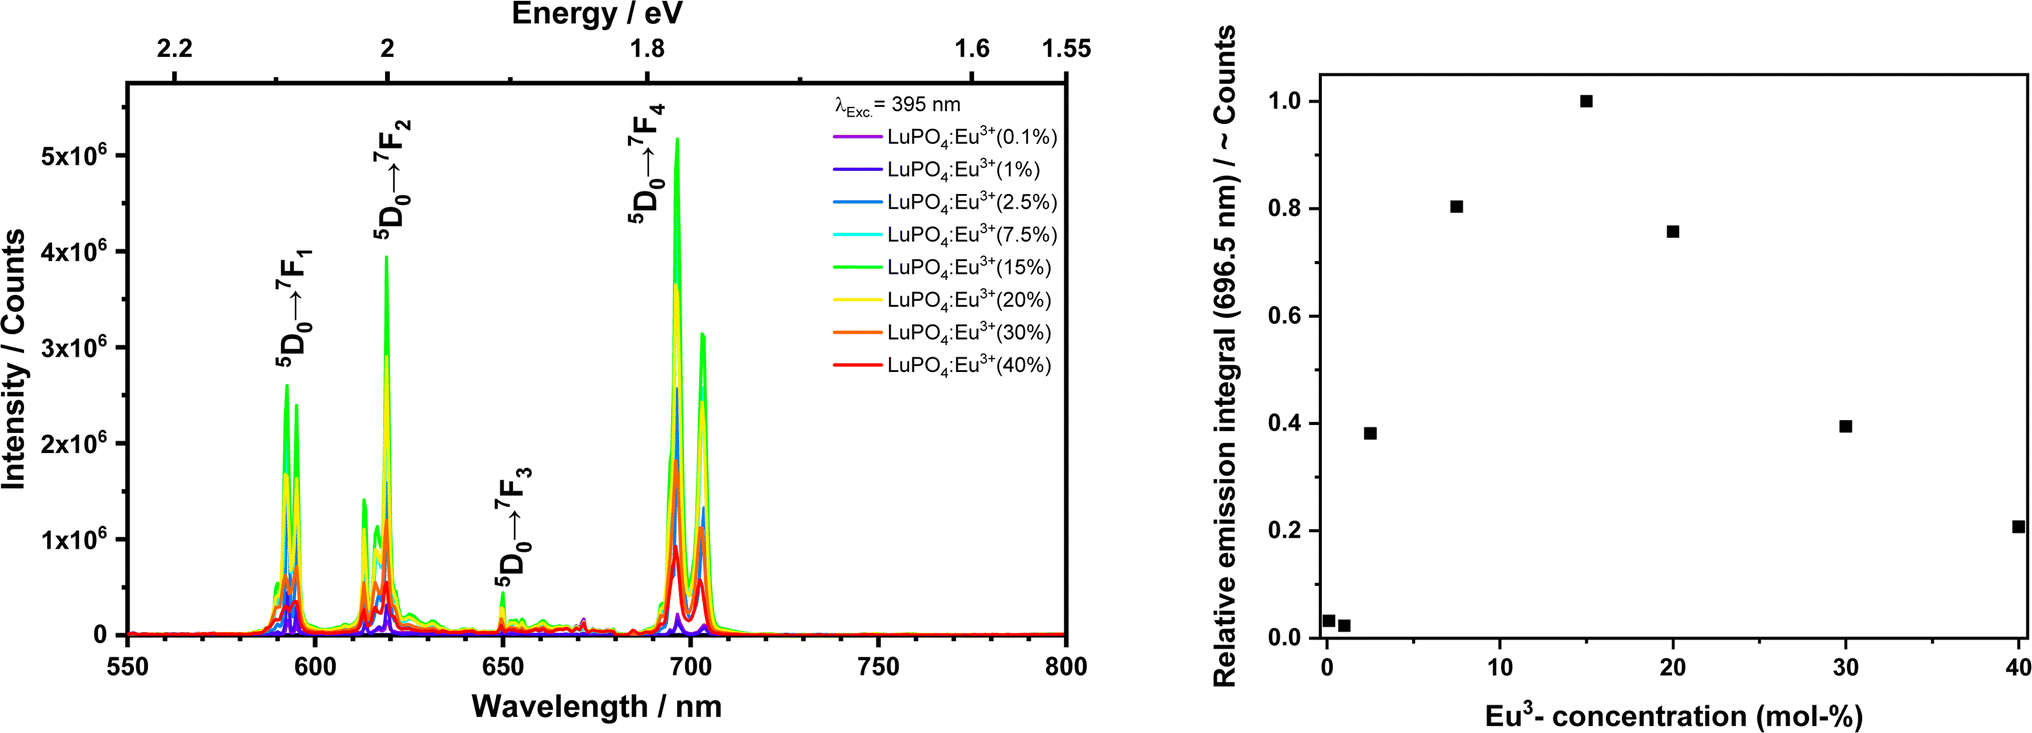 | ||
| Fig. 3 Emission spectra (left) and emission integrals 5D0 → 7F4 (right) upon excitation at 395 nm from the LuPO4:Eu3+(0.1–40 mol%) sample at room temperature. | ||
In Fig. 4 the excitation, emission, and diffuse reflectance spectra of nanoscale LuPO4:Eu3+(15 mol%) are presented. The blue line shows the diffuse reflectance spectrum compared to BaSO4. A high reflectance over the whole recored wavelength range, i.e. between 250–800 nm is recognizable, which proofs a high sample quality with a low defect density resulting in a pure white body colour. In addition, the Eu3+ absorption lines as mentioned below are weak but visible in the reflection spectrum.
 | ||
| Fig. 4 Diffuse reflectance vs. BaSO4, excitation and emission spectra of the LuPO4:Eu3+(15 mol%) sample at room temperature. | ||
An excitation spectra (black line) was monitored at the most intense emission wavelength, viz. at 696.40 nm and reveals well-resolved [Xe]4f6 → [Xe]4f6 lines, which stem from the 7F0 → 5H3 (319.6 nm, 3.88 eV), 7F0 → 5D4 (363.2 nm, 3.41 eV), 7F0 → 7L7 (376.6 nm, 3.29 eV), 7F0 → 7L6 (395.2 nm, 3.14 eV), 7F0 → 5D3 (418.6 nm, 2.96 eV), 7F0 → 5D2 (466.2 nm, 2.66 eV), and 7F0 → 5D1 (527.2 nm, 2.35 eV) intraconfigurational transitions. Beyond the sharp lines, a broad band originating from the O2− → Eu3+ charge transfer (CT) between 205 and 265 nm is clearly visible. The rather high energy of the position of the CT transition is justified by the quite large interatomic distances of 2.2655 Å13 for Eu3+ in the LuPO4 host.
Furthermore, the emission spectra recorded for 395.20 nm excitation were recorded. The sharp [Xe]4f6 → [Xe]4f6 lines originate from 4f-4f transition, viz. 5D0 → 7F1 (magnetic dipole induced, 595.90 nm, 2.08 eV), 5D0 → 7F2 (hypersensitive electric dipole induced, 619.65 nm, 2.00 eV), 5D0 → 7F3 (650.80 nm, 1.91 eV), and 5D0 → 7F4 (696.40 nm, 1.78 eV). The latter at 696.40 nm is the most intense one and has a much higher emission integral than the 5D0 → 7F1,2,3 transition due to the local symmetry of Eu3+ in such tetragonal crystalline environment. Host lattices with a high symmetry, which are doped by Eu3+ exhibit an intense emission of the 5D0 → 7F1 transition.14 With decreasing symmetry, the 5D0 → 7F2,3,4 transitions increase in intensity. Skaudzius et al.15 published a study of Eu3+ (5D0 → 7F4 transition) luminescence in different orthophosphates and garnets as host materials. They figured out that an increasing average electronegativity, i.e. decrease of the basicity in octahedral and tetrahedral sites in the structure also led to an increasing intensity of the 5D0 → 7F4 transition.
Temperature dependent spectroscopy
In addition, the thermal quenching behaviour of the sample with the highest emission intensity (15 mol% Eu3+) was investigated. Fig. 5 shows the excitation spectra with a fixed emission wavelength at 696.40 nm between 77–500 K. The corresponding excitation transitions are listed above with the most intense 7F0 → 5L6 at 395.20 nm and associated integrals as a function of the temperature are shown in Fig. 5 on the right side. A noticeable trend can be identified that the integrals of transition 7F0 → 5L6 decrease with increasing temperature. Noticeable is that the excitation band shifts from the CT to higher wavelengths (228 to 237 nm). This red-shift is likely caused by thermal expansion of the Eu3+ surrounding, which eases the electron transfer from the ligands to the metal ion, which is then formally reduced to the larger Eu2+.16 | ||
| Fig. 5 Excitation spectra (left) and PL integrals (right) from the LuPO4:Eu3+(15 mol%) sample at a fixed emission wavelength at 696.40 nm in a temperature between 77 and 500 K. | ||
The left graph of Fig. 6 shows the emission spectra record upon a fixed excitation wavelength at 395.20 nm between 77 and 500 K. The corresponding excitation transitions are listed above with the most intense 5D0 → 7F4 at 696.40 nm, while the associated integrals as a function of the temperature are shown in Fig. 6 on the right side. A noticeable trend can be identified that the integrals of transition 5D0 → 7F4 decrease with increasing temperature.
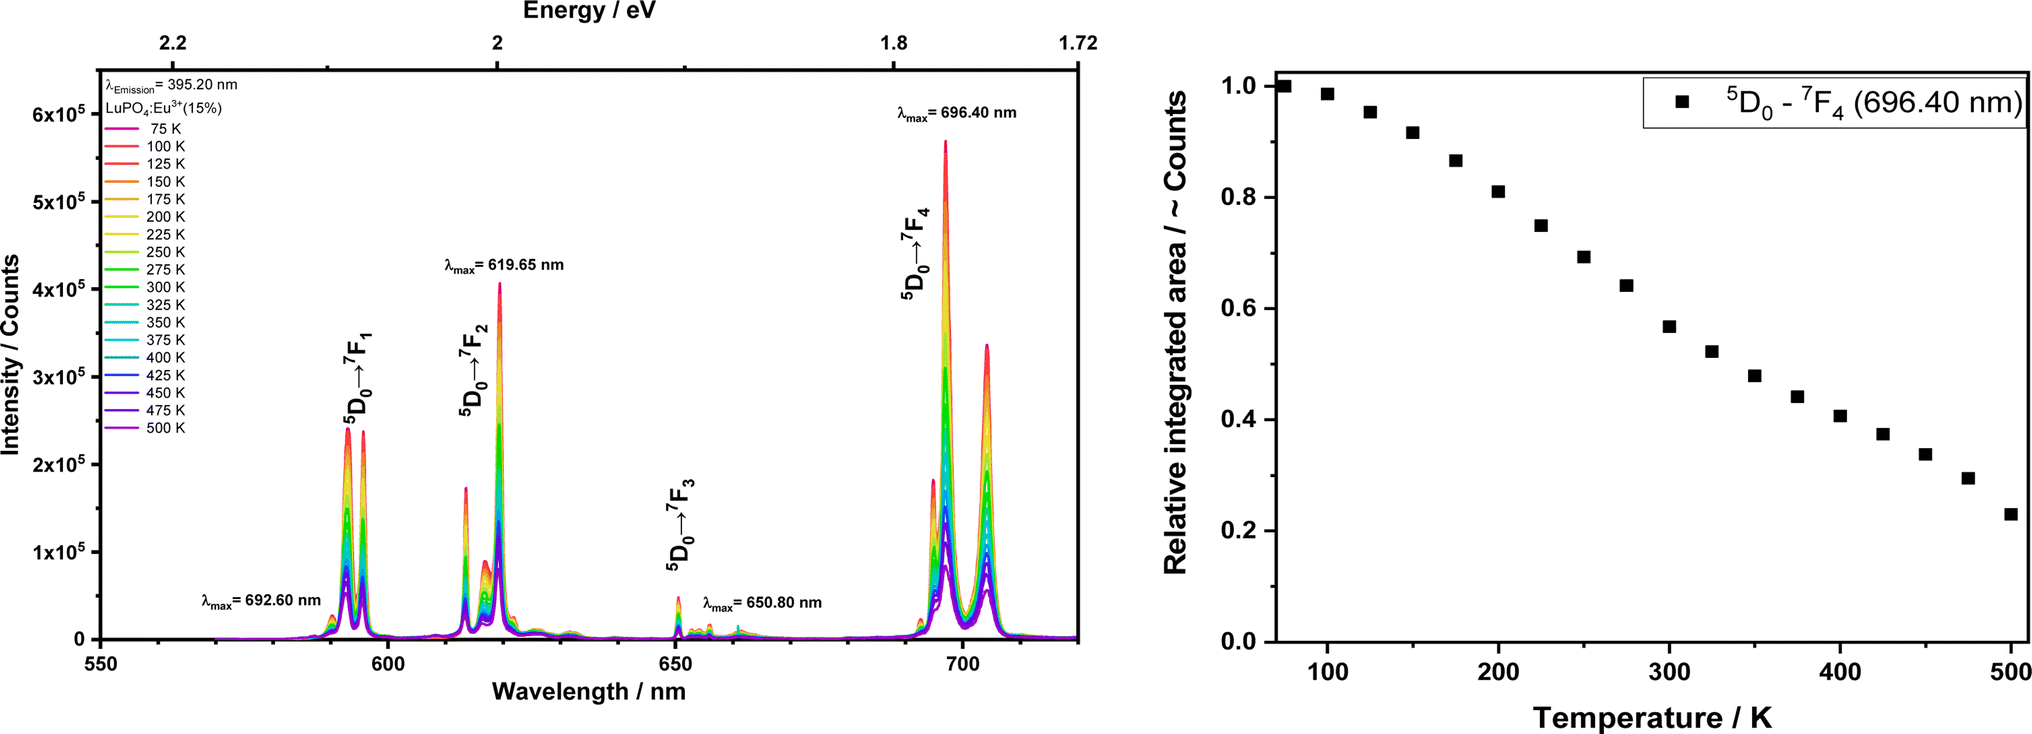 | ||
| Fig. 6 Emission spectra (left) and integrals (right) from the LuPO4:Eu3+(15 mol%) sample upon excitation at 395.20 nm (5D0 → 7F4)in the temperature range between 77 and 500 K. | ||
Decay curves as function of temperature
The decay curves for varying emission wavelength 696.40 nm (5D0 → 7F4) upon 395.20 nm excitation are presented in Fig. 7. They are biexponential, practically identical for all investigated transitions 5D0 → 7F1,2,3, which confirms that Eu3+ occupy two crystallographic site. The decay times are about 2.8 (500 K) and 4 ms (77 K), thus in very good agreement with those reported for other Eu3+ phosphors.17,18 Such long decay constants are characteristic for electric-dipole forbidden [Xe]4f6 → [Xe]4f6 transitions.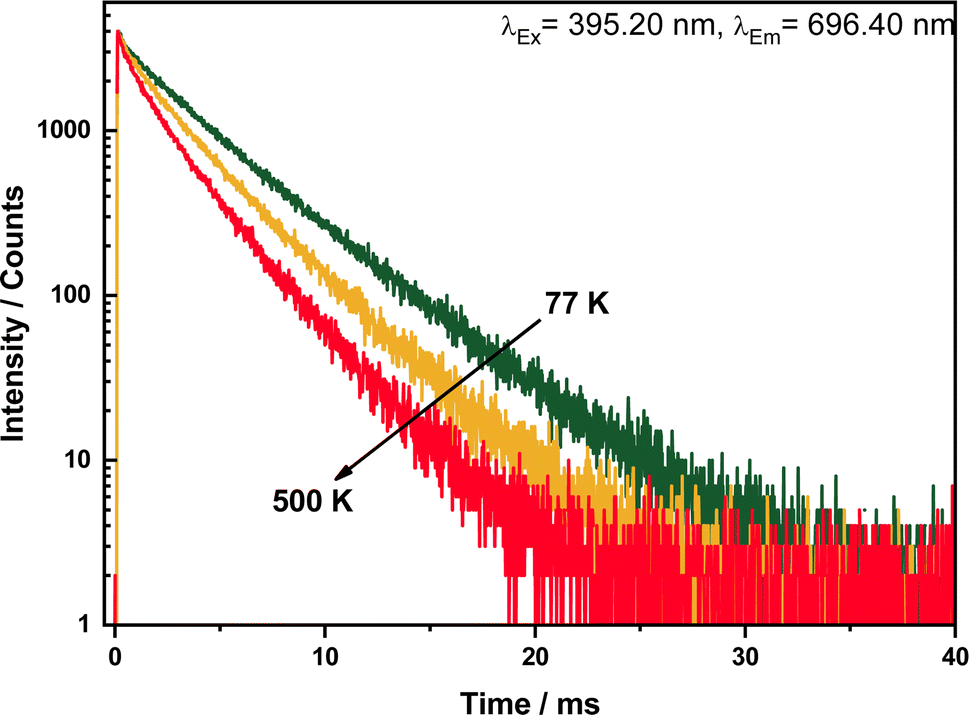 | ||
| Fig. 7 Decay curves of LuPO4:Eu3+(15 mol%) sample upon excitation at 395.20 nm and emission at 696.40 nm in a temperature range between 77–500 K. | ||
These values for the single exponential decay curves substantiate that there is almost no luminescence quenching of Eu3+ in the investigated material. The drop of the emission lifetime indicates the presence of typical temperature quenching behavior between Eu3+ ions. In the thermal quenching process, energy transfer occurs from Eu3+ to other defect states/level by thermal phonon assistance.
Application for bioimaging
LuPO4 is known as an FDA approved inorganic material and e.g. used as a177LuPO4 radiomarker (Fig. 8).19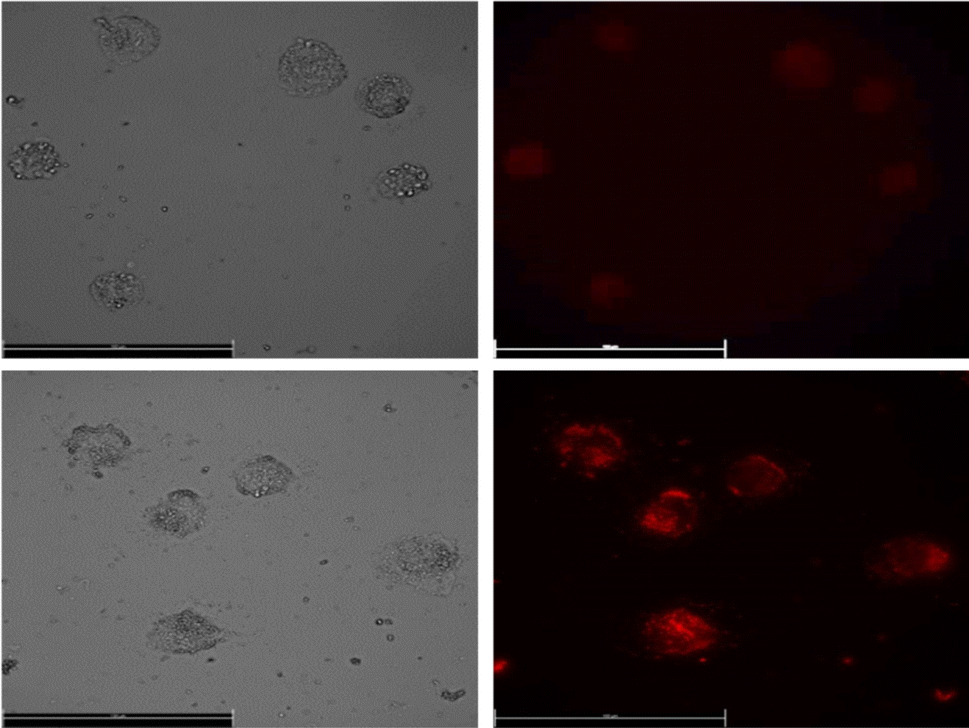 | ||
| Fig. 8 Images of human lung adenocarcinomic cell line A549 incubated with LuPO4:Eu3+(15 mol%) nanoparticles. | ||
For the application of these efficiently deep red emitting nanoparticles, they were incubated in A549 human lung cancer cells. Due to the excitation with a 365 nm UV-LED and the emission was measured at 610 nm via fluorescence microscopy. To our knowledge, that is the first time Eu3+ doped LuPO4 nanoparticles were incubated in human lung cancer cells. The emission maximum of 696.40 nm is located in the wavelength range of 650–900 nm, where hemoglobin and water, the major absorbers of visible and infrared light, have their lowest absorption coefficient.20 The intense red Eu3+ emission can be clearly visualized and turns this material to a potential alternative for the application in bioimaging/detection.
Conclusions
This works deals with a solid solution of nanoscale LuPO4 in which Eu3+ (0–15 mol%) is incorporated. From LuPO4:Eu3+ (15 mol%) temperature as well time dependent luminescence properties were studied in more detail. The highest emission intensity integral was detected for the sample doped by 15 mol% Eu3+. Therefore, its thermal quenching curve between 77–500 K was recorded. In addition, the nanoparticles were inserted in human lung adenocarcinomic cell line A549, while it turned out that these particles are useful for optical bioimaging. In former paper it was reported that LuPO4 doped with Pr3+ is useful as a radiosensitizer in cancer therapy. Therefore, the next goal w.r.t these nanoscale particles is its modification such a way that cancer therapy and bioimaging could be combined. Therefore, LuPO4 co-doped with Pr3+ and Eu3+ will be in the focus of future work.Data availability
The data that support the findings of this study are available from the corresponding author upon reasonable request and are available in the article.Conflicts of interest
There are no conflicts of interest to declare.Acknowledgements
The authors are grateful to the European Union (Europäische Union, Europäischer Fonds für regionale Entwicklung (EFRE-0600059)) for generous financial support. We thank Dr Wolfgang Göhde and Marina Lezhnina from Quantum Analysis, Münster for support in the generation of microscopic cell pictures.References
- G. Bao, S. Mitragotri and S. Tong, Annu. Rev. Biomed. Eng., 2013, 15, 252–282, DOI:10.1146/annurev-bioeng-071812-152409
.
- V. K. Arivarasan, K. Loganathan and P. Janarthanan, Nanotechnology in Medicine, 2021, DOI:10.1007/978-3-030-61021-0
- J.-C. G. Bünzli, Chem. Rev., 2010, 110(5), 2729–2755, DOI:10.1021/cr900362e
- T. Tran, J. Kappelhoff, T. Jüstel, R. Anderson and M. Purschke, Int. J. Radiat. Biol., 2022, 28, 1–11, DOI:10.1080/09553002.2022.2027541
- L. R. H. Gerken, K. Keevend, Y. Zhang, F. H. L. Starsich, C. Eberhardt, G. Panzarasa, M. T. Matter, A. Wichser, A. Boss, A. Neels and I. K. Herrmann, ACS Appl. Mater. Interfaces, 2019, 11, 437–448, DOI:10.1021/acsami.8b20334
- F. W. Pratiwi, C. W. Kuo, B. C. Chen and P. Chen, Nanomedicine, 2019, 14(13), 1759–1769, DOI:10.2217/nnm-2019-0105
- A. Lempicki, E. Berman, A. J. Wojtowicz, M. Balcerzyk and L. A. Boatner, IEEE Trans. Nucl. Sci., 1993, 40(4), 384–387, DOI:10.1109/NSSMIC.1992.301128
- J. S. Neal, L. A. Boatner, M. Spurrier, P. Szupryczynski, and C. L. Melcher, Hard X-Ray and Gamma-Ray Detector Physics and Penetrating Radiation Systems VIII, 2006, vol. 6319, pp. 631901, DOI:10.1117/12.683884
- P. Reineck and C. G. Brant, Adv. Opt. Mater., 2017, 5(2), 1600446, DOI:10.1002/adom.201600446
- V. Vistovskyy, T. Malyi, A. Vaskiv, M. Chylii, N. Mitina, A. Zaichenko, A. Getkin and A. Voloshinovskii, J. Lumin., 2016, 179, 527–532, DOI:10.1016/j.jlumin.2016.07.064
- O. Meza, E. G. Villabona-Leal, L. A. Diaz-Torres, H. Desirena, J. L. Rodriguez-Lopez and E. Perez, J. Phys. Chem., 2014, 118(8), 1390–1396, DOI:10.1021/jp4119502
- V. Dordevic, Z. Antic, M. G. Nikolic and M. D. Dramicanin, Journal of Research in Physics, 2013, 37(1), 47–54, DOI:10.1038/86684
- F. X. Zhang, M. Lang, R. C. Ewing, J. Lian, Z. W. Wang, J. Hu and L. A. Boatner, J. Solid State Chem., 2008, 118(10), 2633–2638, DOI:10.1016/j.jssc.2008.06.042
- J. Zhang, G. Cai, W. Wang, L. Ma, X. Wang and Z. Jin, Inorg. Chem., 2020, 59(4), 2241–2247, DOI:10.1016/j.jlumin.2016.07.064
- R. Skaudzius, A. Katelnikovas, D. Enseling, A. Kareiva and T. Jüstel, J. Lumin., 2014, 147, 290–294, DOI:10.1016/j.jlumin.2013.11.051
- D. den Engelsen, T. G. Ireland, R. Dhillon, G. Fern, P. G. Harris and J. Silver, ECS J. Solid State Sci. Technol., 2016, 5(5), R59–R66, DOI:10.1149/2.0071605jss
- M. L. Debasu, D. Ananias, A. G. Macedo, J. Rocha and L. D. Carlos, J. Phys. Chem. C, 2011, 115(31), 15297–15303, DOI:10.1021/jp205093x
- P. J. Dereń and J. C. Krupa, J. Lumin., 2003, 102, 386–390, DOI:10.1016/S0022-2313(02)00529-X
- H. Yousefnia, E. Radfar, A. R. Jalilian, A. Bahrami-Samani, S. Shirvani-Arani, A. Arbabi and M. Ghannadi-Maragheh, J. Radioanal. Nucl. Chem., 2010, 287, 199–209, DOI:10.1007/s10967-010-0676-4
- R. Weissleder, Nat. Biotechnol., 2001, 19(4), 316–317, DOI:10.1038/86684
| This journal is © The Royal Society of Chemistry 2024 |