 Open Access Article
Self-supplying Cu2+ and H2O2 synergistically enhancing disulfiram-mediated melanoma chemotherapy†
Yingqian Gaoac,
Xiaojun Cai b,
Weijuan Zoub,
Xiuzhen Tangb,
Lixian Jiangb,
Junnian Haob,
Yuanyi Zhengb,
Xinhua Ye*a,
Tao Ying*b and
Ao Li
 *a
*a
aDepartment of Ultrasound in Medicine, The First Affiliated Hospital of Nanjing Medical University, Nanjing, Jiangsu, China
bDepartment of Ultrasound in Medicine, Shanghai Sixth People's Hospital Affiliated to Shanghai Jiao Tong University School of Medicine, Shanghai, China
cDepartment of Ultrasound in Medicine, Nanjing Drum Tower Hospital, Affiliated Hospital of Medical School, Nanjing University, Nanjing, Jiangsu, China
First published on 23rd April 2024
Abstract
Disulfiram (DSF) can target and kill cancer cells by disrupting cellular degradation of extruded proteins and has therefore received particular attention for its tumor chemotherapeutic potential. However, the uncontrollable Cu2+/DSF ratio reduces the efficacy of DSF-mediated chemotherapy. Herein, self-supplying Cu2+ and oxidative stress synergistically enhanced DSF-mediated chemotherapy is proposed for melanoma-based on PVP-coated CuO2 nanodots (CPNDs). Once ingested, DSF is broken down to diethyldithiocarbamate (DTC), which is delivered into a tumor via the circulation. Under the acidic tumor microenvironment, CPNDs produce sufficient Cu2+ and H2O2. DTC readily chelates Cu2+ ions to generate CuET, which shows antitumor efficacy. CuET-mediated chemotherapy can be enhanced by H2O2. Sufficient Cu2+ generation can guarantee the maximum efficacy of DSF-mediated chemotherapy. Furthermore, released Cu2+ can be reduced to Cu+ by glutathione (GSH) and O2− in tumor cells, and Cu+ can react with H2O2 to generate toxic hydroxyl radicals (·OH) via a Fenton-like reaction, promoting the efficacy of CuET. Therefore, this study hypothesizes that employing CPNDs instead of Cu2+ ions could enhance DSF-mediated melanoma chemotherapy, providing a simple but efficient strategy for achieving chemotherapeutic efficacy.
Introduction
Melanoma, one of the skin cancers with a high mortality rate, is seriously threatening to human health.1–8 Surgery shows very limited efficacy for advanced melanoma, and classic treatments such as chemotherapy and targeted therapy are very costly and have side effects.9–11 Herein, a new treatment is proposed for advanced melanoma using clinically approved “old drugs”,12,13 with reduced clinical trial time and high biosafety.Disulfiram (tetraethylthiuram disulfide, DSF), a drug approved by the Food and Drug Administration (FDA) for chronic alcoholism, has aroused great interest in the field of tumor chemotherapy.14–17 Once ingested, DSF can be metabolized to DTC, which chelates Cu2+ ions to form CuET, which shows high cytotoxicity. CuET induces p97 segregase adapter, NPL4, aggregation in the nucleus, which triggers a heat-shock response, resulting in further death of cells.18–20 Thus, Cu2+ ions play an important role in DSF-based chemotherapy.
Previous reports showed that under oxidative conditions, CuET can release Cu2+ ions, which then bind to the zinc motif of NPL4, changing the conformational structure of NPL4.19 This change leads to inhibition of ubiquitin protein metabolism and promotes further cell apoptosis. The generation of Cu2+ ions suggests the existence of a cycle of DSF, DTC, and CuET and excessive DTC neutralizes CuET toxicity by chelating released Cu2+ ions.19,21 Therefore, it is necessary to provide sufficient Cu2+ ions and to create an oxidative microenvironment to improve the therapeutic efficacy of CuET-induced chemotherapy in tumor cells. In recent years, many studies focused on DSF-induced chemotherapy have paid more attention to copper-based nanoplatforms to increase the efficacy of such chemotherapy.22–24 However, in many delivery strategies, the ratio between the released Cu2+ ions and DSF is uncontrollable, which affects the efficiency of DSF-based chemotherapy. The therapeutic efficacy of DSF-based chemotherapy is only enhanced when the concentration of Cu2+ ions exceeds that of DTC in tumor cells. Meanwhile, most nanoparticle platforms are transported intravenously and preferentially accumulate in a tumor depending on the EPR effect.25–29 This passive targeting mechanism has very low accumulation efficiency, resulting in about 0.7% ID (median) at the tumor.28 Furthermore, most nanoparticles are distributed in normal tissues during circulation, which can result in much more complicated therapeutic outcomes and severe side effects.30,31
Herein, to improve the utilization of DSF to treat melanoma, we proposed polyvinyl pyrrolidone (PVP)-coated CuO2 nanodot (CPND)-mediated H2O2/Cu2+ self-supplying enhanced DSF-mediated chemotherapy as a smart therapeutic strategy for synergistic treatment of melanoma (Scheme 1). Taking DSF orally,32 it can be decomposed to DTC in the digestive tract, which is then delivered to the tumor via circulation. Meanwhile, injecting CPNDs intratumorally,33 after internalization by tumor cells, CPNDs are decomposed in acidic endolysosomal compartments to release abundant Cu2+ ions and H2O2, providing enough Cu2+ ions and an oxidative environment for CuET-induced chemotherapy. Furthermore, the released Cu2+ ions can be reduced to Cu+ by GSH and O2−, and Cu+ reacts with H2O2 via a Fenton-like reaction to generate cytotoxic ˙OH, promoting further damage to tumor cells. To improve DSF/Cu2+ utilization and safety, this study demonstrated a smart DSF/Cu2+ delivery strategy for chemotherapy and chemodynamic therapy, combining oral uptake of drugs and intratumoral injection of nanoparticles for enhanced efficiency of DSF-based chemotherapy and increased efficacy of DSF/Cu2+ chemotherapy in clinical application.
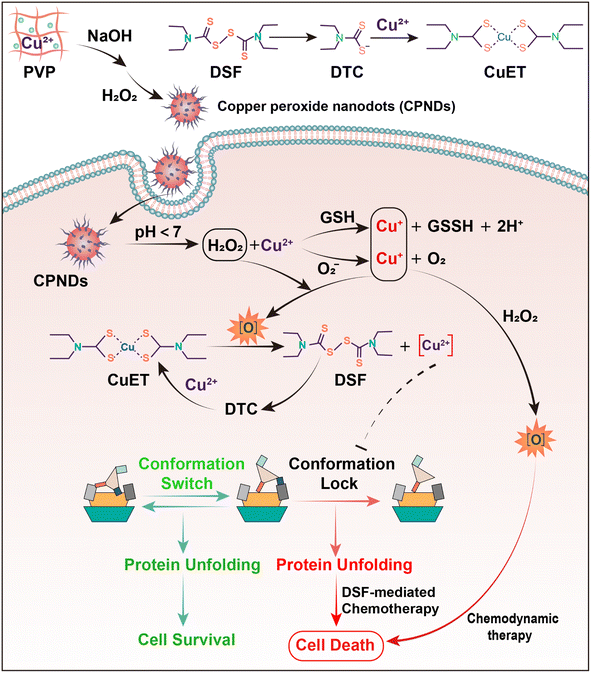 | ||
| Scheme 1 Schematic illustration of the synthesis of PVP-coated CuO2 nanodots and change of NPL4 structure to induce tumor cell death via DSF-based chemotherapy and ·OH-based chemodynamic therapy. | ||
Results and discussion
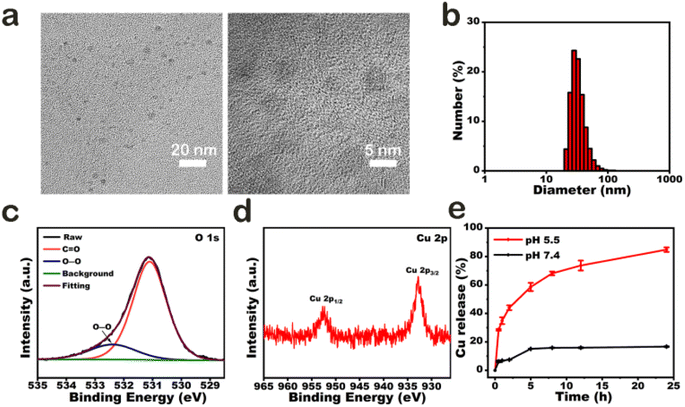
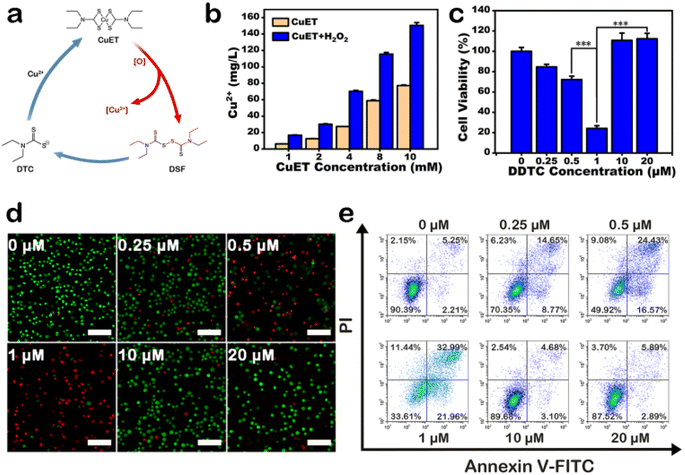
CPNDs were synthesized by reacting copper(II) chloride (CuCl2), H2O2, and sodium hydroxide (NaOH) at room temperature. The CuO2 nanodots generated were coated with PVP, which is a stabilizer and a good nanoparticle dispersant.34–36 Transmission electron microscopy images (Fig. 1a) and dynamic light scattering (Fig. 1b) demonstrated that CPNDs were of uniform size and good dispersibility, respectively. In X-ray photoelectron spectroscopy (XPS) spectra, the peak of O 1s at 532.38 eV was assigned to O–O (Fig. 1c), and two Cu 2p peaks at 932.78 and 952.73 eV indicated that the valence of Cu was +2 (Fig. 1d and S1b†). Collectively, these results showed that CPNDs were synthesized successfully. In the acidic tumor microenvironment (TME),37 CPNDs are decomposed into Cu2+ ions and H2O2. The release of Cu2+ ions by CPNDs was enhanced under acidic conditions (Fig. 1e). An assay using 3,3′,5,5′-tetramethylbenzidine (TMB), which can be oxidized by ·OH with maximum absorbance at 650 nm, was used to detect the generation of ˙OH. The absorption peak at 650 nm increasing under the acidic condition indicated that the ·OH generation of CPNDs could be pH dependent (Fig. S2†). DSF can be metabolized into DTC, which can chelate Cu2+ to form CuET,38–43 a complex with anti-tumor activity (Fig. S3†). To synthesize CuET in vitro, we used sodium diethyldithiocarbamate (DDTC) to chelate Cu2+ to afford CuET. The DDTC and CuCl2 reaction mixture showed an absorption peak at ∼444 nm,44 which indicated the generation of CuET (Fig. S4†). To investigate the reaction between CPNDs and DDTC, DDTC was added into an aqueous solution of CPNDs at different pH. The results showed that the absorbance at ∼444 nm increased at acidic condition, indicating that lower pH promoted CuET production and Cu2+ ion release (Fig. S5 and S6†).Under oxidative conditions, CuET has been shown to decompose into Cu2+ ions, which interact with zinc finger motifs in NPL4,19 which is involved in cellular protein metabolism. First, we synthesized a solution of CuET by reacting DDTC and CuCl2, with H2O2 as an oxidative reagent. After reacting for 24 h, the solution was centrifuged, and the supernatant was collected to detect Cu2+ ion content using ICP-MS (Fig. 2b and S7†). The results showed that the concentration of Cu2+ ions was higher in the CuET solution with H2O2, which indicated that oxidative conditions accelerated CuET decomposition into Cu2+ ions. In addition, a cycle of DSF, DTC, and Cu2+ was observed in cells containing CuET, which could increase the cellular Cu2+ ion level and bypass the copper transporter system (Fig. 2a). To confirm the existence of this cycle, the cytotoxicity of DDTC at different concentrations (0, 0.25, 0.5, 1, 10, and 20 μM) with 1 μM CuCl2 was investigated. Cell viability decreased with increasing DDTC concentration until 1 μM (Fig. 2c). However, at 10 μM and 20 μM DDTC, cell viability was 110.8% and 112.3%, respectively, compared with 24.2% at 1 μM DDTC. This result indicated that excessive DDTC rescued the damage to the structure of NPL4 by chelating Cu2+ ions released from CuET. To directly visualize live or dead cells after treatment with different concentrations of DDTC with CuCl2, calcein-AM/propidium iodide (PI) fluorescent dyes were used to label A375 cells. The result showed that dead cells were fewer when concentrations of DDTC were much higher than that of Cu2+ ions, which was consistent with the CCK-8 assay (Fig. 2d). This conclusion was further confirmed by apoptosis assay using flow cytometry (Fig. 2e). In addition, the assay indicated that CuET induced apoptotic A375 cell death. In conclusion, to improve the efficiency of CuET-induced chemotherapy, in addition to a suitable amount of DSF, excess Cu2+ ions and oxidative conditions are very important.
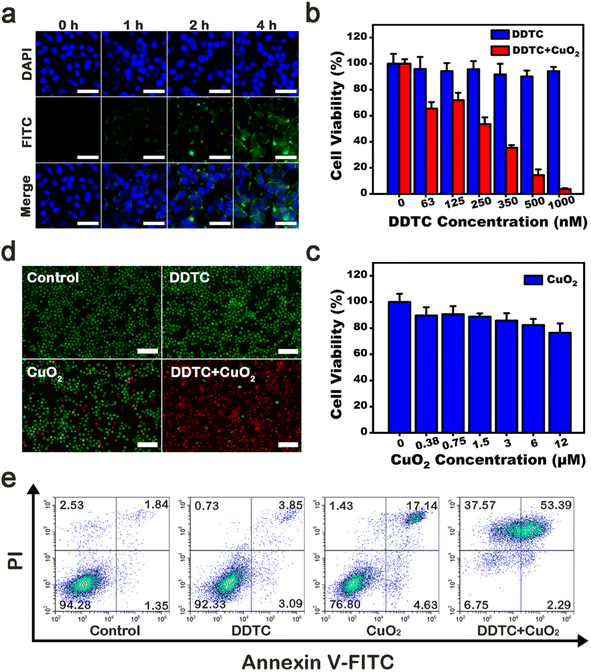
CPNDs were endocytosed into tumor cells and later rapidly decomposed in the acidic environment of endo/lysosomes.45 First, we used fluorescence microscopy to observe the efficiency of intracellular uptake of FITC-labeled CPNDs. After co-incubation for 4 h, enhanced green fluorescence signals were seen around the nucleus, which indicated that most CPNDs were localized in the cytoplasm (Fig. 3a). This result was confirmed by quantitative flow cytometry evaluation (Fig. S8†). Then, the synergistic effect of DDTC combined with CPNDs and cytotoxicity of DDTC at different concentrations (0, 63, 125, 250, 350, 500, and 1000 nM) with or without CPNDs were investigated. To ensure sufficient Cu2+ ions, the concentration of the Cu2+ donor, CPNDs, was 8 μM.46 Experimental results depicted that the viability of A375 cells remained high after incubation with free DDTC. In contrast, the viability of cells treated with DDTC combined with CPNDs decreased, which could be ascribed to CuET-induced chemotherapy and CPND-induced CDT (Fig. 3b). In addition, the viability of cells treated with CPNDs at action concentrations remained high, which indicated that the cytotoxicity of CuET-induced chemotherapy was much stronger than that of CPND-induced CDT (Fig. 3c). To directly observe the efficiency of these agents, calcein-AM/propidium iodide (PI) fluorescent dyes were used to label A375 cells (Fig. 3d). The results showed that cells in the control group and DDTC-treated cells displayed strong green fluorescence, indicating that they were living cells. In contrast, cells in the CPND group showed little red fluorescence, and cells in the DDTC group combined with the CPND group showed strong red fluorescence, indicating that they were dead cells. These observations indicated that treatment with DDTC combined with CPNDs had a significant therapeutic effect on A375 cells. Furthermore, an apoptosis assay was performed using Annexin V-FITC/PI staining and flow cytometry. The results showed that the combined treatment of DDTC and CPNDs could increase the apoptosis of A375 cells (Fig. 3e).
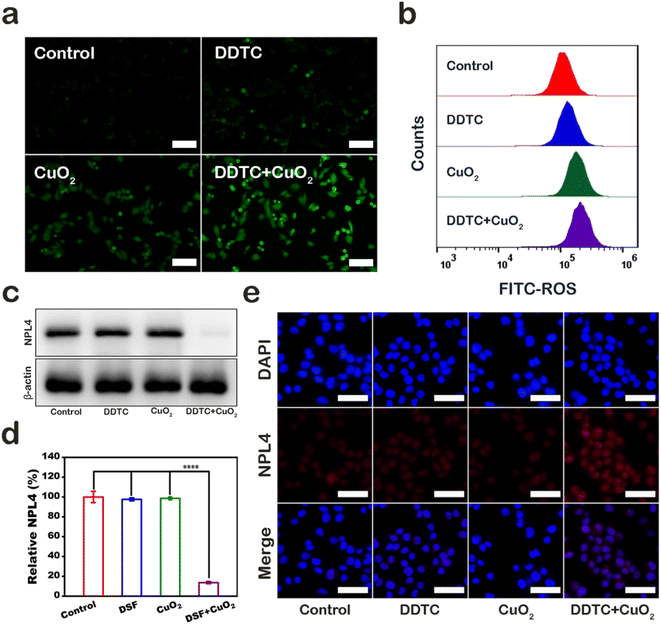
The mechanism of A375 cell damage was also explored. First, we used 2′,7′-dichlorofluorescein diacetate (DCFH-DA), which can be oxidized by ROS into green fluorescent 2′,7′-dichlorofuorescin (DCF), to detect the level of ROS in A375 cells after treatment. Cells in control, DDTC, CPND group, and combined treatment groups showed no fluorescence, little green fluorescence, and strong green fluorescence, respectively (Fig. 4a). Furthermore, the result of the quantitative flow cytometry evaluation was consistent with fluorescence patterns (Fig. 4b). Melanoma cells were shown to be highly sensitive to DSF, which could increase the level of intracellular ROS. In addition, CPNDs could increase the ROS level in cells via CDT. Our results demonstrated that the combined treatment caused cell damage by inducing high ROS levels, which could be attributed to the synergistic effect of CPNDs and DDTC. DTC, a metabolite of DSF, has been shown to chelate Cu2+ to form CuET. Under an oxidative environment, CuET could be decomposed into Cu2+, which binds and immobilizes NPL4, an adaptor of p97 segregase, inhibiting protein metabolism. First, we extracted the cytoplasmic protein of A375 cells and measured NPL4 in the cytoplasm. The results showed that the expression of NPL4 decreased after the combined treatment (Fig. 4c and d). Then, we used immunofluorescence staining to evaluate the NPL4 protein status. The result showed that the NPL4 protein aggregated in the nucleus after treatment with DDTC combined with CPNDs (Fig. 4e).
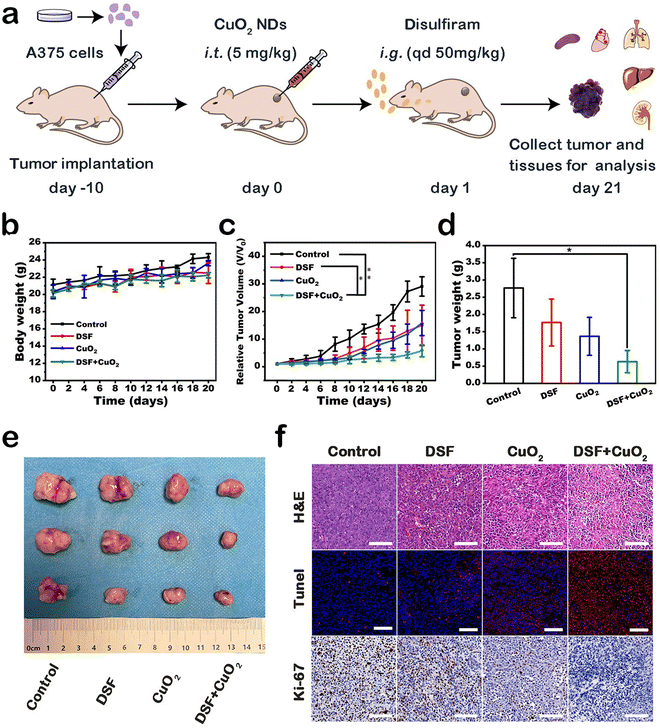
Encouraged by the therapeutic efficacy in vitro, we further evaluated the therapeutic effect of DSF combined with CPNDs on A375 tumor-bearing mice (Fig. 5a). The mice were divided into four groups: control, DSF, CuO2, and DSF + CuO2. After treatment, the inhibition rate in the DSF group and CuO2 group was 48.5% and 45.6%, respectively. Comparatively, the inhibition rate of the combined treatment group was 80.1% (Fig. 5c). These results indicated that DSF combined with CuO2 had better synergetic efficacy than the other groups. Tumor weights and corresponding digital pictures were directly consistent with these results (Fig. 5d and e). In addition, body weights (Fig. 5b) and major organs (heart, liver, spleen, lung, and kidney) of the mice showed no obvious changes and damage, which indicated that the treatments induced no significant side effects (Fig. S9†).
Hematoxylin–eosin (H&E) staining, Ki-67 immunohistochemistry staining, and TUNEL fluorescence staining were performed to show histological changes and cell inhibition in tumor sections (Fig. 5f). Remarkably, based on H&E staining results, the largest area of tissue necrosis was in the DSF + CuO2 group. TUNEL staining and Ki-67 staining indicated significant tumor cell apoptosis and suppression of tumor cell proliferation, respectively. In general, these results provided show that the therapeutic strategy combining DSF with CPNDs exhibited good tumor inhibition efficacy.
Conclusion
Previous studies report that DSF-based chemotherapy still suffers from low efficacy and biosafety. In this work, exploiting the drug delivery mechanisms of nanomedicine, we constructed a novel treatment scheme for improving the efficacy of DSF-based chemotherapy and demonstrated its biosecurity via oral uptake of DSF orally and intratumoral injection of CPNDs to treat melanoma. In the acidic TME, CPNDs dissolved in saline can be broken up into Cu2+ ions and H2O2, and the released Cu2+ ions are reduced to Cu+ by GSH and O2− in tumor cells, and Cu+ readily reacts with H2O2 to generate ·OH via a Fenton-like reaction. This smart DSF/Cu2+ delivery strategy effectively inhibited tumor growth by 80.1% in vivo through highly effective DSF-based chemotherapy and highly toxic ·OH via CPND-induced Fenton-like reaction. This scheme provides sufficient Cu2+ ions and oxidative condition for improving the efficacy of DSF-based chemotherapy. Meanwhile, the therapeutic schedule conforms to the principles of clinical medication, providing a new idea for the clinical treatment of melanoma. One limitation of this study is that the permeability and metabolism of nanoparticles via intratumoral injection were not studied. Therefore, it is necessary to explore the mechanism of intratumoral injection of nanoparticles to perfect this treatment scheme.Experimental section
Synthesis and characterization of CPNDs
CPNDs were synthesized on the basis of a reported method.42 First, 0.0085 g of CuCl2·2H2O and 0.5 g of PVP were added to deionized water (5 mL) to form a homogeneous solution by magnetic stirring. Next, 5 mL of deionized water containing NaOH (0.004 g) was added to the above solution and continuously stirred to form a green solution. Subsequently, H2O2 (100 μL) was added to the mixed solution and stirred for 30 min. The resultant CPNDs were obtained by ultrafiltration and washed three times.TEM imaging was carried out with a JEOL JEM-2100F transmission electron microscope. Hydrodynamic particle size distribution was determined using dynamic light scattering (DLS) (Zetasizer Nano ZS90; Malvern Instruments, Malvern, UK). XPS analysis was performed with a K-Alpha instrument (Thermo Fisher Scientific, Waltham, MA, USA). The content of copper was determined using inductively coupled plasma mass spectrometry (ICP-MS) (Agilent 5110, USA). UV/visible absorption spectra were measured with a Lambda-750 spectrometer (PerkinElmer, Shanghai, China).
pH-responsive decomposition of CPNDs
The acidic-induced dissociation of CPNDs was evaluated by ICP-MS. Briefly, CPNDs were dissolved in buffer solutions with different pH values (7.4 or 5.5). Then, dialysates were withdrawn from each sample at given times (0.5, 1, 2, 5, 8, 12, and 24 h), and released Cu2+ was determined by ICP-MS.Synthesis of CuET
To prepare CuET, DDTC aqueous solution (1.5 mL and 1 mM) was slowly added into 1.5 mL of CuCl2 at different concentrations (20, 10, 1, 0.1, and 0.05 mM). After that, to prove the generation of CuET that has a characteristic absorption peak at ∼444 nm, the UV/visible absorption spectra of mixed solutions were measured.pH-dependent reaction between DDTC and CPNDs
To verify that the amount of CuET, produced by the reaction between DDTC and CPNDs, is pH-dependent, 1.5 mL of CPNDs (1 mM) was mixed for 2 h at different pH values (7.4 or 5.0). Next, 1.5 mL of DDTC aqueous solution (1 mM) was slowly added to the above solution. Then, after mixing for 30 min, the generation of CuET was determined by the absorption increase at ∼444 nm.Cu2+ release from CuET under oxidative condition
First, 0.5 mL of CuCl2 aqueous solution was mixed with 1 mL of DDTC aqueous solution to prepare CuET. The concentrations of the above two solutions were 1 mM, 2 mM, 4 mM, 8 mM, and 10 mM. Each concentration of the mixed solution was prepared in duplicate. Then, 200 μL of H2O2 was added to one group of the solutions. After 24 h, two groups of the solutions were centrifuged, and 1 mL of supernatant of each sample was collected. Finally, the supernatant was diluted with 4 mL of concentrated nitric acid and later analyzed for copper content using ICP-MS.Cell culture
A human melanoma cell line (A375 cells) was purchased from the Cell Bank of the Chinese Academy of Sciences (Shanghai, China). A375 cells were seeded in DMEM supplemented with 10% FBS, penicillin (100 μg mL−1), and streptomycin (100 μg mL−1) at 37 °C and in 5% CO2 atmosphere.Performance of CuET cycle
The performance of the CuET cycle was verified by CCK-8 assay, live-dead cell staining assay, and cell apoptosis analysis. First, A375 cells were seeded in 96-well plates (1 × 10⁴ per well). Then, the cells were incubated with varying doses of DDTC (0, 0.25, 0.5, 1, 10, and 20 μM) and 1 μM of CuCl2·2H2O. After co-culturing for 24 h, the cell viability was determined by the CCK-8 assay.To observe the live and dead cells, the cells were seeded in 6-well plates (1 × 10⁵ per well) and treated as described above for 24 h. After that, the cells were stained by Calcein-AM (2 μM) and PI (4.5 μM) for 15 min and visualized by a fluorescence microscope (Nikon Corporation, Japan). For cell apoptosis analysis, after being treated as described above, the cells were incubated with FITC (5 μL) and PI (10 μL) in Annexin-binding buffer (195 μL) for 15 min and further analyzed using a flow cytometer (CytoFLEX, Beckman, USA).
Cellular uptake of CPNDs
Briefly, 1 mg of FITC was dissolved in 10 mL of DMSO, and then, 1 mL of the above solution was mixed with CPND aqueous solution and stirred for 12 h. FITC-CuO2 nanodots were obtained by ultrafiltration and washed three times.A375 cells were seeded in confocal dishes (1 × 10⁵ per well) and treated with the FITC-CuO2 nanodots (1 mL, 8 μM) at various times (0, 1, 2, and 4 h). For fluorescence microscopy observation, nuclei were stained with DAPI for 5 min, followed by washing three times and visualization with fluorescence microscopy. In addition, flow cytometry analysis was used to obtain the quantitative data of FITC reflecting cell phagocytosis.
In vitro anti-cancer efficacy of DDTC and CPNDs
A375 cells were seeded in 96-well plates (1 × 10⁴ per well). Further, the cells were treated with 100 μL of various doses of CPNDs (0, 0.38, 0.75, 1.5, 3, 6, and 12 μM) and DDTC (0, 63, 125, 250, 350, 500, and 1000 nM) for 24 h. To investigate the cytotoxicity of the combination of CPNDs and DDTC, the cells were co-cultured with 50 μL of CPNDs (8 μM) and 50 μL of DDTC (0, 63, 125, 250, 350, 500, and 1000 nM) for 24 h. The CCK-8 assay was carried out to determine the cell viability. Subsequently, live-dead cell staining assay and cell apoptosis analysis were used to verify the therapeutic effects of the combination of CPNDs and DDTC on A375 cells.In vitro ROS generation
A375 cells were treated with DDTC (1 μM), CPNDs (8 μM), and a combination of the two for 2 h. Then, the cells were stained with DCFH-DA (10 μM) for 20 min, and fluorescence images were recorded. Further, flow cytometry analysis was used to obtain the quantitative data of ROS generation.Measurement of NPL4 by western blot assay
Western blot assay was used to determine the expression of NPL4 in the cytoplasm of A375 cells after different treatments. First, A375 cells were seeded in a 6-well plate (1 × 10⁵ per well) for 24 h. DDTC (1 μM), CPNDs (8 μM), and a combination of the two were then added into cells and incubated for 4 h, and proteins were lysed by RIPA lysis buffer. A BCA Protein Quantification Kit was used to determine the total protein. Next, the proteins were separated by sodium dodecylsulfate-polyacrylamide gel electrophoresis (SDS-PAGE) and followed by transferring onto a polyvinylidene fluoride (PVDF) membrane. Further, the membrane was incubated with the primary antibody NPL4 (1![[thin space (1/6-em)]](https://www.rsc.org/images/entities/char_2009.gif) :
:![[thin space (1/6-em)]](https://www.rsc.org/images/entities/char_2009.gif) 1000) at 4 °C overnight. After that, the membrane was incubated with a relevant secondary antibody (1
1000) at 4 °C overnight. After that, the membrane was incubated with a relevant secondary antibody (1![[thin space (1/6-em)]](https://www.rsc.org/images/entities/char_2009.gif) :
:![[thin space (1/6-em)]](https://www.rsc.org/images/entities/char_2009.gif) 1000) for 1 h. Finally, the membrane was visualized on an enhanced chemiluminescence imaging system (ChemiScope 6100, Shanghai, China), and band intensities were quantified using ImageJ software.
1000) for 1 h. Finally, the membrane was visualized on an enhanced chemiluminescence imaging system (ChemiScope 6100, Shanghai, China), and band intensities were quantified using ImageJ software.
Immunofluorescence staining
A375 cells were seeded in confocal dishes (1 × 10⁵ per well) and treated with compounds at above-mentioned concentrations for 2 h. Subsequently, the cells were fixed with 4% methanol for 10 min at room temperature, washed with PBS, and permeabilized with 0.5% Triton X-100 for 5 min. Then, the cells were incubated in 1% BSA in 0.1% PBS-Tween for 1 h to block non-specific protein–protein interactions. Next, the cells were incubated with the primary antibody NPL4 (1![[thin space (1/6-em)]](https://www.rsc.org/images/entities/char_2009.gif) :
:![[thin space (1/6-em)]](https://www.rsc.org/images/entities/char_2009.gif) 200) for 2 h at room temperature, followed by PBS washes and staining with fluorescently conjugated secondary antibody for 60 min at room temperature. The nuclei were stained with DAPI for 5 min, followed by washing three times and visualized with fluorescence microscopy.
200) for 2 h at room temperature, followed by PBS washes and staining with fluorescently conjugated secondary antibody for 60 min at room temperature. The nuclei were stained with DAPI for 5 min, followed by washing three times and visualized with fluorescence microscopy.
Animal and tumor model
BALB/c nude mice (4–6 weeks) were purchased from Changzhou Cavens Experimental Animal Co. Ltd (Changzhou, China). All animal experiments were conducted according to protocols approved by the Institutional Animal Care and Use Committee (IACUC) of Nanjing Medical University (Animal Welfare Ethics acceptance number no. IACUC-2110015). To build the melanoma tumor model, 100 μL of A375 cells (1 × 10⁷ cells) in PBS was injected into the subcutaneous space of the hind leg. When the tumor volume reached about 60–80 mm3, the mice were used for further examination.In vivo anti-cancer efficacy of DSF and CPNDs
The A375 tumor-bearing mice were randomly assigned to four groups (n = 3 per group), and the treatment was set as follows. Group 1: saline; group 2: DSF (50 mg kg−1); group 3: CPNDs (5 mg kg−1); and group 4: DSF + CPNDs (50 mg kg−1 + 5 mg kg−1). First, group 3 and group 4 were intratumorally injected with 50 μL of CPNDs. At 24 h postinjection, group 1 was given 50 μL of saline every day. Simultaneously, group 2 and group 4 were given 50 μL of saline containing DSF every day. During the treatment, the tumor size of each group was measured with a digital vernier caliper every other day for 21 days. The tumor volume was calculated using the following equation: volume = (horizontal × vertical2)/2. Meanwhile, the body weight was measured. On day 21, the mice of all groups were sacrificed for further histological examination.Statistical analysis
Statistical analysis was performed using SPSS 25 software. All data are presented as mean ± standard deviation (SD). The statistical significance of differences was conducted with Student's two-tailed t-test (*P < 0.05; **P < 0.01; and ***P < 0.001).Author contributions
Yingqian Gao: conceptualization, methodology, data curation, investigation, writing – original draft, writing – review & editing. Xiaojun Cai: conceptualization, methodology, writing – review & editing. Weijuan Zou: conceptualization, methodology, data curation. Xiuzhen Tang: conceptualization, methodology, data curation. Lixian Jiang: conceptualization, methodology, data curation. Junnian Hao: conceptualization, methodology, data curation. Yuanyi Zheng: conceptualization, supervision, project administration, writing – review & editing. Xinhua Ye: writing – review & editing. Tao Ying: writing – review & editing. Ao Li: writing – review & editing.Conflicts of interest
There are no conflicts to declare.Acknowledgements
The authors thank Dr Yuanyi Zheng (Department of Ultrasound in Medicine, Shanghai Sixth People's Hospital Affiliated to Shanghai Jiao Tong University School of Medicine) for providing funding and experimental platforms. This work was supported by the National Nature Science Foundation of China (NSFC, 82030050 and 82371979).References
- Q. Zuo, T. Li, L. Huang, Z. Liu and W. Xue, Biomater. Sci., 2023, 11(14), 5025–5045 RSC.
- D. C. Ziogas, C. Theocharopoulos, T. Koutouratsas, J. Haanen and H. Gogas, Cancer Treat. Rev., 2023, 113, 102499 CrossRef CAS PubMed.
- N. Zila, O. M. Eichhoff, I. Steiner, T. Mohr, A. Bileck, P. F. Cheng, A. Leitner, L. Gillet, T. Sajic, S. Goetze, B. Friedrich, P. Bortel, J. Strobl, R. Reitermaier, S. A. Hogan, J. M. Martinez-Gomez, R. Staeger, F. Tuchmann, S. Peters, G. Stary, M. Kuttke, A. Elbe-Buerger, C. Hoeller, R. Kunstfeld, W. Weninger, B. Wollscheid, R. Dummer, L. E. French, C. Gerner, R. Aebersold, M. P. Levesque and V. Paulitschke, Clin. Cancer Res., 2024, 30, 159–175 CrossRef PubMed.
- L. P. Zijlker, A. Eggermont and A. van Akkooi, Eur. J. Cancer, 2023, 178, 82–87 CrossRef PubMed.
- L. P. Zijlker and A. van Akkooi, Br. J. Surg., 2022, 109(5), 397–398 CrossRef PubMed.
- L. Zimmer, E. Livingstone, J. C. Hassel, M. Fluck, T. Eigentler, C. Loquai, S. Haferkamp, R. Gutzmer, F. Meier, P. Mohr, A. Hauschild, B. Schilling, C. Menzer, F. Kieker, E. Dippel, A. Rosch, J. C. Simon, B. Conrad, S. Korner, C. Windemuth-Kieselbach, L. Schwarz, C. Garbe, J. C. Becker and D. Schadendorf, Lancet, 2020, 395(10236), 1558–1568 CrossRef CAS PubMed.
- Y. Zhu, J. Xue, W. Chen, S. Bai, T. Zheng, C. He, Z. Guo, M. Jiang, G. Du and X. Sun, J. Controlled Release, 2020, 322, 300–311 CrossRef CAS PubMed.
- M. J. Zoratti, T. Devji, O. Levine, L. Thabane and F. Xie, Cancer Treat. Rev., 2019, 74, 43–48 CrossRef CAS PubMed.
- A. Wong, A. Billett and D. Milne, Oncologist, 2019, 24(11), e1190–e1196 CrossRef PubMed.
- H. Wang, T. T. Tran, K. T. Duong, T. Nguyen and U. M. Le, Mol. Pharm., 2022, 19(12), 4487–4505 CrossRef CAS PubMed.
- P. Van Lith, K. Schreuder, M. Jalving, A. Reyners, L. B. Been, E. Racz, H. P. Fransen and M. Louwman, J. Dermatol., 2023, 51, 584–591 CrossRef PubMed.
- F. Zhang, M. Li, J. Wang, X. Liang, Y. Su and W. Wang, AAPS PharmSciTech, 2016, 17(3), 539–552 CrossRef CAS PubMed.
- B. Yang and J. Shi, Angew Chem. Int. Ed. Engl., 2020, 59(49), 21829–21838 CrossRef CAS PubMed.
- J. Zhou, Q. Yu, J. Song, S. Li, X. L. Li, B. K. Kang, H. Y. Chen and J. J. Xu, Angew Chem. Int. Ed. Engl., 2023, 62(12), e202213922 CrossRef CAS PubMed.
- Y. Zhang, Y. Guo, S. M. Gough, J. Zhang, K. R. Vann, K. Li, L. Cai, X. Shi, P. D. Aplan, G. G. Wang and T. G. Kutateladze, Nat. Commun., 2020, 11(1), 3339 CrossRef CAS PubMed.
- P. Zhang, C. Zhou, X. Ren, Q. Jing, Y. Gao, C. Yang, Y. Shen, Y. Zhou, W. Hu, F. Jin, H. Xu, L. Yu, Y. Liu, X. Tong, Y. Li, Y. Wang and J. Du, Redox Biol., 2023, 69, 103007 CrossRef PubMed.
- H. Zhang, Q. Zhang, Z. Guo, K. Liang, C. Boyer, J. Liu, Z. Zheng, R. Amal, S. Yun and Z. Gu, J. Colloid Interface Sci., 2022, 615, 517–526 CrossRef CAS PubMed.
- Z. Skrott, M. Mistrik, K. K. Andersen, S. Friis, D. Majera, J. Gursky, T. Ozdian, J. Bartkova, Z. Turi, P. Moudry, M. Kraus, M. Michalova, J. Vaclavkova, P. Dzubak, I. Vrobel, P. Pouckova, J. Sedlacek, A. Miklovicova, A. Kutt, J. Li, J. Mattova, C. Driessen, Q. P. Dou, J. Olsen, M. Hajduch, B. Cvek, R. J. Deshaies and J. Bartek, Nature, 2017, 552(7684), 194–199 CrossRef CAS PubMed.
- M. Pan, Q. Zheng, Y. Yu, H. Ai, Y. Xie, X. Zeng, C. Wang, L. Liu and M. Zhao, Nat. Commun., 2021, 12(1) Search PubMed.
- Z. Skrott, D. Majera, J. Gursky, T. Buchtova, M. Hajduch, M. Mistrik and J. Bartek, Oncogene, 2019, 38(40), 6711–6722 CrossRef CAS PubMed.
- C. Chen, D. Nie, Y. Huang, X. Yu, Z. Chen, M. Zhong, X. Liu, X. Wang, S. Sui, Z. Liu, J. Tan, Z. Yu, Y. Li and C. Zeng, J. Leukocyte Biol., 2022, 112(4), 919–929 CrossRef CAS PubMed.
- H. Zhang, F. Song, C. Dong, L. Yu, C. Chang and Y. Chen, J. Nanobiotechnol., 2021, 19(1), 290 CrossRef CAS PubMed.
- Y. Yang, Y. Zhu, K. Wang, Y. Miao, Y. Zhang, J. Gao, H. Qin and Y. Zhang, J. Nanobiotechnol., 2023, 29, 116–131 CAS.
- W. Liu, H. Xiang, M. Tan, Q. Chen, Q. Jiang, L. Yang, Y. Cao, Z. Wang, H. Ran and Y. Chen, ACS Nano, 2021, 15(4), 6457–6470 CrossRef CAS PubMed.
- Y. Zi, K. Yang, J. He, Z. Wu, J. Liu and W. Zhang, Adv. Drug Delivery Rev., 2022, 188, 114449 CrossRef CAS PubMed.
- I. Biancacci, F. De Lorenzi, B. Theek, X. Bai, J. N. May, L. Consolino, M. Baues, D. Moeckel, F. Gremse, S. von Stillfried, S. A. El, K. Benderski, S. A. Azadkhah, A. Wang, J. Momoh, Q. Pena, E. M. Buhl, J. Buyel, W. Hennink, F. Kiessling, J. Metselaar, Y. Shi and T. Lammers, Adv. Sci., 2022, 9(10), e2103745 CrossRef PubMed.
- M. Ikeda-Imafuku, L. Wang, D. Rodrigues, S. Shaha, Z. Zhao and S. Mitragotri, J. Controlled Release, 2022, 345, 512–536 CrossRef CAS PubMed.
- S. Wilhelm, A. J. Tavares, Q. Dai, S. Ohta, J. Audet, H. F. Dvorak and W. C. W. Chan, Nat. Rev. Mater., 2016, 1(5), 16014 CrossRef CAS.
- Z. Zhang, Q. Deng, C. Xiao, Z. Li and X. Yang, Acc. Chem. Res., 2022, 55(4), 526–536 CrossRef CAS PubMed.
- A. Zottel, P. A. Videtic and I. Jovcevska, Materials, 2019, 12(10) CrossRef CAS PubMed.
- Q. Zhou, J. Xiang, N. Qiu, Y. Wang, Y. Piao, S. Shao, J. Tang, Z. Zhou and Y. Shen, Chem. Rev., 2023, 123(18), 10920–10989 CrossRef CAS PubMed.
- Y. Lu, Q. Pan, W. Gao, Y. Pu, K. Luo, B. He and Z. Gu, Biomaterials, 2022, 281, 121335 CrossRef CAS PubMed.
- X. Xie, W. Gao, J. Hao, J. Wu, X. Cai and Y. Zheng, J. Nanobiotechnol., 2021, 19, 126 CrossRef CAS PubMed.
- W. Zuo, Y. Guo, C. Zhang, L. Zhang and S. Zhang, Small, 2023, e2309126 CrossRef PubMed.
- Z. N. Zulcaif, A. Mahmood, R. M. Sarfraz and A. Elaissari, Micromachines, 2022, 13, 1304 CrossRef PubMed.
- W. S. Zou, Y. Xu, W. Kong, Y. Wang, J. Zhang, W. Li and H. Q. Yu, Anal. Chem., 2023, 95, 1985–1994 CrossRef CAS PubMed.
- H. Zubair, M. A. Khan, S. Anand, S. K. Srivastava, S. Singh and A. P. Singh, Semin. Cancer Biol., 2022, 80, 237–255 CrossRef CAS PubMed.
- J. Zhou, Q. Yu, J. Song, S. Li, X. L. Li, B. K. Kang, H. Y. Chen and J. J. Xu, Angew Chem. Int. Ed. Engl., 2023, 62(12), e202213922 CrossRef CAS PubMed.
- L. Zhao, X. Wang, H. Lou, M. Jiang, X. Wu, J. Qin, J. Zhang, X. Guan, W. Li, W. Zhang and J. Ma, J. Colloid Interface Sci., 2022, 624, 734–746 CrossRef CAS PubMed.
- Y. Zhang, G. Qi, X. Qu, B. Wang, K. Ma and Y. Jin, Langmuir, 2022, 38(1), 584–592 CrossRef CAS PubMed.
- X. Peng, Q. Pan, B. Zhang, S. Wan, S. Li, K. Luo, Y. Pu and B. He, Biomacromolecules, 2019, 20(6), 2372–2383 CrossRef CAS PubMed.
- Q. Pan, L. Xie, R. Liu, Y. Pu, D. Wu, W. Gao, K. Luo and B. He, Int. J. Pharm., 2022, 612, 121351 CrossRef CAS PubMed.
- Y. Lu, X. Fan, Q. Pan, B. He and Y. Pu, J. Mater. Chem. B, 2024, 12(8), 2006–2014 RSC.
- H. X. Tang, C. G. Liu, J. T. Zhang, X. Zheng, D. Y. Yang, R. K. Kankala, S. B. Wang and A. Z. Chen, ACS Appl. Mater. Interfaces, 2020, 12(42), 47289–47298 CrossRef CAS PubMed.
- L. Lin, T. Huang, J. Song, X. Ou, Z. Wang, H. Deng, R. Tian, Y. Liu, J. Wang, Y. Liu, G. Yu, Z. Zhou, S. Wang, G. Niu, H. Yang and X. Chen, J. Am. Chem. Soc., 2019, 141(25), 9937–9945 CrossRef CAS PubMed.
- H. Zhang, F. Song, C. Dong, L. Yu, C. Chang and Y. Chen, J. Nanobiotechnol., 2021, 19, 290 CrossRef CAS PubMed.
Footnote |
| † Electronic supplementary information (ESI) available. See DOI: https://doi.org/10.1039/d4ra01075b |
| This journal is © The Royal Society of Chemistry 2024 |

