 Open Access Article
Creative Commons Attribution 3.0 Unported Licence
Urea-driven g-C3N4 nanostructures for highly efficient photoreduction of Cr(VI) under visible LED light: effects of calcination temperature
Faramarz Safari ,
Reza Poursalehi
 * and
Hamid Delavari
Nanotechnology Group, Faculty of Engineering and Technology, Tarbiat Modares University, Tehran, Iran. E-mail: poursalehi@modares.ac.ir
First published on 27th August 2024
Abstract
Graphitic carbon nitride (g-C3N4) nanostructures were synthesized via the calcination of urea at various temperatures ranging between 400 and 600 °C and were utilized for photoreduction of Cr(VI) in aqueous medium. Due to the low adsorption of Cr(VI) on the g-C3N4 surface, a more accurate assessment of the photocatalytic performance of the samples was carried out. Although the characterization showed that the specific surface of samples increased as the calcination temperature increased, the most efficient product in terms of the photoreduction duration of Cr(VI) was produced through the calcination process carried out at 450 °C, which reduced the concentration by more than 99% in 40 minutes. These results demonstrate that the structural and surface properties of g-C3N4 are critical factors that impact the photocatalytic performance. Alongside the calcination temperatures, the concentration of citric acid as a hole scavenger, the source of illumination, pH levels, and the recycling ability of the produced specimen at 450 °C were also investigated. Conspicuously, the photocatalyst works better when more citric acid is present and the pH level decreases. Out of all the cases studied regarding the light source, the 400 nm LED light source was found to be the most efficient. Additionally, even after going through the photoreduction process four times, the photocatalyst still remained highly efficient.
1. Introduction
Hexavalent chromium (Cr(VI)), a hypertoxic heavy metal ion, is prevalent in wastewater originating from various industries such as electroplating, pigment coloring, petroleum refining, and leather tanning.1,2 Cr(VI) has been categorized as a potent carcinogen and mutagen with a significant impact on the health of both humans and animals. The World Health Organization has identified Cr(VI) as a matter of paramount concern with regard to toxic pollutants. With respect to drinking water standards, the recommended maximum acceptable concentration of Cr(VI) is below 50 μg L−1.3,4 Numerous methodologies, inclusive of adsorption, ion exchange, membrane separation, chemical precipitation, bioremediation, and photocatalytic reduction, have been created to eliminate Cr(VI) from wastewater or facilitate its detoxification to the comparatively less hazardous Cr(III).5,6 However, it is important to note that every technique has its own inherent limitations. For instance, adsorption may suffer from saturation, ion exchange may generate sludge and the photoreduction process may require photocatalyst separation. Hence, giving due consideration to the prevailing circumstances and selecting and refining the most fitting approach is a pivotal responsibility that cannot be disregarded.7,8Extensive research has been conducted on renewable, cost-efficient, eco-friendly and highly efficient photocatalytic reactions for the purpose of reducing organic pollutants or heavy metals.9,10 In the past few decades, several materials including TiO2, ZnO, WO3, CdS, Bi2S3 and Fe2O3 nanostructures have been reported to exhibit photocatalytic properties.11–15 Over the past decade, significant interest has been devoted to graphitic carbon nitride (g-C3N4), which is a metal-free polymeric two dimensional (2D) semiconductor that has a narrow band gap that enables effective visible light absorption.16 g-C3N4 is a π-conjugated polymeric n-type semiconductor, with its two chemical structures depicted in Fig. 1.17,18 Moreover, the distinctive characteristics of g-C3N4, such as its low cost and straightforward synthesis, the potential for adjustability and resistance to thermal and chemical degradation, have garnered significant attentions as a research target within the realm of photocatalysis.19 Numerous investigations have additionally directed attention towards the amalgamation and arrangement of g-C3N4 with other semiconductors to refine properties and conduct band gap engineering, as evidenced by a range of studies.20–22
Various organic precursors, including cyanamide, dicyanamide, melamine, urea and thiourea, have been employed in the synthesis of g-C3N4 through polymerization reactions.23 Calcination at atmospheric pressure is a commonly utilized method that is fairly easy to perform in a furnace. The properties of the resultant product are greatly influenced by the conditions under which the heating is conducted, such as the heating rate from room temperature, along with the duration and temperature of the calcination process. Various photoreactions were utilized to investigate the property disparities of g-C3N4, which was synthesized employing different precursors under diverse conditions. The investigation of calcination temperature has been a prevalent parameter for various chemical reactions, including CO2 conversion, H2 production, NO oxidation and dyes photodegradation, such as those observed in methylene blue, methyl orange, rhodamine B and murexide.24–30 Moreover, analogous photoreactions have examined the impact of various factors on the outcome of the reaction, including the precursor substance, heating rate, and duration of calcination.31–33
Investigation of the g-C3N4 efficiency with Cr(VI) photoreduction, besides having environmental benefits, can help to better understand the photoactivity of g-C3N4 because of the very insignificant adsorption of Cr(VI) on the g-C3N4 surface. Based on the results of studies on the effects of calcination temperature, the specific area of g-C3N4 increases as the calcination temperature increases.25,26 The establishment of the adsorption–desorption equilibrium is a common step before the irradiation of the light source in photoreaction experiments and it has also an effect on the reaction kinetics.34 In addition, due to the adsorption of dyes on the g-C3N4 surface, the dye removal efficiency in the adsorption–desorption equilibrium step has been increased by surface area increase. This issue causes different mass transfer conditions at the irradiation step beginning including concentration discrepancy in solution and different concentration gradian in the binary layer on the photocatalyst surface.35 As well as dye adsorption on the photocatalyst surface can affect light adsorption.36 The effect of precursors on g-C3N4 in the photoreduction of Cr(VI) has been studied by Liang et al. and urea has performed the best efficiency between dicyandiamide, melamine, thiourea, and urea.37 Furthermore, numerous studies have been conducted on the improvement of g-C3N4 properties by adding various material for better photoreduction of Cr(VI).38,39 Yang et al. studied the composition of g-C3N4 by three metal oxides, including TiO2, Fe3O4@SiO2 by hydro-gel synthesis method which the best performance was seen by the sample that calcinated at 450 °C.40 Wang et al. studied the g-C3N4/ZnS coupled composite synthesized at 600 °C that can reduce more than 90% of Cr(VI) solution with a concentration of 10 mg L−1 in 120 min under 500 W xenon lamp.41 Xiao et al. succeeded in photoreduction of Cr(VI) by adding α-Fe2O3 to g-C3N4 by hydrothermal method.42 By doping Br in the g-C3N4 structure, Wang et al. reduced Cr(VI) with a concentration of 20 mg L−1 by 60%.43 Also, studies have been conducted on the synthesis of MoS2 and WO3 heterostructures with g-C3N4, and these materials have improved the performance of g-C3N4 in removing the Cr(VI).44,45 Adding other semiconductors, including metal oxides, can be a useful solution for band gap engineering as a result of improving photocatalytic performance. On the other hand, the release of these compounds amid the reaction can cause harmfulness and be challenging. Hence, engineering the properties of carbon nitride alone as a metal-free semiconductor can be a great arrangement for the photoreduction of Cr(VI).
Within the present study, the synthesis of g-C3N4 was conducted through the calcination of urea at varying temperatures ranging from 400 to 600 °C for the investigation of Cr(VI) photoreduction performance. The products were subsequently characterized, including their structural, morphological, optical, and photoreduction performance in regard to Cr(VI). To the best of our knowledge, investigating the impact of urea calcination temperature on the performance of g-C3N4 for the photoreduction of Cr(VI) has not been reported so far. The photocatalyst synthesized at 450 °C exhibited superior efficacy in photoreduction, leading to its selection for further assessment with respect to recycling capacity, citric acid level, light source, and pH impacts.
2. Materials and methods
2.1. Chemicals
Urea (Fluka), potassium dichromate (Ghatran Shimi), citric acid, and 1,5-diphenylcarbazide (Merck), acetone, phosphoric acid, sulfuric acid and sodium hydroxide (Neutron) are of analytical grade and used without further purification.2.2. Preparation of g-C3N4
g-C3N4 was synthesized through the thermal polymerization of urea at various temperatures. Typically, 30 g of urea powder was introduced into a covered alumina crucible along with a volume of 50 mL, after which it was subjected to a heating process at a rate of 5 °C min−1 until reaching temperatures of 400, 450, 500, 550, and 600 °C over a period of 4 hours within a furnace. Upon cooling the furnace to ambient temperature, g-C3N4 powders were collected and were named respectively CN400, CN450, CN500, CN550 and CN600 according to the temperature of the polymerization reaction.2.3. Characterization
The X-ray diffraction (XRD) patterns of the powders were provided by a PANalytical X'Pert Pro instrument with Cu-Kα radiation (k = 1.5406 Å) within the 2θ range from 10° to 80°. The Fourier transform infrared (FTIR) spectra were obtained through the application of an infrared spectrometer (PerkinElme, Spectrum RX I), utilizing the standard KBr disk methodology. Raman spectra were obtained using a Thermo Scientific Nicolet analyzer, using a laser excitation of 532 nm. Scanning electron microscopy (SEM) and energy-dispersive X-ray spectroscopy (EDS) were utilized to analyze the morphology and atomic ratio of content elements of the samples respectively (TSCAN, MIRA III). The nitrogen adsorption–depiction isotherms and the Brunauer–Emmett–Teller (BET) specific surface area of the powders were computed through the use of a surface area and pore size distribution analyzer (Belsorp, mini II). The photoluminescence (PL) spectra and ultraviolet-visible (UV-vis) transmission were acquired utilizing a UV-vis spectrometer (PHYSTECH, UVS-2500) and the excitation wavelengths for PL spectroscopy were 365 and 405 nm.2.4. Photocatalytic test
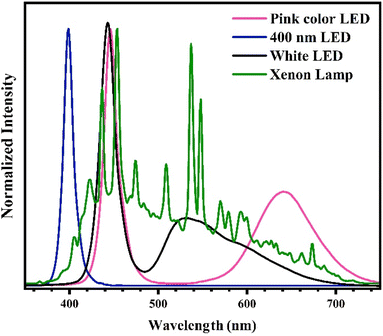
In order to evaluate the Cr(VI) photoreduction efficacy of photocatalysts produced at varied temperatures, a quantity of 20 mg of the powders underwent mixing with 15 mL of deionized water and subsequent ultrasound for 5 min. A volume of 5 mL of a citric acid solution with a concentration of 8 mM and 20 mL of a chromium(VI) solution with a concentration of 40 ppm was introduced into the colloidal photocatalyst. The mixture was subjected to stirring in dark for a period of 20 min to ensure attainment of the adsorption–desorption equilibrium, followed by exposure to a 55 W xenon lamp for a duration of 60 min. At intervals of 10 min, a 2 mL aliquot of colloid was taken and subjected to centrifugation for the purpose of photocatalyst separation. The concentration of Cr(VI) was evaluated utilizing the colorimetric technique employing diphenylcarbazide. Further experiments were conducted in a comparable fashion on the CN450 optimized sample, although with alterations made to the variables such as citric acid concentration with values of 0, 0.5, 1, 1.5 and 2 mM, pH with values of 2, 5, 8 and 11 and different light sources including white LED, 400 nm LED, pink color LED and xenon lamp which the spectra of light sources are displayed in Fig. 2. Furthermore, during the recycling test, the photocatalyst was retrieved through the use of a centrifuge and subjected to a rigorous rinse with deionized water. Citric acid and a freshly prepared solution of Cr(VI) in water were introduced into the colloid of the recycled sample.3. Results and discussion
3.1. Structural properties and morphology
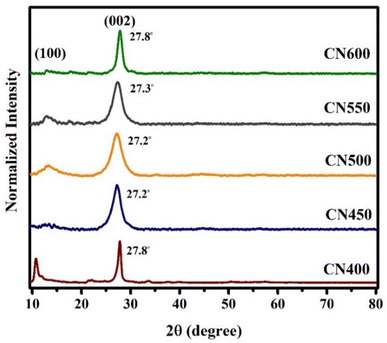
XRD is a reliable methodology to validate and determine the crystal structure of graphitic carbon nitride. XRD patterns of carbon nitrides produced through varying calcination temperatures are depicted in Fig. 3 and consisting with the g-C3N4 JCPDS Card (No. 87-1526). The diffraction peak predominantly associated with the (002) plane is typically observed within the angular range of 2θ = 27.2°–27.8°, which arises due to the interlayer accumulation of the conjugated aromatic system and when the temperature got higher, it initially went down and then went back up. As the temperature of calcination is elevated, a gradual decline is observed in the diffraction angle, followed by an eventual increase. Similarly, there is an initial advancement in peak width, yet this subsequently gives way to a reduction. Furthermore, the aforementioned peak, which is more discernible in CN500 and CN550 samples at 13.1°, corresponds to the in-plane repetition of the tri-s-triazine unit. The XRD pattern obtained from the sample synthesized at a temperature of 400 °C exhibited a distinct peak at 11.2°, which is believed to correspond to intermediate compounds formed during the polymerization reaction of g-C3N4 at low temperature.46The functional groups and chemical bonds contained in the produced g-C3N4 were investigated through exploration using FT-IR spectroscopy. The outcomes FT-IR spectra can be observed in Fig. 4. The samples exhibit analogous patterns within the spectrum spanning 1200–1650 cm−1, with a discernible increase in the sharpness of the absorption peak observable as the temperature of synthesis was heightened. The spectral peaks located at 808 and 889 cm−1 have been assigned to the breathing mode of tri-s-triazine and the deformation mode of N–H bonds, respectively.47,48 The peaks observed at around 1238, 1313, 1400, 1455, and 1558 cm−1 corresponded to the C–N bond and the peak at 1635 cm−1 was associated with C![[double bond, length as m-dash]](https://www.rsc.org/images/entities/char_e001.gif) N stretching vibration mode.49–51 In addition, a broad band in the range of 3000–3500 cm−1 indicates the existence of N–H stretching vibrations.52
N stretching vibration mode.49–51 In addition, a broad band in the range of 3000–3500 cm−1 indicates the existence of N–H stretching vibrations.52
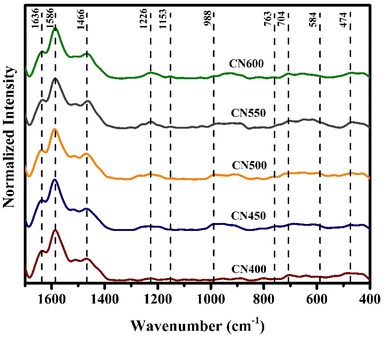
The Raman spectra of prepared samples are depicted in Fig. 5. For g-C3N4, several characteristic peaks at 1636, 1586, 1466, 1226, 1153, 988, 763, 704, 584 and 474 cm−1 were identified, aligning to the typical vibration modes of CN heterocycles. Notably, the most intense peak in the g-C3N4 Raman spectra appears at 1586 cm−1 attributed to the ring-valence vibration of species E′. Additionally, the peak at 584 cm−1 in the lower frequency range is also associated with species E′, while the peak at 980 cm−1 corresponds to the breathing 1 mode of the triazine ring.53,54
Fig. 6 depicts the SEM images acquired from the g-C3N4 samples. The images suggest that changes in the morphology are associated with a rise in temperature. The CN400 sample exhibits agglomerations of substances that are merged together. As the temperature approaches 450 °C, the morphology of the particles tends to exhibit a more plate-like geometry with increased intertwining.27 Upon reaching a temperature of 500 °C, smaller particles become evident, whereas exposure to 550 °C leads to the generation of cavities within smaller particles. Upon attaining a temperature of 600 °C, the particles underwent a transformation and assumed the morphology of small plates.55 The thickness of these particles was subsequently determined as 28 ± 1 nm. Also, the outcomes of the EDS analysis conducted on the powders, are presented in Table 1. The results reveal that the weight ratio of carbon to nitrogen elements exhibited an initial increase with rising temperature, followed by a subsequent decrease.
| Sample | Product to urea mass ratio (%) | Band gap | BET | EDS atomic ratio (W%) | |||||
|---|---|---|---|---|---|---|---|---|---|
| Tauc equation | PL (365 nm) | PL (405 nm) | as (m2 g−1) | Pore volume (cm3 g−1) | C | N | C/N | ||
| CN400 | 10.42 | 2.75 | 2.86 | 2.86 | 8.89 | 0.006 | 34.43 | 65.57 | 0.53 |
| CN450 | 4.63 | 2.65 | 2.79 | 2.81 | 23.68 | 0.181 | 35.08 | 64.92 | 0.54 |
| CN500 | 3.96 | 2.59 | 2.70 | 2.70 | 33.53 | 0.217 | 42.24 | 57.76 | 0.73 |
| CN550 | 2.87 | 2.65 | 2.70 | 2.70 | 67.44 | 0.524 | 35.56 | 64.44 | 0.55 |
| CN600 | 1.42 | 2.89 | 2.77 | 2.73 | 66.84 | 0.688 | 34.13 | 65.87 | 0.52 |
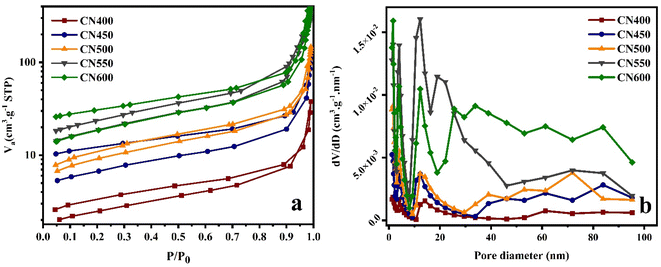
The surface area and porosity of the samples were assessed utilizing N2 adsorption–desorption isotherms. The findings reveal that the samples exhibit an IV adsorption–desorption isotherm displaying a H3 hysteresis loop, indicating the presence of a mesoporous configuration, as illustrated in Fig. 7. The surface area and pore volume of the analyzed specimens were computed and recorded in Table 1, presenting a comprehensive summary of the results. The observed phenomenon may be attributed to variations in the bubbling and oxidation of intermediate compounds that arise during the process of calcination. These outcomes appear to adhere to the morphology alterations that were witnessed during SEM. These factors ultimately contribute to a morphological transformation of the densely packed g-C3N4 to a porous configuration.31,56
3.2. Optical properties
Another important point to consider when evaluating the catalytic activity of a photocatalyst is its ability to respond to light which affects the band gap and light harvesting performance. The optical characteristics of the specimens were examined utilizing UV-vis spectroscopy, and the respective optical absorption spectra are depicted in Fig. 8a. The spectral analysis of CN600 exhibits a discernibly distinct pattern of light absorption in the range of 200 to 550 nm, in comparison to the absorption spectra displayed by other test samples. The absorption spectra of CN450, CN500, and CN550 exhibit comparability, and the spectra of CN450 and CN550 demonstrate a certain degree of similarity. The study conducted aimed to determine the band-gap energies of various samples that were synthesized at varying temperatures. The band-gap energies of samples synthesized at 400, 450, 500, 550, and 600 °C were calculated by the Tauc plot (αhν)2 versus hν, and the estimated values were respectively 2.75, 2.65, 2.59, 2.65, and 2.89 eV as can be observed in Fig. 8b. | ||
| Fig. 8 (a) UV-vis spectra and (b) Tauc equation plot of g-C3N4 synthesized at different temperatures. | ||
To improve the thoroughness of the analysis, photoluminescence (PL) spectra were employed to examine the optical properties of g-C3N4 powders using two distinct excitation light sources with wavelengths at 365 and 405 nm. The PL spectra are illustrated in Fig. 9a and b, for excitation wavelenghts at 365 and 405 nm respectively. The emission peaks observed at distinct wavelengths are attributable to the recombination of electron–hole, which releases light energy equivalent to the band gap energy of the samples of g-C3N4. The energy band gap values obtained through calculation of PL spectrum peaks are presented in Table 1.
 | ||
| Fig. 9 PL spectra of g-C3N4 synthesized at different temperatures by (a) 365 nm (b) 405 nm light source. | ||
3.3. Photocatalytic activity
The effectiveness of g-C3N4 samples, obtained at different calcination temperatures, was examined in the photoreduction of Cr(VI). As illustrated in Fig. 10a, the g-C3N4 photocatalysts demonstrate an insufficient capability to adsorb Cr(VI) potentially attributed to a feeble electrostatic attraction between the anionic chromate species and the negatively charged surface of the catalyst.37 During the period of exposure to radiation, the samples exhibited different degrees of photocatalytic performance. CN450 displayed the highest level of proficiency in reducing Cr(VI) with an efficiency rate of over 99% in just 40 min, compared to CN400 which achieved the same level of efficiency within 50 min. The results indicate that a minimum duration of one hour is necessary for CN500 and CN550 to exhibit a photoreduction rate of more than 99%. Additionally, CN600 demonstrates an 80% photoreduction rate during the identical time duration. The pseudo-first-order method was used to determine the kinetics of chromium photoreduction. Eqn (1) was utilized, where C0, C, k and t are concentrations of Cr(VI) in solution at time 0, concentrations of Cr(VI) in solution at time t, rate constant and reaction time respectively. Also, a visual representation of the results can be seen in Fig. 10b.
 | (1) |
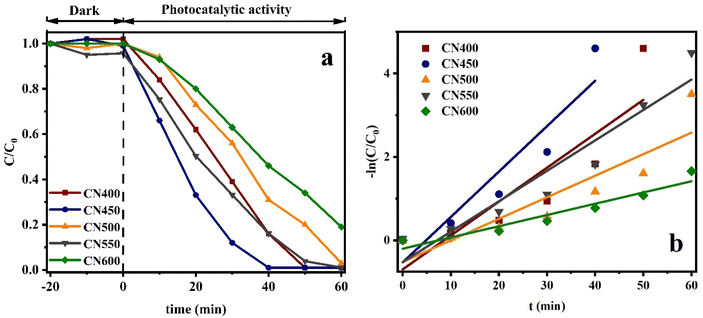 | ||
| Fig. 10 (a) Effect of calcination temperature on the photocatalytic activity of g-C3N4, (b) photocatalytic kinetic constants of g-C3N4. | ||
The values of (k) for samples CN400, CN450, CN500, CN550 and CN600 were calculated, respectively, 0.0813 min−1, 0.1089 min−1, 0.0517 min−1, 0.0729 min−1, and 0.0270 min−1.
To calculate the position of band structure of g-C3N4 and explore the mechanism of photoreduction of Cr(VI) eqn (2) and (3) were utilized. where ECB and EVB represent the conduction band (CB) and valence band (VB) edge potentials, respectively, Ee (∼4.5 eV) is the free electron energy on the scale of hydrogen, X represents the electronegativity of the semiconductor and Eg is the semiconductor band gap. The value of X for g-C3N4 was calculated as 4.67 eV and by referring eqn (2) and (3) the values of calculated VBs and CBs were shown in Fig. 11.57 Moreover, chromium metal is present in two stable oxidation states, Cr(VI) and Cr(III).58 Given that the colorimetric diphenylcarbazide method exclusively identifies Cr(VI), it is anticipated that the quantity of reduced Cr(VI) has converted to Cr(III).59 Based on the calculated values of CBs and VBs, a possible mechanism of photocatalytic Cr(VI) reduction within the presence of citric acid has been suggested as appeared in Fig. 11. The photogenerated electrons in the CB of g-C3N4 are transferred for the photocatalytic reduction of Cr(VI) to Cr(III), and at the same time the citric acid which acts as a sacrificial agent is trapped by photogenerated holes in the VB of g-C3N4.
 | (2) |
| ECB = EVB − Eg | (3) |
The effect of other process variables on g-C3N4 photocatalytic performance such as pH, citric acid concentration, and recycling ability was investigated under xenon lamp on CN450 and the results are shown in Fig. 12a–c respectively. The effectiveness of the photocatalytic reduction process for Cr(VI) is observed to decrease in a substantial manner with an increase in the pH value as mentioned in Fig. 12a. In addition, when pH is 8 and 11, Cr(VI) cannot be reduced at all. In general, the Cr(VI) species are commonly found in tetrahedral oxo-compounds, specifically in the form of CrO42−, at pH levels greater than 5.0, and while they appear as Cr2O72− or HCrO4− at neutral or acidic pH levels ranging from 2.0 to 5.0. Furthermore, the surface charge of the photocatalyst, attributed to the pH level, constitutes a factor that partially accounts for the observed phenomenon.37,60 The results indicate that an excess quantity of hydrogen ions (H+) is present, namely, a state of acidosis. The phenomenon of reduction from photogenerated electrons is stimulated in an environment with increased acidity, as depicted through eqn (4) and (5):37
| Cr2O72− + 14H+ + 6e− → 2Cr3+ + 7H2O | (4) |
| HCrO4− + 7H+ +3e− → Cr3+ + 4H2O | (5) |
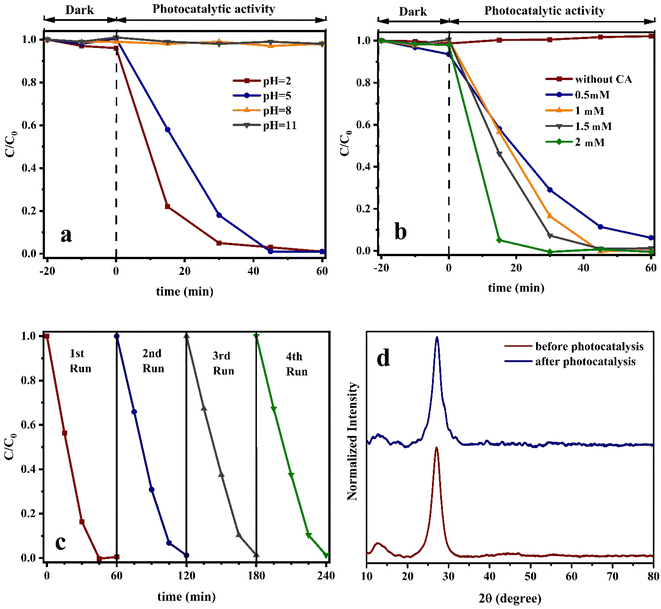 | ||
| Fig. 12 (a) Solution pH, (b) citric acid concentration, (c) recycling effects on CN450 photoreduction of Cr(VI) process under xenon lamp and (d) XRD patterns of CN450 before and after photocatalysis. | ||
In alkaline conditions, electrostatic repulsion between g-C3N4 and Cr(VI) impeded the interaction with photogenerated electrons, resulting in a decrease in the Cr(VI) removal rate by means of eqn (6):37
| CrO42− + 4H2O + 3e− → Cr(OH)3 + 5OH− | (6) |
According to active species trapping experiments especially, tert-butyl alcohol, 2,2,6,6-tetramethylpiperidine-1-oxyl, and methanol scavengers, the efficacy of Cr(VI) removal in photocatalytic reduction reactions mediated by g-C3N4 can be enhanced through the augmentation of organic acids acting as hole-scavenging agents. Photoreduction is the mechanism through which Cr(VI) is reduced in water, with the electrons produced in the CB through photon absorption playing a crucial role in the process. The catalytic process of water oxidation leading to the creation of molecular oxygen is primarily driven by the photogenerated holes found in the valence band. As water oxidation is a complex process that determines the rate and it involves a four-electron transfer reaction. Thus, to attain optimal reduction of Cr(VI) while separating electron–hole pairs efficiently, it is necessary to use a hole scavenger. Therefore, the augmentation of the chromium reduction rate as illustrated in Fig. 12b can be rationalized by the amplification of the citric acid concentration.61–63 It should be noted, citric acid monohydrate without any semiconductor can provide Cr(VI) photoreduction under 400 W metal halide lamp as a light source, therefore should be aware about the role of citric acid in Cr(VI) photoreduction. However, it should be mentioned the best performance of citric acid monohydrate Cr(VI) photoreduction observed at higher concentration under more than 300 W metal halide and high-pressure mercury lamps.64
Fig. 12c exhibits the recuperation rate of the CN450 photocatalyst subsequent to each cycle of the photocatalytic procedure for the purpose of Cr(VI) reduction. Notwithstanding a decrease in the photocatalyst quantity during successive rounds, the fourth round demonstrated considerable efficacy in reducing the concentration of chromium to above 98% of its initial level. Additionally, XRD analysis was conducted following four cycles of photoreduction, as illustrated in Fig. 12d. The CN450 material exhibited successful reutilization, showcasing an almost stable photocatalytic performance.
Photocatalytic materials encounter another challenge in their activation by light, as it hinges upon the spectral composition of the incident light and the bandgap energy of the photocatalyst, necessitating optimal alignment between the two. The use of solar radiation has been widely recognized as a highly advantageous approach to activating the photocatalyst, owing to its environmentally friendly nature. Consequently, due to the comparable and full range of the visible spectrum emitted by the xenon lamp, it has been frequently utilized at high power of intensity in numerous photocatalytic research. In contrast, scholars have investigated the viability of visible LED as source. This approach stems from the fact that the intensity of sunlight is contingent upon the geographical position and time of day, however, the conversion of electrical energy into light via xenon lamps leads to a notable production of heat, the efficacy of LED lamps has also undergone comprehensive examination. Such an investigation is elucidated in Fig. 13. As hypothesized, the efficiency of LED lamps is observed to increase in proportion to the reduction of their radiation wavelengths. The present findings indicate a heightened photocatalytic efficiency in the 400 nm LED light source, which exhibits a lower power consumption compared to its xenon-based counterpart.
4. Conclusion
In this research, structural and optical properties and also photocatalytic activity of g-C3N4 synthesized by different calcination temperatures were investigated. The results of investigation revealed that the morphology and structure of g-C3N4, as well as its photocatalytic capability in reducing Cr(VI), are considerably influenced by the synthesis calcination temperature. Additionally, the findings have demonstrated that elevating the synthesis temperature results in a substantial augmentation of the specific surface area of product. Nonetheless, it is imperative to acknowledge that the augmentation of the specific surface area is not always indicative of enhanced outcomes in the context of g-C3N4 photocatalysis. Also, the calcination temperatures, the concentration of citric acid as a hole scavenger, the source of brightening, pH levels, and the reusing capacity of the sample with highest efficiency were examined. When there is more citric acid and the pH level goes down, the photocatalyst works better. Among the four cases we looked at for the light source, we found that the 400 nm LED worked the best. Furthermore, even after four times going through the process of reducing under light, the photocatalysis reaction has still remained highly efficient.Data availability
The data that support the findings of this study are available from the corresponding author upon request.Conflicts of interest
There are no conflicts to declare.References
- L. Zhang, L. Feng, P. Li, X. Chen, Y. Gao, Y. Gong, Z. Du, S. Zhang, A. Zhang, G. Chen and H. Wang, Chem. Eng. J., 2021, 417, 129222 CrossRef CAS.
- J. Zhou, W. Cai, J. Ding, H. Wan and G. Guan, J. Environ. Chem. Eng., 2021, 9(4), 105292 CrossRef CAS.
- S. Balu, Y.-L. Chen, R. C. Juang, T. C. K. Yang and J. C. Juan, Environ. Pollut., 2020, 267, 115491 CrossRef CAS PubMed.
- L. Zhang, P. Li, L. Feng, X. Chen, J. Jiang, S. Zhang, A. Zhang, G. Chen and H. Wang, Chem. Eng. J., 2020, 397, 125464 CrossRef CAS.
- H. Liu, F. Zhang and Z. Peng, Sci. Rep., 2019, 9(1), 3663 CrossRef PubMed.
- J. Shang, Y. Guo, D. He, W. Qu, Y. Tang, L. Zhou and R. Zhu, J. Hazard. Mater., 2021, 416, 125706 CrossRef PubMed.
- Y. Li, J. Zhang, C. Zhan, F. Kong, W. Li, C. Yang and B. S. Hsiao, Carbohydr. Polym., 2020, 233, 115838 CrossRef PubMed.
- Y. Ren, Y. Han, X. Lei, C. Lu, J. Liu, G. Zhang, B. Zhang and Q. Zhang, Colloids Surf., A, 2020, 604, 125279 CrossRef.
- X. Bai, Y. Du, X. Hu, Y. He, C. He, E. Liu and J. Fan, Appl. Catal., B, 2018, 239, 204–213 CrossRef CAS.
- Y. Sang, X. Cao, G. Dai, L. Wang, Y. Peng and B. Geng, J. Hazard. Mater., 2020, 381, 120942 CrossRef CAS PubMed.
- R. Ameta, M. S. Solanki, S. Benjamin and S. C. Ameta, Advanced Oxidation Processes for Waste Water Treatment, 2018, pp. 135–75 Search PubMed.
- S. N. Ahmed and W. Haider, Nanotechnology, 2018, 29(34), 342001 CrossRef PubMed.
- Z. Shayegan, C.-S. Lee and F. Haghighat, Chem. Eng. J., 2018, 334, 2408–2439 CrossRef CAS.
- S. M. El-Sheikh, A. B. Azzam, R. A. Geioushy, F. M. El Dars and B. A. Salah, J. Alloys Compd., 2021, 857, 157513 CrossRef CAS.
- R. A. Geioushy, S. M. El-Sheikh, A. B. Azzam, B. A. Salah and F. M. El-Dars, J. Hazard. Mater., 2020, 381, 120955 CrossRef PubMed.
- J. Wen, J. Xie, X. Chen and X. Li, Appl. Surf. Sci., 2017, 391, 72–123 CrossRef.
- Y. Wang, B. Gao, Q. Yue and Z. Wang, J. Mater. Chem. A, 2020, 8(37), 19133–19155 RSC.
- P. Murugesan, J. A. Moses and C. Anandharamakrishnan, J. Mater. Sci., 2019, 54(19), 12206–12235 CrossRef.
- F. He, Z. Wang, Y. Li, S. Peng and B. Liu, Appl. Catal., B, 2020, 269, 118828 CrossRef CAS.
- X. Zhang, X. Yuan, L. Jiang, J. Zhang, H. Yu, H. Wang and G. Zeng, Chem. Eng. J., 2020, 390, 124475 CrossRef CAS.
- Y. Chen and X. Bai, Catalysts, 2020, 10(1), 142 CrossRef CAS.
- L. Ai, R. Shi, J. Yang, K. Zhang, T. Zhang and S. Lu, Small, 2021, 17(48), 2007523 CrossRef CAS.
- K. R. Reddy, C. H. V. Reddy, M. N. Nadagouda, N. P. Shetti, S. Jaesool and T. M. Aminabhavi, J. Environ. Manage., 2019, 238, 25–40 CrossRef CAS PubMed.
- J. Yang, X. Zhang, C. Xie, J. Long, Y. Wang, L. Wei and X. Yang, J. Electron. Mater., 2021, 50(3), 1067–1074 CrossRef CAS.
- M. I. Chebanenko, N. V. Zakharova and V. I. Popkov, Russ. J. Appl. Chem., 2020, 93(4), 494–501 CrossRef CAS.
- T. Narkbuakaew and P. Sujaridworakun, Top. Catal., 2020, 63(11), 1086–1096 CrossRef CAS.
- D. R. Paul, R. Sharma, S. P. Nehra and A. Sharma, RSC Adv., 2019, 9(27), 15381–15391 RSC.
- Q. Su, J. Sun, J. Wang, Z. Yang, W. Cheng and S. Zhang, Catal. Sci. Technol., 2014, 4(6), 1556–1562 RSC.
- F. Dong, M. Ou, Y. Jiang, S. Guo and Z. Wu, Ind. Eng. Chem. Res., 2014, 53(6), 2318–2330 CrossRef CAS.
- G. Zhang, J. Zhang, M. Zhang and X. Wang, J. Mater. Chem., 2012, 22(16), 8083–8091 RSC.
- W. Yang, L. Jia, P. Wu, H. Zhai, J. He, C. Liu and W. Jiang, J. Solid State Chem., 2021, 304, 122545 CrossRef CAS.
- Y. Zheng, Z. Zhang and C. Li, J. Photochem. Photobiol., A, 2017, 332, 32–44 CrossRef.
- F. Dong, Z. Wang, Y. Sun, W.-K. Ho and H. Zhang, J. Colloid Interface Sci., 2013, 401, 70–79 CrossRef CAS.
- Y. Deng, Chem. Eng. J., 2018, 337, 220–227 CrossRef CAS.
- D. A. González-Casamachin, J. Rivera De la Rosa, C. J. Lucio-Ortiz, D. A. De Haro De Rio, D. X. Martínez-Vargas, G. A. Flores-Escamilla, N. E. Dávila Guzman, V. M. Ovando-Medina and E. Moctezuma-Velazquez, Chem. Eng. J., 2019, 373, 325–337 CrossRef.
- M. Rochkind, S. Pasternak and Y. Paz, Molecules, 2015, 20(1), 88–110 CrossRef.
- J. Liang, C. Jing, J. Wang and Y. Men, Molecules, 2021, 26(22), 7054 CrossRef CAS PubMed.
- C. V. Reddy, R. Koutavarapu, J. Shim, B. Cheolho and K. R. Reddy, Chemosphere, 2022, 295, 133851 CrossRef CAS.
- M. Kohantorabi, G. Moussavi, P. Oulego and S. Giannakis, Appl. Surf. Sci., 2021, 555, 149692 CrossRef CAS.
- B. Yang, J. Dai, Y. Zhao, Z. Wang, J. Wu, C. Ji, Y. Zhang and X. Pu, Biochar, 2023, 5(1), 1 CrossRef CAS.
- Q. Wang, P. Xu, G. Zhang, L. Hu and P. Wang, Appl. Surf. Sci., 2019, 488, 360–369 CrossRef.
- D. Xiao, K. Dai, Y. Qu, Y. Yin and H. Chen, Appl. Surf. Sci., 2015, 358, 181–187 CrossRef.
- M. Wang, Y. Zeng, G. Dong and C. Wang, Chin. J. Catal., 2020, 41(10), 1498–1510 CrossRef.
- C. Wang, G. Yang, W. Shi, K. Matras-Postolek and P. Yang, Langmuir, 2021, 37(20), 6337–6346 CrossRef PubMed.
- F. Bairamis and I. Konstantinou, Catalysts, 2021, 11(7), 792 CrossRef CAS.
- J. Liu, T. Zhang, Z. Wang, G. Dawson and W. Chen, J. Mater. Chem., 2011, 21(38), 14398–14401 RSC.
- M. Zhang, X. Xiao, Y. Wu, Y. An, L. Xu and C. Wan, Catalysts, 2019, 9(12), 1009 CrossRef CAS.
- H. Yu, R. Shi, Y. Zhao, T. Bian, Y. Zhao, C. Zhou, G. I. N. Waterhouse, L.-Z. Wu, C.-H. Tung and T. Zhang, Adv. Mater., 2017, 29(16), 1605148 CrossRef.
- R. Zhang, Y. Yu, H. Wang and J. Du, Sci. Total Environ., 2020, 724, 138280 CrossRef CAS PubMed.
- T. Alizadeh, S. Nayeri and N. Hamidi, RSC Adv., 2019, 9(23), 13096–13103 RSC.
- U. Baig, A. Khan, M. A. Gondal, M. A. Dastageer and W. S. Falath, Nanomaterials, 2020, 10(6), 1098 CrossRef.
- H. Ghafuri, Z. Tajik, N. Ghanbari and P. Hanifehnejad, Sci. Rep., 2021, 11(1), 19792 CrossRef.
- I. Papailias, T. Giannakopoulou, N. Todorova, D. Demotikali, T. Vaimakis and C. Trapalis, Appl. Surf. Sci., 2015, 358, 278–286 CrossRef.
- J. Ma, C. Wang and H. He, Appl. Catal., B, 2016, 184, 28–34 CrossRef.
- H.-B. Fang, Y. Luo, Y.-Z. Zheng, W. Ma and X. Tao, Ind. Eng. Chem. Res., 2016, 55(16), 4506–4514 CrossRef CAS.
- S. Cao, B. Fan, Y. Feng, H. Chen, F. Jiang and X. Wang, Chem. Eng. J., 2018, 353, 147–156 CrossRef CAS.
- N. Tian, H. Huang, Y. Guo, Y. He and Y. Zhang, Appl. Surf. Sci., 2014, 322, 249–254 CrossRef CAS.
- K. V. A. Kumar, B. Lakshminarayana, D. Suryakala and C. Subrahmanyam, RSC Adv., 2020, 10(35), 20494–20503 RSC.
- A. Spinazzè, D. Spanu, P. Della Bella, C. Corti, F. Borghi, G. Fanti, A. Cattaneo, W. R. Wise, S. J. Davis, D. M. Cavallo and S. Recchia, Int. J. Environ. Res. Public Health, 2022, 19(19), 12111 CrossRef PubMed.
- V. Hasija, P. Raizada, P. Singh, N. Verma, A. A. P. Khan, A. Singh, R. Selvasembian, S. Y. Kim, C. M. Hussain, V.-H. Nguyen and Q. V. Le, Process Saf. Environ. Prot., 2021, 152, 663–678 CrossRef.
- K. Li, Z. Huang, S. Zhu, S. Luo, L. Yan, Y. Dai, Y. Guo and Y. Yang, Appl. Catal., B, 2019, 243, 386–396 CrossRef.
- B. Qu, J. Sun, P. Li and L. Jing, J. Hazard. Mater., 2022, 425, 127990 CrossRef PubMed.
- H. He, Z. Luo, Z.-Y. Tang and C. Yu, Appl. Surf. Sci., 2019, 490, 460–468 CrossRef.
- H. He, Z. Luo and C. Yu, J. Chem. Sci., 2020, 132(1), 113 CrossRef CAS.
| This journal is © The Royal Society of Chemistry 2024 |


