
 Open Access Article
 This Open Access Article is licensed under a Creative Commons Attribution-Non Commercial 3.0 Unported Licence
Construction of a coumarin-based fluorescent probe for accurately visualizing hydrogen sulfide in live cells and zebrafish†
Xiao Weiab,
Long Mib,
Shenglong Dongb,
Hui Yang *b and
Shiyuan Xu*a
*b and
Shiyuan Xu*a
aDepartment of Anesthesiology, Zhujiang Hospital of Southern Medical University, Guangzhou, 510282, China
bCentral South University Xiangya School of Medicine Affiliated Haikou Hospital, The First Affiliated Hospital of Hainan Medical University, Haikou, 570102, China. E-mail: 15298989046@163.com; xsy998@smu.edu.cn
First published on 20th May 2024
Abstract
Hydrogen sulfide (H2S), an important gas signaling molecule, is a regulator of many physiological processes, and its abnormal levels are closely related to the onset and progression of disease. It is vital to develop methods for specific tracking of H2S in clinical diagnosis and treatment. In this study, we designed an ultrasensitive and highly stable coumarin-based fluorescent probe Cou-H2S. Through the H2S-initiated tandem reaction, Cou-H2S successfully achieved highly selective and super-fast detection of H2S. Cou-H2S was successfully applied to the monitoring of endogenous and exogenous H2S at the cellular level and verified the validity of the detection of H2S in the LPS-induced zebrafish model. Therefore, Cou-H2S might provide new insights into the study of H2S-related diseases.
Introduction
Reactive sulfur species (RSS) play a pivotal role as signaling molecules in redox regulation, including hydrogen sulfide (H2S), glutathione (GSH), cysteine (Cys), and sulfane sulfur.1–3 Among them, H2S stands out as the simplest biothiol involved in the regulation of a range of complex pathophysiological processes in living organisms.4–6 These processes include regulation of vascular tone, cytoprotection, and neurotransmission, and so on.7–9 For example, H2S induces vascular relaxation, lowers blood pressure, and plays an important protective role in cardiovascular diseases. It effectively resists oxidative stress and protects cells and tissues.10,11 Endogenous H2S is catalytically produced by intracellular sulfate-reducing enzymes or thioredoxin proteins (cystathionine β-synthase, cystathionine γ-lyase, and 3-mercaptopyruvate sulfur transferase).12,13 Abnormal H2S concentrations in human serum can induce several diseases such as cardiovascular, neurological, and cancer.14 Therefore, the development of visual detection tools to monitor intracellular H2S levels is crucial for understanding disease mechanisms and enabling early diagnosis.Common detection methods for H2S include chromatography, electrochemistry, and mass spectrometry. Although the above methods can detect the concentration of H2S in vitro, they can cause damage to biological samples.15,16 Fluorescence imaging, with its high sensitivity, high accuracy, and non-invasiveness, enables real-time, non-invasive monitoring of H2S in organisms. Based on chemical properties such as reducibility, nucleophilicity and metal coordination, researchers have developed a series of H2S fluorescent probes.17–25 However, some of the reported probes have the disadvantages of environmental sensitivity, long reaction time, high detection limit, and the need for large amounts of organic solvents as co-solvents. It is still necessary to develop new small-molecule fluorescent probes for H2S that can overcome these limitations.
Trifluoromethyl coumarin, with the advantages of high chemical stability, wide emission wavelength range, and high fluorescence quantum yield, has been widely used in bioimaging and fluorescent probes.26–31 In this work, we designed and synthesized a novel coumarin-based fluorescent probe Cou-H2S using trifluoromethyl coumarin as the molecular scaffold and 2-pyridyl disulfide as the H2S recognition group (Scheme 1). The reaction of Cou-H2S with H2S released a trifluoromethyl coumarin dye that emitted intense fluorescence at 498 nm. Cou-H2S presented excellent selectivity and sensitivity to H2S, with a low detection limit of 25 nM. Cou-H2S could also be employed for fluorescence imaging of endogenous and exogenous H2S in cells. Furthermore, the upregulation of H2S levels in LPS-stimulated zebrafish was visualized.
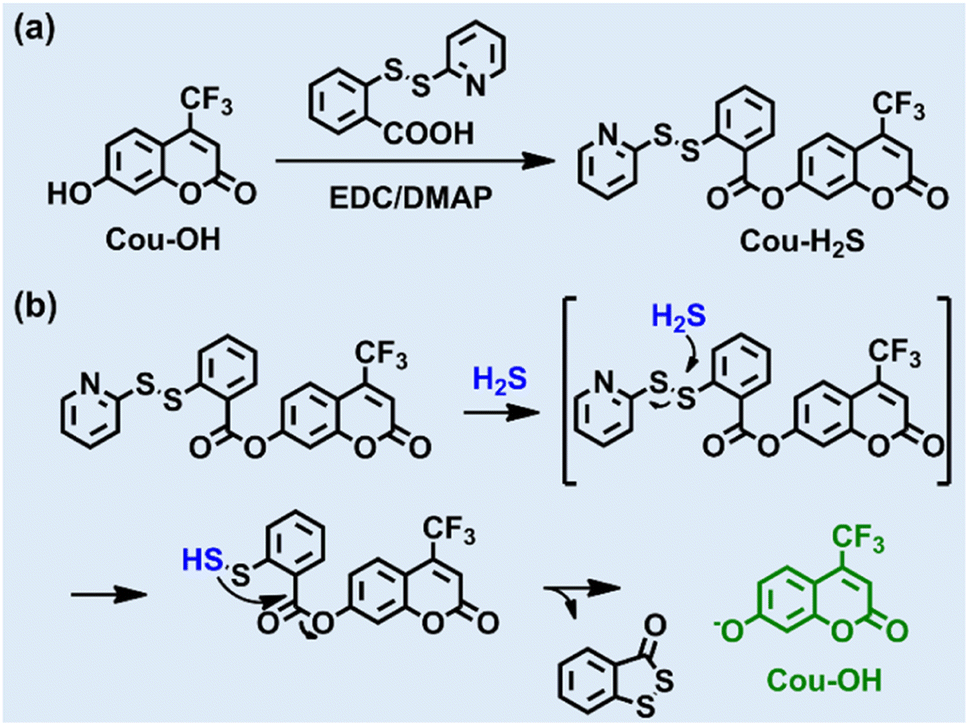 | ||
| Scheme 1 (a) Synthesis of Cou-H2S. (b) Reaction mechanism of Cou-H2S toward H2S. | ||
Experimental section
Synthesis of 2-oxo-4-(trifluoromethyl)-2H-chromen-7-yl 2-(pyridin-2-yldisulfanyl)benzoate (Cou-H2S)
Cou-OH (115 mg, 0.5 mmol) and 2-(pyridin-2-yldisulfanyl) benzoic acid (158 mg, 1.2 mmol) were dissolved in dry dichloromethane (20 mL). Subsequently, EDC (383 mg, 2.0 mmol) and DMAP (25 mg) were added. The reaction mixture was stirred at room temperature for 10 h. After completion of the reaction, the solvent was evaporated in vacuo. The resulting product was purified by silica gel column chromatography (eluent: 20% ethyl acetate/80% petroleum ether) to afford the desired compound (76 mg, 32% yield). 1H NMR (400 MHz, CDCl3): δ 8.49–8.47 (m, 1H), 8.30 (dd, J = 8.0, 1.5 Hz, 1H), 8.01 (dd, J = 8.2, 1.1 Hz, 1H), 7.82(dd, J = 8.8, 1.8 Hz, 1H), 7.61–7.53 (m, 3H), 7.41–7.32 (m, 3H), 7.13–7.10 (m, 1H), 6.82 (s, 1H); 13C NMR (100 MHz, CDCl3): δ 163.83, 158.57, 158.44, 155.09, 153.87, 149.72, 142.14, 137.35, 134.34, 132.14, 126.40, 126.35, 125.97, 125.32, 121.14, 119.97, 119.78, 119.23, 115.55, 115.49, 111.59, 111.32; HRMS m/z: C22H12F3NO4S2 [M + H]+ calcd for 476.0238 found 476.0282.Results and discussion
Design and synthesis of Cou-H2S
The chemical structure of Cou-H2S was well characterized by NMR and HRMS, as shown in Fig. S1–S4.† 2-Pyridyl disulfide masked the hydroxyl group of the fluorescent dye, quenching the fluorescence of Cou-OH. The addition of H2S induced the release of Cou-OH from Cou-H2S. The general mechanism was as follows: H2S reacted with Cou-H2S via a nucleophilic substitution reaction to give Cou-SSH intermediate, followed by an intramolecular esterification reaction to release Cou-OH and 3H-benzo[c][1,2]dithiol-3-one. To elucidate the reaction mechanism, we conducted mass spectrometry analysis of the products before and after the reaction of Cou-H2S with H2S. As seen in Fig. S5,† Cou-H2S exhibited a main peak at m/z = 476.0282, corresponding to Cou-H2S. After the excess H2S reacted with Cou-H2S, the solution showed two main peaks at m/z = 167.9695 and m/z = 253.0014, attributed to 3H-benzo[c][1,2]dithiol-3-one ([M]+) and Cou-OH ([M + Na]+).Optical response of Cou-H2S to H2S
The response time serves as a crucial metric for assessing the probe's performance, providing insight into the kinetic process of its binding to target analytes. Upon synthesizing Cou-H2S, we opted for an initial concentration of 10 μM and recorded the time course of Cou-H2S in the absence or presence of 20 μM Na2S (an inorganic H2S donor substance) in the PBS solution containing 100 μM hexadecyl trimethyl ammonium bromide (CTAB). The fluorescence intensity at 498 nm of Cou-H2S remained constant for 300 s (Fig. 1a). When 20 μM Na2S was added, the fluorescence intensity at 498 nm reached the maximum at 100 s and remained stable. The changes in fluorescence intensity before and after the reaction of Cou-H2S with Na2S across various pH values were then explored. As seen in Fig. 1b, the fluorescence intensity of Cou-H2S showed minimal variation over a wide pH range from 3.0 to 10.0, highlighting its insensitivity to the pH of the detection system. In the presence of Na2S, the fluorescence intensity closely resembled free Cou-H2S within the pH range of 3.0–6.0. A notable increase in fluorescence intensity was observed beyond pH 6.0, reaching its peak at pH 8.0–9.0. The absorption spectra of Cou-H2S changed significantly before and after the addition of Na2S (Fig. S6†). The relationship between fluorescence intensity changes of Cou-H2S and Na2S concentration was also investigated (Fig. 1c). Under the excitation light of 405 nm, the fluorescence of the free Cou-H2S was weak. Upon sequentially adding different concentrations of Na2S, the fluorescence emission peak of Cou-H2S at 498 nm gradually enhanced (Fig. 1d). In the Na2S concentration range of 0–20 μM, the fluorescence of Cou-H2S at 498 nm increased by 340-fold. This substantial change indicated a high signal-to-noise ratio for the in vitro detection of H2S. In addition, the fluorescence intensities of Cou-H2S at 498 nm displayed an excellent linear relationship with the Na2S concentration (4–10 μM), represented by the linear equation y/104 = 21.07x − 75.49 (where y was the recorded fluorescence intensity at 498 nm, and x was the Na2S concentration), yielding a linear correlation coefficient of 0.99 (Fig. 1e). Utilizing the detection limit formula 3σ/k (σ represented the standard deviation of the recorded fluorescence intensity of free Cou-H2S at 498 nm 12 times, and k represented the slope of the linear equation), it could be concluded that the detection limit was 25 nM, lower than that of several reported fluorescent probes for H2S (Table S1†). To evaluate the selectivity of Cou-H2S toward H2S, the performance of Cou-H2S was tested in response to common interfering analytes, including amino acids (Met, Gly, Arg, Pro), anions (S2O32−, SO32−, SO42−, Cl−), metal ions (Mg2+, Al3+, Ca2+, Fe3+), reactive oxygen species (ClO−), and biothiols (Cys, Hcy, GSH). As depicted in Fig. 1f, there was no significant variation in the fluorescence intensity at 498 nm for amino acids, anions, metal ions, and reactive oxygen species, and only Na2S triggered an enhancement of fluorescence intensity. These results underscore the excellent sensitivity and selectivity of Cou-H2S for H2S, suggesting its potential use in complex biological environments.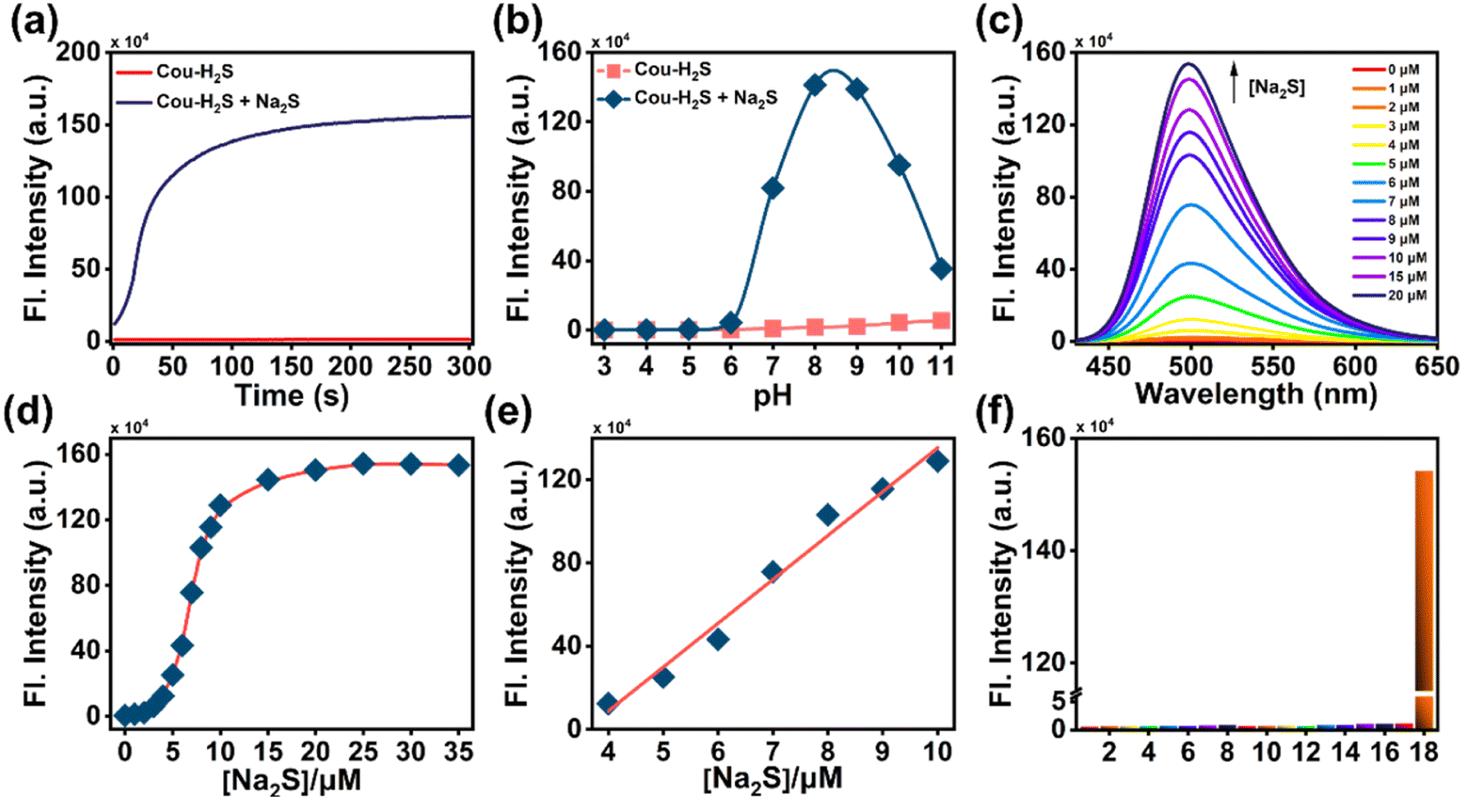 | ||
| Fig. 1 (a) Fluorescence intensities at 498 nm of Cou-H2S (10 μM) in the presence or absence of Na2S (20 μM). (b) pH-dependent fluorescence intensities of Cou-H2S (10 μM) in the absence or presence of Na2S (20 μM). (c) Fluorescence response of Cou-H2S (10 μM) to varying concentrations of Na2S (0–20 μM). (d) Plot of fluorescence intensities of Cou-H2S (10 μM) at 498 versus Na2S concentrations (0–35 μM). (e) Linear relationship between fluorescence intensities of Cou-H2S (10 μM) at 498 nm and Na2S concentrations (4–10 μM). (f) Fluorescence response of Cou-H2S (10 μM) at 498 nm to common interfering analytes (100 μM, respectively). (1) Blank, (2) Met, (3) Gly, (4) Arg, (5) Pro, (6) S2O32−, (7) SO32−, (8) SO42−, (9) Cl−, (10) Mg2+, (11) Al3+, (12) Ca2+, (13) Fe3+, (14) ClO−, (15) Cys, (16) Hcy, (17) GSH, (18) H2S. λex = 405 nm. | ||
H2S imaging in live cells
Evaluating the cytotoxicity of Cou-H2S would provide a basis for its potential biological applications. Fig. S7† showed that incubation with different concentrations ranging from 0 to 30 μM of Cou-H2S for 24 h resulted in more than 90% cell survival, confirming the commendable biocompatibility of Cou-H2S in cellular and in vivo imaging experiments. As illustrated in Fig. 2, co-incubating Cou-H2S with HeLa cells yielded weak green fluorescence. When the cells were pre-incubated with Cys, followed by incubation with Cou-H2S, a moderate green fluorescence emerged due to the conversion of Cys to H2S catalyzed by the thiosulfate transferase enzyme. Notably, the cells treated with Na2S induced robust green fluorescence, whereas treatment with Na2S and ZnCl2 (an H2S scavenger) in turn led to reduced green fluorescence. The results established the capability of Cou-H2S to image exogenous H2S, positioning it for biological applications.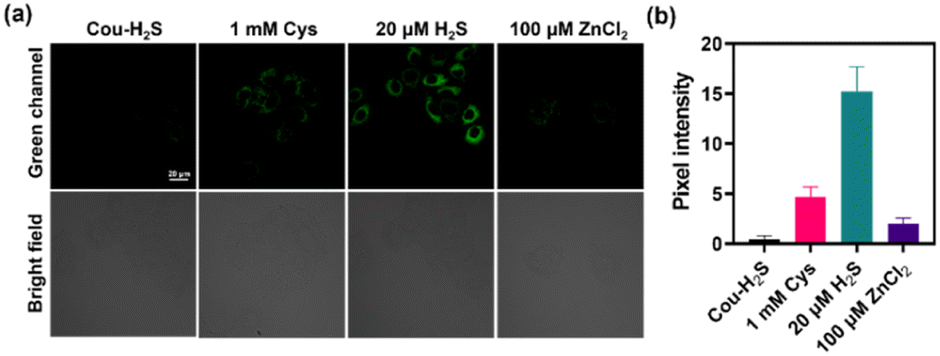 | ||
| Fig. 2 Confocal laser fluorescence imaging of HeLa cells under different pretreatments. (a) The cells were treated with Cys (1 mM, 30 min), Na2S (20 μM, 30 min), ZnCl2 (20 μM Na2S + 100 μM ZnCl2, 30 min) at 37 °C respectively, then incubated with Cou-H2S (10 μM) and CTAB (50 μM) for 30 min before imaging. (b) Pixel intensities of the cells in plane a. λex = 405 nm, λem = 450–550 nm. Scale bar: 20 μm. | ||
Sodium nitroprusside (SNP) was a commonly used nitric oxide (NO) donor that induced hydrogen sulfide production.32 Fig. 3a revealed a faint green fluorescence upon incubating the cells with Cou-H2S, with varying concentrations of SNP leading to distinct enhancements in green fluorescence. Treatment of 50 μM SNP followed by propargylglycine (PAG, an H2S scavenger)33 resulted in a rapid decline in green fluorescence, demonstrating the ability of Cou-H2S to monitor SNP-induced endogenous H2S (Fig. 3c).
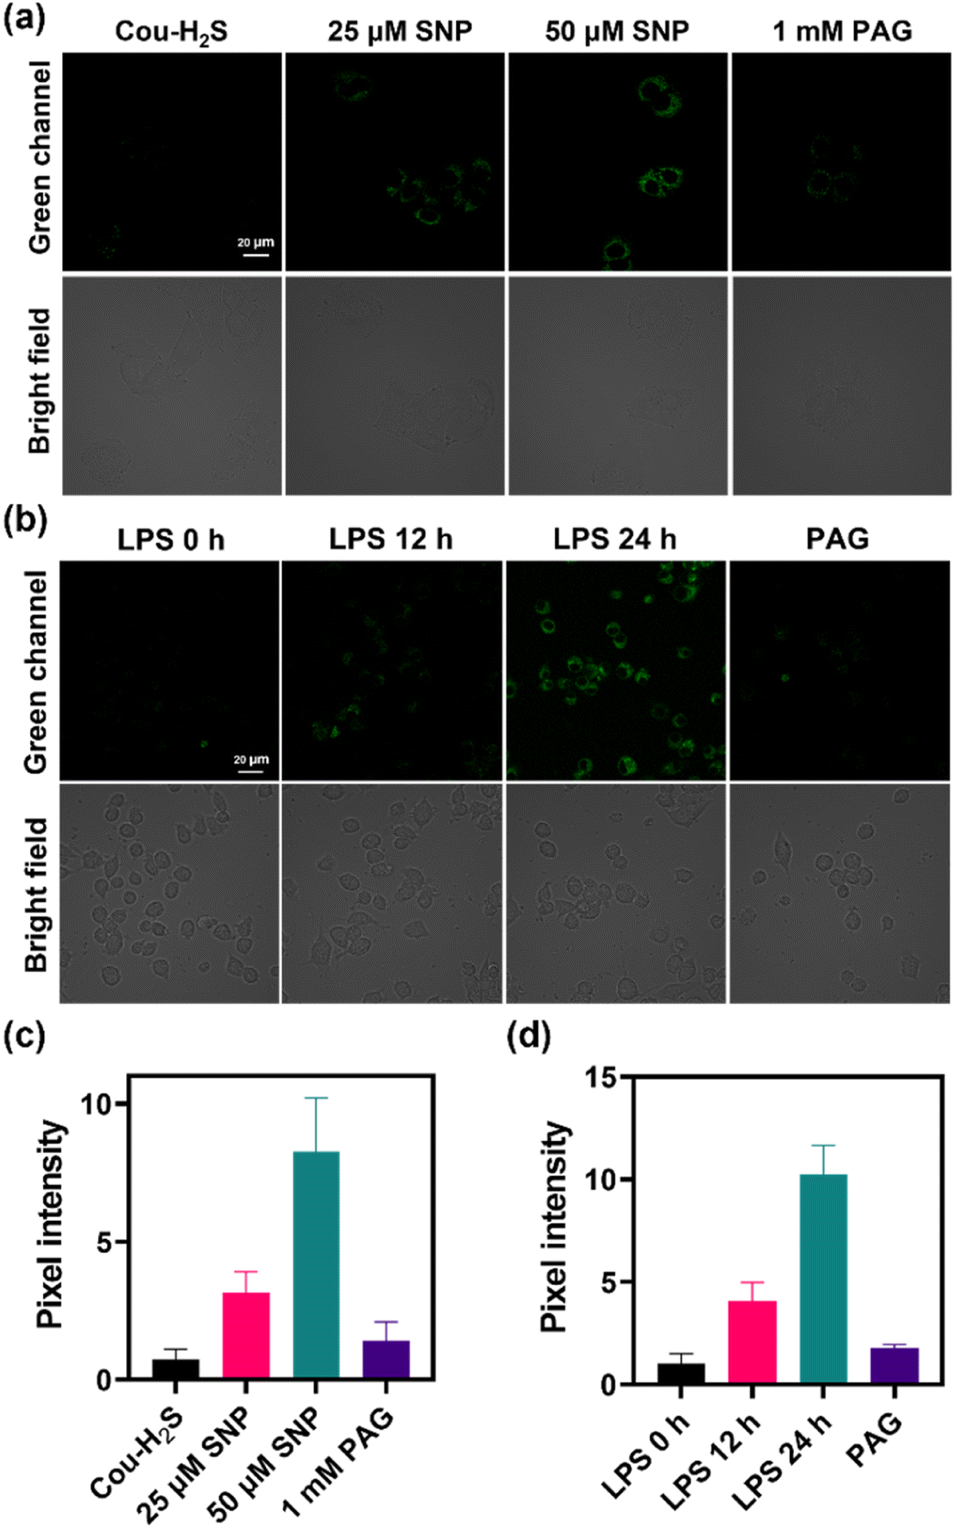 | ||
| Fig. 3 (a) HeLa cells were treated with SNP (25, 50 μM, 30 min), SNP (50 μM, 30 min) + PAG (1 mM, 30 min) at 37 °C respectively, then incubated with Cou-H2S (10 μM) and CTAB (50 μM) for 30 min before imaging. (b) RAW264.7 cell were stimulated with LPS (1 μg mL−1, 0, 12, 24 h), LPS (1 μg mL−1, 24 h) + PAG (1 mM, 30 min) at 37 °C respectively, then incubated with Cou-H2S (10 μM) and CTAB (50 μM) for 30 min before imaging. (c) Pixel intensities of the cells in plane a. (d) Pixel intensities of the cells in plane c. λex = 405 nm, λem = 450–550 nm. Scale bar: 20 μm. | ||
Lipopolysaccharide (LPS) induced a cellular immune response leading to upregulation of H2S expression in RAW264.7 cells.34 As displayed in Fig. 3b, faint green fluorescence was observed in RAW264.7 cells incubated with Cou-H2S. When the cells were stimulated with LPS for 12 h or 24 h, and then incubated with Cou-H2S, green fluorescence showed a gradual enhancement compared to that of the control group (Fig. 3d). Conversely, treatment with PAG post-LPS exposure led to a reduction in green fluorescence, highlighting Cou-H2S's ability to track the LPS-induced upregulation of H2S levels in this cellular inflammation model.
H2S imaging in zebrafish
LPS induced up-regulation of the expression and activity of H2S synthase in zebrafish, thereby promoting H2S production. As depicted in Fig. 4, Cou-H2S was incubated with zebrafish, only weak green fluorescence was observed, likely due to the release of trifluoromethyl coumarin dye from the reaction between the low concentration of endogenous H2S and Cou-H2S. The green fluorescence of zebrafish treated with LPS for 12 h increased rapidly compared to free Cou-H2S. This enhancement was attributed to the significant increase in the endogenous H2S concentration in zebrafish stimulated with LPS. The findings suggested that Cou-H2S was capable of tracking changes in H2S concentration levels in vivo.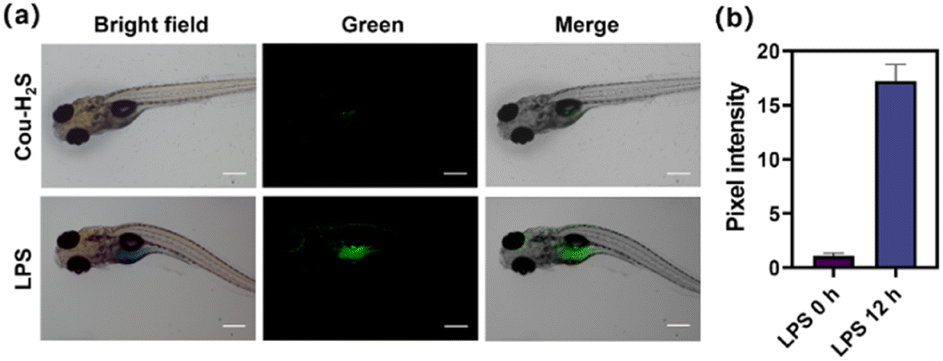 | ||
| Fig. 4 (a) The zebrafish were stimulated with LPS (2 μg mL−1) for 12 h at 37 °C, then incubated with Cou-H2S (10 μM) for 30 min before imaging. (d) Pixel intensities of the cells in plane a. λex = 405 nm, λem = 450–550 nm. Scale bar: 200 μm. | ||
Conclusions
In summary, we have designed and synthesized a novel fluorescence probe, namely Cou-H2S, for the detection of H2S based on trifluoromethyl coumarin dye. Cou-H2S showed high specificity for H2S, which overcame the interference of common biological analytes, such as metal ions, anions, amino acids, reactive oxygen species, and biothiols. Cou-H2S responded rapidly to H2S with response times as low as 100 s. In addition, the negligible cytotoxicity of Cou-H2S made it suitable for imaging exogenous and endogenous H2S in live cells. With the aid of Cou-H2S, LPS-induced upregulation of endogenous H2S levels in zebrafish was verified. This work developed a powerful chemical tool for dynamic monitoring of H2S levels in cells and zebrafish, underpinning the study of H2S-related diseases.Conflicts of interest
The authors declare that they have no known competing financial interests or personal relationships that could have appeared to influence the work reported in this paper.Acknowledgements
This research was funded by the Scientific Research Project of Health and Family Planning Industry in Hainan Province (21A200120) and Hainan Province Clinical Medical Center (2021).References
- T. V. Mishanina, M. Libiad and R. Banerjee, Nat. Chem. Biol., 2015, 11, 457–464 CrossRef CAS PubMed.
- M. Iciek, A. Bilska-Wilkosz, M. Kozdrowicki and M. Górny, Biosci. Rep., 2022, 42, BSR20221006 CrossRef CAS PubMed.
- M. Iciek, A. B. Wilkosz, M. Kozdrowicki and M. Gorny, Antioxid. Redox Signaling, 2023, 39, 1000–1023 CrossRef CAS PubMed.
- P. Rose, P. K. Moore and Y. Z. Zhu, Cell. Mol. Life Sci., 2017, 74, 1391–1412 CrossRef CAS PubMed.
- R. Wang, Antioxid. Redox Signaling, 2010, 12, 1061–1064 CrossRef CAS PubMed.
- L. Alvarez, C. L. Bianco, J. P. Toscano, J. Lin, T. Akaike and J. M. Fukuto, Antioxid. Redox Signaling, 2017, 27, 622–633 CrossRef CAS PubMed.
- L. Zhang, Y. Wang, Y. Li, L. Li, S. Xu, X. Feng and S. Liu, Front. Pharmacol., 2018, 9, 1066 CrossRef PubMed.
- S. J. Tripathi, S. Chakraborty, E. Miller, A. A. Pieper and B. D. Paul, Br. J. Pharmacol., 2023, 1–18 Search PubMed.
- J. W. Calvert, W. A. Coetzee and D. J. Lefer, Antioxid. Redox Signaling, 2010, 12, 1203–1217 CrossRef CAS PubMed.
- Z. Zhao, W. Guo, C. Xu, Q. Wang, C. Mao and M. Wan, Chem. Eng. J., 2023, 452, 139089 CrossRef CAS.
- J. L. Wallace and R. Wang, Nat. Rev. Drug Discovery, 2015, 14, 329–345 CrossRef CAS PubMed.
- H. Liu, M. N. Radford, C. T. Yang, W. Chen and M. Xian, Br. J. Pharmacol., 2019, 176, 616–627 CrossRef CAS PubMed.
- P. Kamoun, Amino Acids, 2004, 26, 243–254 CrossRef CAS PubMed.
- X. Cao, Z. Z. Xie, Y. Yang, M. Whiteman, P. K. Moore and J. S. Bian, Antioxid. Redox Signaling, 2019, 31, 1–38 CrossRef CAS PubMed.
- H. M. Smith and M. D. Pluth, JACS Au, 2023, 3, 2677–2691 CrossRef CAS PubMed.
- H. Ibrahim, A. Serag and M. A. Farag, J. Adv. Res., 2021, 27, 137–153 CrossRef CAS PubMed.
- K. Shimamoto and K. Hanaoka, Nitric Oxide, 2015, 46, 72–79 CrossRef CAS PubMed.
- T. T. Jia, Y. Zhang, J.-T. Hou, H. Niu and S. Wang, Front. Chem., 2023, 11, 1126309 CrossRef CAS PubMed.
- D. A. Jose, R. Sakla, N. Sharma, S. Gadiyaram, R. Kaushik and A. Ghosh, ACS Sens., 2020, 5, 3365–3391 CrossRef CAS PubMed.
- J. Wang, F. Huo, Y. Yue and C. Yin, Luminescence, 2020, 35, 1156–1173 CrossRef CAS PubMed.
- H. Li, Y. Fang, J. Yan, X. Ren, C. Zheng, B. Wu, S. Wang, Z. Li, H. Hua, P. Wang and D. Li, TrAC, Trends Anal. Chem., 2021, 134, 116117 CrossRef CAS.
- C. Liu, J. Pan, S. Li, Y. Zhao, L. Y. Wu, C. E. Berkman, A. R. Whorton and M. Xian, Angew. Chem., Int. Ed., 2011, 50, 10327–10329 CrossRef CAS PubMed.
- Y. Luo, Y. Zuo, G. Shi, H. Xiang and H. Gu, Anal. Bioanal. Chem., 2022, 414, 2809–2839 CrossRef CAS PubMed.
- Q. Sun, H. Liu, Y. Qiu, J. Chen, F.-S. Wu, X. G. Luo and D. W. Wang, Spectrochim. Acta A, 2021, 254, 119620 CrossRef CAS PubMed.
- X. Zhang, W. Qu, H. Liu, Y. Ma, L. Wang, Q. Sun and F. Yu, Anal. Chim. Acta, 2020, 1109, 37–43 CrossRef CAS PubMed.
- A. Majhi, K. Venkateswarlu and P. Sasikumar, J. Fluoresc., 2023 DOI:10.1007/s10895-023-03372-3.
- G. Kaur, I. Singh, R. Tandon and N. Tandon, Inorg. Chem. Commun., 2023, 158, 111480 CrossRef CAS.
- M. López-Corrales, A. Rovira, A. Gandioso, S. Nonell, M. Bosch and V. Marchán, J. Org. Chem., 2023, 88, 7128–7140 CrossRef PubMed.
- A. Rovira, M. Pujals, A. Gandioso, M. López-Corrales, M. Bosch and V. Marchán, J. Org. Chem., 2020, 85, 6086–6097 CrossRef CAS PubMed.
- A. Gandioso, R. Bresolí-Obach, A. Nin-Hill, M. Bosch, M. Palau, A. Galindo, S. Contreras, A. Rovira, C. Rovira, S. Nonell and V. Marchán, J. Org. Chem., 2018, 83, 1185–1195 CrossRef CAS PubMed.
- Y. Fan, Y. Wu, J. Hou, P. Wang, X. Peng and G. Ge, Coord. Chem. Rev., 2023, 480, 215020 CrossRef CAS.
- A. D. Ivankovich, D. J. Miletich and J. H. Tinker, Int. Anesthesiol. Clin., 1978, 16, 1–29 CrossRef CAS PubMed.
- Q. Sun, R. Collins, S. Huang, L. Holmberg-Schiavone, G. S. Anand, C. H. Tan, S. van-den-Berg, L. W. Deng, P. K. Moore, T. Karlberg and J. Sivaraman, J. Biol. Chem., 2009, 284, 3076–3085 CrossRef CAS PubMed.
- Y. Zheng, N. Luo, D. Mu, P. Jiang, R. Liu, H. Sun, S. Xiong, X. Liu, L. Wang and Y. Chu, In Vitro Cell. Dev. Biol.: Anim., 2013, 49, 679–688 CrossRef CAS PubMed.
Footnote |
| † Electronic supplementary information (ESI) available. See DOI: https://doi.org/10.1039/d4ra00668b |
| This journal is © The Royal Society of Chemistry 2024 |