
 Open Access Article
 This Open Access Article is licensed under a Creative Commons Attribution-Non Commercial 3.0 Unported Licence
SERS detection of dopamine using metal-chelated Ag nanoshell†
Mingyeong Kim‡
a,
Yun Sik Choi‡a and
Dae Hong Jeong *ab
*ab
aDepartment of Chemistry Education, Seoul National University, Seoul 08826, Republic of Korea. E-mail: jeongdh@snu.ac.kr
bCenter for Educational Research, Seoul National University, Seoul 08826, Republic of Korea
First published on 30th April 2024
Abstract
As the concentrations of different neurotransmitters can indicate the presence of certain disorders affecting brain functions, quantitative analyses of neurotransmitters have attracted increasing attention in various fields. Surface-enhanced Raman scattering (SERS) spectroscopy is an outstanding spectroscopic analytical tool that enables detection at the single molecule level with high specificity. As local field enhancement of surface plasmon is effective within nanometers, active interaction between SERS-active noble metals (gold and silver) and analyte molecules enhances the molecular detection capacity of SERS. However, neurotransmitters and noble metal nanoparticles are often not affinitive, because neurotransmitters generally have a hydroxyl group rather than a thiol group. As a result, the interaction between the two typically remains inactive, which makes detection more difficult. To overcome this limitation, in the present work we utilized metal-chelation to attract dopamine, a neurotransmitter molecule, close to the surface of silver nanoparticles. AgNS was capped with poly(vinyl alcohol) (PVA) and sequentially integrated with copper ion to bind dopamine in the form of chelate bonding between dopamine and copper. The PVA linked AgNS and metal ions through a coordinate bond between hydroxyl groups and metal ions. This metal-chelation-functionalized nanoprobe allowed us to stably detect dopamine in aqueous solution at a concentration of less than 10−6 M. Therefore, this method provides a convenient and easy-to-prepare option for the effective detection of dopamine, thus meaning it has the potential to be applied to other neurotransmitters.
1 Introduction
There are many different types of neurotransmitters that are released from neurons in the brain and transport important messages from the central nervous system throughout the body.1 The major neurotransmitters in the human nervous system are acetylcholine, glutamate, GABA, glycine, dopamine, norepinephrine, and serotonin.2 Since imbalances in these neurotransmitters can be indicative of certain disorders, and since the amounts of neurotransmitters released strongly affect brain function, quantitative analysis of these molecules is an important aspect of accurate diagnoses of brain and neurological disorders. For example, dopamine levels serve as the diagnostic indicator of both Alzheimer's disease and Parkinson's disease.1,3,4 Serotonin regulates neural activity, such as the proliferation of adult neural stem cells,5 and serotonin deficiency is associated with kidney disease and anxiety-related disorders.1,6 Meanwhile, GABA and glutamate—a precursor of GABA—are the primary inhibitory neurotransmitters that regulate mood and deficiency in GABA transaminase cause encephalopathy, a brain disease.7,8 Lastly, lower levels of acetylcholine are associated with Alzheimer's disease,9 while lower levels of norepinephrine are associated with depression.10Quantitative analyses of these neurotransmitters are typically achieved using methods such as high-performance liquid chromatography (HPLC),11–13 electrochemical methods,14,15 fluorescence,16 etc. However, these methods suffer from various limitations, such as being restricted to use with off-site analytes and the inability to accomplish instantaneous identification.17 HPLC is a time-consuming and highly complicated process that requires a large and heavy analyzer.18 Electrochemical methods are also time-consuming and complex.19 Meanwhile, fluorescence methods show less sensitivity and limited multiplexing capacity.20
In this context, surface-enhanced Raman spectroscopy (SERS) has recently attracted attention for its ability to detect multiple analytes and its desirable characteristics as an analytical tool. It is one of the most outstanding spectroscopic analytical technologies due to its high sensitivity and specificity. Since its discovery, SERS has been utilized in various fields, including biomolecular detection21,22 and in situ monitoring.23,24
Despite its numerous advantages, the range of surface plasmon is only effective within several nanometers in SERS;25 thus, the target molecules must be located close to the nanoparticle surface—the hotspot—to obtain effective augmentation. Therefore, materials that have affinities with metal nanoparticles have been the main targets of detection in related research.26–28 However, most neurotransmitters, including the aforementioned neurotransmitters, have less affinities with metal nanoparticles.29,30 So, to detect neurotransmitters using SERS, it is necessary to design a method that can attract them close to the surface of nanoparticles.
In the present study, the metal-chelation method was introduced to attract neurotransmitters that are nearby nanoparticles for SERS detection. To fabricate a metal-chelation functionalized silver bumpy nanoshell, a polymer having hydroxyl groups was instituted to connect the silver nanoshell and metal ions. Poly(vinyl alcohol) (PVA) is a widely used polymer that has plenty of hydroxyl groups throughout its backbone, along with the advantages of excellent water solubility, biocompatibility, low cost, low toxicity, and even high adsorption capacities for heavy metals.31,32 The PVA polymer coating stabilizes silver bumpy nanoshells in aqueous solution. The hydroxyl groups of PVA can also capture heavy metals near the surfaces of nanoparticles through the formation of chelation bonds. Metal ions, including Fe3+, Cr4+, and Cu2+, have great adsorption capacities for PVA chelation.33 Among them, Cu2+ shows high affinity to PVA polymer. A previous study34 used PVA to efficiently adsorb copper in the solutions, and the addition of PVA to the nanoprobes led to increased stability and greater adsorption efficiency of copper. In another report, copper was captured with PVA-treated absorbent membranes.35
Herein, we fabricated surface-modified silver bumpy nanoshell using PVA polymer and copper ion to attract dopamine based on a metal-chelation method. PVA-coated silver bumpy nanoshells can form a chelation bond with copper; this allows dopamine to be captured near the surface of the silver bumpy nanoshells. We conducted an experiment showing that dopamine was successfully detected using the metal-chelation method despite the low affinity of the hydroxyl groups toward the metal nanoparticles.
2 Experimental section
2.1. Materials
Tetraethyl orthosilicate (TEOS), ammonium hydroxide (NH4OH, 28–30%), 3-mercaptopropyltriethoxysilane (MPTS), absolute ethanol (99.9%), silver nitrate (AgNO3, 99.99%), ethylene glycol, hexadecyl amine, poly(vinyl alcohol) (MW 9000–10![[thin space (1/6-em)]](https://www.rsc.org/images/entities/char_2009.gif) 000, 80% hydrolyzed), copper(II) acetate (95%), dopamine hydrochloride, sulfuric acid (H2SO4, 98%), hydrogen peroxide (H2O2, 35%), and P4VP (MW ∼60000) were all purchased from Sigma-Aldrich and used as received without further purification.
000, 80% hydrolyzed), copper(II) acetate (95%), dopamine hydrochloride, sulfuric acid (H2SO4, 98%), hydrogen peroxide (H2O2, 35%), and P4VP (MW ∼60000) were all purchased from Sigma-Aldrich and used as received without further purification.
2.2. Synthesis of silver bumpy nanoshell
Silver bumpy nanoshells were synthesized based on a previously reported method.36 First, silica nanoparticles (SiNPs, 150 nm in diameter) were prepared by stirring TEOS with aqueous ammonium hydroxide that had been dissolved in 40 mL absolute ethanol for 20 h at RT. The synthesized SiNPs were washed with ethanol 5 times. Next, thiolated SiNPs were prepared by stirring 1 mL of the previously fabricated SiNPs (50 mg/1 mL) with 50 μL of MPTS and 10 μL of ammonium hydroxide for 12 h at RT. The synthesized thiolated SiNPs were then washed with ethanol 5 times. After washing, 60 μL of thiolated SiNPs (a 3 mg portion) was dissolved in 25 mL ethylene glycol. Then, 25 mL ethylene glycol solution containing 30 mg of AgNO3 was added to the previous solution, followed by the addition of 1 mL of 5 mM hexadecylamine dissolved in 1 mL ethanol. This mixture was stirred thoroughly for 1 h at room temperature (RT). Finally, the synthesized silver bumpy nanoshells were washed with ethanol 5 times.2.3. Metal-chelation functionalization of silver bumpy nanoshell
To begin, the solvent of the silver nanoshell (AgNS) was changed from ethanol to deionized (DI) water. Next, 2 mg of (PVA), which was selected as the optimal concentration for analysis, was dissolved in 30 mL of AgNS (3 mg/30 mL) and stirred thoroughly for 1 h at RT. The resulting AgNS@PVA solution was washed with DI water two times. Then, copper(II) acetate solution, which was prepared at an optimized concentration of 10 mM with the solvent of DI water, was added to the AgNS@PVA solution and stirred for 30 min at RT, followed by washing with DI water once.2.4. Dopamine detection with metal-chelated silver bumpy nanoshell
To evaluate the SERS ability of metal-chelation nanoshell, 100 mM dopamine solution of DI water was prepared and sequentially diluted to lower concentrations, down to 10−8 M. The prepared dopamine solutions were diluted to the target concentrations in metal-chelation functionalized AgNS solution. The final concentrations of the dispersed dopamine solution ranged from 10−8 M to 2 × 10⁻⁴ M. The mixtures were shaken for 2 h at RT, after which the prepared mixture solutions were loaded in a capillary tube for SERS analysis.2.5. Instrument and SERS measurement
The morphologies of the synthesized nanoparticles were analyzed through EF-TEM (LIBRA 120, Carl Zeiss, Germany), SEM (SUPRA 55VP, Carl Zeiss, Germany), and XPS (AXIS-His, Kratos, UK). The UV-visible extinction spectra of the mixture solution and all concentrations of dopamine were obtained using a UV-visible spectrophotometer (Evolution One Plus, Thermo Fischer Scientific, USA). The SERS performance of metal-chelated nanoshells was obtained with a Raman system (LabRAM 300, HORIBA, Japan) with a 660 nm laser with 2.5 mW power. The acquisition time was 60 s with the use of multi-window and an ×10 lens.3 Results and discussion
3.1. Characterization of the synthesized nanoparticles
The AgNS fabrication procedure and further surface functionalization are shown in Fig. 1a and b, respectively. Briefly, AgNSs were coated with PVA and sequentially integrated with copper. PVA served as a connecting material for AgNS and copper. After attaching copper on the surface of PVA-coated AgNSs with a metal-chelation bond, the target analyte was added to the nanoprobe solution. As shown in Fig. 1a, the copper ion forms a chelation bond with two hydroxyl groups of PVA. Then, the copper ion effectively captures analytes with the remaining chelation sites of copper by forming the chelation bond ortho-dihydroxyl group of analytes. Fig. 1b illustrates the process through which dopamine is captured by PVA/Cu-coated silver nanoshells. | ||
| Fig. 1 Schematic illustration of synthesis of metal-chelation silver nanoshell with surface functionalization. (a) Synthesis of AgNS@PVA@Cu with poly(vinyl)alcohol and copper treatment on AgNS, and detection of dopamine using AgNS@PVA@Cu. (b) Detection of dopamine through capture near surface of silver bumpy nanoshell with the formation of metal-chelation bond. | ||
To characterize and confirm the fabricated nanoparticles, we carried out analyses with TEM and SEM. Fig. 2 shows the TEM and SEM images of the untreated silver bumpy nanoshells and surface functionalized silver bumpy nanoshells. The fabricated AgNSs show densely populated silver on the surface of silica nanoparticles. The average size of silver bumpy nanoshells is approximately 240 nm (Fig. S1†). They have a bumpy surface of silver that forms an abundance of hotspots, even in a single nanoshell particle, thus facilitating a strong electromagnetic field enhancement. As shown in Fig. 2, the shape of AgNSs was not collapsed and the silver on the surface was not detached, thus reflecting the solidity of both fabricated AgNSs and PVA/Cu-functionalized AgNSs. To verify the presence of the Cu2+ ion at the AgNS surface, we carried out X-ray photoelectron spectroscopy analysis for PVA/Cu-functionalized AgNSs.
 | ||
| Fig. 2 Morphologies of silver nanoshells before and after surface functionalization. (a) TEM and (b) SEM images of untreated nanoprobes. (c) TEM and (d) SEM images of nanoprobes after PVA polymer and copper treatment. | ||
The characteristic peaks for Cu2+ was observed on the AgNS surface, thus confirming the successful introduction of PVA/Cu at the AgNS surface (Fig. S2†).
3.2. Extinction spectra analysis for the formation of chelation bond between dopamine and copper
Copper is known to have a coordination number of 4.37,38 To verify the formation of a chelation bond between copper and dopamine, extinction spectra were measured for the mixture solutions of 10 mM copper and various concentrations of dopamine using a UV-visible spectrophotometer. Since metal ions, ligands, and complexes are known to have unique d–d charge transfers and ligand-based transitions, it is appropriate to use UV-visible extinction spectra to identify metal–ligand complexes in that they show different spectra with the formation of different complexes.39 The mixture solutions were prepared by dispersing aqueous dopamine into 1 mL of 10 mM copper acetate solution, with the final dopamine concentrations of 1 mM, 200 μM, 100 μM, 10 μM, and 1 μM, respectively. The overall UV-visible extinction spectra results are presented in Fig. 3a, which shows an increase in the intensity of the absorption band at the 350 nm along with a slight decrease in the location of the maximum absorption peak around 750 nm with increasing dopamine concentration. Fig. S3(a) and (b),† respectively show the exact values for an increase in absorbance at the 350 nm band and a decrease in the location of maximum absorption. The color of the copper(II) solutions changed from pale blue to dark greenish yellow with increasing concentration of dopamine from 1 μM to 1 mM, as shown in Fig. 3b, thus supporting the results of changes in extinction shown in Fig. 3a. From Fig. 3a, an increase in absorbance at the 350 nm bands reflects an increase in the metal-to-ligand charge transfer absorption bands.40–42 Moreover, a decrease in the absorption peak from 785 nm to 734 nm suggests the formation of a bond between copper and dopamine.43 Similar to the previously reported study results,39,44–46 these spectral changes indicate the formation of metal-chelation bonds between copper and dopamine.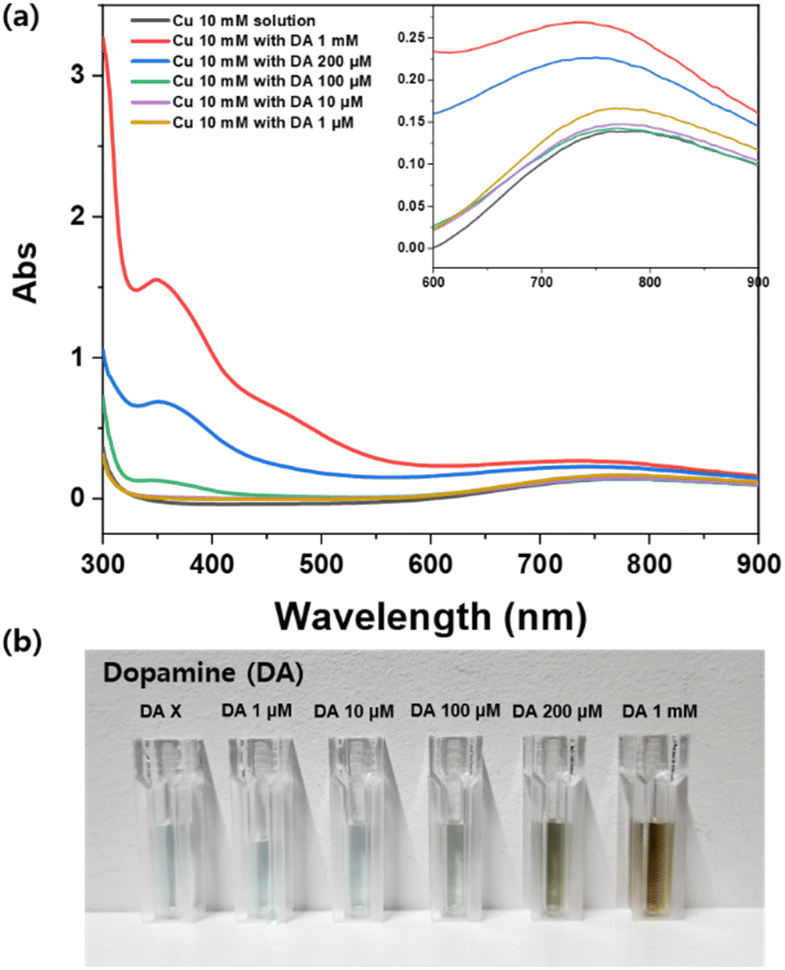 | ||
| Fig. 3 Effect of the formation of metal-chelation between copper and dopamine. (a) UV-vis extinction spectra of mixed solution of Cu with various concentrations of dopamine (DA): 1 mM, 200 μM, 100 μM, 10 μM, 1 μM. (b) Color change in copper solution according to addition of various concentrations of dopamine. | ||
3.3. SERS characterization of the metal-chelated Ag nanoshell
The SERS performance of the metal-chelation nanoshell was investigated using dopamine as a target molecule. Fig. 4a presents the SERS spectra of dopamine, which compare two types of nanoprobes: untreated AgNS and AgNS@PVA@Cu. In the absence of PVA and Cu treatment, no characteristic bands of dopamine appeared with the addition of dopamine, indicating that untreated AgNSs have little affinity with dopamine. By contrast, the corresponding signals of dopamine were highly enhanced with AgNS@PVA@Cu. This enhancement was mainly due to a decreased distance between the nanoprobes and targeted molecules.47 Since the effect of surface plasmon spreads within a few nanometers, it is important to attract target molecules that are close to the surface of nanoprobes to amplify the SERS signal. If the attracted molecules with metal-chelation are located at “hotspots”, the intensity of the SERS signal can be strongly enhanced. The enhanced SERS signal of dopamine exhibits augmented Raman bands compared to the normal Raman of dopamine, as shown in Fig. S4.† In particular, the signal intensity of the band at 1381 cm−1 was enhanced by ca. 465-fold. The characteristic bands of chelated dopamine are located at 948, 968, 1381, and 1600 cm−1. Among the various assigned dopamine bands, the highest band at 1381 cm−1 was selected for further analysis. This band was assigned to the aliphatic chain CH2–CH2 bending.48–50 | ||
| Fig. 4 (a) SERS performance comparison of dopamine of 100 μM aqueous solution from AgNS@PVA@Cu and AgNS. (b) Signal enhancement of other molecules with metal-chelation method: catechol (brown), naphthalene (purple), serotonin (dark green). | ||
Further, the detection of other molecules with hydroxyl group was demonstrated by utilizing AgNS@PVA@Cu. The SERS signals of catechol, naphthalene and serotonin were measured after being mixed with AgNS@PVA@Cu (Fig. 4b). By using PVA/Cu2+ functionalized AgNSs, it was possible to detect characteristic SERS signals for 0.01 M of catechol. The signals for the catechol molecule were highly enhanced with AgNS@PVA@Cu, indicating that the attraction strategy using metal-chelation is effective for those ortho-dihydroxybenzene compounds. However, despite having a hydroxyl group, no distinguishable signals were detected for serotonin. This result suggests that metal-chelation-based detection using AgNS@PVA@Cu, which is specifically effective for molecules containing ortho-dihydroxyl group, coincides with the well-established mechanism of chelation of Cu2+ that specifically targets ortho-dihydroxyl group.51,52 Considering that other neurotransmitter molecules, such as epinephrine and norepinephrine, also contain an ortho-dihydroxyl group,53 this detection strategy using metal chelation can be further expanded to the detection of a wide range of neurotransmitter molecules.
3.4. Optimization of PVA and copper concentration for effective detection of dopamine
To effectively detect dopamine with metal-chelation, it is important to appropriately set the concentrations of both PVA and the copper reagent by considering signal enhancement effectiveness and nanoprobe stability. Therefore, additional experiments were conducted to identify the optimal PVA and copper concentration with which to effectively capture dopamine. The ideal concentration of PVA for metal-chelation was explored to form effective binding of Cu2+ ion at the metal nanoparticle surface.To optimize the PVA concentration, four concentrations of dopamine—200 μM, 100 μM, 10 μM, and 1 μM—were prepared in each of the metal-chelation Ag nanoshell solutions, then treated with 150 mg/30 mL, 50 mg/30 mL, 10 mg/30 mL, 2 mg/30 mL, or 0.5 mg/30 mL of PVA, and treated with 10 mM of copper sequentially. Fig. 5a shows a comparison of the SERS performance of each PVA-treated AgNS. As shown in Fig. 5a, AgNS with 2 mg of PVA treatment showed the highest intensity. For AgNSs treated with PVA concentrations exceeding 2 mg, the signal intensity decreased as the concentration of PVA increased. These results suggest that a higher concentration of PVA may hinder the interaction between AgNSs and dopamine. When treated with a higher concentration of PVA, the treated polymer forms a thicker PVA polymer layer around the nanoshell surface. Even though more dopamine molecules were captured by the interaction with Cu2+, dopamine molecules might be located relatively farther from the silver nanoshell surface compared to the treatment with a lower concentration of PVA (Fig. S5†). Analytes are assumed to be located closer to the surface of the silver nanoshell with thinner polymer layers, consequently achieving a higher degree of enhancement for analytes. Therefore, the PVA concentration of 2 mg/30 mL was selected for further detection of analytes.
 | ||
| Fig. 5 Determination of the optimal (a) PVA concentration and (b) copper concentration for metal-chelation with SERS intensity at 1381 cm−1 band among four dopamine concentrations: 200 μM, 100 μM, 10 μM, and 1 μM. | ||
Next, for the copper ion, if the concentration of copper is too low, the fabricated nanoprobes cannot attract sufficient dopamine; moreover, a low concentration of copper would form a chelation bond with hydroxyl groups of polymers prior to the addition of dopamine, consequently leaving no room for dopamine chelation. On the other hand, with an excessively higher concentration of copper, a higher level of aggregation would cause instability in nanoprobes.
In the case of optimizing copper concentration, 50 mM, 10 mM, 5 mM, 1 mM, and 0.1 mM of copper were treated to a PVA-covered Ag nanoshell with 50 mg/30 mL of PVA, respectively. Fig. 5b shows a comparison of SERS intensities at the 1381 cm−1 band of dopamine for those solutions. As shown in Fig. 5b, the intensity increased with increasing copper concentration, and it reached its maximum when using 10 mM of copper. The results of previous studies in this area have indicated that the chelation formed between the metal ion and the chelating agent achieves equilibrium. Moreover, the aggregation of nanoprobes was determined by the stability of chelating complexes.54,55 As can be seen in Fig. 5b, signal intensity increased with increasing concentration of copper at the surface of nanoshells, since metal-chelation nanoshells can capture more dopamine molecules. However, after it reached the saturation point, SERS intensities showed lower intensity and larger deviation at 50 mM copper concentration along with a larger level of aggregation, which was attributed to a decrease in the stability of fabricated metal-chelation nanoshells. Therefore, the copper concentration of 10 mM was selected as the optimal concentration for the detection of dopamine with metal-chelation.
3.5. Quantitative analysis of dopamine
Under the optimized condition, quantitative analyses for dopamine with metal-chelation nanoshells were conducted. Fig. 6a shows the SERS spectra of dopamine at various concentrations ranging from 10−8 M to 2 × 10⁻⁴ M. Fig. 6b shows a comparison of the SERS intensity at the band of 1381 cm−1 between the detection of dopamine with untreated AgNSs (black open square) and that with PVA@Cu treated AgNSs (red open square). The SERS intensity at the band of 1381 cm−1 increased in a linear manner as the concentration of dopamine increased up to 100 μM, after which it decreased. Decreases in the SERS signal at high concentrations were caused by the aggregation of nanoprobes, which is caused by instability in the solution while reacting with a high concentration of dopamine. Fig. S6† presents the SERS spectra of dopamine with low concentrations, which shows it is distinguishable in the 1 μM concentration. Regarding detection with untreated AgNSs, the SERS intensity is as low as the signal intensity from control (without dopamine) even in the 2 × 10⁻⁴ M concentration of dopamine. Based on this finding, we confirmed that metal-chelation-based nanoprobes could effectively draw dopamine to the nanoparticle surface. These results validate that our metal-chelation-based Ag nanoshell can effectively detect dopamine even at a quantitative level below the concentration of 1 μM, and that our proposed method shows the potential for extending the range of target molecules to other neurotransmitters that have hydroxyl groups.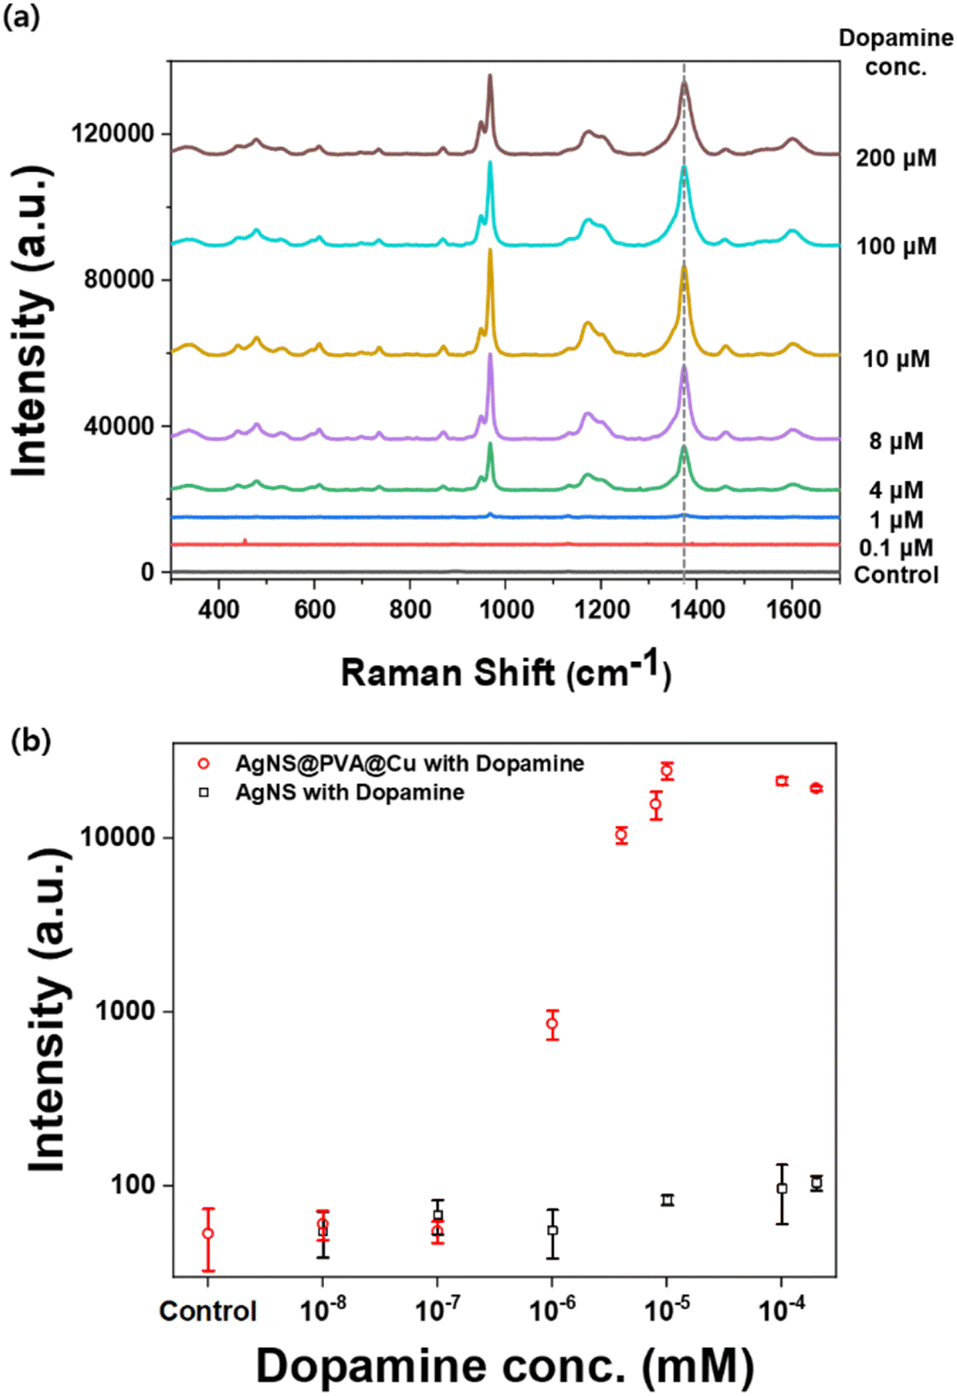 | ||
| Fig. 6 (a) SERS spectrum of dopamine at different concentrations with metal-chelation functionalized AgNS, Dopamine concentration range from 2 × 10⁻⁴ M to 10−8 M. (b) DA concentration dependence of SERS signal intensity at 1381 cm−1 band of dopamine. | ||
4 Conclusions
Quantitative analysis of neurotransmitters is important because imbalances in certain neurotransmitter concentrations can be indicative of brain function disorders. SERS is a promising spectroscopic tool for neurotransmitter analysis. However, for SERS, the target molecules should have functional groups that have a strong affinity with metal nanoparticles to be effectively detected. Therefore, in this study, the metal-chelation method was used to capture and attract dopamine molecules close to the nanoparticles. The AgNSs were coated with PVA polymer and then integrated with copper ion. With this preparation, the detection of dopamine was successfully achieved through the formation of a metal-chelation bond between copper and dopamine: to elaborate, we successfully detected dopamine in solutions with under 10−6 M dopamine concentration and successfully performed a quantitative analysis of dopamine. Overall, we achieved the detection of a neurotransmitter (dopamine) using metal-chelation functionalized Ag nanoshells while following a convenient and easy-to-prepare method. Notably, this method can also be applied to other neurotransmitters.Author contributions
Mingyeong Kim: investigation, methodology, experiment, analysis, writing. Yun Sik Choi: investigation, methodology, writing. Dae Hong Jeong: conceived the idea, revised manuscript. All authors reviewed the manuscript.Conflicts of interest
There are no conflicts to declare.Acknowledgements
This work was supported by the National Research Foundation of Korea (NRF) grant funded by the Korea government (MSIT), (No, 2021M3C1C3097205, 2021R1A45031762); 2021 Cultural Heritage Smart Preservation & Utilization R&D Program from the Cultural Heritage Administration National Research Institute of Cultural Heritage (Project Name: Development of in situ analysis and diagnosis, deterioration prediction technology of organic colorants) (No, 2021A01D02-001).Notes and references
- V.-T. Vo, V.-D. Phung and S.-W. Lee, Surf. Interfaces, 2021, 25, 101181 CrossRef CAS
.
- Z. M. Sheffler, V. Reddy and L. S. Pillarisetty, Physiology, neurotransmitters, 2019 Search PubMed
- Y. Luo, L. Ma, X. Zhang, A. Liang and Z. Jiang, Nanoscale Res. Lett., 2015, 10, 1–9 CrossRef PubMed
- I. Badillo-Ramírez, J. M. Saniger, J. Popp and D. Cialla-May, Phys. Chem. Chem. Phys., 2021, 23, 12158–12170 RSC
- J. Benninghoff, A. Gritti, M. Rizzi, G. LaMorte, R. J. Schloesser, A. Schmitt, S. Robel, J. Genius, R. Moessner and P. Riederer, Neuropsychopharmacology, 2010, 35, 893–903 CrossRef CAS PubMed
- S. P. Fernandez, A. Muzerelle, S. Scotto-Lomassese, J. Barik, A. Gruart, J. M. Delgado-García and P. Gaspar, Neuropsychopharmacology, 2017, 42, 512–523 CrossRef CAS PubMed
- P. L. Pearl, T. R. Hartka, J. L. Cabalza, J. Taylor and M. K. Gibson, Future Neurol., 2006, 1, 631–636 CrossRef CAS PubMed
- X. Zhang, Y. Lang, L. Sun, W. Zhang, W. Lin and L. Cui, BMC Neurol., 2020, 20, 1–9 CrossRef CAS PubMed
- A. V. Terry Jr, K. Jones and D. Bertrand, Pharmacol. Res., 2023, 191, 106764 CrossRef PubMed
- C. Moret and M. Briley, Neuropsychiatr. Dis. Treat., 2011, 7, 9–13 CAS
- J. Thomas, R. Khanam and D. Vohora, Pharm. Biol., 2015, 53, 1539–1544 CrossRef CAS PubMed
- A. A. Alhusban, A. M. Hammad, L. F. Alzaghari, A. I. Shallan and K. Shnewer, Biomed. Chromatogr., 2023, 37, e5513 CrossRef CAS PubMed
- L. Cao, L. Wu, H. Zhong, H. Wu, S. Zhang, J. Meng and F. Li, Acta Chromatogr., 2021, 34, 276–286 Search PubMed
- E. Ö. Bolat, G. A. Tığ and Ş. Pekyardımcı, J. Electroanal. Chem., 2017, 785, 241–248 CrossRef CAS
- U. Jain, S. Soni, Y. P. S. Balhara, M. Khanuja and N. Chauhan, ACS Omega, 2020, 5, 10750–10758 CrossRef CAS PubMed
- S. Zeng, S. Wang, X. Xie, S.-h. Yang, J.-h. Fan, Z. Nie, Y. Huang and H.-h. Wang, Anal. Chem., 2020, 92, 15194–15201 CrossRef CAS PubMed
- M. Parmigiani, B. Albini, G. Pellegrini, M. Genovesi, L. De Vita, P. Pallavicini, G. Dacarro, P. Galinetto and A. Taglietti, Nanomaterials, 2022, 12, 3609 CrossRef CAS PubMed
- C. Shende, W. Smith, C. Brouillette and S. Farquharson, Pharmaceutics, 2014, 6, 651–662 CrossRef PubMed
- X. Zhou, M. Qin, J. Zhu, C. Wang, G. Zhu, H. Wang and L. Yang, J. Raman Spectrosc., 2019, 50, 314–321 CrossRef CAS
- D. Graham and K. Faulds, Expert Rev. Mol. Diagn., 2009, 9, 537–539 CrossRef PubMed
- D.-K. Lim, K.-S. Jeon, J.-H. Hwang, H. Kim, S. Kwon, Y. D. Suh and J.-M. Nam, Nat. Nanotechnol., 2011, 6, 452–460 CrossRef CAS PubMed
- H. Ma, X. Tang, Y. Liu, X. X. Han, C. He, H. Lu and B. Zhao, Anal. Chem., 2019, 91, 8767–8771 CrossRef CAS PubMed
- Y. Zhu, H. Tang, H. Wang and Y. Li, Anal. Chem., 2021, 93, 11736–11744 CrossRef CAS PubMed
- S. He, D. Wu, S. Chen, K. Liu, E.-H. Yang, F. Tian and H. Du, Nanotechnology, 2022, 33, 155701 CrossRef PubMed
- G. Kumari, J. Kandula and C. Narayana, J. Phys. Chem. C, 2015, 119, 20057–20064 CrossRef CAS
- Y. Hong, R. Wang, Z. Jiang, Z. Cong and H. Song, Int. J. Anal. Chem., 2020, 2020 Search PubMed
- M. Gühlke, Z. Heiner and J. Kneipp, J. Phys. Chem. C, 2016, 120, 20702–20709 CrossRef PubMed
- A. M. T. San Juan, S. R. Chavva, D. Tu, M. Tircuit, G. Coté and S. Mabbott, Nanoscale Adv., 2022, 4, 258–267 RSC
- C. Jeon, J. Y. Park and Y. J. Yoo, Water Res., 2002, 36, 1814–1824 CrossRef CAS PubMed
- F. Wang, S. Cao, R. Yan, Z. Wang, D. Wang and H. Yang, Sensors, 2017, 17, 2689 CrossRef PubMed
- G. Paradossi, F. Cavalieri, E. Chiessi, C. Spagnoli and M. K. Cowman, J. Mater. Sci.: Mater. Med., 2003, 14, 687–691 CrossRef CAS PubMed
- J. Liao, Z. Liu, J. Wang and Z. Ye, ACS Omega, 2020, 5, 8272–8282 CrossRef CAS PubMed
- Q. Wu and Y. Wang, IOP Conf. Ser. Earth Environ. Sci., 2019, 330, 042044 CrossRef
- A. Dolgormaa, C.-j. Lv, Y. Li, J. Yang, J.-x. Yang, P. Chen, H.-p. Wang and J. Huang, Molecules, 2018, 23, 2982 CrossRef PubMed
- M. Abu-Saied, R. Wycisk, M. M. Abbassy, G. Abd El-Naim, F. El-Demerdash, M. Youssef, H. Bassuony and P. N. Pintauro, Carbohydr. Polym., 2017, 165, 149–158 CrossRef CAS PubMed
- H. Kang, J.-K. Yang, M. S. Noh, A. Jo, S. Jeong, M. Lee, S. Lee, H. Chang, H. Lee and S.-J. Jeon, J. Mater. Chem. B, 2014, 2, 4415–4421 RSC
- I. Benesperi, R. Singh and M. Freitag, Energies, 2020, 13, 2198 CrossRef CAS
- A. T. Larson, A. S. Crossman, S. M. Krajewski and M. P. Marshak, Inorg. Chem., 2019, 59, 423–432 CrossRef PubMed
- M. J. Sever and J. J. Wilker, Dalton Trans., 2004, 1061–1072 RSC
- Y. P. Singh, R. N. Patel, Y. Singh, R. J. Butcher, P. K. Vishakarma and R. B. Singh, Polyhedron, 2017, 122, 1–15 CrossRef CAS
- R. K. Boggess and R. B. Martin, J. Am. Chem. Soc., 1975, 97, 3076–3081 CrossRef CAS PubMed
- T. Huang, C. Li, X. Sun, Z. Zhu, Y. Fu, Y. Liu, Y. Yuan, S. Li and C. Li, Int. J. Oncol., 2015, 47, 1854–1862 CrossRef CAS PubMed
- C. Aravinda, S. Mayanna and V. Muralidharan, J. Chem. Sci., 2000, 112, 543–550 CrossRef CAS
- L. M. Aroua, R. Ali, A. E. Albadri, S. Messaoudi, F. M. Alminderej and S. M. Saleh, Biosensors, 2023, 13, 359 CrossRef CAS PubMed
- M. J. Gajewska, W.-M. Ching, Y.-S. Wen and C.-H. Hung, Dalton Trans., 2014, 43, 14726–14736 RSC
- S. Abada, A. Lecointre, M. Elhabiri and L. J. Charbonnière, Dalton Trans., 2010, 39, 9055–9062 RSC
- T.-V. Le, J.-S. Park and S.-W. Lee, ACS Appl. Nano Mater., 2023, 6, 6726–6738 CrossRef CAS
- A. Hariharan, R. Kurnoothala, S. K. Chinthakayala, K. C. Vishnubhatla and P. Vadlamudi, Spectrochim. Acta, Part A, 2021, 260, 119962 CrossRef CAS PubMed
- A. Michałowska, K. Jędrzejewski and A. Kudelski, Materials, 2022, 15, 5972 CrossRef PubMed
- V.-D. Phung, W.-S. Jung, T.-A. Nguyen, J.-H. Kim and S.-W. Lee, Nanoscale, 2018, 10, 22493–22503 RSC
- S. Borowska, M. Tomczyk, J. W. Strawa and M. M. Brzóska, Molecules, 2020, 25, 1507 CrossRef CAS PubMed
- R. Leron, L. Tayo and R. Aquino, IOP Conf. Ser. Mater. Sci. Eng., 2021, 1195, 012051 CrossRef CAS
- A. Kulma and J. Szopa, Plant Sci., 2007, 172, 433–440 CrossRef CAS
- M.-Y. Hsieh and P.-J. Huang, RSC Adv., 2022, 12, 921–928 RSC
- H. Zhuang, Z. Wang, X. Zhang, J. A. Hutchison, W. Zhu, Z. Yao, Y. Zhao and M. Li, Chem. Commun., 2017, 53, 1797–1800 RSC
Footnotes |
| † Electronic supplementary information (ESI) available. See DOI: https://doi.org/10.1039/d4ra00476k |
| ‡ These authors contributed equally to this work. |
| This journal is © The Royal Society of Chemistry 2024 |