 Open Access Article
Regulating interface interaction in alumina/graphene composites with nano alumina coating transition layers
Yan-Ze Hu ,
Jing Li,
Li-Li Luo,
Shuang-Lin Hu*,
Hua-Hai Shen* and
Xing-Gui Long
 *
*
Institute of Nuclear Physics and Chemistry, Science and Technology Innovation Park, No. 21 Horticultural Road, Mianyang, China. E-mail: Fanqing777@QQ.com
First published on 21st June 2024
Abstract
The structure and properties of graphene/alumina composites are affected by the interface interaction. To demonstrate the influence of interface interaction on the structure of composite materials, a composite without graphene/matrix alumina interface was designed and prepared. We introduced a nano transition layer into the composite by pre-fabricating nano alumina coating on the surface of graphene, thus regulating the influence of interface interaction on the structure of the composite. According to the analysis of laser micro Raman spectroscopy, the structure of graphene was not seriously damaged during the modification process, and graphene was subjected to tensile or compressive stress along the 2D plane. The fracture behavior of the modified graphene/alumina composites is similar to that of pure alumina, but significantly different from that of pure graphene/alumina composites. The elastic modulus and hardness of composite material G/A/A are higher, while its microstructure has better density and uniformity. In situ HRSEM observation showed that there was a transition layer of alumina in the modified graphene/alumina composite. The transition layer blocks or buffers the interfacial stress interaction, therefore, the composite material exhibits a fracture behavior similar to that of pure alumina at this time. This work demonstrates that interface interactions have a significant impact on the structure and fracture behavior of graphene/alumina composites.
1. Introduction
As a traditional inorganic ceramic material, alumina has advantages such as heat resistance, insulation, and high hardness, and can be widely used in industries such as aerospace, electronic consumer goods, high-speed railway, and metal smelting. However, alumina also have some common drawbacks of ceramic materials, such as insufficient toughness, susceptibility to brittle fracture and fragmentation, which limits their use in some occasions. Meanwhile, graphene, as a new two-dimensional carbon nano material, has outstanding properties1 such as mechanical strength,2 chemical stability, corrosion resistance and thermal conductivity.3 It would be very suitable to improve the mechanical properties,4–7 thermal conductivity,8 electrical conductivity,9,10 and wear resistance11,12 of alumina ceramics. Therefore, many researchers use graphene as reinforcement materials to improve the comprehensive properties of alumina. After graphene doping, the mechanical properties of alumina composites have been significantly improved.13–18 The uniform distribution of graphene in the alumina matrix can improve the fracture toughness of alumina ceramics, reduce its brittleness, and prevent it from brittle fracture. Previous work has demonstrated that graphene can significantly improve the mechanical properties of alumina ceramics and demonstrated its strengthening mechanisms, including graphene extraction, crack deflection and blockage, and graphene bridging. In addition, the grain refinement of graphene/alumina composites was also found.The interfacial structure and properties between graphene and alumina are thus crucial to the properties of composites, and have been widely studied experimentally and theoretically.19–22 Iftikhar Ahmad et al.23 studied the interface structure of graphene/alumina using high-resolution transmission electron microscopy (HR-TEM) and Fourier transform infrared (FTIR) spectroscopy, and found that Al2OC phase was formed in the interface region. Jonathan M. Polfus et al.24 studied the crystal structure, electronic structure and oxygen stoichiometry of graphene oxide/alumina nanocomposite interface through density functional theory (DFT) calculations. Priyamvada Jadaun et al.25 used electronic structure methods based on DFT and local density approximation (LDA) to study the effect of crystalline alumina on the band structure of single-layer and double-layer graphene. M. S. Gusmão et al.26 used DFT to study the electronic structure and transport properties of monolayer graphene on the surface of alpha-Al2O3. In our previous work,27 the first principles theoretical calculation and experimental research on the interface structure of graphene/alumina were carried out. However, the study on the interface interaction between graphene and alumina and its effect on the structure and properties of composites is still insufficient. Especially, there is no specialized experimental work on the effect of interface interaction on the microstructure of graphene/alumina composite materials.
In this work, to demonstrate the influence of interface interaction on the structure of composite materials, a new special graphene/alumina composite without graphene/matrix alumina interface was designed and prepared. We prepared nano alumina coating on the surface of graphene by hydrothermal method, and prepared the final composite by hot pressing sintering, thus introducing an interface transition layer into graphene/alumina composite. In this case, graphene does not directly interact with the alumina matrix at the interface. Previous studies attributed the grain refinement of composite materials to the mass transfer hindrance effect of the two-dimensional sheet structure of graphene. This design retains the influence of sheet structure on the microstructure of composite materials, but cleverly excludes the influence of interface interaction. For comparison, we also synthesized conventional graphene/alumina composites. To better understand the influences of interface interaction, the interface structure of the two composites was examined in situ by using high-resolution spherical aberration electron microscope, and the structural characteristics and fracture behavior were compared. Through this interesting comparative experiment, the influence of graphene/alumina interface interaction on the microstructure and fracture behavior of composite materials was preliminarily presented. The research results of this work have important conceptional significance for the development of graphene/alumina composites, and also have reference value for the research of other two-dimensional materials/ceramic composites.
2. Experiment
2.1 Graphene modification
The multilayer graphene platelets (henceforth, expressed as graphene in the text), were purchased from Tokyo Chemical Industry Co., Ltd. The thickness and width of graphene are about 6–8 nm and 15 μm, respectively (graphene has approximately 20 to 30 layers). Add a certain amount of multi-layer graphene platelets (marked as G below) into 300 ml ultrapure water for ultrasonic 15 min, then add 1.5 g of sodium dodecylbenzenesulfonate (analytically pure, Sinopharm), continue ultrasonic 4 hours, and obtain stable slurry (final concentration is 3.0 mg l−1). Add 2.7 g of Al(NO3)3 (aluminium nitrate, analytically pure, Sinopharm) and 2 g of CO(CH2)2 (oxalic acid, analytically pure, Sinopharm) into the slurry and stir for 15 min to obtain a well mixed slurry. Finally, the slurry was transferred into a polytetrafluoroethylene lining and subjected to hydrothermal reaction in a 500 ml stainless steel reactor at a temperature of 105 °C for 1 hour. After the reaction, slurry was naturally cooled to room temperature in air and transferred to a beaker. Stir and heat the slurry in the beaker on an electric heating plate (about 150 °C) until the water evaporates to dryness, forming a cracked block. Finally, use a mortar to grind the block into powder and pass it through a 100 mesh sieve for use. This step realizes the preparation of Al(OH)x·H2Ox primary coating on the surface of graphene. Place the modified powder into an alumina crucible and sinter it in a tubular vacuum furnace. Before sintering, use ultra-high purity argon gas (99.9999%) to purge the pipeline for 1 hour, and then continue sintering in ultra-high purity argon gas. The sintering temperature is 1250 °C and the holding time is 1 hour. During this process, the primary coating of Al(OH)x·(H2O)y is dehydrated to form a dense nanoscale alumina ceramic coating. After sintering, the powder will be ground and sieved through a 100 mesh sieve for use. Through the above steps, the modified graphene powder (hereinafter identified as GA) with pre coated alumina nano coating is obtained (Fig. 1).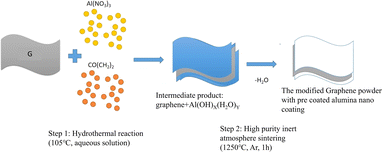 | ||
| Fig. 1 Schematic diagram of the experiment on growing alumina nanocoates on the surface of graphene. | ||
2.2 Composite
Commercial nano α-Al2O3 power (Shanghai Macklin Biochemical Co., Ltd, China) with a high purity of 99.99% and an average particle size of 30 nm was selected as raw material. Nano alumina particles were mixed with modified graphene (GA) or pure graphene (G) powder by wet mixing method.15 For GA powder, the modified graphene was sonicated 30 min in deionized water to obtain a GA suspension (with a concentration of 3 mg ml−1). For G powder, the pure graphene was dispersed in sodium dodecylbenzene sulfonate solution (10 mg ml−1) and was sonicated for 4 hours to obtain a G suspension with the same concentration. The α-Al2O3 powder was added to suspension and stirred (the mass concentration of GA/G in the final mixed powder was 0.5 wt%, 1.0 wt%, 1.5 wt%, 2.0 wt%, respectively), then stirring was continued and dried at 150 °C in the air. Finally, the dried powder was ground and sieved in a 100 mesh sieve. When preparing the composite sample, 4 g of mixed powder was added to a graphite sintering die with an inner diameter of 27 mm and was compacted, and finally fix it with an abrasive indenter. During sintering, the hot pressing furnace is used for sintering at 1400 °C under vacuum atmosphere and 50 MPa for 1 hour (zt-40-21y, Chen Hua, made in China).2.3 Material characterization
The cross-section structure and element distribution were analyzed by field emission scanning electron microscope (Zeiss Supra 55, made in Germany). The slice samples of the composite interface were prepared in situ by focused ion beam technology (Thermofisher Scios 2, made in USA), and their atomic images were obtained by high-resolution spherical aberration electron microscope (Thormo Fisher Themis Z, made in USA). The orientation of alumina grains at the interface was analyzed by Fast Fourier transform (FFT). The chemical state of graphene in composites was analyzed by laser micro Raman spectroscopy (MLRM, Renishaw inVia, UK). The phase composition of the composites was analyzed using X-ray diffraction (XRD, Bruker D8 Advantage, Germany). The FT-IR spectrum of modified graphene and pure graphene was recorded using a Frontier FT-IR spectrometer (PerkinElmer, Inc., USA). The sample was prepared using potassium bromide tablet pressing method (modified graphene or pure graphene with a mass ratio of 1![[thin space (1/6-em)]](https://www.rsc.org/images/entities/char_2009.gif) :
:![[thin space (1/6-em)]](https://www.rsc.org/images/entities/char_2009.gif) 1000 to potassium bromide). All absorbance spectra were obtained by subtracting corresponding background spectra at room temperature. In transmission mode, with air as the background, the DTGS detector was used to scan the spectra of modified graphene and pure graphene mixed with potassium bromide (KBr) compressed samples in the range of 400 cm−1 to 4000 cm−1.
1000 to potassium bromide). All absorbance spectra were obtained by subtracting corresponding background spectra at room temperature. In transmission mode, with air as the background, the DTGS detector was used to scan the spectra of modified graphene and pure graphene mixed with potassium bromide (KBr) compressed samples in the range of 400 cm−1 to 4000 cm−1.
2.4 Micro mechanical properties
Nano indentation tests were carried out on the polished surface of the two composites by means of a G200 tester (Agilent Technologies, Inc., Santa Clara, CA) with Berkovich tip (nominal radius of 200 nm). All the nanoindentations tests were performed at room temperature (22 ± 0.3 °C) and room humidity (40 ± 2% RH), and each experiment under the given conditions was repeated individually at least 12 times to ensure the reproducibility, to eliminate the effect of thermal drift on nanoindentation, thermal drift correction was reduced to ≤0.05 nm s−1 before each test. The indents were organized along all the thickness direction of the samples in order to detect possible gradients in densification. Hardness (H) and elastic modulus (E) were calculated by the procedure created by the procedure created by Oliver and Pharr from the load–displacement curves.283. Results and discussion
3.1 Nano alumina modification of graphene surface
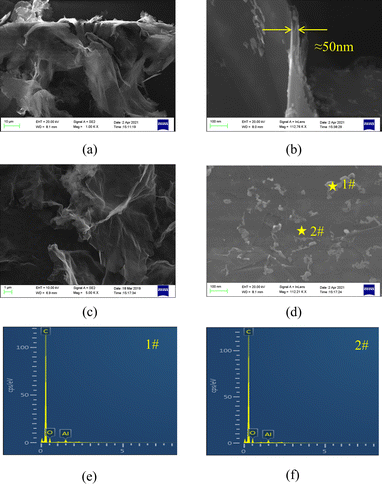
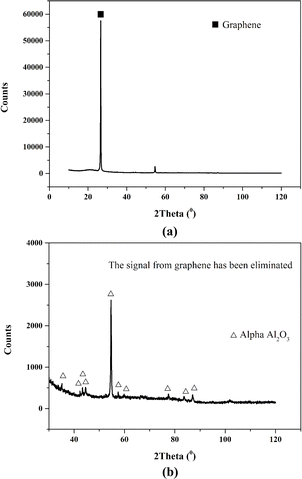
First, we observed the surface morphology and structural characteristics of the GA using scanning electron microscope. It can be seen from Fig. 2a that GA maintains a relatively complete graphene structure, and alumina with nanometer thickness is evenly distributed on the surface of graphene. In order to facilitate the comparison, we also give the electron microscope pictures of pristine graphene (Fig. 2c). It can be seen that compared with graphene, the thickness of modified graphene is thicker, and the wrinkles are also less.The surface structure of modified graphene is shown in Fig. 2d. It can be observed that a relatively flat nano alumina coating is formed on the surface of graphene. There are some flocculent deposition structures on the surface of the coating. EDS analysis was conducted on different positions of the alumina coating. The scanning results of surface element distribution (Fig. 2e and f) show that alumina is evenly distributed on the surface of graphene. Clear alumina signals were observed in both flocculent deposits and darker areas. It can be seen from Fig. 2b that the thickness of the cross section of modified graphene is about 50 nm. At the same time, we analyzed the phase structure of modified graphene using XRD technology, and found that many weak alpha alumina characteristic peaks appeared next to the strongest graphene characteristic peak (Fig. 3a). This phenomenon indicates that there is a very thin alumina coating on the surface of graphene, resulting in very low diffraction intensity of the alumina crystal layer. However, it is worth noting that these weaker signals can match the peaks of the alpha alumina standard card, indicating that even at a nanoscale thickness, the coating still maintains good crystallization performance. Interestingly, after removing the peak of graphene (Fig. 3b), a strong peak appeared at 54.2 in the signal of alumina, with a significantly stronger intensity than other diffraction peaks, indicating a clear preferred orientation of the nano alumina coating on the surface of graphene. After analysis, it was found that the preferred orientation plane is the (10![[1 with combining macron]](https://www.rsc.org/images/entities/char_0031_0304.gif) 7) plane.
7) plane.
Raman spectroscopy is very suitable for analyzing the structural characteristics and stress distribution of graphene materials.29–32 The structure of GA was further analyzed by in situ laser micro Raman technology, and the results are shown in Fig. 4. In order to facilitate comparison, we also give the Raman spectra of the initial graphene. It can be seen from Fig. 4a that after the surface modification of graphene, the strength of the D peak did not increase significantly, and the G peak still maintained a sharp peak shape, indicating that graphene maintained a relatively complete structure during the modification process, and the defect concentration did not increase significantly.33 After the modification of graphene, the position of its G peak is between 1559.580 cm−1 and 1567.702 cm−1. Compared with graphene, the G peak position of GA shows blue shift and red shift at the same time, that is, the peak position shifts in different directions at different graphene positions. The blue shift of the G peak corresponds to the compressive stress in the 2D plane of graphene, while the red shift corresponds to the tensile stress of graphene. Therefore, we can think that when graphene is modified, the nano alumina coating formed on its surface produces two different interfacial stresses. XRD analysis shows that the aluminum oxide coating of alpha phase is formed on the surface of graphene. According to the signal in the spectrum, it can be judged that the aluminum oxide on the surface of graphene is multi oriented. When the alumina grains with different orientations form an interface with graphene, tensile or compressive stress will be generated on graphene due to different lattice mismatch, which will lead to the Raman peak position of graphene moving in different directions.
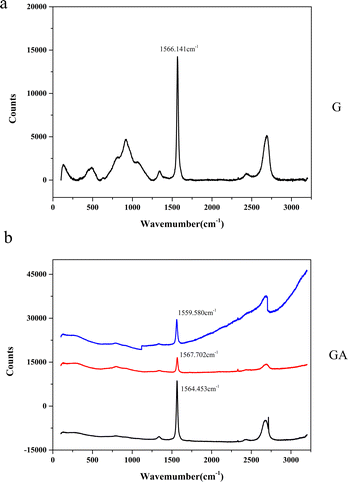 | ||
| Fig. 4 Raman spectroscopic results of GA and G ((a) GA, (b) G, different curves come from different detection positions of the same sample). | ||
Table 1 shows the ID/IG ratio before and after graphene modification. It can be seen that the ID/IG value of GA is slightly lower than that of G. This indicates that in graphene modification, the defect concentration did not significantly increase, and the graphene structure was not destroyed.
| Materials | ID | IG | ID/IG |
|---|---|---|---|
| G | 892.88 | 14![[thin space (1/6-em)]](https://www.rsc.org/images/entities/char_2009.gif) 175.49 175.49 |
0.06 |
| GA | 822.50 | 20![[thin space (1/6-em)]](https://www.rsc.org/images/entities/char_2009.gif) 278.94 278.94 |
0.04 |
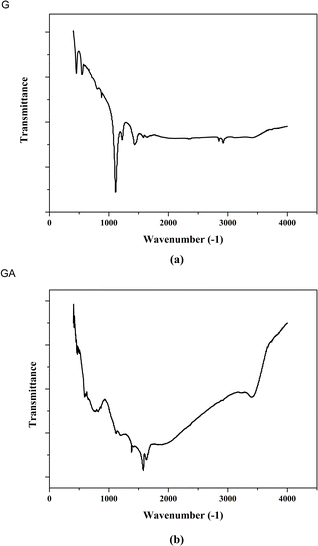
Fig. 5 shows the results of Fourier transform infrared spectroscopy analysis before and after graphene modification. From Fig. 5a, it can be seen that pure graphene has a strong absorption peak at 1110 cm−1, corresponding to the vibrations of C–O–C bond (epoxy).34 These epoxy bonds are introduced during the preparation process of graphene. The peaks at 2920 cm−1 and 2850 cm−1 represent the symmetric and asymmetric vibrations of the C–H bond, respectively. From Fig. 5b, it can be seen that after graphene modification, the signals of C–O–C and C–H bonds disappear. This is because graphene is thermally reduced during the modification process, and the ether bond oxygen in the graphene structure is desorbed. Moreover, hydrogen atoms on graphene are also thermally desorbed. It is worth noting that a broad peak appeared in the range of 500 to 900 cm−1, which corresponds to the stretching vibration of the Al–O–Al bond,35 indicating that graphene has been successfully modified and aluminum oxide covers the surface of graphene.
3.2 Structure and mechanical properties of composite
Fig. 6 shows the cross section structure of G/A/A composites obtained by sintering modified graphene and nano alumina at different contents. We also show the cross section structure of the G/A composite composed of graphene and alumina. Comparing Fig. 6a and c, it can be found that in G/A/A, graphene has better flatness in the alumina matrix. Additionally, the large number of graphene folds did not appear in G/A/A, as in G/A (Fig. 6b and d). This folds may be caused by the wrinkle of graphene itself or the extrusion of nano alumina powder during hot pressing sintering. According to the content of the previous section, we can see that after the preparation of nano alumina coating on the surface of graphene, the rigidity of graphene microchip is enhanced and the wrinkles are significantly reduced. Therefore, in the later sintering process, the modified graphene maintained a good smoothness. This more flat graphene distribution may be of great significance for the construction of some unique properties of anisotropy.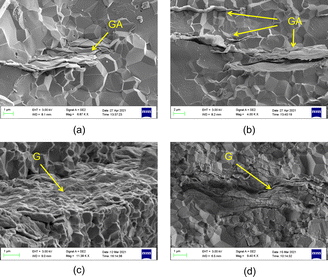 | ||
| Fig. 6 Fracture cross-sections of two composite materials ((a) and (b) 1.5 wt% GA, (c) and (d) 1.5 wt% G). | ||
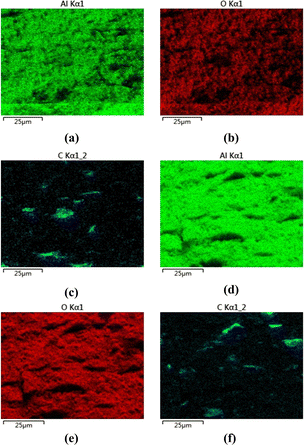
Fig. 7 shows the cross-sectional elements distribution of two types of composite materials. Fig. 7a and d respectively represent the distribution of Al elements, with black areas without Al. Fig. 7b and e respectively represent the distribution of O element, and the areas without O also are black. It can be inferred that these regions are the locations of the distribution of C element. Fig. 7c and f show the distribution of element C. Based on the distribution of the three elements, it can be seen that the C element is mainly distributed in areas without the distribution of Al and O elements, which are the exposed positions of graphene on the cross-section. The distribution characteristics of graphene in the two composite materials can be observed through EDS analysis, and this further supporting the observation results of scanning electron microscopy mentioned earlier.
Fig. 8 shows the XRD spectra of two composite materials at different doping concentrations. It can be seen that the modification of graphene has no significant effect on the phase composition of the two composite materials. Both composite materials exhibit very pure properties α-Al2O3 phase. The corresponding peak of graphene (002) is marked with black squares in the graph. From Fig. 8a, it can be seen that as the doping concentration of graphene or modified graphene increases, the signal of the (002) peak becomes stronger. This indicates that graphene and modified graphene were not destroyed during the sintering process of the composite material, and doping did not alter the phase of the alumina matrix.
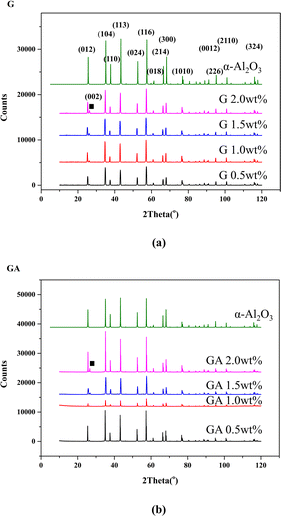 | ||
| Fig. 8 XRD results of two composite materials ((a) G, (b) GA, the doping concentrations of 0.5 wt%, 1.0 wt%, 1.5 wt%, and 2.0 wt% were analyzed respectively). | ||
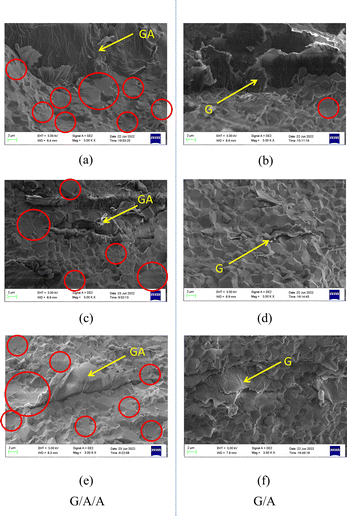
Cross section photos of G/A/A, G/A, and pure alumina are shown in Fig. 9 and 10. From Fig. 9a, c and e, it can be seen that the fracture behavior of G/A/A composites is similar to that of pure alumina, and there are two fracture modes: transgranular fracture and intergranular fracture. The areas of transgranular fracture are marked by red circles in the figure. From Fig. 9b, d and f, we can see that the G/A composites are mainly characterized by intergranular fracture. The results indicate that the grain boundary stress distribution of G/A/A and G/A composite materials may be different. G/A is dominated by intergranular fracture, and the fracture behavior is significantly different from that of pure aluminum oxide, indicating that the grains around graphene may be subject to tensile stress along the 2D plane of graphene, and the energy of grain boundary becomes higher, which is more likely to cause grain boundary dissociation, and form a new surface to reduce the energy of the system. However, G/A/A and pure alumina did not exhibit such effects.
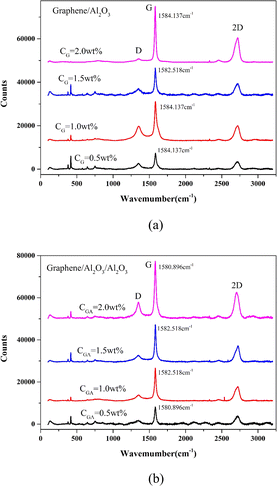
To study this effect, the structural characteristics of graphene in G/A/A and G/A were observed using in situ Raman analysis technology, respectively. The results are shown in Fig. 11. It can be found that graphene in the two composites has kept a relatively complete structure, and the strength ratio of D peak to G peak has not increased significantly, indicating that graphene structure has not been seriously damaged during the sintering process of composites. In all composite materials, the 2D peaks of graphene exhibit the characteristic shape of multilayer graphene.36 It is worth noting that the G peak position of graphene has a significant blue shift in both composites. The G peak position of G/A moves from 1564 cm−1 of pure graphene to 1582–1584 cm−1, and the G peak position of G/A/A moves to 1580–1582 cm−1. The blue shift phenomenon of G/A is slightly stronger than that of G/A/A. The range of G peak movement is very close, indicating that graphene is subject to the compressive stress in 2D plane in both composites. The interfacial stress of graphene in the two composites is similar. Graphene will generate tensile stress along the graphene/alumina interface on the surrounding alumina layer in the composite. Therefore, the fracture behaviour of G/A composite is significantly different from that of pure alumina, with intergranular fracture being the main mode. However, why do G/A/A composites still maintain a fracture mode similar to pure alumina? We speculate that the nano alumina coating on the surface of GA transfer to the interface transition layer in the composite, which cushions the influence of interface stress on the surrounding alumina matrix layer.
Table 2 shows the ID/IG ratio of composite materials. It can be seen that the ID/IG ratio of the modified composite material G/A/A is significantly lower than that of the composite material G/A at a lower doping ratio (concentration ≤ 1.5 wt%). Although the ID/IG ratio of G/A/A is higher than that of G/A when the content reaches 2.0 wt%, it is also significantly lower than the ID/IG values of G/A at other concentrations. The magnitude of ID/IG values can reflect the variation of graphene defect concentration. The aluminum oxide coating on the surface of modified graphene effectively protects graphene during the sintering process of composite materials, reducing the defects generated during the sintering process and better maintaining the two-dimensional honeycomb structure.
| Composites | ID | IG | ID/IG |
|---|---|---|---|
| G/A 0.5 wt% | 2123.49 | 7011.79 | 0.30 |
| G/A 1.0 wt% | 4992.50 | 16![[thin space (1/6-em)]](https://www.rsc.org/images/entities/char_2009.gif) 640.00 640.00 |
0.30 |
| G/A 1.5 wt% | 2259.00 | 11![[thin space (1/6-em)]](https://www.rsc.org/images/entities/char_2009.gif) 694.00 694.00 |
0.19 |
| G/A 2.0 wt% | 806.50 | 25![[thin space (1/6-em)]](https://www.rsc.org/images/entities/char_2009.gif) 069.50 069.50 |
0.03 |
| G/A/A 0.5 wt% | 1016.22 | 8143.54 | 0.12 |
| G/A/A 1.0 wt% | 1836.50 | 14![[thin space (1/6-em)]](https://www.rsc.org/images/entities/char_2009.gif) 708.50 708.50 |
0.12 |
| G/A/A 1.5 wt% | 1973.50 | 16![[thin space (1/6-em)]](https://www.rsc.org/images/entities/char_2009.gif) 541.50 541.50 |
0.12 |
| G/A/A 2.0 wt% | 6306.00 | 25![[thin space (1/6-em)]](https://www.rsc.org/images/entities/char_2009.gif) 884.00 884.00 |
0.24 |
Fig. 12 shows the elastic modulus test results of two composite materials in different regions and depths. The average elastic modulus of composite material G/A composed of pure graphene is 249.3 GPa, while the average elastic modulus of modified composite material G/A/A is 355.6 GPa. The elastic modulus of G/A/A is significantly higher than that of G/A. Fig. 13 shows the hardness test results. Similar to the situation of elastic modulus, the micro-hardness of G/A/A is significantly higher than that of G/A. The average micro-hardness of G/A and G/A/A materials is 11.7 GPa and 19.3 GPa, respectively. Fig. 14 shows the load–displacement curves of two materials. It is observed that penetration depth obtained in case of the composite G/A/A (Fig. 14b) is smaller than G/A (Fig. 14a), and the maximum load of G/A/A is also significantly greater than that of G/A, indicating towards a better compactness and homogeneity of microstructure.37 The two-dimensional size of graphene flakes exceeds 10 μm. And the random dispersion on the surface and near surface areas of alumina resulted in significant differences in nanoindentation data at different positions on the surface of the two composite materials. However, from a statistical perspective, it can be considered that the various parameters of composite material G/A/A are superior to those of G/A. Comparing the elastic modulus and hardness of G/A and G/A/A, it was found that graphene modification significantly improved some of the mechanical properties of the composite material, which may be related to the adjustment of the interface interaction between graphene and alumina matrix by the alumina coating. The elastic modulus of ceramic composite materials is related to their density. According to literature,5 graphene doping can increase the Young's modulus of alumina, but this enhancement effect will gradually weaken as the amount of graphene doping continues to increase. This is because as the graphene content increases, more pores and voids may appear in the composite due to interface interactions or aggregation of graphene, which will lead to a decrease in the elastic modulus of the composite. In modified composite G/A/A, due to the effect of the aluminum oxide transition layer on the surface of graphene, the bonding between the aluminum oxide matrix and graphene is tighter, suppressing some interfacial interactions. Defects in graphene may lead to localized stress at the interface, exacerbating pores and voids in composite materials. And according to the ratio of ID to IG in Raman spectroscopy, it can be found that modified graphene is better protected during composite material sintering, and the density of defects is significantly lower than that of pure graphene. Compared with composite G/A, there are fewer defects such as pores and voids. This can also be seen from Fig. 6d that there is a significant graphene aggregation phenomenon in the G/A composite, which will lead to more defects. However, modified graphene exhibits less aggregation or folding in composite materials. We speculate that this may be the reason why the elastic modulus of G/A/A composite materials is significantly better than that of G/A. The hardness of composite materials is related to grain size, and both types of composites exhibit significant grain size suppression. However, the aggregation of graphene can lead to a decrease in the density of composites and also affect their hardness.5 Therefore, the hardness of modified composite G/A/A is superior to that of G/A.
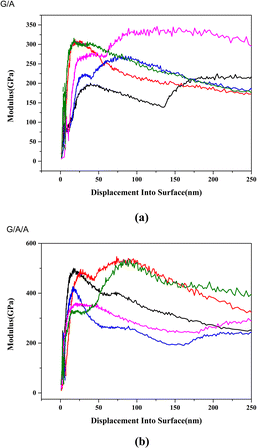 | ||
| Fig. 12 Modulus of two composite materials ((a) G/A, (b) G/A/A, 1.5 wt%, displayed test results from different locations). | ||
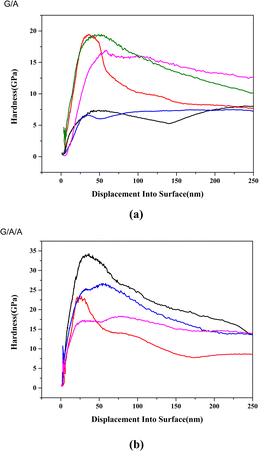 | ||
| Fig. 13 Hardness of two composite materials ((a) G/A, (b) G/A/A, 1.5 wt%, displayed test results from different locations, displayed test results from different locations). | ||
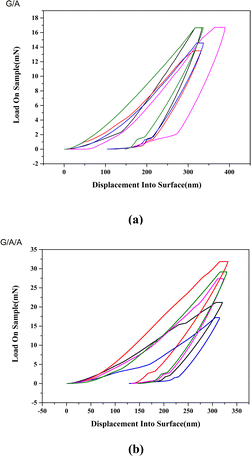 | ||
| Fig. 14 The load–displacement curves of two composite materials ((a) G/A, (b) G/A/A, 1.5 wt%, displayed test results from different locations). | ||
3.3 Interface structure of composite
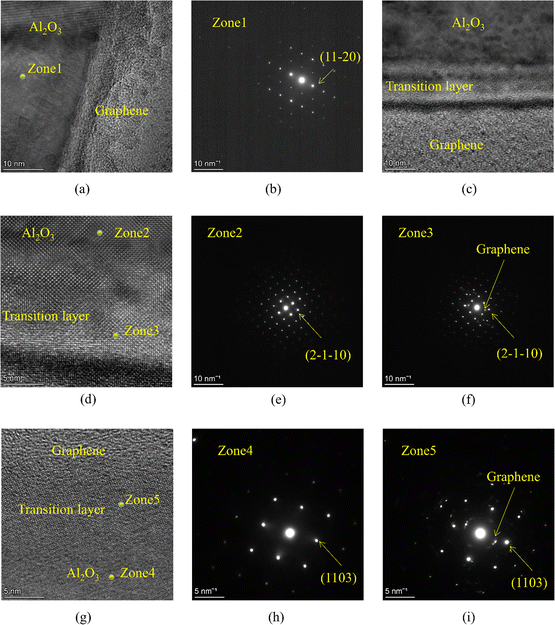
To confirm the effect of alumina nanocoating, interface structure samples of G/A/A and G/A composite were prepared in situ using FIB technology, and the interface structure was observed using high-resolution spherical aberration electron microscopy. The results are shown in Fig. 15. From the high-definition atomic image in Fig. 15a, it can be seen that in traditional graphene/alumina composite materials, graphene and alumina bind very tightly, and no obvious transition layer is found. In this type of material, the matrix alumina grains directly form an interface with graphene, and the growth of alumina grains is significantly affected by the interface effect. According to the analysis above, graphene is subjected to compressive stress along the two-dimensional plane in the alumina matrix, and the surrounding alumina grains are simultaneously subjected to tensile stress. Obviously, in traditional graphene/alumina composites (G/A), this tensile stress directly acts on the alumina matrix layer, causing grain boundary relaxation in the G/A material, leading to intergranular cracking under external forces. Fig. 15b shows the selected area electron diffraction results of the alumina layer near the interface in the G/A composite material, indicating that the grains at this location form an interface with graphene by the (11![[2 with combining macron]](https://www.rsc.org/images/entities/char_0032_0304.gif) 0) crystal plane (Fig. 15 identifies the orientation of the crystal plane towards graphene).
0) crystal plane (Fig. 15 identifies the orientation of the crystal plane towards graphene).
Fig. 15c shows the high-resolution atomic image of the interface of the modified graphene/alumina composite material (G/A/A). It can be observed that there is a clear transition layer in G/A/A, which is consistent with the speculation in the previous text. The thickness of the transition layer is about 15 nm. A photo with a larger magnification is shown in Fig. 15d. It can be seen that the atomic arrangement in the alumina matrix region is very similar to that in the transition layer, and the lower side of the transition layer is tightly bound to the graphene layer. The atomic image of another interface in the G/A/A composite material is shown in Fig. 15g, and a clear transition layer is also observed. These phenomena indicate that the pre prepared nano alumina coating on the surface of graphene is retained during the subsequent sintering process of the composite material and not completely destroyed. Alternatively, it can be considered that the nano alumina coating is transformed into a transition layer during the sintering process of composite materials. This transition layer can block or buffer the stress interaction between graphene and matrix alumina. In G/A/A, the matrix alumina is only subjected to stress from the transition layer and not directly subjected to interfacial tensile stress from graphene, thus retaining a fracture behavior similar to that of pure alumina. Fig. 15e, f and h, i respectively show electron diffraction patterns at different positions of the interfaces. From the electron diffraction patterns at zones 3 and 5, it can be seen that the transition layer in G/A/A forms an interface with graphene by (2![[1 with combining macron]](https://www.rsc.org/images/entities/char_0031_0304.gif)
![[1 with combining macron]](https://www.rsc.org/images/entities/char_0031_0304.gif) 0) and (1103) crystal planes, respectively. Interestingly, the orientation of the nearby alumina matrix layer is consistent with that of the transition layer (compare Fig. 15e and f, as well as Fig. 15h and i, respectively), indicating that the atomic structure of the transition layer has an impact on the structure of the alumina matrix during composite material sintering. The above experimental phenomena clearly indicate the influence of graphene/alumina interface interaction on the structure of composite materials. When the interface transition layer isolates the direct interaction between graphene and alumina matrix layer, the stress effect at the interface no longer has a significant impact on the fracture behavior of the composite material. This method of introducing an interface transition layer provides a new approach for adjusting the structure of graphene/alumina composite materials and even other two-dimensional reinforced composite materials.
0) and (1103) crystal planes, respectively. Interestingly, the orientation of the nearby alumina matrix layer is consistent with that of the transition layer (compare Fig. 15e and f, as well as Fig. 15h and i, respectively), indicating that the atomic structure of the transition layer has an impact on the structure of the alumina matrix during composite material sintering. The above experimental phenomena clearly indicate the influence of graphene/alumina interface interaction on the structure of composite materials. When the interface transition layer isolates the direct interaction between graphene and alumina matrix layer, the stress effect at the interface no longer has a significant impact on the fracture behavior of the composite material. This method of introducing an interface transition layer provides a new approach for adjusting the structure of graphene/alumina composite materials and even other two-dimensional reinforced composite materials.
4. Conclusions
(1) A layer of crystalline alumina coating with alpha phase and thickness of tens of nanometers was prepared on the surface of graphene.(2) The structure of graphene was not seriously damaged during the modification process, and graphene was subjected to tensile or compressive stress along the 2D plane.
(3) The fracture behavior of modified graphene/alumina composites is similar to that of pure alumina, but significantly different from that of the traditional graphene/alumina composites.
(4) According to the analysis results of Raman spectrum, in graphene/alumina composites, alumina is subject to tensile stress along the 2D plane of graphene, so the fracture process is mainly intergranular fracture.
(5) The elastic modulus and hardness of composite material G/A/A are higher, while its microstructure has better density and uniformity.
(6) In situ HRSEM observation showed that there was a transition layer of alumina in the modified graphene/alumina composite. Although in the modified graphene/alumina composite, the stress effect of the interface is the same as that of the traditional graphene/alumina composite, due to the block or buffer effect of the transition layer, this stress effect does not act on the surrounding alumina matrix, so the fracture mode of the modified graphene/alumina composite is similar to that of the pure alumina.
(7) The above experimental phenomena clearly indicate the influence of graphene/alumina interface interaction on the structure of composite materials. In the graphene/alumina composite material system, we should not only consider the two-dimensional sheet structure of graphene and the performance changes brought about by its high strength, but also consider the influence of interface interaction on the material structure and properties.
Author contributions
Yan-Ze Hu: writing – original draft, validation, methodology; Jing Li: investigation, resources; Li-Li Luo: investigation, data curation; Shuang-Lin Hu: writing – review & editing, methodology; Hua-Hai Shen: investigation, data curation; Xing-Gui Long: writing – review & editing, supervision.Conflicts of interest
There are no conflicts to declare.References
- S. M. Yanwu Zhu, W. Cai, X. Li, J. W. Suk, J. R. Potts and R. S. Ruoff, Graphene and Graphene Oxide: Synthesis, Properties, and Applications, Adv. Mater., 2010, 22(46), 5226 CrossRef.
- C. Lee, X. Wei, J. W. Kysar and J. Hone, Measurement of the Elastic Properties and Intrinsic Strength of Monolayer Graphene, Science, 2008, 321(5887), 385–388, DOI:10.1126/science.1157996.
- S. Ghosh, I. Calizo, D. Teweldebrhan, E. P. Pokatilov, D. L. Nika, A. A. Balandin, W. Bao, F. Miao and C. N. Lau, Extremely high thermal conductivity of graphene: prospects for thermal management applications in nanoelectronic circuits, Appl. Phys. Lett., 2008, 92(15), 151911, DOI:10.1063/1.2907977.
- H. Porwal, R. Saggar, P. Tatarko, S. Grasso, T. Saunders, I. Dlouhý and M. J. Reece, Effect of lateral size of graphene nano-sheets on the mechanical properties and machinability of alumina nano-composites, Ceram. Int., 2016, 42(6), 7533–7542, DOI:10.1016/j.ceramint.2016.01.160.
- T. Cygan, J. Wozniak, M. Kostecki, M. Petrus, A. Jastrzębska, W. Ziemkowska and A. Olszyna, Mechanical properties of graphene oxide reinforced alumina matrix composites, Ceram. Int., 2017, 43(8), 6180–6186, DOI:10.1016/j.ceramint.2017.02.015.
- J. Liu, H. Yan and K. Jiang, Mechanical properties of graphene platelet-reinforced alumina ceramic composites, Ceram. Int., 2013, 39(6), 6215–6221, DOI:10.1016/j.ceramint.2013.01.041.
- X. Meng, C. Xu, G. Xiao, M. Yi and Y. Zhang, Microstructure and anisotropy of mechanical properties of graphene nanoplate toughened Al2O3-based ceramic composites, Ceram. Int., 2016, 42(14), 16090–16095, DOI:10.1016/j.ceramint.2016.07.121.
- R. Pawel, P. Klimczyk, L. Jaworska, L. Stobierski and A. Dubiel, Thermal properties of pressure sintered alumina–graphene composites, J. Therm. Anal. Calorim., 2015, 122, 105–114, DOI:10.1007/s10973-015-4694-x.
- Y. Fan, L. Wang, J. Li, J. Li, S. Sun, F. Chen, L. Chen and W. Jiang, Preparation and electrical properties of graphene nanosheet/Al2O3 composites, Carbon, 2010, 48, 1743–1749, DOI:10.1016/j.carbon.2010.01.017.
- A. M. Jastrzębska, J. Karcz, R. Letmanowski, D. Zabost, E. Ciecierska, J. Zdunek, E. Karwowska, M. Siekierski, A. Olszyna and A. Kunicki, Synthesis of the RGO/Al2O3 core–shell nanocomposite flakes and characterization of their unique electrostatic properties using zeta potential measurements, Appl. Surf. Sci., 2016, 362, 577–594, DOI:10.1016/j.apsusc.2015.10.125.
- C. F. Gutierrez-Gonzalez, A. Smirnov, A. Centeno, A. Fernández, B. Alonso, V. G. Rocha, R. Torrecillas, A. Zurutuza and J. F. Bartolome, Wear behavior of graphene/alumina composite, Ceram. Int., 2015, 41(6), 7434–7438, DOI:10.1016/j.ceramint.2015.02.061.
- H. J. Kim, S.-M. Lee, Y.-S. Oh, Y.-H. Yang, Y. S. Lim, D. H. Yoon, C. Lee, J.-Y. Kim and R. S. Ruoff, Unoxidized Graphene/Alumina Nanocomposite: Fracture- and Wear-Resistance Effects of Graphene on Alumina Matrix, Sci. Rep., 2014, 4(1), 5176, DOI:10.1038/srep05176.
- J. Liu, H. Yan, M. J. Reece and K. Jiang, Toughening of zirconia/alumina composites by the addition of graphene platelets, J. Eur. Ceram. Soc., 2012, 32(16), 4185–4193, DOI:10.1016/j.jeurceramsoc.2012.07.007.
- J. Wozniak, A. Jastrzębska, T. Cygan and A. Olszyna, Surface modification of graphene oxide nanoplatelets and its influence on mechanical properties of alumina matrix composites, J. Eur. Ceram. Soc., 2017, 37(4), 1587–1592, DOI:10.1016/j.jeurceramsoc.2016.11.010.
- B. Lee, M. Y. Koo, S. H. Jin, K. T. Kim and S. H. Hong, Simultaneous strengthening and toughening of reduced graphene oxide/alumina composites fabricated by molecular-level mixing process, Carbon, 2014, 78, 212–219, DOI:10.1016/j.carbon.2014.06.074.
- B. Yazdani, H. Porwal, Y. Xia, H. Yan, M. J. Reece and Y. Zhu, Role of synthesis method on microstructure and mechanical properties of graphene/carbon nanotube toughened Al2O3 nanocomposites, Ceram. Int., 2015, 41(8), 9813–9822, DOI:10.1016/j.ceramint.2015.04.054.
- W. Wu, J. Gui, W. Sai and Z. Xie, The reinforcing effect of graphene nano-platelets on the cryogenic mechanical properties of GNPs/Al2O3 composites, J. Alloys Compd., 2017, 691, 778–785, DOI:10.1016/j.jallcom.2016.08.314.
- W. A. Shah, X. Luo, C. Guo, B. I. Rabiu, B. Huang and Y. Q. Yang, Preparation and mechanical properties of graphene-reinforced alumina-matrix composites, Chem. Phys. Lett., 2020, 754, 137765, DOI:10.1016/j.cplett.2020.137765.
- S. Akcöltekin, M. El Kharrazi, B. Köhler, A. Lorke and M. Schleberger, Graphene on insulating crystalline substrates, Nanotechnology, 2009, 20(15), 155601, DOI:10.1088/0957-4484/20/15/155601.
- D. Villaroman, X. Wang, W. Dai, L. Gan, R. Wu, Z. Luo and B. Huang, Interfacial thermal resistance across graphene/Al2O3 and graphene/metal interfaces and post-annealing effects, Carbon, 2017, 123, 18–25, DOI:10.1016/j.carbon.2017.07.039.
- M. H. Oliveira, T. Schumann, R. Gargallo-Caballero, F. Fromm, T. Seyller, M. Ramsteiner, A. Trampert, L. Geelhaar, J. M. J. Lopes and H. Riechert, Mono- and few-layer nanocrystalline graphene grown on Al2O3(0001) by molecular beam epitaxy, Carbon, 2013, 56, 339–350, DOI:10.1016/j.carbon.2013.01.032.
- V. V. Ilyasov, I. V. Ershov, A. V. Ilyasov, I. G. Popova and C. V. Nguyen, Substrate-induced band structure and electronic properties in graphene/Al2O3(0001) interface, Surf. Sci., 2015, 632, 111–117, DOI:10.1016/j.susc.2014.09.020.
- I. Ahmad, M. Islam, N. H. Alharthi, H. Alawadhi, T. Subhani, K. S. Munir, S. I. Shah, F. Inam and Y. Zhu, Chemical and structural analyses of the graphene nanosheet/alumina ceramic interfacial region in rapidly consolidated ceramic nanocomposites, J. Compos. Mater., 2017, 52(3), 417–428, DOI:10.1177/0021998317708235.
- J. M. Polfus, O. M. Løvvik, P. M. Rørvik and R. Bredesen, Nanocomposites of few-layer graphene oxide and alumina by density functional theory calculations, J. Eur. Ceram. Soc., 2016, 36(3), 719–724, DOI:10.1016/j.jeurceramsoc.2015.11.009.
- P. Jadaun, S. K. Banerjee, L. F. Register and B. Sahu, Density functional theory based study of graphene and dielectric oxide interfaces, J. Phys.: Condens. Matter, 2011, 23(50), 505503, DOI:10.1088/0953-8984/23/50/505503.
- M. S. Gusmão, A. Ghosh and H. O. Frota, Electronic transport properties of graphene/Al2O3 (0001) interface, Curr. Appl. Phys., 2018, 18(1), 90–95, DOI:10.1016/j.cap.2017.10.008.
- Y. Z. Hu, L. L. Luo, H. H. Shen, S. L. Hu, Z. Y. Tan and X. G. Long, Interfacial properties of multilayer graphene and α-alumina: experiments and simulations, Ceram. Int., 2022, 48, 12056–12064, DOI:10.1016/j.ceramint.2022.01.064.
- W. C. Oliver and G. M. Pharr, An improved technique for determining hardness and elastic modulus using load and displacement sensing indentation experiments, J. Mater. Res., 1992, 7(6), 1564–1583, DOI:10.1557/JMR.1992.1564.
- C. Casiraghi, Raman intensity of graphene, Phys. Status Solidi B, 2011, 248, 2593–2597, DOI:10.1002/pssb.201100040.
- V. Carozo, C. M. Almeida, E. H. M. Ferreira, L. G. Cançado, C. A. Achete and A. Jorio, Raman Signature of Graphene Superlattices, Nano Lett., 2011, 11(11), 4527–4534, DOI:10.1021/nl201370m.
- L. M. Malard, M. A. Pimenta, G. Dresselhaus and M. S. Dresselhaus, Raman spectroscopy in graphene, Phys. Rep., 2009, 473(5), 51–87, DOI:10.1016/j.physrep.2009.02.003.
- A. C. Ferrari, J. C. Meyer, V. Scardaci, C. Casiraghi, M. Lazzeri, F. Mauri, S. Piscanec, D. Jiang, K. S. Novoselov, S. Roth and A. K. Geim, Raman Spectrum of Graphene and Graphene Layers, Phys. Rev. Lett., 2006, 97(18), 187401, DOI:10.1103/PhysRevLett.97.187401.
- M. M. Lucchese, F. Stavale, E. H. M. Ferreira, C. Vilani, M. V. O. Moutinho, R. B. Capaz, C. A. Achete and A. Jorio, Quantifying ion-induced defects and Raman relaxation length in graphene, Carbon, 2010, 48(5), 1592–1597, DOI:10.1016/j.carbon.2009.12.057.
- A. Osman, A. Elhakeem, S. Kaytbay and A. Ahmed, Thermal, electrical and mechanical properties of graphene/nano-alumina/epoxy composites, Mater. Chem. Phys., 2021, 257, 123809, DOI:10.1016/j.matchemphys.2020.123809.
- A. S. Jbara, Z. Othaman, A. A. Ati and M. A. Saeed, Characterization of γ-Al2O3 nanopowders synthesized by co-precipitation method, Mater. Chem. Phys., 2017, 188, 24–29 CrossRef CAS.
- Z. Ni, Y. Wang, T. Yu and Z. Shen, Raman spectroscopy and imaging of graphene, Nano Res., 2008, 1(4), 273–291, DOI:10.1007/s12274-008-8036-1.
- B. Dhakar, S. Chatterjee and K. Sabiruddin, Measuring mechanical properties of plasma-sprayed alumina coatings by nanoindentation technique, Mater. Sci. Technol., 2017, 33(3), 285–293, DOI:10.1080/02670836.2016.1195643.
| This journal is © The Royal Society of Chemistry 2024 |

