 Open Access Article
Easily deposited ZnO nanorods on siloxene nanosheets: investigation of morphological, dielectric, ferroelectric, and energy storage properties†
Abdallah Nayad *ab,
Youness Hadouchcde,
Yahya Agzenai Ben Salemb,
Daoud Mezzanece,
Zdravko Kutnjakd,
Ahmad Mehdi
 f,
Larbi El Firdoussia and
Mustapha Ait Ali
 a
a
aLaboratoire de Chimie Moléculaire, Unité de Chimie de Coordination et Catalyse, Faculté des Sciences Semlalia, Université Cadi Ayyad, BP 23900, 40001 Marrakech, Morocco. E-mail: abdallahnayad@gmail.com
bThe High Throughput Multidisciplinary Research Laboratory (HTMR) Laboratory, University Mohammed VI Polytechnic (UM6P), 43150 Ben Guerir, Morocco
cLaboratory of Innovative Materials, Energy and Sustainable Development (IMED), Faculté des Sciences et Techniques, Université Cadi Ayyad, BP 549, 40001 Marrakech, Morocco
dCondensed Matter Physics Department, Jožef Stefan Institute, Jamova Cesta 39, 1000 Ljubljana, Slovenia
eLaboratory of Physics of Condensed Matter (LPMC), University of Picardie Jules Verne, Amiens, France
fInstitut Charles Gerhardt Montpellier, Université Montpellier, CNRS, ENSCM, Montpellier, France
First published on 4th April 2024
Abstract
The integration of metal oxides onto two-dimensional layered siloxene has proven to be an effective strategy for expanding potential applications across diverse fields. Herein, we present the synthesis and detailed characterization of zinc oxide (ZnO) nanorods deposited on siloxene nanosheets using the wet chemical precipitation method without the need of alkali. The presence of ZnO nanorods was confirmed through electron microscopy analyses. X-ray diffraction analysis further verified the presence of characteristic peaks of ZnO in the hexagonal wurtzite crystal structure. Dielectric measurements demonstrated the moderated stability of interfacial polarization in siloxene nanosheets doped with zinc oxide (SX-ZnO) over a broad frequency spectrum, coupled with minimal electrical loss values under 0.4 within the 100 Hz to 1 MHz frequency range. In addition, the ferroelectric study of SiNSs–ZnO composites revealed a slim hysteresis loop with maximum polarization and remnant polarization values that varied with reaction times. The SX-ZnO sample prepared for 5 h exhibited the best stored energy properties, featuring a moderate stored energy density (Ws = 771.94 mJ cm−3) and a high energy efficiency of 83.38%. This investigation underscores that the modification of siloxene layers through the deposition of nanostructured transition metal oxide materials leads to stabilized interfacial polarization and enhanced efficient energy storage.
Introduction
The significant attention devoted to the exploration of two-dimensional (2D) materials traces its origins to the discovery of hexagonal graphene nanosheets with a few layers.1 These materials present compelling advantages, including nanoscale structures featuring expansive interlayered void spaces to facile ion transport channels, augmented surface area, and remarkable electrical, optical, mechanical, chemical, and thermal characteristics.2–6In recent years, there has been a surge in interest in creating nanocomposites by combining 2D materials with nanostructured metal oxides.7–9 This strategy aims to amplify specific physical or optical properties tailored for particular applications.10–13 In this context, the two-dimensional silicon (Si) compound known as siloxene has emerged as a focal point in energy storage devices, such as lithium-ion batteries and supercapacitors,14–18 as well as in biosensors like dopamine sensors.19 Siloxene nanosheets, regarded as hydroxylated silicene nanosheets in sp3 hybridization,20 have garnered attention as advanced support materials for nanoparticle deposition. Similar to the well-known graphene oxide (GO), siloxene serves as a versatile platform for anchoring and supporting nanoparticles, offering opportunities for catalytic support, surface functionalization, and deposition of metal transitions.21–24
The advancement of dielectric capacitors with high electrical energy densities is crucial for their integration into microelectronic and electric power systems. Conventional ferroelectric materials typically exhibit a square-shaped polarization (P)–electric field (E) hysteresis loop, comprising a saturated polarization (Ps), a substantial remnant polarization (Pr), and a large coercive field (Ec). These characteristics contribute to lower energy storage density and limited energy storage efficiency (η). In contrast, a reduced Pr and Ec result in a slim P–E hysteresis loop, providing a substantial electrical energy output.25,26 In our recent paper, we successfully deposited flower-like spherical zinc oxide (ZnO) onto two-dimensional siloxene nanosheets using a wet chemical precipitation method.27 The resulting nanocomposite named SiNSs@ZnO exhibited a slim P–E hysteresis loop and impressive energy storage capabilities, with a stored energy (Ws) of 827.51 mJ cm−3 and a dissipated energy (Wloss) of 343.63 mJ cm−3, resulting in an energy efficiency of 70.65%. Additionally, this composite demonstrated a superior antibacterial activity compared to siloxene nanosheets against both Gram-positive and Gram-negative bacteria. These findings highlight the multifunctional capabilities of siloxene-based nanocomposites and their potential applications in energy storage and antibacterial technologies.
As previously mentioned, ZnO as an abundant and eco-friendly material, offers versatile nanostructural forms with excellent chemical stability and unique properties for applications in several field, including nanobiotechnology,28 photocatalysis,29,30 solar cells,31,32 piezoelectric devices,33 and so on. The morphology of ZnO nanostructures varies depending on the synthesis method, precursor, and reaction conditions. Xu et al. demonstrated the preparation of ZnO nanostructures with different morphologies using the wet chemical precipitation method with zinc acetylacetonate hydrate (Zn(C5H7O2)2·H2O) as the precursor.34 In their study, they successfully obtained rod-like shapes by employing a mixture of water and ethanol as solvents. It is generally observed that the use of polar and protic solvents, either individually or in combination, such as water and alcohols, tends to favor the formation of ZnO nanorods with Zn(C5H7O2)2·H2O as Zinc source.35–40 The reaction equation of the ZnO nanostructuration is described as follows:41
| Zn(C5H7O2)2 + 2ROH + H2O → 2RCOOCH3 + 2CH3COCH3 + ZnO | (1) |
In continuation with our previous work,27 we extended our research by depositing nanorod-like ZnO on siloxene nanosheets using the same synthesis methodology, employing an equivolume mixture of water and ethanol as the solvent. The resulting composites SX-ZnO underwent comprehensive characterization using various spectroscopic techniques, including Fourier-transform infrared (FTIR) spectroscopy, X-ray diffraction (XRD), and transmission electron microscopy (TEM). These analyses confirmed both the incorporation and the morphology of the nanorod-like ZnO within the siloxene matrix. Furthermore, dielectric properties were investigated to explore the interfacial polarization of the studied composites at room temperature within a frequency range of 1 to 106 Hz. Additionally, ferroelectric energy storage was determined from the P–E hysteresis loops, with a focus on studying the impact of reaction time on energy storage efficiency.
Experimental section
Materials
CaSi2 (Ca: 30–33% and Si: 60–62%), potassium hydroxide pellets (KOH ≥ 85%), hydrochloric acid (HCl, 37%), and acetone (99.5%) were all obtained from Sigma-Aldrich Chemicals. Methanol (99.8%) was purchased from VWR chemicals, and zinc acetylacetonate hydrate (Zn(acac)2·H2O, 98%) was procured from Alfa Aesar. Deionized water (18.2 MΩ cm) was obtained with a PURELAB classic at the Center of Analysis and Characterization (CAC) from Cadi Ayyad University.Synthesis of SX-ZnO
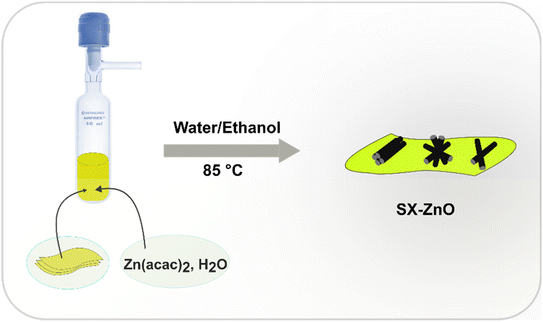
The synthesis of siloxene nanosheets has been comprehensively detailed in our previous work.27 Following a procedure analogous to the synthesis of SiNSs@ZnO outlined in the same report, the same method was employed to prepare SX-ZnO nanocomposites. In brief, in a Schlenk reactor, 200 mg of siloxene nanosheets, Zn(C5H7O2)2·H2O (1 eq.), and an equivolume mixture of pure water and ethanol (20 mL) were introduced in a Schlenk reactor sealed with a Rotaflo (polytetrafluoroethylene screw-in key). After sonication for 15 minutes, the mixture was agitated at 85 °C for a defined time (1, 3, 5, and 12 h). The resulting dispersed powder was vacuum-filtered and washed with methanol (60 mL) and acetone (60 mL). The prepared nanocomposites, labeled as SX-ZnO-y with y representing the reaction time, were then dried at 80 °C for 12 hours. Fig. 1 depicts a schematic diagram illustrating the experimental process.Characterizations
X-ray diffraction (XRD) data were obtained using a Rigaku (SmartLab SE) with Cu-Kα radiation (λKα = 1.54056 Å) at a scan rate of 5° min−1. The structural morphology was observed by scanning electron microscopy (SEM) on a TESCAN VEGA3-EDAX coupled with energy-dispersive X-ray spectroscopy (EDS). In addition, scanning transmission electron microscopy (STEM) and high-resolution transmission microscopy (HRTEM) were performed on a JEOL 220 FS at an acceleration voltage of 200 kV. Infrared spectra (FTIR) were recorded in a Nicolet Is50 spectrophotometer (Thermo Fisher) equipped with a single attenuated total reflectance (ATR) accessory. The optical properties were measured by diffuse reflectance spectroscopy (DRS) using a V-770 UV-visible/NIR spectrophotometer (Jasco Inc.). Thermogravimetric analysis (TGA) was measured on an STA 449 F5 Jupiter (NETZSCH) in a nitrogen atmosphere in the temperature range of 25–800 °C. Dielectric properties were examined using an impedance analyzer (Solartron 1260 impedance/gain-phase) with AC = 500 mV and DC = 0 V. The ferroelectric hysteresis P–E loops were measured using a polarization loop and dielectric breakdown (CPE1701, PloyK) combined with a Trek 609-6 high voltage amplifier in a silicone oil bath.Results and discussions
Structural, optical, and morphological analyses
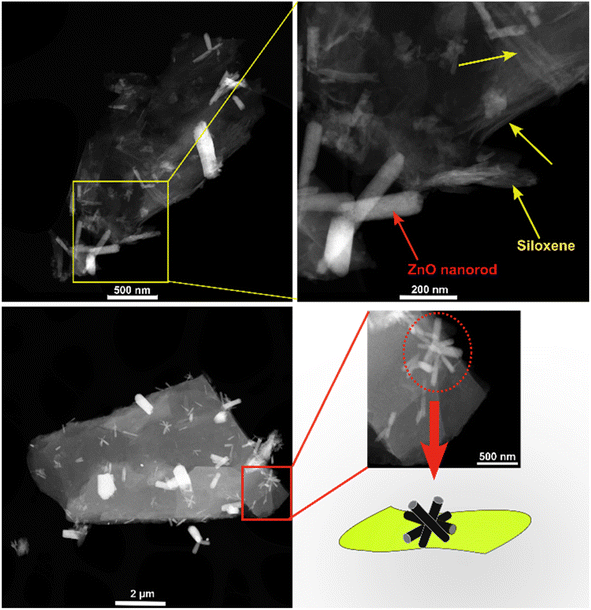
Fig. S1† shows the SEM images of the synthesized SX-ZnO nanocomposites at different reaction times. The micrographs clearly reveal the presence of small rods on the surface of the siloxene nanosheets. The EDS spectra provide additional confirmation of the successful incorporation of the Zn element, accompanied by an observed increase in oxygen content in the synthesized samples, in contrast to the oxygen content found in neat siloxene.27 The presence of iron (Fe) elements can be attributed to CaSi2 impurities, while the chlorine (Cl) elements result from the exfoliation process involving HCl during the synthesis of siloxene.STEM analysis was conducted on SX-ZnO-3 to better understand the ZnO morphology deposited on siloxene NSs (Fig. 2). The images reveal the presence of thin silicon nanosheets with a layered structure, accompanied by one-dimensional ZnO nanorods that exhibit hallowed ends. Additionally, some of these nanorods assemble into a starfish-like morphology. The elemental mapping analysis in Fig. S2† depicted the distribution of each element in the sample. The results reveal a satisfactory elemental distribution of Si and O elements, while the distribution of Zn element can be observed in several spots on the nanosheets.
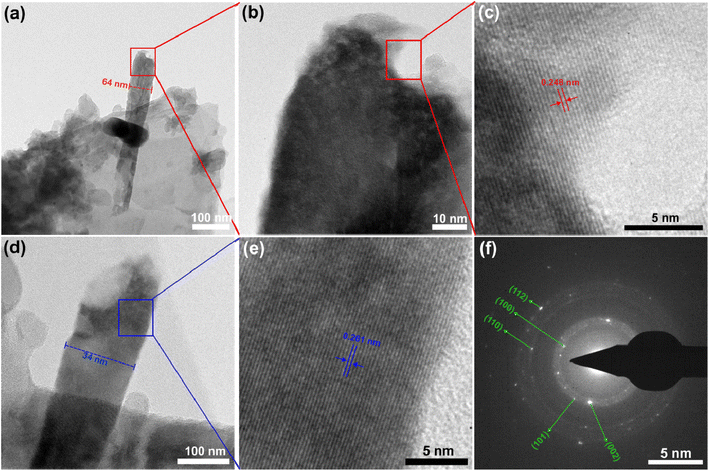
HRTEM analyses provided a detailed examination of the ZnO nanorods. The observed nanorod in Fig. 3a displays a maximum diameter of 64 nm, but its thickness is not uniform along the structure. A distinct cavity has formed at the top of the nanorod (Fig. 3b). Upon closer inspection, the high magnification image of this cavity reveals that the nanorod is a single-crystalline phase with a d spacing of 0.248 nm, belonging to the (101) reflection plane (Fig. 3c). Additionally, a second nanorod with an approximate diameter of 34 nm was observed in close proximity, and its high magnification image also indicates that the particles grew in a single-crystalline phase with an interlayer distance of 0.261 nm along the c-axis corresponding to the (002) crystal plane (Fig. 3d and e). The SAED pattern exhibited numerous bright spots forming circles, and these spots were successfully indexed to the hexagonal wurtzite crystal structure of ZnO (Fig. 3f). Overall, the morphological analyses revealed the formation of well-crystallized ZnO nanorods on the surface of siloxene NSs.
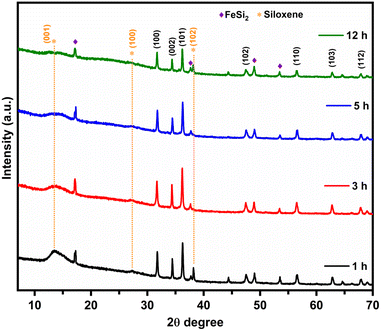
The XRD pattern of the SX-ZnO at different reaction times is shown in Fig. 4. The diffractogram obtained for all samples exhibits the characteristic peaks of standard ZnO in the hexagonal wurtzite crystal structure (JCPDS Card No. 36-1451). The interlayer distance d for the most intense peak at 2θ = 36.2° corresponding to the (101) plane has a value of 2.477 Å, 2.482 Å, 2.476 Å, and 2.482 Å in SX-ZnO-1, SX-ZnO-3, SX-ZnO-5, and SX-ZnO-12, respectively. We notice the reduction of the siloxene (001) plane with increased reaction time. FeSi2 is a common impurity in the commercial CaSi2 that is irremovable.42
By using eqn (2), we have determined the value of the lattice constants from the (100) and (002) planes and the c/a ratio in each sample, and the results are listed in Table 1.
 | (2) |
 | (3) |
| Samples | a = b value (Å) | c value (Å) | c/a ratio | V (Å3) | L (Å) |
|---|---|---|---|---|---|
| SX-ZnO-1 | 3.252 | 5.210 | 1.6021 | 47.716 | 1.9792 |
| SX-ZnO-3 | 3.259 | 5.222 | 1.6023 | 48.032 | 1.9796 |
| SX-ZnO-5 | 3.251 | 5.208 | 1.6019 | 47.669 | 1.9784 |
| SX-ZnO-12 | 3.257 | 5.219 | 1.6024 | 47.946 | 1.9822 |
In addition, the Zn–O bond length (L) can be estimated by the relation (4):
 | (4) |
 | (5) |
The results indicate that the value of the c/a ratio is almost constant in all the samples and is consistent with the value found in the flower-like spherical SiNSs@ZnO27 and the literature.36,37 In addition, the value of c/a ratio and Zn–O bond length in each composite slightly increase in the following order: SX-ZnO-5 < SX-ZnO-1 < SX-ZnO-3 < SX-ZnO-12. The obtained bond length from the given interlayer distances agrees with the Zn–O bond length reported in both experimental and theoretical studies found in the literature.43,44
The average crystallite size for the (100), (002), and (101) reflection planes is calculated from the Scherrer formula given in relation (6), and the results are summarized in Table 2.
 | (6) |
| Samples | Crystallite size D (nm) | Average (nm) | Direct band gap Eg (eV) | ||
|---|---|---|---|---|---|
| (100) | (002) | (101) | |||
| SX-ZnO-1 | 62.63 | 88.31 | 55.49 | 68.81 | 2.73/3.10 |
| SX-ZnO-3 | 48.72 | 73.56 | 63.37 | 61.88 | 2.71/3.07 |
| SX-ZnO-5 | 62.63 | 55.35 | 49.32 | 55.76 | 2.70/3.06 |
| SX-ZnO-12 | 73.07 | 88.30 | 63.37 | 74.91 | 2.77/3.10 |
The results indicate that the average crystallite size decreases from the reaction time of 1 h to 5 h, whereas a longer reaction results in an increase in the average crystallite size. This implies that during the initial reaction period, the formation of smaller crystallites is favored at a specific time. However, as the reaction continues, the growth mechanism still takes place, and the crystallites grow in size, leading to an overall increase in average crystallite size. It should be noted that an effect of the stress field during the nucleation process under reflux may have caused a lattice strain or defects in the crystals, resulting in broadened peaks, which may have potentially overestimated the average crystallite size.45,46 Besides, we found that the value of Zn–O bond length is size-dependent with the increase in crystallite size in the most intense reflection plane (101). The calculated crystallite size of the (101) plane in SX-ZnO-3 aligns closely with the nanorod thickness observed in Fig. 3a.
Fig. S3† describes the infrared spectra of all samples in which many peaks are assigned to the siloxene NSs. They include the vibrational bands of Si–OH stretching, O3![[triple bond, length as m-dash]](https://www.rsc.org/images/entities/char_e002.gif) Si–H stretching, Si–H stretching, Si–O–Si stretching, Si–O bending, Si–H bending, Si–H wagging, Si–Si stretching, and Si–O–Si bending [ref]. Additionally, the stretching vibration of the Si–O–Si band in SX-ZnO composites shifted in lower wavenumbers compared to siloxene from our recent report. They appear at 1018, 1024, 1027, and 1029 cm−1 in SX-ZnO-1, SX-ZnO-3, SX-ZnO-5, and SX-ZnO-12, respectively. Furthermore, the Zn–O stretching vibration is combined with the Si–O–Si bending mode, resulting in an increased vibrational band observed in the spectra (inset in Fig. S3†). The finding results suggest that the vibrations associated with Zn–O bonds and Si–O–Si bonds are coupled, leading to the shifting of the Si–O–Si vibrational bands. In addition, the presence of CHx stretching vibrations in the spectra indicates the existence of organic residues resulting from the washing process. In addition, Raman spectra were recorded in the frequency range of 200–1000 cm−1. Fig. S3† shows the Raman spectra of SX-ZnO-3. The optically active Raman modes observed in the sample at peak positions around 378, 496, 637, and 733 cm−1 are associated with siloxene vibrational modes. The first peak corresponds to Si–Si vibrations, the strong peak refers to Si–O vibrations, while the last two peaks correspond to Si–H bands. Additionally, the new peak at around 332 cm−1 is attributed to the A1 symmetry mode in ZnO.47 Consequently, the functional groups present in siloxene nanosheets remained after the deposition of ZnO nanostructures.
Si–H stretching, Si–H stretching, Si–O–Si stretching, Si–O bending, Si–H bending, Si–H wagging, Si–Si stretching, and Si–O–Si bending [ref]. Additionally, the stretching vibration of the Si–O–Si band in SX-ZnO composites shifted in lower wavenumbers compared to siloxene from our recent report. They appear at 1018, 1024, 1027, and 1029 cm−1 in SX-ZnO-1, SX-ZnO-3, SX-ZnO-5, and SX-ZnO-12, respectively. Furthermore, the Zn–O stretching vibration is combined with the Si–O–Si bending mode, resulting in an increased vibrational band observed in the spectra (inset in Fig. S3†). The finding results suggest that the vibrations associated with Zn–O bonds and Si–O–Si bonds are coupled, leading to the shifting of the Si–O–Si vibrational bands. In addition, the presence of CHx stretching vibrations in the spectra indicates the existence of organic residues resulting from the washing process. In addition, Raman spectra were recorded in the frequency range of 200–1000 cm−1. Fig. S3† shows the Raman spectra of SX-ZnO-3. The optically active Raman modes observed in the sample at peak positions around 378, 496, 637, and 733 cm−1 are associated with siloxene vibrational modes. The first peak corresponds to Si–Si vibrations, the strong peak refers to Si–O vibrations, while the last two peaks correspond to Si–H bands. Additionally, the new peak at around 332 cm−1 is attributed to the A1 symmetry mode in ZnO.47 Consequently, the functional groups present in siloxene nanosheets remained after the deposition of ZnO nanostructures.
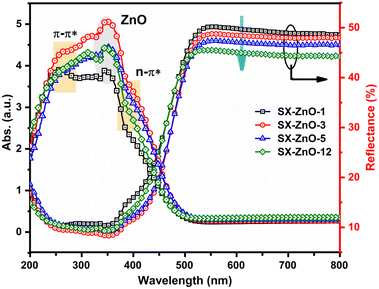
Fig. 5 illustrates the optical properties by DRS of the SX-ZnO samples, showing a gradual decrease in reflectance (%) with increasing reaction time. Additionally, a blue shift is observed after the drop in the reflectance curve, which can be attributed to the increase in the average crystallite size of ZnO in the composites, as observed in Table 2. Besides, it is noteworthy that SX-ZnO-3 displayed the highest absorbance of light, while SX-ZnO-1 exhibited the weakest absorbance band. In the absorbance spectra, distinct transitions, namely π–π* and n–π* transitions originating from siloxene nanosheets, can be observed at approximately 253 nm and 398 nm, respectively. The presence of ZnO in the siloxene matrix is detected by the excitonic peak at around 342 nm.
The optical direct and indirect band gaps of the nanocomposites were calculated from the Tauc plot relation by plotting [F(R)hλ]2 and [F(R)hλ]1/2, respectively, against photon energy hν (Fig. S5†). The extrapolation of [F(R)hλ]1/2 = 0 afforded the determination of the indirect band gap, which is found to increase with the increase of the reaction time. This can be attributed to the decrease in reflectance observed in the samples. Furthermore, the direct band gaps obtained from the extrapolation of [F(R)hλ]1/2 = 0 revealed that the finding energy values are governed by the average crystallite size of ZnO. In fact, a higher average crystallite size resulted in a larger band gap, as depicted in Table 2. This observation contradicts the results typically found in the literature. In general, a larger crystallite size is expected to result in a higher number of molecular orbitals, reducing the energy gap between the valence and conduction bands due to a quantum confinement.48–50 However, such a narrowing in the band gap with the increase of the average crystallite size is known as the Burstein–Moss effect and is generally observed in ZnO doped with other metals such as iron,51 chromium,52 and aluminum.53 In our case, conducting further studies to investigate the Fermi-level change would be beneficial in understanding the underlying mechanisms of this phenomenon.
The weight loss occurring in SX-ZnO-3 was determined by TGA in the temperature range of 25 to 800 °C. We can identify three degradation steps from the curve presented in Fig. S6.† The sample presents a first loss of around −0.95% from the ambient temperature to 115 °C, which is attributed to the presence of absorbed water. The second weight loss of −1.68% between 115 and 324 °C is related to the decomposition of the chemically bond groups on the siloxene surface along with the residual organic compounds from the washing process. The final weight loss of 0.61%, observed in the temperature range of 324–581 °C, can be attributed to the elimination of additional impurity ions within the ZnO crystalline structure. Overall, the TG analysis of SX-ZnO-3 resulted in a total weight loss of 3.24%, lower than the observed weight loss in SiNSs@ZnO.27 Based on these results, we can deduce that SX-ZnO-3 possesses higher thermal stability and good crystalline phases were achieved without further thermal annealing. Furthermore, the deposition of ZnO nanorods on siloxene nanosheets contributes to suppressing the oxidation reaction occurring in the undoped siloxene nanosheets.27,54
Dielectric properties
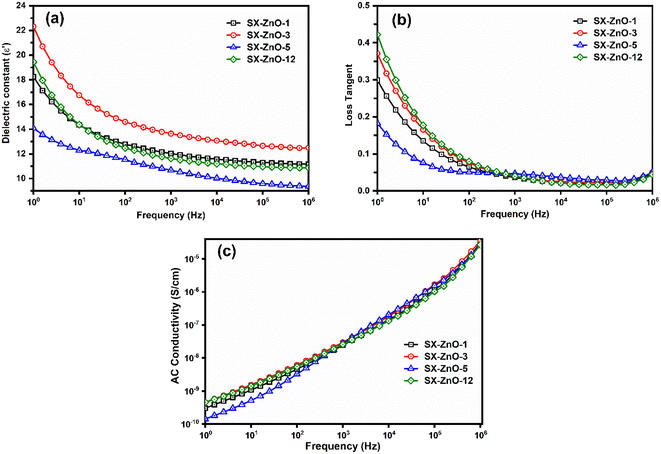
The dielectric constant behavior of the SX-ZnO samples was examined across the frequency range of 1 Hz to 1 MHz at room temperature (Fig. 6a). The findings indicate that the ε′ value decreases as the frequency increases, in line with the Maxwell–Wagner effect.55 The results are in accordance with our previous report, emphasizing a significant reduction in interfacial polarization of layered siloxene. This reduction is attributed to the presence of ZnO within the interlayered voids, which hinders H-bond interactions. Furthermore, ZnO nanorods may act as charge traps for charge carriers, leading to the decrease of dielectric polarization across all frequencies as they are not able to follow the field. As result, a significant decrease in the dielectric constant is witnessed when compared to pure siloxene NSs.27 Among the composites, SX-ZnO-3 displayed the highest ε′ = 22.31 value at 1 Hz. In comparison, other samples, namely SX-ZnO-12, SX-ZnO-1, and SX-ZnO-5, exhibited values of 19.44, 18.25, and 14.08, respectively. The finding of dielectric permittivity is influenced by the unit cell volume of the deposited ZnO on the nanosheets, as calculated in Table 1. Specifically, a larger unit volume cell leads to an increased dipole moment (greater trapping of charge carriers), thereby contributing to a higher dielectric permittivity.56 At a frequency of 1 MHz, the overall reduction in permittivity was determined to be approximately 39.2%, 48.5%, 33.4%, and 44.1% for SX-ZnO-1, SX-ZnO-3, SX-ZnO-5, and SX-ZnO-12, respectively. On the other hand, the loss tangent of the investigated samples, as depicted in Fig. 6b, displayed values below 1, indicating efficient electrical storage within the studied pellets. The reduction in electric dissipation can be attributed to the formation of grain boundaries introduced by the ZnO nanorods. These grain boundaries suppress the pronounced polarization that typically occurs at the interface of the layered nanosheets, effectively blocking the dissipated current flow. Among the samples, SX-ZnO-12 exhibited the highest loss tangent, followed by SX-ZnO-3, SX-ZnO-1, and SX-ZnO-5, in descending order. Fig. 6c shows the frequency-dependent behavior of the AC conductivity across the samples. The resulting curves are similar to those observed in our precedent report. We notice low AC conductivity values at low frequencies due to the steric hindrance of ZnO nanorods suppressing the charge transport of siloxene NSs. The electrical conductivity subsequently rises rapidly in a nearly linear direction with the increase in frequency, resulting from the rapid migration of the electrons.Ferroelectric and energy storage properties
In order to investigate the energy storage performance of the prepared composites, the P–E hysteresis loop was conducted at room temperature at an applied voltage of 3500 V and a frequency of 100 Hz. As shown in Fig. 7, the curves display a similar trend observed in our precedent report27 characterized by small slim hysteresis loops, and decreased Pr values originating from the reduction in the AC conductivity and the dielectric tangent loss. Similarly, all the prepared SX-ZnO samples exhibited maximum polarizations (Pmax), which attest to the storage of electrical energy. The values of the physical properties resulting from the ferroelectric analysis are listed in Table 3. The results revealed that SX-ZnO-3 reaches the highest polarization, followed successively by SX-ZnO-12, SX-ZnO-1, and SX-ZnO-5. Thus, in contrast with the siloxene lossy capacitor without Pmax, the deposition of ZnO nanorods induces electric storage characterized by slim hysteresis loops and maximum polarization.| Samples | Pmax (μC cm−2) | Pr (μC cm−2) | Ec (kV cm−1) | Wloss (mJ cm−3) | Ws (mJ cm−3) | η (%) |
|---|---|---|---|---|---|---|
| SX-ZnO-1 | 0.0534 | 0.0043 | 1.29 | 186.72 | 842.62 | 81.86 |
| SX-ZnO-3 | 0.0591 | 0.0078 | 2.63 | 331.08 | 858.95 | 72.17 |
| SX-ZnO-5 | 0.0480 | 0.0034 | 1.21 | 153.82 | 771.94 | 83.38 |
| SX-ZnO-12 | 0.0569 | 0.0102 | 4.31 | 434.71 | 754.01 | 63.43 |
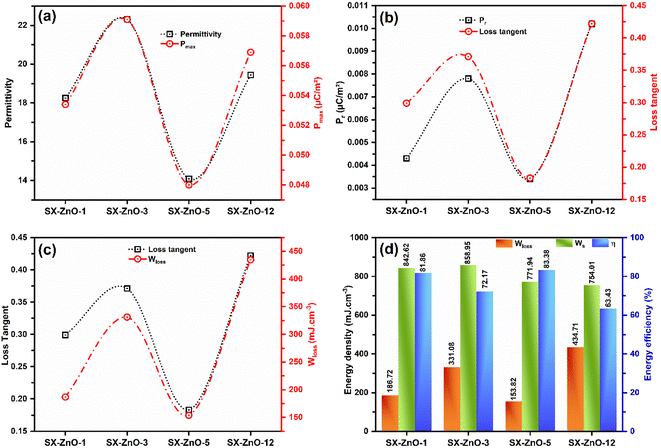
The reduction in polarization is closely related to the lower dielectric permittivity since the polarization formula is P = ε0(ε′ − 1)E.57 Consequently, the trend of polarization follows the dielectric values of the studied composites, as shown in Fig. 8a. The composite with a higher dielectric constant displays a higher polarization value, probably due to the increase in grain size.58 On the other hand, we can observe that the values of Pr align strongly with the variation of the dielectric tangent loss of the related composites, as illustrated in Fig. 8b. SX-ZnO-12, which exhibits the highest loss tangent factor, ends with the highest Pr value. On the contrary, a lower loss tangent value is obtained with SX-ZnO-5, resulting in a lower Pr value. In addition, the same correlation is witnessed between the loss tangent value and the dissipated energy storage obtained from the P–E hysteresis loops (Fig. 8c). The decrease in Er coincides also with the decrease of the loss tangent. From the Fig. 8d, the calculation of the energy densities (detailed in S7†) reveals that the stored energy storage density is higher in SX-ZnO-3 with a value 858.95 mJ cm−3, and decreases subsequently in SX-ZnO-1 (842.62 mJ cm−3), SX-ZnO-5 (771.94 mJ cm−3), and SX-ZnO-12 (754.01 mJ cm−3). Conversely, SX-ZnO-12 demonstrates the highest dissipated energy storage density, followed by SX-ZnO-3, SX-ZnO-1, and SX-ZnO-5, with values of 434.71, 331.08, 186.72, and 153.82 mJ cm−3, successively. Although SX-ZnO-3 exhibits a higher recovery energy density, we notice a significant Wloss occurring in the material at the studied applied voltage. The increase in Wloss is due to the increase of the Er, which leads to a larger P–E hysteresis loop. Finally, the SX-ZnO-5 composite, which exhibits the lowest tangent loss and Pr, displays the highest energy storage efficiency with a value of 83.38%, which is higher than our precedent report with spherical flower-like ZnO onto siloxene nanosheets (70.65%)27 In contrast, the lowest energy storage efficiency is observed in SX-ZnO-12, with a value of 63.43%. Therefore, an optimum of dielectric properties and high energy storage efficiency is achieved in a short reaction time; however, the increase in reaction time led to a decrease in energy storage efficiency. This observation may be related to the grain size of ZnO nanorods on the surface of the siloxene nanosheets. In fact, several studies have demonstrated that a higher energy storage efficiency is generally achieved with a smaller grain size.58–62
Conclusion
In this study, we successfully synthesized and characterized ZnO nanorods deposited on siloxene nanosheets using the wet chemical precipitation technique with a mixture of water and ethanol as solvent. Microscopic investigations through SEM and TEM revealed the presence of well-defined ZnO rods onto siloxene nanosheets. Furthermore, SAED and XRD analyses showed the formation of the hexagonal wurtzite crystal structure of ZnO. The deposition of ZnO nanorods onto siloxene as nanocomposites led to the suppression of the interfacial polarizations, resulting in low dielectric values with negligible electrical loss values in the studied frequency. Additionally, the electrical storing capacity of all SX-ZnO composites was determined from the P–E hysteresis loops, which revealed maximum polarization and remnant polarization values associated with different reaction times. Besides, we witnessed a strong correlation between the dielectric properties and the ferroelectric study of the studied samples, confirming the complementary of both measurements. From the P–E results, SX-ZnO-1 and SX-ZnO-3 composites exhibited superior stored energy properties above 800 mJ cm−3, while SX-ZnO-5 demonstrated an impressive energy efficiency of 83.38%. Thus, siloxene functions as charge carriers, and the role of ZnO nanostructures is to trap these charges to create an ordered orientation, resulting in maximum polarization and a stored energy. This work underlines the significance of modifying siloxene layers by depositing nanostructured transition metal oxide materials, resulting in stabilized interfacial polarization and enhanced efficiency in energy storage.Author contributions
Abdallah Nayad: methodology, conceptualization, data curation, validation, formal analyses, writing – original draft, writing – review & editing; Youness Hadouch: formal analysis, data curation, validation, original draft; Yahya Agzenai Ben Salem: formal analysis, data curation; Daoud Mezzane: visualization, validation; Zdravko Kutnjak: formal analyses, validation, writing – review & editing; Ahmad Mehdi: data curation, formal analyses; Larbi El Firdoussi: supervision, validation; Mustapha Ait Ali: supervision, conceptualization, validation.Conflicts of interest
The authors claim that they have no personal conflict of interest that could influence the work reported in this paper.Acknowledgements
The authors would like to thank the Center of Analysis and Characterization (CAC) from Cadi Ayyad University for the XRD, dielectric, and FTIR analyses. Y. H., D. M. and Z. K. acknowledge the European Union Horizon 2020 Research and Innovation actions MSCA-RISE-MELON (No. 872631) and H-GREEN project (No. 101130520).References
- A. K. Geim and K. S. Novoselov, Nat. Mater., 2007, 6, 183–191 CrossRef CAS PubMed.
- C. N. R. Rao, H. S. S. Ramakrishna Matte and U. Maitra, Angew. Chem., Int. Ed., 2013, 52, 13162–13185 CrossRef CAS PubMed.
- Y. Sun, S. Gao, F. Lei, C. Xiao and Y. Xie, Acc. Chem. Res., 2015, 48, 3–12 CrossRef CAS PubMed.
- J. H. Kim, J. H. Jeong, N. Kim, R. Joshi and G.-H. Lee, J. Phys. D: Appl. Phys., 2019, 52, 083001 CrossRef.
- C. Zhang, H. Huang, X. Ni, Y. Zhou, L. Kang, W. Jiang, H. Chen, J. Zhong and F. Liu, Nanoscale, 2018, 10, 16759–16764 RSC.
- X. Wan, Y. Huang and Y. Chen, Acc. Chem. Res., 2012, 45, 598–607 CrossRef CAS PubMed.
- Q. Li, Y. Cen, J. Huang, X. Li, H. Zhang, Y. Geng, B. I. Yakobson, Y. Du and X. Tian, Nanoscale Horiz., 2018, 3, 525–531 RSC.
- I. Khalid, M. B. Tahir, M. Sagir, A. Dahshan, M. Alzaid and H. Alrobei, Opt. Quantum Electron., 2023, 55, 21 CrossRef CAS.
- X. Wu, Y. Xing, D. Pierce and J. X. Zhao, ACS Appl. Mater. Interfaces, 2017, 9, 37962–37971 CrossRef CAS PubMed.
- V. S. Bhati, M. Kumar and R. Banerjee, J. Mater. Chem. C, 2021, 9, 8776–8808 RSC.
- R. K. Upadhyay, N. Soin and S. S. Roy, RSC Adv., 2014, 4, 3823–3851 RSC.
- B. Balan, M. M. Xavier and S. Mathew, ACS Omega, 2023, 8, 25649–25673 CrossRef CAS PubMed.
- G. Zhang, D. Chen and J. Lu, Sep. Purif. Technol., 2023, 307, 122833 CrossRef CAS.
- H. Shen, Y. An, Q. Man, J. Wang, C. Liu, B. Xi, S. Xiong, J. Feng and Y. Qian, Chem. Eng. J., 2023, 454, 140136 CrossRef CAS.
- K. Krishnamoorthy, P. Pazhamalai and S.-J. Kim, Energy Environ. Sci., 2018, 11, 1595–1602 RSC.
- C. Jia, F. Zhang, N. Zhang, Q. Li, X. He, J. Sun, R. Jiang, Z. Lei and Z.-H. Liu, ACS Nano, 2023, 17, 1713–1722 CrossRef CAS PubMed.
- K. Krishnamoorthy, P. Pazhamalai, V. K. Mariappan, S. S. Nardekar, S. Sahoo and S. J. Kim, Nat. Commun., 2020, 11, 1–11 CrossRef PubMed.
- R. Gao, J. Tang, X. Yu, S. Lin, K. Zhang and L. Qin, Adv. Funct. Mater., 2020, 30, 2002200 CrossRef CAS.
- R. Ramachandran, X. Leng, C. Zhao, Z. X. Xu and F. Wang, Appl. Mater. Today, 2020, 18, 100477 CrossRef.
- H. Nakano, M. Ishii and H. Nakamura, Chem. Commun., 2005, 2, 2945–2947 RSC.
- C. Chen, H. Tian, Z. Fu, X. Cui, F. Kong, G. Meng, Y. Chen, F. Qi, Z. Chang, L. Zhu, H. Huang, B. Y. Xia and J. Shi, Appl. Catal., B, 2022, 304, 121008 CrossRef CAS.
- Q. Chen, C. Du, Y. Yang, Q. Shen, J. Qin, M. Hong, X. Zhang and J. Chen, Mater. Today Phys., 2023, 30, 100931 CrossRef CAS.
- N.-D. Huynh, J. Jana, R. Nivetha, T. Van Phuc, J. S. Chung and S. H. Hur, Curr. Appl. Phys., 2022, 44, 102–109 CrossRef.
- X. Yan, W. Sun, L. Fan, P. N. Duchesne, W. Wang, C. Kübel, D. Wang, S. G. H. Kumar, Y. F. Li, A. Tavasoli, T. E. Wood, D. L. H. Hung, L. Wan, L. Wang, R. Song, J. Guo, I. Gourevich, A. A. Jelle, J. Lu, R. Li, B. D. Hatton and G. A. Ozin, Nat. Commun., 2019, 10, 2608 CrossRef PubMed.
- Y. Hadouch, S. Ben Moumen, H. Mezzourh, D. Mezzane, M. Amjoud, B. Asbani, A. G. Razumnaya, Y. Gagou, B. Rožič, Z. Kutnjak and M. El Marssi, J. Mater. Sci.: Mater. Electron., 2022, 33, 2067–2079 CrossRef CAS.
- H. Borkar, V. N. Singh, B. P. Singh, M. Tomar, V. Gupta and A. Kumar, RSC Adv., 2014, 4, 22840–22847 RSC.
- A. Nayad, Y. Hadouch, K. Khaldoune, M. Rafya, B. Dikici, A. Mehdi, M. Alga, L. El Firdoussi and M. A. Ali, Silicon, 2024, 16, 189–202 CrossRef CAS.
- G. Bisht and S. Rayamajhi, Nanobiomedicine, 2016, 3, 9 CrossRef PubMed.
- L. El Faroudi, L. Saadi, A. Barakat, M. Mansori, K. Abdelouahdi and A. Solhy, ACS Omega, 2023, 8, 24952–24963 CrossRef CAS PubMed.
- M. Belghiti, K. Tanji, L. El Mersly, I. Lamsayety, K. Ouzaouit, H. Faqir, I. Benzakour, S. Rafqah and A. Outzourhit, React. Kinet., Mech. Catal., 2022, 135, 2265–2278 CrossRef CAS.
- S. K. Hnawi, A. Nayad, H. Aitdads, A. Agdad, M. Afqir, L. Nkhaili, L. El Firdoussi, A. Oueriagli and M. A. Ali, J. Sol. Energy Eng., 2021, 143, 021006 CrossRef CAS.
- A. Wibowo, M. A. Marsudi, M. I. Amal, M. B. Ananda, R. Stephanie, H. Ardy and L. J. Diguna, RSC Adv., 2020, 10, 42838–42859 RSC.
- A. Yang, Y. Qiu, D. Yang, K. Lin and S. Guo, RSC Adv., 2021, 11, 3363–3370 RSC.
- L. Xu, Y.-L. Hu, C. Pelligra, C.-H. Chen, L. Jin, H. Huang, S. Sithambaram, M. Aindow, R. Joesten and S. L. Suib, Chem. Mater., 2009, 21, 2875–2885 CrossRef CAS.
- C.-M. Wu, J. Baltrusaitis, E. G. Gillan and V. H. Grassian, J. Phys. Chem. C, 2011, 115, 10164–10172 CrossRef CAS.
- L. Tang, X.-B. Bao, H. Zhou and A.-H. Yuan, Phys. E, 2008, 40, 924–928 CrossRef CAS.
- R. Gao, X. Cheng, S. Gao, X. Zhang, Y. Xu, H. Zhao and L. Huo, Appl. Surf. Sci., 2019, 485, 266–273 CrossRef CAS.
- B. Ruqia, K. M. Nam, H. Lee, G. Lee and S.-I. Choi, CrystEngComm, 2017, 19, 1454–1458 RSC.
- M. R. Modaberi, R. Rooydell, S. Brahma, A. A. Akande, B. W. Mwakikunga and C.-P. Liu, Sens. Actuators, B, 2018, 273, 1278–1290 CrossRef CAS.
- F. Meng, G. Zhao and H. Zhang, Nanosci. Nanotechnol. Lett., 2013, 5, 1012–1018 CrossRef CAS.
- G. Ambrožič, S. D. Škapin, M. Žigon and Z. C. Orel, J. Colloid Interface Sci., 2010, 346, 317–323 CrossRef PubMed.
- Y. Qin and A. R. Kamali, J. Alloys Compd., 2021, 888, 161506 CrossRef CAS.
- U. Seetawan, S. Jugsujinda, T. Seetawan, A. Ratchasin, C. Euvananont, C. Junin, C. Thanachayanont and P. Chainaronk, Mater. Sci. Appl., 2011, 02, 1302–1306 CAS.
- K. Harun, N. A. Salleh, B. Deghfel, M. K. Yaakob and A. A. Mohamad, Results Phys., 2020, 16, 102829 CrossRef.
- S. Britto, S. Joseph and P. Vishnu Kamath, J. Chem. Sci., 2010, 122, 751–756 CrossRef CAS.
- P. Muhammed Shafi and A. Chandra Bose, AIP Adv., 2015, 5, 057137 CrossRef.
- R. Zhang, P.-G. Yin, N. Wang and L. Guo, Solid State Sci., 2009, 11, 865–869 CrossRef CAS.
- E. G. Goh, X. Xu and P. G. McCormick, Scr. Mater., 2014, 78–79, 49–52 CrossRef CAS.
- M. K. Debanath and S. Karmakar, Mater. Lett., 2013, 111, 116–119 CrossRef CAS.
- M. Arshad, M. Meenhaz Ansari, A. S. Ahmed, P. Tripathi, S. S. Z. Ashraf, A. H. Naqvi and A. Azam, J. Lumin., 2015, 161, 275–280 CrossRef CAS.
- M. M. Hassan, W. Khan, A. Azam and A. H. Naqvi, J. Lumin., 2014, 145, 160–166 CrossRef CAS.
- M. Mehedi Hassan, W. Khan, A. Azam and A. H. Naqvi, J. Ind. Eng. Chem., 2015, 21, 283–291 CrossRef CAS.
- M. R. Islam, M. Rahman, S. F. U. Farhad and J. Podder, Surf. Interfaces, 2019, 16, 120–126 CrossRef CAS.
- B. J. Ryan, M. P. Hanrahan, Y. Wang, U. Ramesh, C. K. A. Nyamekye, R. D. Nelson, Z. Liu, C. Huang, B. Whitehead, J. Wang, L. T. Roling, E. A. Smith, A. J. Rossini and M. G. Panthani, Chem. Mater., 2020, 32, 795–804 CrossRef CAS.
- T. Prodromakis and C. Papavassiliou, Appl. Surf. Sci., 2009, 255, 6989–6994 CrossRef CAS.
- M. K. Gupta, N. Sinha, B. K. Singh and B. Kumar, Mater. Lett., 2010, 64, 1825–1828 CrossRef CAS.
- C. Chen, L. Wang, X. Liu, W. Yang, J. Lin, G. Chen and X. Yang, Polymers, 2019, 11, 310 CrossRef PubMed.
- Z. Cai, X. Wang, W. Hong, B. Luo, Q. Zhao and L. Li, J. Am. Ceram. Soc., 2018, 101, 5487–5496 CrossRef CAS.
- C. Zhu, X. Wang, Q. Zhao, Z. Cai, Z. Cen and L. Li, J. Eur. Ceram. Soc., 2019, 39, 1142–1148 CrossRef CAS.
- F. Yan, X. Zhou, X. He, H. Bai, S. Wu, B. Shen and J. Zhai, Nano Energy, 2020, 75, 105012 CrossRef CAS.
- K. Wang, H. Zhu, J. Ouyang, Y. Tian, S. Wang, Q. Li, Y.-Y. Zhao, H. Cheng and X. Zhai, Appl. Surf. Sci., 2022, 581, 152400 CrossRef CAS.
- X. Zhou, G. Xue, Y. Su, H. Luo, Y. Zhang, D. Wang and D. Zhang, Chem. Eng. J., 2023, 458, 141449 CrossRef CAS.
Footnote |
| † Electronic supplementary information (ESI) available. See DOI: https://doi.org/10.1039/d4ra00118d |
| This journal is © The Royal Society of Chemistry 2024 |

