
 Open Access Article
 This Open Access Article is licensed under a Creative Commons Attribution-Non Commercial 3.0 Unported Licence
Stixis scandens leaf extract-loading ZnO nanoparticles for porcine epidemic diarrhea virus (PEDV) treatment
Thi Thu Huong Le a,
Thi Tam Thanb,
Thi Ngọc Ha Laic and
Van Phan Le*c
a,
Thi Tam Thanb,
Thi Ngọc Ha Laic and
Van Phan Le*c
aFaculty of Natural Resources and Environment, Vietnam National University of Agriculture, Trau Quy, Gia Lam, Hanoi, Vietnam. E-mail: lethithuhuong@vnua.edu.vn
bInstitute of Veterinary Science and Technology, Trau Quy, Gia Lam, Hanoi, Vietnam
cCollege of Veterinary Medicine, Vietnam National University of Agriculture, Hanoi, Vietnam. E-mail: letranphan@vnua.edu.vn
First published on 14th March 2024
Abstract
Porcine epidemic diarrhea (PED) is one of the diseases that causes great losses for livestock farmers. Because vaccines against the disease are not very effective, there is a great demand for biological products with effective resistance to PED virus (PEDV). One of the most important trends today is the use of active ingredients from nature in animal husbandry. This study aimed to create an effective agent against PEDV from the extract of Stixis scandens, which has been shown to inhibit PEDV. The aqueous (denoted as TCN) and ethanolic extracts (denoted as TCC) of Stixis scandens leaves were first prepared and then qualitatively analyzed for their chemical compositions. The TCN was used to synthesize ZnO nanoparticles (NPs) at various sizes from 20 to 120 nm. Subsequently, TCC was loaded on ZnO NPs to form ZnO-extract nanoformulations with an extract loading content of 5.8–7.6%. Total polyphenols (TP) and total alkaloids (TA) in TCC were 38.51 ± 0.25 μg GAE per mg and 22.37 ± 0.41 μg AtrE per mg, respectively. TP was less loaded but more released from the nanoformulations than TA. The A1T nanoformulation, containing only 7.6% extract, had a minimum PEDV inhibitory concentration of 3.9 μg mL−1, which was comparable to that of TCC. The experiments confirmed that the nanoformulations are promising for PEDV inhibition applications.
1. Introduction
Porcine epidemic diarrhea (PED), caused by a virus, is one of the most important diseases in the swine industry. PEDV is a positive-sense single-stranded RNA virus, belonging to the Coronavirinae family.1 This family of viruses causes a variety of diseases in mammals and birds, from enteritis in cows and pigs to upper respiratory disease in chickens and fatal human respiratory infections, such as severe acute respiratory syndrome (SARS), Middle East Respiratory Syndrome (MERS) and Covid-19 (SARS-CoV-2).2 PEDV can cause severe watery diarrhea and subsequent dehydration in pigs of all ages and high mortality in 7–10 day-old piglets. Although several vaccines have been used to prevent PEDV such as live attenuated vaccines, recombinant vector vaccines, DNA vaccines, and subunit vaccines… it is still not possible to prevent outbreaks of PEDs, due to these types of vaccines which are generally not very effective.3 Therefore, there is a great need for antiviral biological products for disease prevention and treatment. Some previous studies have discovered many compounds with anti-PEDV properties such as 2-deoxy-D-glucose,4 glycyrrhizin,5 and surfactin.6 However, there is currently no effective commercial drug to control PEDV infection.Natural products have long been widely studied as antiviral agents.7 Recently, research on substances with natural antiviral activity against PEDV has received great attention. For example, tomatidine, a steroid alkaloid extracted from tomato peels and leaves, showed significant inhibition of PEDV replication in Vero and IPEC-J2 cells in vitro. It was found that the mechanism of inhibition of PEDV by tomatidine is that tomatidine inhibits PEDV replication mainly through the 3CL protease. In addition, tomatidine has in vitro antiviral activity against transmissible gastroenteritis virus (TGEV), porcine reproductive and respiratory syndrome virus (PRRSV), encephalomyocarditis virus (EMCV), and seneca virus A (SVA).2 In another study, an aqueous extract of Moringa (M. oleifera) leaves was able to inhibit PEDV infection during its replication phase in vitro. In addition, M. oleifera extract inhibits PEDV infection by preventing oxidative stress and apoptosis caused by PEDV infection.8 Aloe extract at a concentration of 16 mg mL−1 could inhibit the replication of PEDV in vitro and cause inhibition at the late stage of the virus's life cycle. Aloe vera extract at a concentration of 100 mg per kg body weight, which is relatively safe in mice, can reduce viral load and pathological changes in the intestinal tract of pigs and protect piglets from experimental toxicity with the PEDV GDS01 strain.9 In a previous study, many Vietnamese medicinal plants were screened and the ethanolic extract of Stixis scandens leaves was determined to be the most effective anti-PEDV agent compared to other extracts.10
Stixis scandens, also known as Stixis elongata Pierre, belongs to the Capparidaceae family and is used by people to treat tendon and bone pain, and rheumatism, and the leaves are used to treat eye diseases.11 As far as we know, the chemical composition of this plant has been studied quite limited. A 2023 publication showed two new N-containing glycoside compounds in the composition of Stixis scandens leaves.12 A similar plant, Stixis suaveolens Roxb, in the same family, has been studied for some of its chemical components.13 From the Stixis suaveolens Roxb plant, Vietnamese scientists have developed a method to extract the compound Cappariloside A.14 The compound which belongs to the alkaloid group has been shown to have the ability to fight many viruses, including influenza viruses H1N1 and H3N2, PIV3, and ADV.15
Although plant extracts can inhibit the growth of viruses, their effectiveness depends on the concentration of the active compounds. Since these compounds also have anti-nutritional properties, the level of plant extracts included in the animal's diet is limited because otherwise feed intake or nutrient digestibility may be affected or decreased.16 In addition, in the above in vivo test, although aloe vera extract showed resistance to PEDV, at high concentrations, the extract could increase blood viscosity and cause mild diarrhea in piglets.9 Therefore, it is essential to improve the effectiveness and reduce the dosage of plant extracts for PEDV treatment applications.
Developing nanoformulations of medicinal substances from plants is a potential trend in the treatment of many virus diseases.17 There are various nanoformulations used as antiviral drug delivery vehicles such as lipid nanosystems, polymer nanosystems, lipid–polymer nanosystems, carbon nanocomposites, metal nano/inorganic metal oxides…,18 among which nano ZnO nanoformulations show much potential.
Zinc oxide ZnO has long been used as an agent to reduce diarrhea in piglets. In a study on the effects of ZnO on PEDV-infected piglets, the results showed that using ZnO at a dose of 100 mg per kg body could improve growth performance, intestinal redox status, and intestinal morphology state, function and reduce diarrhea in PEDV-infected piglets. ZnO can exert antiviral and anti-inflammatory effects on PEDV-infected piglets by regulating neutrophil degranulation. However, this study used non-nano-sized ZnO particles.19 Nutritionally, nano-sized Zn supplements have higher bioavailability in animals than micro-sized Zn, allowing more interactions to occur in the intestine and better absorption.20 Using nano Zn in pig diets can reduce the amount of Zn needed by up to 60% without losing the effect on the intestinal microbiota.21 ZnO nanoparticles are able to inhibit many viruses such as H1N1,22,23 HSV-1 (ZnO-PEG nanoparticles at a concentration of 200 μg mL−1 reduce the virus titer by 2.5 log![[thin space (1/6-em)]](https://www.rsc.org/images/entities/char_2009.gif) 10 TCID50, and reduce by 92% DNA copy of this virus)24 or ZnO nanoparticles synthesized using Plumbago indica L. plant extract with CC50 (50% cell cytotoxic concentration) and IC50 equal to 43.96 ± 1.39 and 23.17 ± 2.29 μg mL−1.25 In 2023, chiral ZnO nanoparticles were also investigated for their antiviral activity.26 In the study, L-ZnO nanoparticles showed higher antiviral activity against porcine reproductive and respiratory syndrome virus (PRRSV) than D-ZnO and DL-ZnO. Recently, many publications have shown the potential of nano ZnO in inhibiting SARS-CoV-2. For example, PEGylated ZnO nanoparticles have IC50 = 526 ng mL−1; CC50/IC50 ≤ 1.27 ZnO nanoparticles synthesized with different phenolics were predicted in silico models to be able to inhibit SARS-CoV-2.28 In a review study published in 2022, the authors presented the antiviral mechanisms of ZnO nanoparticles and also confirmed the supply of Zn, an essential trace element, especially in the form of nano helps support the prevention and treatment of Covid-19.29 ZnO nanoparticles (30–60 nm) inactivated the Delta and Omicron SARS-CoV-2 with a stronger effect than larger ZnO nanoparticles.30 For PEDV, we only found one summary report showing that ZnO can inactivate PEDV, but does not destroy this virus particle.31 In this study, ethanolic and aqueous extracts were prepared from the leaves of Stixis scandens, and their chemical compositions were determined. Moreover, it is the first time that both aqueous and ethanolic extracts of Stixis scandens leaves were used for the synthesis of ZnO nanoformulations for the treatment of PEDV.
10 TCID50, and reduce by 92% DNA copy of this virus)24 or ZnO nanoparticles synthesized using Plumbago indica L. plant extract with CC50 (50% cell cytotoxic concentration) and IC50 equal to 43.96 ± 1.39 and 23.17 ± 2.29 μg mL−1.25 In 2023, chiral ZnO nanoparticles were also investigated for their antiviral activity.26 In the study, L-ZnO nanoparticles showed higher antiviral activity against porcine reproductive and respiratory syndrome virus (PRRSV) than D-ZnO and DL-ZnO. Recently, many publications have shown the potential of nano ZnO in inhibiting SARS-CoV-2. For example, PEGylated ZnO nanoparticles have IC50 = 526 ng mL−1; CC50/IC50 ≤ 1.27 ZnO nanoparticles synthesized with different phenolics were predicted in silico models to be able to inhibit SARS-CoV-2.28 In a review study published in 2022, the authors presented the antiviral mechanisms of ZnO nanoparticles and also confirmed the supply of Zn, an essential trace element, especially in the form of nano helps support the prevention and treatment of Covid-19.29 ZnO nanoparticles (30–60 nm) inactivated the Delta and Omicron SARS-CoV-2 with a stronger effect than larger ZnO nanoparticles.30 For PEDV, we only found one summary report showing that ZnO can inactivate PEDV, but does not destroy this virus particle.31 In this study, ethanolic and aqueous extracts were prepared from the leaves of Stixis scandens, and their chemical compositions were determined. Moreover, it is the first time that both aqueous and ethanolic extracts of Stixis scandens leaves were used for the synthesis of ZnO nanoformulations for the treatment of PEDV.
2. Experimental
2.1. Materials
The leaves of Stixis scandens were collected in Vu Quang, Ha Tinh, Vietnam and the scientific name of the plant was identified at the Vietnam National Museum of Nature. The leaves were washed and dried at 40 °C for 24 h, then finely ground and stored in an airtight container.The chemicals used include: food alcohol (96°), distilled water, atropine sulfate standard, bromocresol green, gallic acid standard, Folin-Ciocâlteu reagent, Zn(CH3COO)2·2H2O, and other commonly used chemicals were of analytical grade, and were used directly without refining.
2.2. Research methods
Phenolic compounds were determined by the FeCl3 test. Mix 1.0 mL of TCN or TCC and 1.0 mL of 0.1 M FeCl3 solution. The change in color of the solution indicates the presence of polyphenol compounds.
Saponins were tested by foaming test and Fehling test. 0.5 mL of TCC or TCN was diluted with 2.0 mL distilled water and stirred vigorously in a test tube. The presence of saponins is recognized by the stable foams that are formed. Fehling reagent was prepared by mixing 1.0 mL of 1 M CuSO4; 1.0 mL 2 M NaOH and 1.0 mL 10% sodium-potassium tartrate solution. Fehling reagent was added to 1.0 mL of TCC or TCN and the mixture was then heated. The presence of saponins was further confirmed by a red precipitate.
Alkaloids were detected using the Dragendorff reagent. Dragendorff reagent was synthesized by reacting 5% excess KI solution and Bi(NO3)3 solution in an acidic medium. TCN and TCC were dotted on silica gel plates, which were dipped in Dragendorff reagent solution, and alkaloids were identified by the orange color appearing at the extraction site.
For the determination of glycosides, 1.0 mL of acetic acid and 1.0 mL of chloroform were mixed with 1.0 mL of TCN or TCC. The mixture was placed in a beaker of ice before adding concentrated H2SO4. The appearance of the green color of the solution indicates the presence of glycosides in the extract.
Trim–Hill reagent (acetic acid – 0.2% CuSO4 – concentrated HCl, 10:1:0.5) was used for the determination of iridoids. 0.5 mL of TCC or TCN was added to 4 mL of Trim–Hill agent and mixed well. The blue color shows the presence of iridoids.
The presence of flavonoids in the extract was used by the reaction of TCC or TCN with a mixture of 1 mL of 5% NaNO2, 1 mL of 10% Al(NO3)3, and 10 mL of 4% NaOH solution. The yellow color confirms the presence of flavonoids.
2.2.3.1. Determination of TP based on gallic acid standard substance. Gallic acid was diluted in water to a stock solution of 200 μg mL−1 and prepared into a standard series of concentrations of 20, 40, 60, 80, and 100 μg mL−1. Folin-Ciocâlteu reagent was diluted 10 times. Take 0.5 mL of gallic acid standard solution, add 2.5 mL of diluted Folin-Ciocâlteu reagent, and add 2 mL of 7.5% Na2CO3 solution. The solution was allowed to stand for 2 h, and then the UV-Vis spectra of the standard series were recorded to determine the maximum absorption wavelength and to establish the gallic acid standard curve.
The TP content in TCC and TCN was determined in a similar way to the standard series measurement, where 0.5 mL of the standard solution was replaced by 0.5 mL of TCC or TCN solution (TCC: 1.2 mg mL−1 ethanol, TCN: 1 mg mL−1 water). The TP content in the extract was then calculated from the calibration curve and expressed as gallic acid equivalent (GAE).
2.2.3.2. Determination of TA based on atropine standard. Accurately weigh 10.8 mg of atropine sulfate ((C17H24NO3)2SO4·H2O M = 694.8 g mol−1), dissolve in 50 mL distilled water to obtain atropine stock standard solution (C17H23NO3 M = 289 g mol−1) 180 μg mL−1. Atropine standard series with concentrations of 5, 9, 18, 27, 36 μg mL−1 were prepared from the atropine standard solution.
Prepare a solution of bromocresol green with a concentration of 1 mmol l−1 in an alkaline environment (NaOH). Prepare 0.1 M NaH2PO4 buffer (pH = 4.7). Take 3 mL of atropine standard solution, add 5 mL of bromocresol green solution, 5 mL of phosphate buffer, and 5 mL of chloroform to the separatory funnel, shake vigorously for 2 min, and take the soluble yellow atropine-bromocresol green complex solution in chloroform. This solution was subjected to UV-Vis spectroscopy to construct the atropine calibration curve.
The TA content in TCC was determined as follows: 3 mL TCC solution (6 mg mL−1) was completely evaporated to remove the ethanol, the remaining extract was dissolved in 2 M HCl, and the precipitate was filtered off. The solution was neutralized with NaOH and transferred to a separatory funnel. 5 mL of bromocresol green, 5 mL of phosphate buffer, and 5 mL of chloroform were added, shaken vigorously for 2 min, and the yellow complex solution dissolved in chloroform was collected. This solution was subjected to UV-Vis spectroscopy to determine TA using the calibration curve. The TA content or concentration is expressed as atropine equivalent (AtrE).
| Volume of TCN | Calcination temp | ||
|---|---|---|---|
| 600 °C | 500 °C | 400 °C | |
| 10 mL | A1 | B1 | C1 |
| 20 mL | A2 | B2 | C2 |
| 30 mL | A3 | B3 | C3 |
The extract content in the nanoformulation (% loading content – % LC) and the encapsulation efficiency of the nanoformulation (% encapsulation efficiency – % EE) were determined based on the TP and TA content in the sample. A weighted sample (about 10 mg) of the lyophilized ZnO-extract nanoformulation was immersed in 5 mL of food-grade ethanol for 30 min to release all the extract from the nanoformulation. The solution was centrifuged at 4500 rpm for 10 min. The supernatant was aspirated with a pipette and analyzed for TP and TA according to the method in Section 2.2.3. % EL and % EE are calculated according to eqn (1) and (2), respectively.
| % LC = (mass of extract contained in the nanoformulation)/(the nanoformulation) × 100% | (1) |
| % EE = (mass of extract contained in the nanoformulation)/(mass of the initial extract) × 100% | (2) |
The release of the active substance from the nanoparticles was determined in isotonic phosphate buffer (PBS) pH 7.4. The nanoformulation solution (5 mL) was transferred to a dialysis bag (MWCO 6–8 kDa). The sealed dialysate bag is dipped in 20 mL of PBS buffer pH 7.4. The release experiment was performed at 38.5 °C (normal body temperature of pigs) and shaken at 100 rpm. At the specified times, 2 mL of release medium was withdrawn and immediately replaced with 2 mL of fresh PBS. The collected samples were analyzed for TP and TA content.
In the next steps, the MNTC of samples was used as the starting concentration for the PEDV treatment test. Serial two-fold dilutions of the samples were prepared in DMEM and then mixed with an equal volume of PED virus solution (400 TCID50/100 μl). The virus-sample mixture was incubated at 37 °C for 30 min and then added to Vero cells previously cultured in a 96-well plate (200 μl per well) (or 100 μl virus solution per well). Each sample dilution was tested in three wells and the experiments were performed in duplicate. The plate was then incubated at 37 °C in 5% CO2 for 5 days. Untreated Vero cells infected and uninfected with PEDV, respectively, were used as controls. The cytopathic effect was monitored daily. The antiviral activity of the samples was evaluated based on the inhibition of the cytopathic effect of the virus. The minimum inhibitory concentration (MIC) was determined as the minimum concentration of the sample at which the cells grew normally in the presence of the virus.
3. Results and discussion
3.1. The qualitative and quantitative composition of the extract
Fig. 1 shows the fresh and dried parts of the plant Stixis scandens L. From 100 g of powdered leaves of S. scandens, 12.0 g of TCC dry extract or 15.3 g of TCN dry extract was obtained. The results of the qualitative component analysis of TCC and TCN are presented in Fig. 2.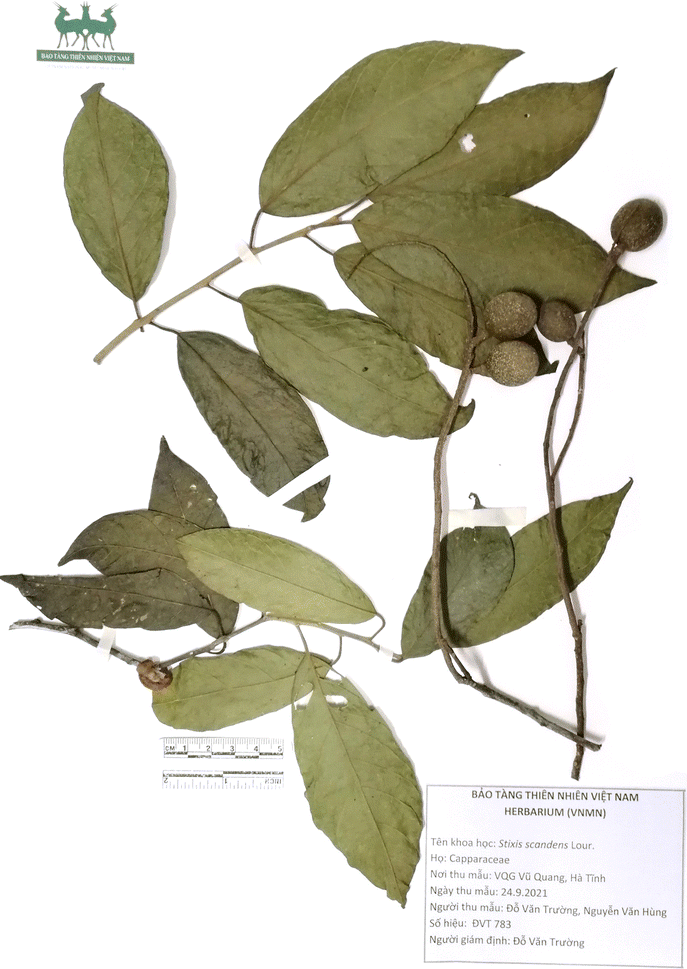 | ||
| Fig. 1 Stixis scandens L. plant collected at Vu Quang, Ha Tinh, Vietnam. | ||
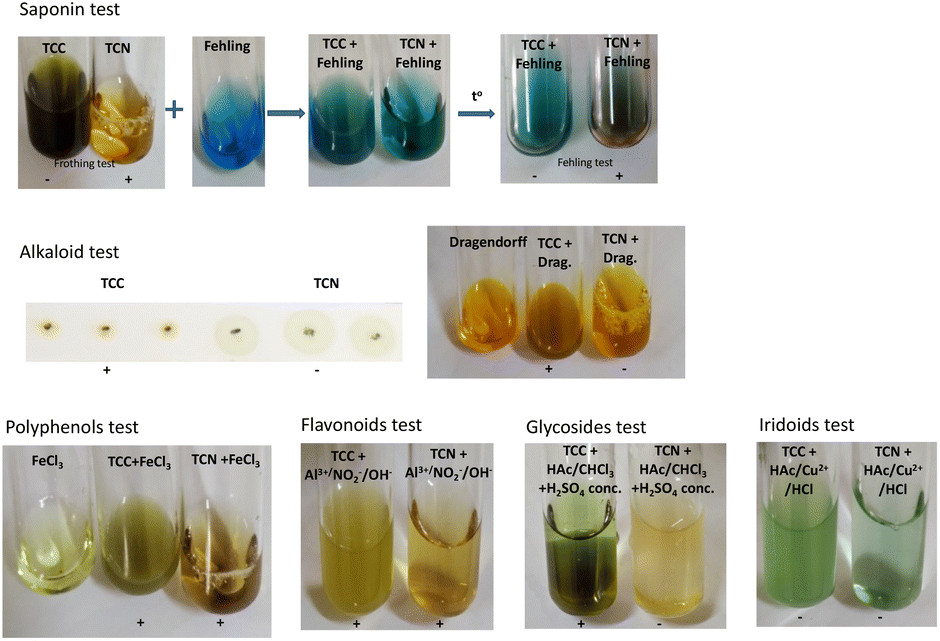 | ||
| Fig. 2 Qualitative analysis of chemical compositions of aqueous and ethanolic extracts. | ||
As shown in Fig. 2, the ethanol extract (TCC) of S. scandens contained alkaloids, polyphenols, flavonoids, and glycosides while saponin, polyphenols, and flavonoids were found in the aqueous extract (TCN). Iridoids were not found in either extract.
Total polyphenols (TP) was determined in TCC and TCN and total alkaloids (TA) was estimated in TCC by UV-Vis methods. The calibration curves for the polyphenol standard (gallic acid) and the alkaloid standard (atropine) are shown in Fig. 3.
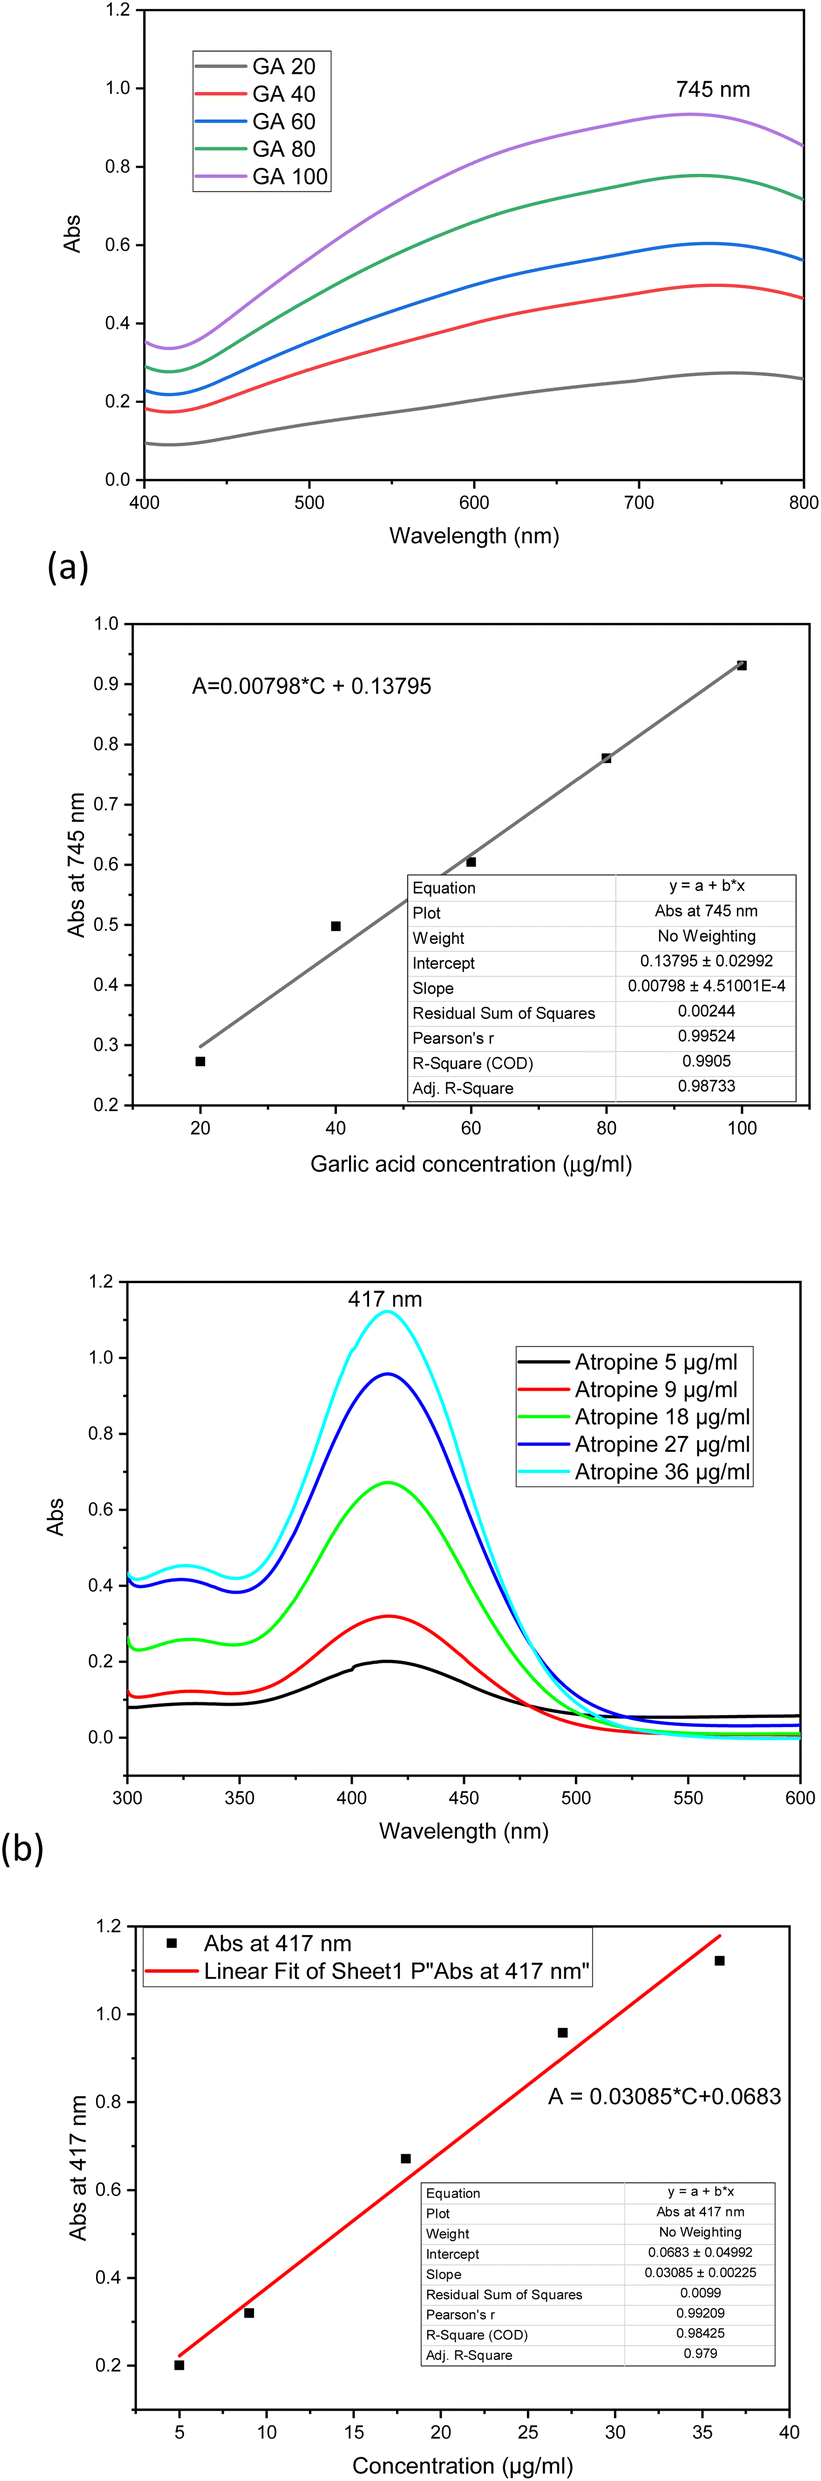 | ||
| Fig. 3 UV-Vis spectra and calibration curves of TP as gallic acid (a) and TA as atropine (b). | ||
The TP content was determined to be 56.94 ± 0.46 μg GAE per mg dried TCN and 38.51 ± 0.25 μg GAE per mg dried TCC. The TA content was 22.37 ± 0.41 μg AtrE per mg in dried TCC.
3.2. ZnO nanoparticles
FESEM images, UV-Vis spectra, and XRD patterns of ZnO nanoparticles are shown in Fig. 4. As summarized in Table 2, the differences in synthesis conditions lead to different sizes of the obtained ZnO nanoparticles determined by the FESEM method. In general, the higher calcination temperature resulted in larger particles. This result is consistent with other previous observations.35 | ||
| Fig. 4 FESEM images (a), UV-Vis spectra (b), Tauc's plots (c), XRD patterns (d), and Williamson–Hall plots (e) of ZnO nanoparticles. | ||
| Sample | FESEM | UV-Vis | XRD | |||||
|---|---|---|---|---|---|---|---|---|
| D (nm) | lmax (nm) | Band gap (eV) | Scherrer method | W–H method | ||||
| D (nm) | ε |
|
R2 | D (nm) | ||||
| A1 | 60–90 | 381 | 2.15 | 34.0 | 0.0014 | 0.00414 | 0.9718 | 33.5 |
| A2 | 60–120 | 383 | 2.0 | 28.6 | 0.0025 | 0.00473 | 0.9807 | 29.3 |
| A3 | 30–120 | 376 | 1.8 | 32.6 | 0.0022 | 0.00459 | 0.9790 | 30.2 |
| B1 | 30–90 | 375 | 2.65 | 33.9 | 0.0015 | 0.00444 | 0.9079 | 31.2 |
| B2 | 30–90 | 378 | 2.2 | 26.3 | 0.0025 | 0.00425 | 0.9875 | 32.6 |
| B3 | 40–60 | 384 | 2.3 | 28.7 | 0.0019 | 0.00490 | 0.9788 | 28.3 |
| C1 | 20–60 | 380 | 2.35 | 30.5 | 0.0015 | 0.00446 | 0.9402 | 31.2 |
| C2 | 20–40 | 376 | 2.15 | 24.0 | 0.0029 | 0.00531 | 0.9849 | 26.1 |
| C3 | 30–50 | 375 | 2.1 | 22.9 | 0.0026 | 0.00592 | 0.9919 | 23.4 |
All the samples absorb at the maximum wavelength from 375 to 384 nm confirming the formation of hexagonal wurtzite ZnO NPs in the samples. The absorptions are assigned to the transition of the electrons in the ZnO structures.36 The band gap energy of the ZnO NPs was determined by taking the linear part of (αhν)2 versus hν plot. While the amount of TCN solution used in the ZnO synthesis process shows no clear effect on the change in the size and shape of the ZnO-NPs (in the FESEM images), increasing the amount of TCN seems to decrease the band gap of the samples at the same temperature (A, B or C series). In a recent report, the author used Citrus microcarpa extract at different concentrations of 1%, 2%, and 4% (w/v) to synthesize ZnO NPs. The results showed that the band gap values of the synthesized ZnO NPs decreased with increasing extract concentration.37
In the XRD patterns of all samples, the typical peaks appear at 2θ of 31.75°, 34.41°, 36.23°, 47.53°, 56.58°, 62.84°, 66.61°, 68.32° and 69.12° corresponding to the (100), (002), (011), (102), (110), (103), (200), (112) and (201) of the hexagonal wurtzite crystal structure of ZnO NPs.36,38 Furthermore, no strange peaks are present in the patterns. This confirms that the ZnO NPs were successfully synthesized in crystalline form. The average particle size of the ZnO crystals was calculated by the Scherrer method using eqn (3) and the Williamson–Hall (W–H) plot method using eqn (4) (ref. 39) and presented in Table 2.
 | (3) |
 | (4) |
The XRD data are rather well-fitted to the linear model between βcosθ and 4sinθ in the W–H equation (R2 > 0.90). The crystallite sizes of the samples calculated by the W–H method are in good agreement with those calculated by the Scherrer method. The slight difference in the average crystallite size calculated with the two equations is due to the different averaging of the particle size distribution.39
The Raman spectra of the samples were also recorded (Fig. 5a). In the Raman spectra, the E2 phonon mode appears sharply at about 435 cm−1. This mode is typical for the hexagonal wurtzite structure of ZnO NPs. The higher intensity of the E2 mode of the A and B series compared to that of the C series is related to the larger particle size of these samples.40,41 Another strong peak appears at about 520 cm−1, which is assigned to the A1 (LA) mode while the peak at 660 cm−1 is assigned to the two phonon vibrational modes of A (LO) and E (low).42
 | ||
| Fig. 5 Raman (a) and photoluminescence spectra (b) of ZnO nanoparticles. | ||
3.3. ZnO-extract nanoformulation
The TCC extract was incorporated into A1, B3, C3 to form 3 nanoformulations of A1T, B3T, and C3T, respectively. The TA and TP contents in the nanoformulations were determined. Based on the TA and TP contents, the LC and EE values of the ethanolic extract in the nanoformulations were also calculated and the results are shown in Table 3. It can be seen that the TP is less loaded to the ZnO NPs than the TA (lower LC and EE). This could be due to the higher solubility of the polyphenols in aqueous environment than that of the alkaloids. The difference in the loading contents of TA and TP may lead to different biological effects. Recently, Kim et al. reported that ZnO NPs in combination with one of two polyphenols (rutin and quercetin) can cause higher cytotoxicity, but in different levels.43 Polyphenols are powerful antioxidants and can inhibit the growth of viruses both in vitro and in vivo, acting on different stages of viral infection. In addition, polyphenols are non-toxic to human and animal cells.44–46 Many alkaloids also exhibit highly specific antiviral activity.47 For example, lycorine, an alkaloid isolated from Narcissus pseudonarcissus, has been shown to have antiviral properties in vitro and can protect AG6 mice from Zika virus-induced death by reducing the viral load in the mice's blood.48 Homoharringtonine, another alkaloid, was found to be resistant to PEDV and reduced viral load and severe symptoms at a dose of 0.5 mg kg−1.49 Therefore, the TA and TP content could confer an antiviral effect on the nanoformulations.| Sample | LC (%) (calculated from TP) | LC (%) (calculated from TA) | EE (%) (calculated from TP) | EE (%) (calculated from TA) | % TP release (pH 7.4 72 h) | % TP release (pH 5 72 h) | % TA release (pH 7.4 72 h) | % TA release (pH 5 72 h) |
|---|---|---|---|---|---|---|---|---|
| A1T | 5.1 ± 0.3 | 6.3 ± 0.4 | 53.7 ± 3.0 | 67.2 ± 4.0 | 85.9 ± 0.6 | 96.0 ± 0.8 | 46.2 ± 0.7 | 76.3 ± 0.5 |
| B3T | 4.5 ± 0.3 | 5.4 ± 0.2 | 47.1 ± 3.0 | 57.1 ± 2.0 | 80.7 ± 0.4 | 91.2 ± 0.6 | 42.9 ± 0.7 | 70.2 ± 0.3 |
| C3T | 4.7 ± 0.2 | 5.7 ± 0.3 | 49.3 ± 2.0 | 60.4 ± 3.0 | 78.3 ± 0.4 | 92.1 ± 0.7 | 44.3 ± 0.7 | 67.4 ± 0.2 |
Fig. 6 shows the properties of the ZnO-extract nanoformulations. In the FESEM images, the surface of the nanoformulations becomes blurrier than that of the ZnO NPs (Fig. 6a), which is due to the coverage by organic compounds in the TCC. We also observed a similar phenomenon in the ZnO nanoformulation with Paederia lanuginosa leaf extract.50 Fig. 6b shows some slight blue shifts appearing in the UV-Vis spectra of A1T, B3T, and C3T compared to TCC at around 665, 620, 545, and 455 nm. This indicates that there is an interaction between the ZnO NPs and the compounds in TCC.
 | ||
| Fig. 6 FESEM images (a), UV-Vis spectra (b), FTIR spectra (c), and TGA and dTG diagram (d) of ZnO-extract nanoformulations. | ||
In Fig. 6c, the O–H stretching appears at 3450 cm−1 while the –C–H stretching can be observed at 2919 cm−1 and 2852 cm−1. The peak at 1429 cm−1 is due to the C–H bending. The peaks at 837 and 872 cm−1 belong to the C![[double bond, length as m-dash]](https://www.rsc.org/images/entities/char_e001.gif) C bending. These peaks in the FTIR spectra confirm the presence of the functional groups of the organic compounds in the nanoformulations. Moreover, the peak at 567 cm−1 is due to the presence of the Zn–O bond. These evidences reveal that the nanoformulations were successfully prepared.25
C bending. These peaks in the FTIR spectra confirm the presence of the functional groups of the organic compounds in the nanoformulations. Moreover, the peak at 567 cm−1 is due to the presence of the Zn–O bond. These evidences reveal that the nanoformulations were successfully prepared.25
Fig. 6d and Table 4 show the results of the TGA analysis. The ZnO nanoformulations underwent weight loss in 2 or 3 steps during the heating process from room temperature to 900 °C. The first step takes place at around 100 °C, which corresponds to weight loss through water evaporation. The second step of the three nanoformulations takes place at 200 to 500 °C and the third step for A1T and B3T at 500 to 900 °C, while no weight loss was observed for C3T from 500 to 900 °C. These steps are the result of the decomposition of the organic matter in the samples.23 In addition, the dTG peaks in the 200–500 °C region of the 3 samples are in different positions in the 3 samples. The differences in the thermal activity of the samples indicate that the nanoformulations were loaded with different compositions of Stixis scandens extract. From the TGA results, it can be calculated that the content of organic compounds in A1T, B3T and C3T is 7.6%, 5.8%, and 6.7%, respectively. This result agrees well with the content calculated using the UV-Vis method (Table 3).
Fig. 7 shows the release profile of A1T in the form of TP and TA at pH 5 and pH 7.4. The percentage release after 72 h for the 3 nanoformulations is shown in Table 3. TP is released faster than TA at both pH values, and the acidic environment (pH 5) favors the release of both TA and TP from the nanoformulations. Similar observations were made when comparing the release of allicin and phyllanthin from their Ag nanoparticles.51 TA is more loaded and less released in the nanoformulations than TP (Table 3), suggesting that TA may contribute more to the biological activities of the nanoformulations than TP. As pointed out in a review article, some alkaloids have EC50 inhibitory concentrations against PEDV of 13.41 ± 1.13 μM, 4.49 ± 0.67 μM, and 6.17 ± 0.50 μM, respectively. Homoharringtonine, another alkaloid—even completely suppressed PEDV infection at a concentration of 500 nM.52 Polyphenols such as EGCG require higher concentrations to inhibit PEDV (EC50 = 83.18 μM).53
 | ||
| Fig. 7 A1T release profile. | ||
Table 5 and Fig. 8 show the results of the cytotoxicity and PEDV treatment experiments. The C3T has higher cytotoxicity on Vero cells (lower MNTC) than B3T and A1T. This could be related to the smaller size of the ZnO NPs in the C3T nanoformulation.54,55 While B3T and C3T show no PEDV inhibitory activity at MNTC, the A1T nanoformulation and the extract alone (TCC) have the same value of MIC of 3.9 (μg mL−1). The extract content in B3T and C3T may not be high enough to inhibit PEDV. However, in the A1T, the extract accounted for only 7.6% of the nanoformulation and has equivalent antiviral activity to 100% extract. This confirms that the nanoformulation improved the antiviral activity of the plant extract. In another study, it was reported that the chitosan–silica nanoformulation of Echinacea purpurea ethanol extract showed better biological effects than the extract alone.47
| TCC | A1T | B3T | C3T | |
|---|---|---|---|---|
| MNTC (μg mL−1) | 31.2 | 15.6 | 15.6 | 7.8 |
| MIC (μg mL−1) | 3.9 | 3.9 | — | — |
 | ||
| Fig. 8 Cytotoxicity results (a), uninfected Vero cells (mocks) (b), Vero cells infected with non-treated PEDV (c), Vero cells infected with 3.9 μg mL−1-A1T-treated PEDV (d), Vero cells infected with 7.8 μg mL−1-C3T-treated PEDV (e). | ||
4. Conclusions
In summary, the preparation and characterization of ZnO NPs with an aqueous extract from the leaves of Stixis scandens was successful. Changing the calcination temperature and the volume ratio between the extract and the Zn precursor resulted in different sizes of ZnO-NP obtained. TCC, the ethanolic extract of Stixis scandens with a TP content of 38.51 ± 0.25 μg GAE per mg and TA content of 22.37 ± 0.41 μg AtrE per mg, was incorporated into the ZnO-NPs to form three nanoformulations of A1T, B3T, and C3T. These nanoformulations contained 5.8–7.6% extract, with TP being less loaded but more released than TP. A1T with the highest extract content showed equivalent PEDV inhibitory activity as the extract alone. Although these results are promising for the development of nanoformulations for the treatment of PEDV, further studies should be conducted to clarify how the nanoformulations inhibit the development of PEDV and which compounds in the extract play a crucial role in the inhibition.Author contributions
L. T. T. H.: conceptualization, funding acquisition, investigation, writing original draft. T. T. T. and L. T. N. H.: investigation, L. V. P.: supervision, methodology, review and editing.Conflicts of interest
There are no conflicts to declare.Acknowledgements
Le Thi Thu Huong was funded by the Postdoctoral Scholarship Programme of Vingroup Innovation Foundation (VINIF), code VINIF.2022.STS.20.References
- V. T. Than, S. E. Choe, T. T. H. Vu, T. D. Do, T. L. Nguyen, T. T. N. Bui, T. N. Mai, R. M. Cha, D. Song, D. J. An and V. P. Le, Vet. Med. Sci., 2020, 6, 535–542 CrossRef CAS PubMed.
- P. Wang, J. Bai, X. Liu, M. Wang, X. Wang and P. Jiang, Vet. Res., 2020, 51, 1–18 CrossRef PubMed.
- Z. Chen, J. Chen, X. Wei, H. Hua, R. Hu, N. Ding, J. Zhang, D. Song, Y. Ye, Y. Tang, Z. Ding and S. Ke, Viruses, 2021, 13, 580 CrossRef PubMed.
- Y. Wang, J. Li, M. Sun, B. Ni, C. Huan, L. Huang, C. Li, H. Fan, X. Ren and X. Mao, Antiviral Res., 2014, 106, 33–41 CrossRef CAS PubMed.
- C.-C. Huan, H.-X. Wang, X.-X. Sheng, R. Wang, X. Wang and X. Mao, Arch. Virol., 2017, 162, 1467–1476 CrossRef CAS PubMed.
- L. Yuan, S. Zhang, Y. Wang, Y. Li, X. Wang and Q. Yang, J. Virol., 2018, 92, e00809–e00818 CAS.
- M. Mukhtar, M. Arshad, M. Ahmad, R. J. Pomerantz, B. Wigdahl and Z. Parveen, Virus Res., 2008, 131, 111–120 CrossRef CAS PubMed.
- Y. Cao, S. Zhang, Y. Huang, S. Zhang, H. Wang and W. Bao, Animals, 2022, 12, 1–13 Search PubMed.
- X. Zhichao, L. Yuan, P. Peng, Y. Liu, M. Huang, Y. Ma, C. Xue and Y. Cao, Vet. Microbiol., 2020, 249, 108849 CrossRef PubMed.
- T. B. N. Trinh, D. H. Le, T. T. K. Nguyen, V. T. Nguyen, M. H. Nguyen, M. Muller, H. T. Pham, V. P. Le and T. K. N. Nguyen, VirusDisease, 2021, 32, 797–803 CrossRef CAS PubMed.
- D. T. Sy, in The 5th Vietnam National Scientific Conference on Ecology and Biological Resources, 2013, pp. 295–300 Search PubMed.
- T. Thi Yen, N. T. Tam, N. Thanh Thi Kim, V. Ngoc Binh, N. Thao Kim Nu and N. Quoc Anh, Nat. Prod. Commun., 2023, 18, 2–7 CrossRef.
- N. Q. Anh, H. D. Thanh, T. T. Yen, D. H. Anh, J. Schmitz Oliver and P. H. Viet, Vietnam J. Chem., 2020, 58, 261–266 CrossRef CAS.
- H. V. Pham, Method for extracting cappariloside a compound from Stixis suaveolens (Roxb.) Pierre (in Vietnamese), Vietnam Utility Patent, 2021, 30079 Search PubMed.
- Z. Li, J. Zhao, H. Zhou, L. Li, Y. Ding, J. Li, B. Zhou, H. Jiang, N. Zhong, W. Hu and Z. Yang, Life Sci., 2018, 200, 115–125 CrossRef CAS PubMed.
- M. Girard and G. Bee, Animal, 2020, 14, 95–107 CrossRef CAS PubMed.
- C. L. Lim, C. S. Raju, T. Mahboob, S. Kayesth, K. K. Gupta, G. K. Jain, M. Dhobi, M. Nawaz, P. Wilairatana, M. L. Pereira, J. K. Patra, A. K. Paul, M. Rahmatullah and V. Nissapatorn, Nanomaterials, 2022, 12, 238 CrossRef CAS PubMed.
- M. Chakravarty and A. Vora, Drug Deliv. Transl. Res., 2021, 11, 748–787 CrossRef CAS PubMed.
- Q. Zhang, T. Wu, S. Li, Y. Meng, Z. Tan, M. Wu, D. Yi, L. Wang, D. Zhao and Y. Hou, Oxid. Med. Cell. Longevity, 2021, 2021, 3055810 Search PubMed.
- E. K. Hill and J. Li, J. Anim. Sci. Biotechnol., 2017, 1–13 CAS.
- C. Wang, L. Zhang, W. Su, Z. Ying, J. He, L. Zhang, X. Zhong and T. Wang, PLoS One, 2017, 12, 1–14 CAS.
- N. Rabiee, M. Bagherzadeh, A. M. Ghadiri, M. Kiani, A. Aldhaher, S. Ramakrishna, M. Tahriri, L. Tayebi and T. J. Webster, J. Biomed. Nanotechnol., 2020, 16, 456–466 CrossRef CAS PubMed.
- H. Ghaffari, A. Tavakoli, A. Moradi, A. Tabarraei, F. Bokharaei-Salim, M. Zahmatkeshan, M. Farahmand, D. Javanmard, S. J. Kiani, M. Esghaei, V. Pirhajati-Mahabadi, A. Ataei-Pirkooh and S. H. Monavari, J. Biomed. Sci., 2019, 26, 1–10 CrossRef CAS PubMed.
- A. Tavakoli, A. Ataei-Pirkooh, G. Mm Sadeghi, F. Bokharaei-Salim, P. Sahrapour, S. J. Kiani, M. Moghoofei, M. Farahmand, D. Javanmard and S. H. Monavari, Nanomedicine, 2018, 13, 2675–2690 CrossRef CAS PubMed.
- M. M. Melk, S. S. El-Hawary, F. R. Melek, D. O. Saleh, O. M. Ali, M. A. El Raey and N. M. Selim, Int. J. Nanomed., 2021, 16, 8221–8233 CrossRef CAS PubMed.
- X. Fan, C. Ren, K. Ning, M. A. Shoala, Q. Ke, Y. Zhou, Y. Wu, R. Qiu, J. Liang and S. Xiao, ACS Appl. Mater. Interfaces, 2023, 15, 58251–58259 CrossRef CAS PubMed.
- S. M. El-Megharbel, M. Alsawat, F. A. Al-Salmi and R. Z. Hamza, Coatings, 2021, 11, 388 CrossRef CAS.
- G. H. Attia, Y. S. Moemen, M. Youns, A. M. Ibrahim, R. Abdou and M. A. El Raey, Colloids Surf., B, 2021, 203, 111724 CrossRef CAS PubMed.
- C. G. Rodelo, R. A. Salinas, E. A. JaimeArmenta, S. Armenta, A. G. Martínez, S. E. C. Blum, H. A. Vega, A. N. Grace, C. A. A. Salinas, J. G. Rodelo, G. Christie, W. F. Alsanie, G. Santana, V. K. Thakur and A. Dutt, Coord. Chem. Rev., 2022, 457, 214402 CrossRef PubMed.
- S. Wolfgruber, J. Rieger, O. Cardozo, B. Punz, M. Himly, A. Stingl, P. M. A. Farias, P. M. Abuja and K. Zatloukal, Int. J. Mol. Sci., 2023, 24, 8425 CrossRef CAS PubMed.
- B. Predicala, D. Korber, P. Medihala and A. Alvarado, Can nanoparticles be used to control PEDv?, 2018 Search PubMed.
- T. Ao, J. L. Pierce, A. J. Pescatore, A. H. Cantor, K. A. Dawson, M. J. Ford and M. Paul, Br. Poult. Sci., 2011, 52, 466–471 CrossRef CAS PubMed.
- C. Erdenechimeg, A. Guiqide, B. Dejidmaa, C. Chimedragchaa and S. Purevsuren, Braz. J. Med. Biol. Res., 2017, 50, 6–11 Search PubMed.
- P. Van Tan, Int. J. Biol., 2018, 10, 42 CrossRef.
- A. Kołodziejczak-radzimska and T. Jesionowski, Materials, 2014, 7, 2833–2881 CrossRef PubMed.
- W. Muhammad, N. Ullah, M. Haroon and B. H. Abbasi, RSC Adv., 2019, 9, 29541–29548 RSC.
- A. Villegas-Fuentes, H. E. Garrafa-Gálvez, R. V Quevedo-Robles, M. Luque-Morales, A. R. Vilchis-Nestor and P. A. Luque, J. Mol. Struct., 2023, 1281, 135067 CrossRef CAS.
- M. Jothibas, E. Paulson, A. Mathivanan, S. Srinivasan and K. S. Kannan, Nanotechnol. Environ. Eng., 2023, 8, 511–533 CrossRef CAS.
- P. Bindu and S. Thomas, J. Theor. Appl. Phys., 2014, 8, 123–134 CrossRef.
- G. Xiong, U. Pal and J. G. Serrano, J. Appl. Phys., 2007, 101, 024317 CrossRef.
- S. Jindal, S. M. Giripunje and S. B. Kondawar, Iran. J. Chem. Chem. Eng., 2019, 38, 11–20 CAS.
- B. Hadžić, N. Romčević, D. Sibera, U. Narkiewicz, I. Kuryliszyn-Kudelska, W. Dobrowolski and M. Romčević, J. Phys. Chem. Solids, 2016, 91, 80–85 CrossRef.
- S.-B. Kim, N.-K. Yoo and S.-J. Choi, Nanomater., 2022, 12(19), 3337 CrossRef CAS PubMed.
- S. Nagarajan, Pharmacophore, 2022, 12, 119–130 CrossRef.
- G. Annunziata, M. Sanduzzi Zamparelli, C. Santoro, R. Ciampaglia, M. Stornaiuolo, G. C. Tenore, A. Sanduzzi and E. Novellino, Front. Med., 2020, 7, 1–7 CrossRef PubMed.
- M. F. Montenegro-Landívar, P. Tapia-Quirós, X. Vecino, M. Reig, C. Valderrama, M. Granados, J. L. Cortina and J. Saurina, Sci. Total Environ., 2021, 801, 149719 CrossRef PubMed.
- C.-F. Mao, X.-R. Zhang, A. Johnson, J.-L. He and Z.-L. Kong, BioMed Res. Int., 2018, 2018, 4237354 Search PubMed.
- H. Chen, Z. Lao, J. Xu, Z. Li, H. Long, D. Li, L. Lin, X. Liu, L. Yu, W. Liu, G. Li and J. Wu, Virology, 2020, 546, 88–97 CrossRef CAS PubMed.
- H. J. Dong, Z. H. Wang, W. Meng, C. C. Li, Y. X. Hu, L. Zhou and X. J. Wang, Viruses, 2018, 10, 601 CrossRef CAS PubMed.
- T. T. H. Le, T. B. T. Nguyen, T. H. H. Nguyen, T. T. Ngo and T. T. Chu, Chem. Pap., 2023, 77, 5817–5827 CrossRef CAS.
- K. S. Phan, T. M. Nguyen, X. T. To, T. T. H. Le, T. T. Nguyen, K. D. Pham, P. H. Hoang, T. N. Dong, D. K. Dang, T. H. T. Phan, T. T. T. Mai and P. T. Ha, RSC Adv., 2022, 12, 35730–35743 RSC.
- S. Faisal, S. L. Badshah, B. Kubra, A. H. Emwas and M. Jaremko, Nat. Prod. Bioprospect., 2023, 13, 4 CrossRef CAS PubMed.
- C. Huan, W. Xu, B. Ni, T. Guo, H. Pan, L. Jiang, L. Li, J. Yao and S. Gao, Front. Pharmacol., 2021, 12, 1–10 Search PubMed.
- N. Babayevska, Ł. Przysiecka, I. Iatsunskyi, G. Nowaczyk, M. Jarek, E. Janiszewska and S. Jurga, Sci. Rep., 2022, 12, 1–13 CrossRef PubMed.
- M. Baek, M. K. Kim, H. J. Cho, J. A. Lee, J. Yu, H. E. Chung and S. J. Choi, J. Phys.: Conf. Ser., 2011, 304, 012044 CrossRef.
| This journal is © The Royal Society of Chemistry 2024 |