
 Open Access Article
 This Open Access Article is licensed under a Creative Commons Attribution-Non Commercial 3.0 Unported Licence
Intrinsic dynamic and static natures of APn--X+--BPn σ(3c–4e) type interactions (APn = BPn = N, P, As and Sb; X = H, F, Cl, Br and I) in bicyclo[3.3.3] and bicyclo[4.4.4] systems and their behaviour, elucidated with QTAIM dual functional analysis†
Taro Nishide,
Waro Nakanishi and
Satoko Hayashi*
and
Satoko Hayashi*
Faculty of Systems Engineering, Wakayama University, 930 Sakaedani, Wakayama 640-8510, Japan. E-mail: hayashi3@wakayama-u.ac.jp
First published on 14th February 2024
Abstract
The intrinsic dynamic and static natures of APn--X+--BPn (APn = BPn: N, P, As and Sb; X = H, F, Cl, Br and I) in 1a+–8c+ were elucidated with the quantum theory of atoms-in-molecules dual functional analysis (QTAIM-DFA). Species 1a+–8c+ were formed by incorporating X+ between APn and BPn of APn(CH2CH2CH2)3BPn (1–4) and APn(CH2CH2CH2CH2)3BPn (5–8). The relative stabilities between the symmetric and nonsymmetric structures along with their transition states were investigated. Various natures from typical hydrogen bonds (t-HB) to classical covalent bonds were predicted for the APn–X/BPn–X interactions in APn--X+--BPn with QTAIM-DFA. The secondary interactions of H–H and X–C were also detected. The vdW to molecular complexes through charge transfer natures were predicted for them. Natural bond orbital analysis clarified that the CT terms were caused by not only n(APn)→ σ*(X–BPn) but also σ(APn–C)→σ*(X–BPn), σ(APn–C/BPn–C)→np(X+) and n(X)→ns(Pn+). The direction and magnitude of the p-character of n(APn) were the factors that determined the types of donor–acceptor interactions. Estimating the order of the interaction strengths was attempted. The σ(3c–4e) characters of APn--X+--BPn were also examined by analysing the charge distributions on APn--X+--BPn. These results would provide fundamentally important insight into designing molecules with high functionality containing X+ in symmetric and nonsymmetric structures.
Introduction
Chemical bonds and interactions are the most important concepts in chemical and biological sciences. Intrinsic dynamic and static natures of various types of chemical bonds and interactions have been elucidated with the quantum theory of atoms-in-molecules dual functional analysis (QTAIM-DFA).1–4 Hydrogen bonds5 and chalcogen bonds6 are the typical examples of such interactions. What are the natures of the noncovalent interactions, that play a highly important role in the biological systems, such as enzymes? The next target of our project is to elucidate the natures of such interactions, that play a highly important role in the biological species, by applying QTAIM-DFA. It is well known that conformations of the reaction sites, in highly efficient enzymatic reactions, for example, are highly controlled. It is necessary to accumulate fundamental knowledge on the behavior of such interactions under the conditions, to achieve the above goal. The natures of the interactions in cage compounds, called atranes, are investigated, as a first stage of our investigations.Many cage compounds have been prepared, so far, and they play an important role in chemistry.7,8 Bicyclo[3.3.3]undecane (I) and bicyclo[4.4.4]tetradecane (II) provide typical types of the frameworks. The bridgehead carbon distances in I and II are considered to be the medium size. The original interactions between the methine groups in I and II would be negligibly small. However, if the methine groups are replaced by A and A′ of the main group atoms or the derivatives in the neutral and charged forms, the A⋯A′ interactions become much stronger. The A⋯A′ interactions make it possible to investigate the natures of the interactions in more detail. The interactions would consist of the repulsive and/or attractive terms. The A⋯A′ interactions change greatly the energy profiles around the interactions relative to the original cases. The changes have profound effects not only on the fine details of the structures but also on the natures of the interactions, which are to be elucidated.
Among a lot of such species,9–13 the research group of Kawashima demonstrated that 1-hydro-5-carbaphosphatrane and 1-hydro-6-carbaphosphatrane could form an “anti-apicophilic” arrangement.14–17 Thus, the skeletons of I and II could supply the diverse electronic structures and have unique functionalities, such as superbase,18–20 catalysis21–23 and biological activity.24–27 Alder and coworkers synthesized various derivatives of I and II and related species.9,11,28–31 1,5-Diazabicyclo[3.3.3]undecane (1)28 and 1,6-diazabicyclo[4.4.4]tetradecane (5)29 are the typical examples. They reported protonation in cages of various sizes.32–36 Much attention has been paid to prepare the species with the interactions of the so-called proton sponges and to clarify the properties. While 5 could contain a proton in the cage to form a [N--H--N]+ bond, N is protonated from outside the cage in 1. However, Alder mentioned that 1 containing a proton in the cage could potentially be kinetically persistent if once formed.34
Recently, molecular designs to form [N⋯F–N]+ were theoretically proposed by using the skeletons of 1 and 5,37 in addition to [C--H--C]− using the bicyclo[3.3.3]undecane backborn.38,39 Much effort has been made experimentally and theoretically to clarify properties of the symmetric (sym) and nonsymmetric (nsym) interactions of the [N--X--N]+ (X = F, Cl, Br and I) form.40–44 However, few reports seem to contain the systematic research on the compressed [N--X--N]+ interactions (X = F, Cl, Br and I) in cage structures of the medium size.
Our investigations were focused to elucidate the natures and the properties of the interactions in [N--X--N]+ (X = H, F, Cl, Br and I) and the pnictogen derivatives, to achieve our purpose. Chart 1 shows the structures of 1a+–8e+ and the definition of the symmetric (sym) and nonsymmetric (nsym) shapes. The [APn--X--BPn]+ interaction will form through the incorporation of X+ into APn⋯BPn of 1–8. Herein, we report the results of the investigations on [APn--X--BPn]+ in 1a+–8e+, using the original frameworks of I and II, where APn = BPn = N (1x+/5x+), P (2x+/6x+), As (3x+/7x+) and Sb (4x+/8x+); X = H (x = a), F (b), Cl (c), Br (d) and I (e) (see Chart 1). The nature of [APn--X--BPn]+ in 1a+–8e+ was elucidated after clarifying the structural features and energetic behaviour of the species. The subscribe + as in [APn--X--BPn]+ will be often omitted from the interaction as in APn--X--BPn, in this paper. It is the second issue of this study to clarify the stabilities and the properties of 1–8 and 1a+–8e+ with the larger pnictogen atoms, in place of the CH groups, at the bridgehead positions of I and II. The results of this study will provide useful insight into the APn--X--BPn σ(3c–4e) interactions such as those in 1a+–8e+.
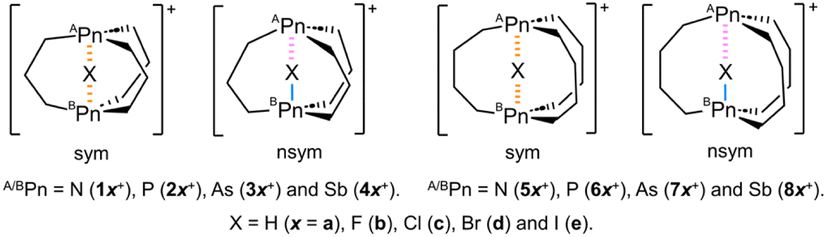 | ||
| Chart 1 Species 1a+–8e+ and the definition of the symmetric (sym) and nonsymmetric (nsym) shapes. | ||
Survey of quantum theory of atoms-in-molecules dual functional analysis (QTAIM-DFA)
The natures of the APn--X--BPn σ(3c–4e) type interactions are calculated with QTAIM-DFA,1–4 which we proposed. QTAIM-DFA is formulated based on the QTAIM approach, introduced by Bader.45,46 QTAIM-DFA has elucidated the (intrinsic) dynamic and static natures of various interactions. The bond critical point (BCP, *) is an important concept in the QTAIM approach.45,46 The charge density (ρ(r)) at the BCP is described by ρb(rc), as are other QTAIM functions, such as the total electron energy densities Hb(rc), potential energy densities Vb(rc) and kinetic energy densities Gb(rc) at BCPs. A chemical bond or interaction between atoms A and B is denoted by A–B, which corresponds to the bond path (BP) in QTAIM. We will use A-*-B for the BP, in which the asterisk emphasizes the existence of a BCP in A–B. In a nonsymmetric shape, the interaction between APn and X is defined to be longer than for BPn and X, therefore, they are often described as APn--*--X and BPn-*-X, respectively, which means APn⋯X and BPn–X, respectively. The long distances between A and B also denoted by A⋯B, irrespective of above definition.In the QTAIM approach, Hb(rc) is plotted versus Hb(rc) − Vb(rc)/2 at the BCPs on the interactions in question. The plots are called QTAIM-DFA plots.1,2 Data from the perturbed structures around the fully optimized structures are plotted in QTAIM-DFA, in addition to the data from the fully optimized ones, in our treatment. Each plot for an interaction is analysed by the polar coordinate (R, θ) parameters with the (θp, κp) ones. The R and θ parameters are calculated for the data point of the interaction in the fully optimized structure at the origin. While R corresponds to the energy for the interaction in question in the plot, θ, measured from the y-axis, classifies the interaction. The (θp, κp) parameters are measured based on the plot at the data point for the interaction in the fully optimized structure. θp is measured from the y-direction, which corresponds to the tangent line of the plot, and κp is the curvature.1 While θp characterizes the interaction, κp does not play an important role in the analysis, although it may contain deep meaning.
The (R, θ) parameters are calculated based on the data from the fully optimized structures; therefore, they correspond to the static nature of interactions. The dynamic nature of interactions is proposed based on (θp, κp), which are obtained by analysing the plots. The plots contain the data from the fully optimized and perturbed structures around fully optimized ones. The perturbed structures are generated using the coordinates (Ci) derived from the diagonal elements of the compliance constants (Cii) for the internal vibrations, in CIV.47 The values were calculated using Compliance 3.0.2 program.48,49 The dynamic nature based on the perturbed structures with CIV is described as the “intrinsic dynamic nature” since the coordinates are invariant to the choice of coordinate system and thus the perturbed structures are highly reliable.47 The standard criteria that distinguish the interactions in question from others are obtained by applying QTAIM-DFA to standard interactions.1–4 The criteria and QTAIM-DFA with the basic concept of the QTAIM approach are shown by Scheme SA1–SA3, Fig. SA1, SA2, Table SA1 and eqn (SA1)–(SA7) of the ESI.†
Methodological details in calculations
Gaussian 09 program was used for the calculations.50 Various basis set systems (BSSs) were examined to determine suitable BSSs. Table 1 shows typical BSSs, examined. The BSS-A employs the basis sets of the Sapporo-TZP with diffuse functions of the 1s1p type (Sapporo-TZP + 1s1p) for all atoms, as implemented from the Sapporo Basis Set Factory.51 BSS-B employs Sapporo-TZP + 1s1p for APn, BPn and (X = H, F, Cl, Br and I), together with Sapporo-DZP + 1s1p for C and H. For BSS-C, Sapporo-TZP + 1s1p is applied to APn, BPn and X, whereas Sapporo-DZP is applied to C and H. The Møller–Plesset second order energy correlation (MP2) level52 was employed for the calculations (MP2/BSS-A, MP2/BSS-B and MP2/BSS-C). The optimized structures were confirmed by frequency analysis. The results of frequency analysis were used to derive the coordinates Ci and the constants Cii. Natural bond orbital (NBO) analysis was performed by the NBO6 program53 under M06-2X/BSS-B//MP2/BSS-B. The relativistic effects were not considered, which would be the next them of the study, especially on the element of 5th period of Sb and I.| BSSs | C and H | APn, BPn and X (= H, F, Cl, Br and I) |
|---|---|---|
| BSS-A | Sapporo-TZP + 1s1p | Sapporo-TZP + 1s1p |
| BSS-B | Sapporo-DZP + 1s1p | Sapporo-TZP + 1s1p |
| BSS-C | Sapporo-DZP | Sapporo-TZP + 1s1p |
Eqn (1) explains the process to generate the perturbed structures with CIV.47 The kth perturbed structure in question (Skw) was generated by adding the coordinates of Ci to the standard orientation of a fully optimized structure (So) in the matrix representation. The coefficient gkw controls the structural difference between Skw and So. gkw was determined to satisfy r in eqn (2), where r and ro are the interaction distances in question in perturbed structures and a fully optimized structure, respectively, and ao is the Bohr radius (0.52918 Å). The Ci values of six digits were used to calculate the Skw.
| Skw = So + gkw·Ci | (1) |
| r = ro + wao (w = (0), ±0.05 and ±0.1; ao = 0.52918 Å) | (2) |
| y = co + c1x + c2x2 + c3x3 (Rc2 = square of correlation coefficient) | (3) |
QTAIM functions were analysed by the AIM2000![[thin space (1/6-em)]](https://www.rsc.org/images/entities/char_2009.gif) 54 and AIMAll55 programs. Data from five points of w = 0, ±0.05 and ±0.1 in eqn (2) were used in a QTAIM-DFA plot, unless otherwise noted. Each plot was analysed by using the regression curve of the cubic function, shown in eqn (3), where (x, y) = (Hb(rc) − Vb(rc)/2, Hb(rc)), with an Rc2 generally greater than 0.99999.4
54 and AIMAll55 programs. Data from five points of w = 0, ±0.05 and ±0.1 in eqn (2) were used in a QTAIM-DFA plot, unless otherwise noted. Each plot was analysed by using the regression curve of the cubic function, shown in eqn (3), where (x, y) = (Hb(rc) − Vb(rc)/2, Hb(rc)), with an Rc2 generally greater than 0.99999.4
Results and discussion
Exploring a suitable method for calculations
The structures of 2, 5 and 5a+, optimized with MP2/BSS-A, MP2/BSS-B and MP2/BSS-C, were carefully compared with the structures, determined by X-ray crystallography.30,35 Scheme 1 illustrates the structural parameters of θ (θA and θB), d (dA and dB) and the least-square planes σ (σA and σB) for the three C atoms bonding to Pn (APn or BPn) of 1–4 and 5–8. The d values are defined to be positive and negative, respectively, if Pn are located outside and inside the σ plane with respect to the molecular centre. The “out” and “in” notations56 correspond to the positive and negative d values, respectively.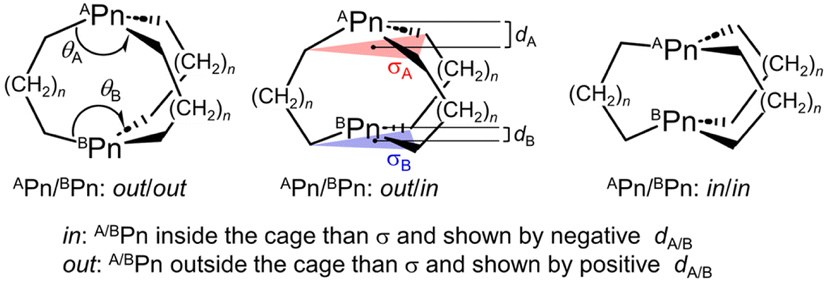 | ||
| Scheme 1 Selected structural parameters of θ (θA and θB) and d (dA and dB) for 1–4 (n = 1) and 5–8 (n = 2) with the least-square planes σ (σA and σB) for the three C atoms bonded to Pn (APn and BPn). The d values are defined to be positive and negative, respectively, if Pn are located outside and inside the σ plane with respect to the molecular centre. The “out” and “in” notations correspond to the positive and negative d values, respectively. | ||
Table S1 of the ESI† lists the selected observed and calculated structural parameters for the interaction lengths between APn and BPn (r(APn–BPn)), θA, θB, dA and dB. The differences between the calculated and observed r(APn–BPn) values (Δr(APn–BPn) = rcalc(APn–BPn) − robsd(APn–BPn)) are also provided in Table S1.† The Δr(APn–BPn) values were 0.027 Å, 0.041 Å and 0.022 Å for 2, respectively, when calculated with MP2/BSS-A, MP2/BSS-B and MP2/BSS-C. The values were −0.035 Å, −0.024 Å and −0.054 Å for 5, respectively, if the three methods were applied. The Δr(APn–BPn) values were 0.003–0.006 Å for 5a+ by the three methods. The coincidence between the calculated and observed values are excellent for 5a+.
The MP2/BSS-A method provided excellent quality results; however, the cost performance in the calculations were poorer if the numbers of primitive Gaussian functions necessary for the calculations became larger in 1–8 and 1a+–8e+. Both MP2/BSS-B and MP2/BSS-C were (very) good with some advantages, whereas disadvantages were for our purpose. We employed MP2/BSS-B since the results with MP2/BSS-B were closer to those with MP2/BSS-A relative to those with MP2/BSS-C. One imaginary frequency was predicted for AN--H--BN in 1a+sym with MP2/BSS-A and MP2/BSS-B, but all real frequencies were predicted with MP2/BSS-C. All real frequencies were predicted for 1a+nsym with MP2/BSS-B. The results led us to select MP2/BSS-B for the calculations. The diffuse functions appeared to play an important role in predicting an imaginary frequency around the bridgehead symmetric interactions in 1a+.
Optimizations and structural features of 1–8 and 1a+–8c+
Optimizations were started assuming the C3h symmetry for 1a+–4e+ and the D3 symmetry for 5a+–8e+,57 although the symmetries were often broken during the optimizations. The minimal structures were optimized with MP2/BSS-B for 1a+–1c+ (X = H, F and Cl), 2a+–4b+ (X = H and F), 5a+–6e+ (X = H, F, Cl, Br and I), 7a+–7d+ (X = H, F, Cl and Br) and 8a+–8c+ (X = H, F and Cl). The optimized minimal structures are collectively written as 1a+–8c+. The optimized minimal structures were only the symmetric shape for 1c+, 4b+, 5c+–5e+, and 6e+ and only the nonsymmetric shape for 1a+, 5a+ and 7a+, while they were both for 1b+, 2a+, 2b+, 3a+, 3b+, 4a+, 5a+, 5b+, 6a+–6d+, 7b+–7d+ and 8a+–8c+. The difference between ASb--H (1.8823 Å) and BSb--H (1.8815 Å) in the optimized structure of 4a+ in the C3 symmetry was negligibly small in magnitude (0.0008 Å); therefore, it could be recognized to have the symmetric shape. The optimizations were not successfully performed for 1e+–4e+ (X = I). The reason would be the too large size of I+ to incorporate into APn⋯BPn to give the stable species of 1e+–4e+. Moreover, the optimizations were successful for those other than above species, but multiple imaginary frequencies were predicted after the frequency analysis. Efforts were made to search the minimal structures for the species. However, the trials were unsuccessful under the calculation conditions. The structures of the symmetric and nonsymmetric shapes are conveniently denoted by mx+sym and mx+nsym (mx = 1a–8e), respectively.Two types of the transition states (TSs) were optimized. One type appears in the site exchange process between the topological isomers of the nsym shape, where the longer and shorter distances in A/BPn--X--B/APn are changed. Another type appears between the sym and nsym shapes. While the TSs will be mx+tp:TS if the optimized minimal structures are only mx+nsym, they will be mx+s–ns:TS if both mx+sym and mx+nsym are optimized for a species. No TSs will be optimized for a species if the optimized structure is only mx+sym. As a result, mx+tp:TS will be optimized for 1a+, 5a+ and 7a+, while mx+s–ns:TS will appear for 1b+, 2a+, 2b+, 3a+, 3b+, 4a+, 5b+, 6a+–6d+, 7b+–7d+ and 8a+–8c+, under the calculation conditions. Only one imaginary frequency was predicted for each TS. The vibrational motions of TSs corresponding to the imaginary frequencies are shown in Fig. S1 of the ESI,† which confirms the intervention of the TSs between the corresponding two structures. Fig. 1 explains the processes via mx+tp:TS (a) and mx+s–ns:TS (b), exemplified by 5a+tp:TS and 6b+s–ns:TS, respectively. Fig. 1a illustrates the exchange the longer and shorter distances of A/BPn--X--B/APn in 5a+nsym via 5a+tp:TS, where 5a+nsym is (very) close to 5a+tp:TS, since 5a+nsym is almost symmetric. Fig. 1b shows the clear exchange of the geometries around AP and BP between 6b+sym and 6b+nsym via 6b+s–ns:TS.
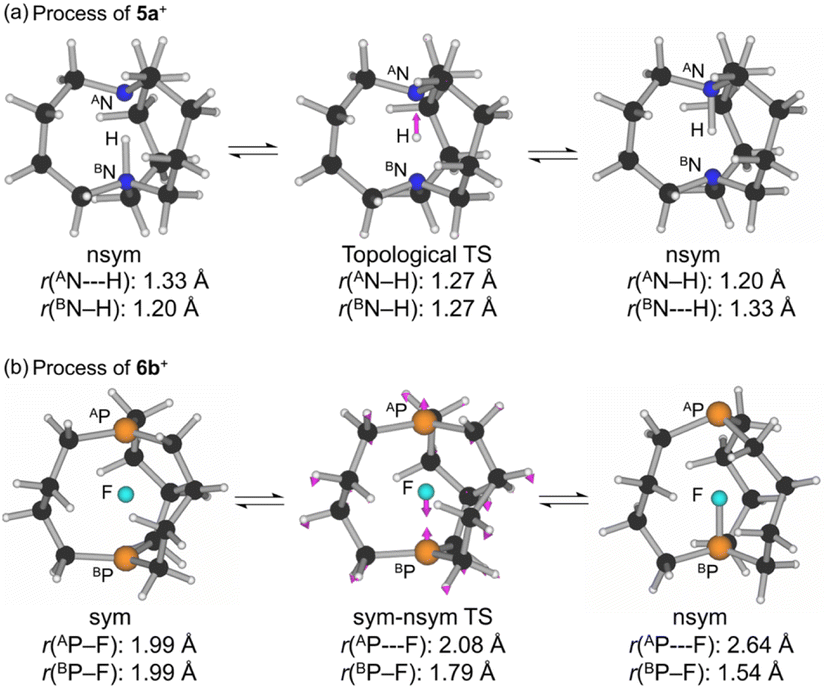 | ||
| Fig. 1 Processes via the TSs of mx+tp:TS (mx = 5a) (a) and of mx+s–ns:TS (mx = 6b) (b). | ||
The selected structural parameters optimized with MP2/BSS-B are listed in Table S2 of the ESI;† this table contains the lengths between APn and X (r(APn–X)) and between BPn and X (r(BPn–X)), θA, θB, dA, dB and the types of APn and BPn, defined in Scheme 1. The in/in type was predicted for 1a+tp:TS, 1a+nsym, 5a+tp:TS, 5a+nsym, 5b+sym, 5c+sym, 5d+sym, 6a+sym and 7a+tp:TS, whereas the out/in type was for the nonsymmetric shape of 2a+, 5b+, 6a+–6d+, 7a+–7c+, 8a+ and 8b+. The out/out type was optimized for those other than the one listed above. The optimized structures are not shown in the figures, but they can be found in molecular graphs of 1–8 and 1a+–8c+, drawn on the optimized structures with MP2/BSS-B.
The ΔrCov(A/BPn–X) values for r(A/BPn–X) of 1a+–8c+ in the optimized structures were calculated from the sum of the covalent radii58 (rCov(A/BPn–X)). The ΔrvdW(A/BPn–X) values were similarly calculated from the sum of the van der Waals radii59,60 (rvdW(A/BPn–X)). The values are listed in Table S2 of the ESI.† Each r(A/BPn–X) was smaller than the corresponding rvdW(A/BPn–X), respectively. The ΔrCov(A/BPn–X) values were plotted versus the species numbers, which was shown in Fig. S2 of the ESI.† Each r(A/BPn–X) of the symmetric shape was larger than the corresponding rCov(A/BPn–X) (ΔrCov(A/BPn–X) > 0), respectively, except for r(A/BSb–F) of 4b+sym. While r(APn⋯X) and r(BPn–H) in each of mx+nsym was longer and shorter than the corresponding rCov(Pn–X), respectively, with the exception of r(BN–H) in 1a+nsym and 5a+nsym and r(BN–F) in 1b+nsym and 5b+nsym. The overall order of the lengths was r(APn⋯X)nsym > r(APn–X)sym > r(BPn–X)nsym. While r(APn⋯X)nsym and r(APn–X)sym seem noncovalent with the exception of r(ASb–F) in 4b+sym, r(BPn–X)nsym became covalent with the exception of r(BN–H) of 1a+nsym and 5a+nsym and r(BN–F) of 1b+nsym and 5b+nsym.
Stability of symmetric and nonsymmetric shapes and TSs
The energy values (E: EES and EZP) for mx+sym, mx+nsym, mx+s–ns:TS and/or mx+tp:TS (mx = 1a–8e) are collected in Table S3 of the ESI,† where EES and EZP are E on the energy surface and those corrected with the zero-point energy, respectively. The relative energies (ΔE: ΔEES and ΔEZP) are also shown in the table for the species from the global minimum in each group. Each group contains one mx+sym, one mx+nsym, one mx+s–ns:TS and/or one mx+tp:TS. A very good correlation was obtained in the plot of ΔEZP versus ΔEES (y = −0.73 + 0.93x, Rc2 = 0.991), as shown in Fig. S3 of the ESI.† As a result, the energy profiles can be discussed using the ΔEES values.What are the energies of mx+sym, mx+nsym, mx+s–ns:TS and/or mx+tp:TS (mx = 1a–8c), originally? It is instructive to consider the energies of (mx+sym and mx+nsym) from (1–8 and X+). The energy differences correspond to those for the formation of (mx+sym and mx+nsym) from (1–8 and X+); therefore, they are denoted by ΔEf (ΔEf:ES and ΔEf:ZP) (= E(mx+) − E(mx + X+)), here. ΔEf:ES must strongly reflect the binding energies around the Pn–X–Pn moieties. The ΔEf values are calculated for mx+sym, mx+nsym, mx+s–ns:TS and/or mx+tp:TS, which are collected in Table S3 of the ESI.†
Fig. 2 illustrates the ΔEf:ES values for the global minimum in each group, mx+sym or mx+nsym. The energy levels and arrows are shown in black if mx+sym are the global minima whereas they are in red if mx+nsym is the global minima. Fig. 2 clearly tells us that 1–4 react with H and F to give the stable ma+ and mb+ (m = 1–4), respectively. The structures are all mx+sym for X = F, while they are all mx+nsym for X = H, except for 4a+sym. The cavity size of the bicyclo[3.3.3] system would not be enough large to give the stable moieties of [Pn--X--Pn]+ with X+ (X = Cl and Br). Indeed, Cl+ reacts with 1 to give 1c+sym, but it is less stable than the components by 307 kJ mol−1. The high energy barrier inside the cavity in 1c+sym prevents Cl+ to escape from the cavity, irrespective of the less stable property of 1c+sym in energy. It is of interest that H+ tends to give mx+nsym, whereas F+ to mx+sym.
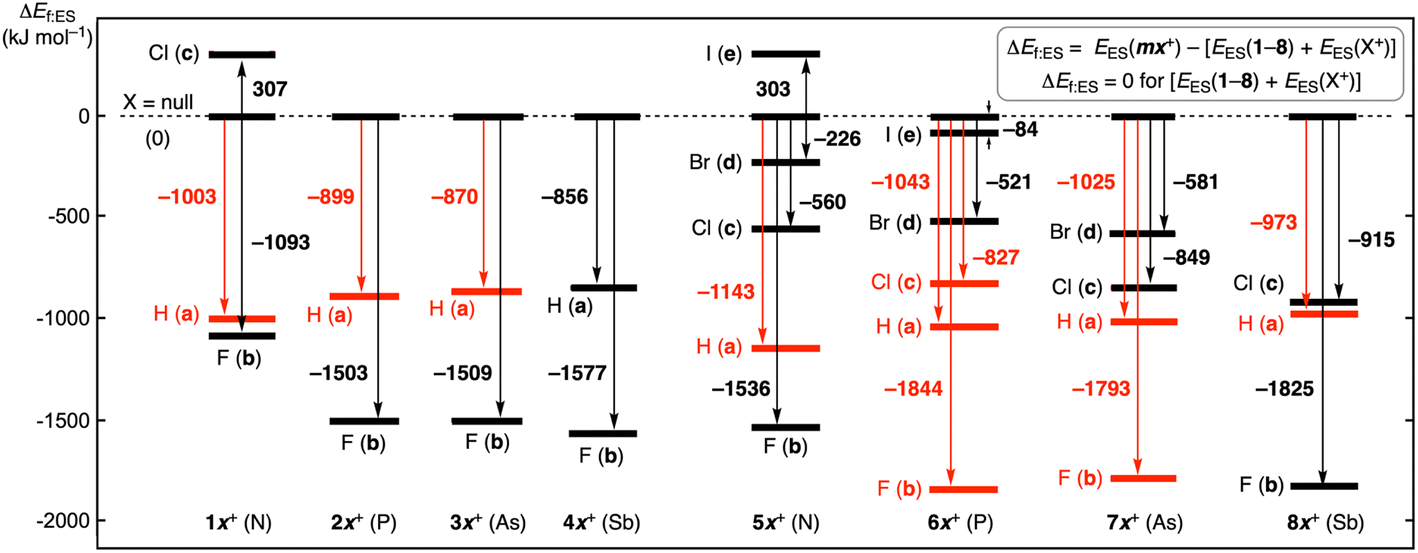 | ||
| Fig. 2 Energy profiles for the formation of mx+sym and/or mx+nsym of the minimal structures from 1–8 and X+ (X = H, F, Cl, Br and I), optimized with MP2/BSS-B. The energy of each combination of 1–8 and X+ was taken as the standard for each energy producing mx+sym and/or mx+nsym, which are given in kJ mol−1. The energy levels and the values are described in black for mx+sym, whereas they are given in red for mx+nsym in the diagram. | ||
Species of 5–8 essentially react with all X+ (X = H, F, Cl, Br and I) to give stable species. While 6 (Pn = P) reacts with all X+ to give stable species, the adduct of 5 (Pn = N) with I+ was optimized but it is less stable than the components. The adduct of 7 (Pn = As) with I+ was not optimized; moreover, those of 8 (Pn = Sb) with Br+ and I+ were not, either. The larger cavities in 5–8 of the bicyclo[4.4.4] system seem superior to the narrower ones in 1–4 of the bicyclo[3.3.3] system to give the stable species in the reaction with X+, especially for X = Br and I. It is also confirmed that the Pn atom affects on the stability of the adducts.
The ΔEES values for (1a+tp:TS from 1a+nsym) and (5a+tp:TS from 5a+nsym) were predicted to be very small values of 0.02 and 0.04 kJ mol−1, respectively, in magnitudes. Therefore, it would be difficult to distinguish the two structures clearly. The optimized structures of mx+tp:TS (mx = 1a and 5a) must be very close to the corresponding mx+nsym (and mx+sym) (see Table S3† for 1a and 5a). However, ΔEES for 7a+tp:TS from 7a+nsym were predicted to be very large value of 76.2 kJ mol−1. 7a+tp:TS must be substantially different from 7a+nsym. The optimized structure of 7a+tp:TS seems symmetric. The differences between Pn = As in 7a+ and Pn = N in 1a+ and 5a+ would be responsible for the results.
Fig. 3 shows the relative values of ΔEES (mx+sym), ΔEES (mx+s–ns:TS) and ΔEES (mx+nsym) from the global minimum of each group. As a result, all ΔEES (mx+) are plotted upside of the corresponding global minimum. The energy levels and the model lines for the reaction coordinates are illustrated in black if ΔEES (mx+sym) < ΔEES (mx+nsym), whereas they are in red when ΔEES (mx+sym) > ΔEES (mx+nsym). The colors in Fig. 2 and 3 are related to each other. Only one plot in black appeared for each of 1b+, 4a+ and 5b+; therefore, the plots are shown as Fig. 3a. The plots for (2a+ and 2b+), (3a+ and 3b+), (6a+–6d+), (7b+–7d+) and (8a+–8c+) are drawn in Fig. 3b–f, respectively.
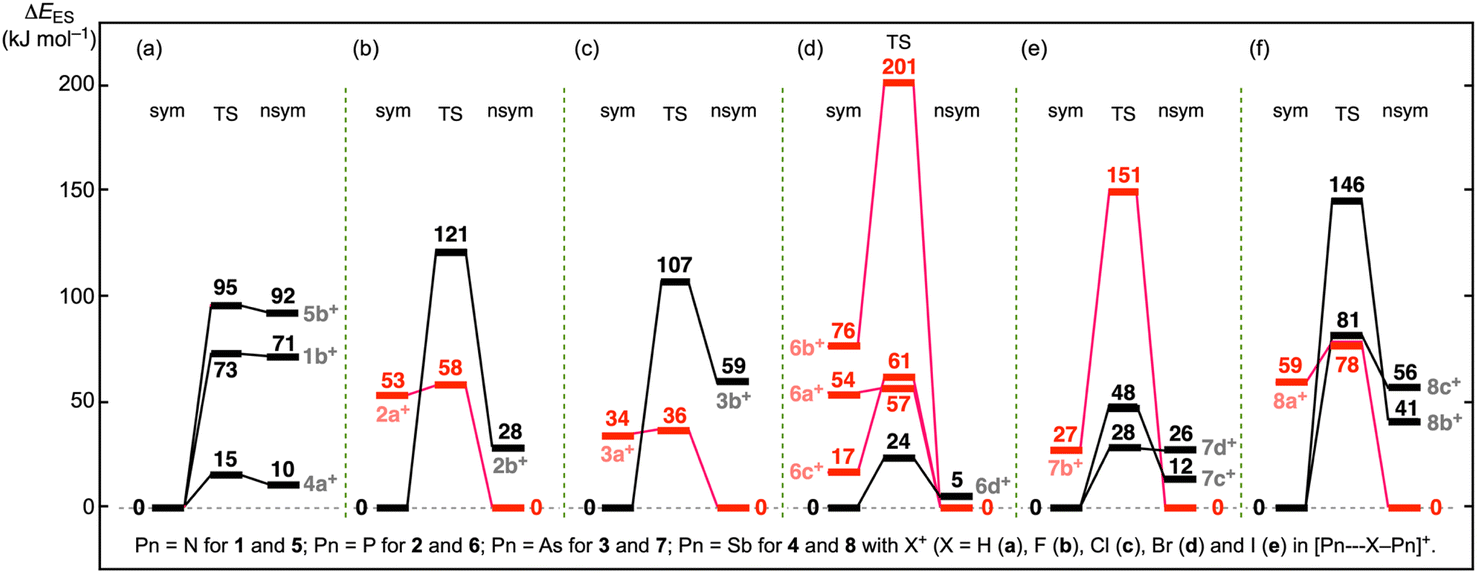 | ||
| Fig. 3 Plots of ΔEES (mx+sym), ΔEES (mx+s–ns:TS) and ΔEES (mx+nsym), optimized with MP2/BSS-B. Plots are for 1b+, 4a+ and 5b+ (a), 2a+ and 2b+ (b), 3a+ and 3b+ (c), 6a+–6d+ (d), 7b+–7d+ (e) and 8a+–8c+ (f). The energy levels and the model lines for the reaction coordinates are illustrated in black when ΔEES (mx+sym) < ΔEES (mx+nsym) and in red if ΔEES (mx+sym) > ΔEES (mx+nsym). | ||
The ΔEES values for (1b+nsym and 1b+s–ns:TS from 1b+sym), (4a+nsym and 4a+s–ns:TS from 4a+sym), and (5b+nsym and 5b+s–ns:TS from 5b+sym) were predicted to be (70.7 and 72.7 kJ mol−1), (10.0 and 14.8 kJ mol−1) and (91.9 and 95.3 kJ mol−1), respectively, in magnitudes. The results are illustrated in Fig. 3a with the ΔEES values. Similarly, the calculated ΔEES values for mx+nsym and mx+s–ns:TS from mx+sym (mx+ = 2a+–8c+) are drawn in Fig. 3b–f, respectively.
Fig. 2 and 3 are illustrated in such a way that all processes can be visualized for the formation of mx+sym, mx+nsym, mx+s–ns:TS and mx+tp:TS (mx = 1a–8c) from the components, 1–8 and X+ (X = H, F, Cl, Br and I), by overlapping the energy levels of the common species in the two figures. While the red lines should connect to the red ones, the black lines to the black ones, in this process. The ΔEf:ES values for all species are obtained by adding the values along the processes via the global minimum in a group. (The memory widths on the vertical axes are different.) The ΔEES values are given in the figures, which are also found in Table S3 of the ESI.†
The ΔEES values for both mx+nsym and mx+s–ns:TS increase in the order of Pn = P (in 6c+) < As (in 7c+) < Sb (in 8c+). However, the orders for others are unclear, since some data are lacking due to unsuccessful optimizations and some disorders seem to occur. In the case of 6b+–6d+ and 7b+–7d+, the ΔEES values for mx+nsym increase in the order of X = F < Cl < Br whereas the values for mx+s–ns:TS decreased in the order of X = F > Cl > Br. The opposite trends between mx+nsym and mx+s–ns:TS are of interest. The similar trend was detected in 8b+nsym and 8c+nsym, of which ΔEES values increased in the order of X = F < Cl.
The APn--X--BPn and/or APn⋯X–BPn interactions plays an important role in stabilising the symmetric and nonsymmetric shapes of 1a+–8c+, respectively, together with the TSs, although the contributions seem complex. The secondary interactions also contribute to control the fine details of the structures.
Molecular graphs with contour plots for 1–8 and 1a+–8c+
Fig. 4 shows the molecular graphs with contour plots drawn on the selected minimal structures of 1a+–8c+, optimized with MP2/BSS-B. Those of others, containing those for 1–8, are shown in Fig. S4–S6 of the ESI.† The BCPs corresponding to the APn⋯BPn interactions were detected for AN-*-BN in 1 and 5 and AP-*-BP in 6, although such BCPs were not detected for 2–4, 7 and 8, due to the clear out/out structures with the large APn⋯BPn distances for 7 and 8 (see Table S2 of the ESI†). The BCPs were detected for APn--X--BPn in 1a+–8c+, along with those for the secondary H-*-H and X-*-C interactions in 2–8 and 1b+–8c+, together with that for H-*-BSb in 8a+sym.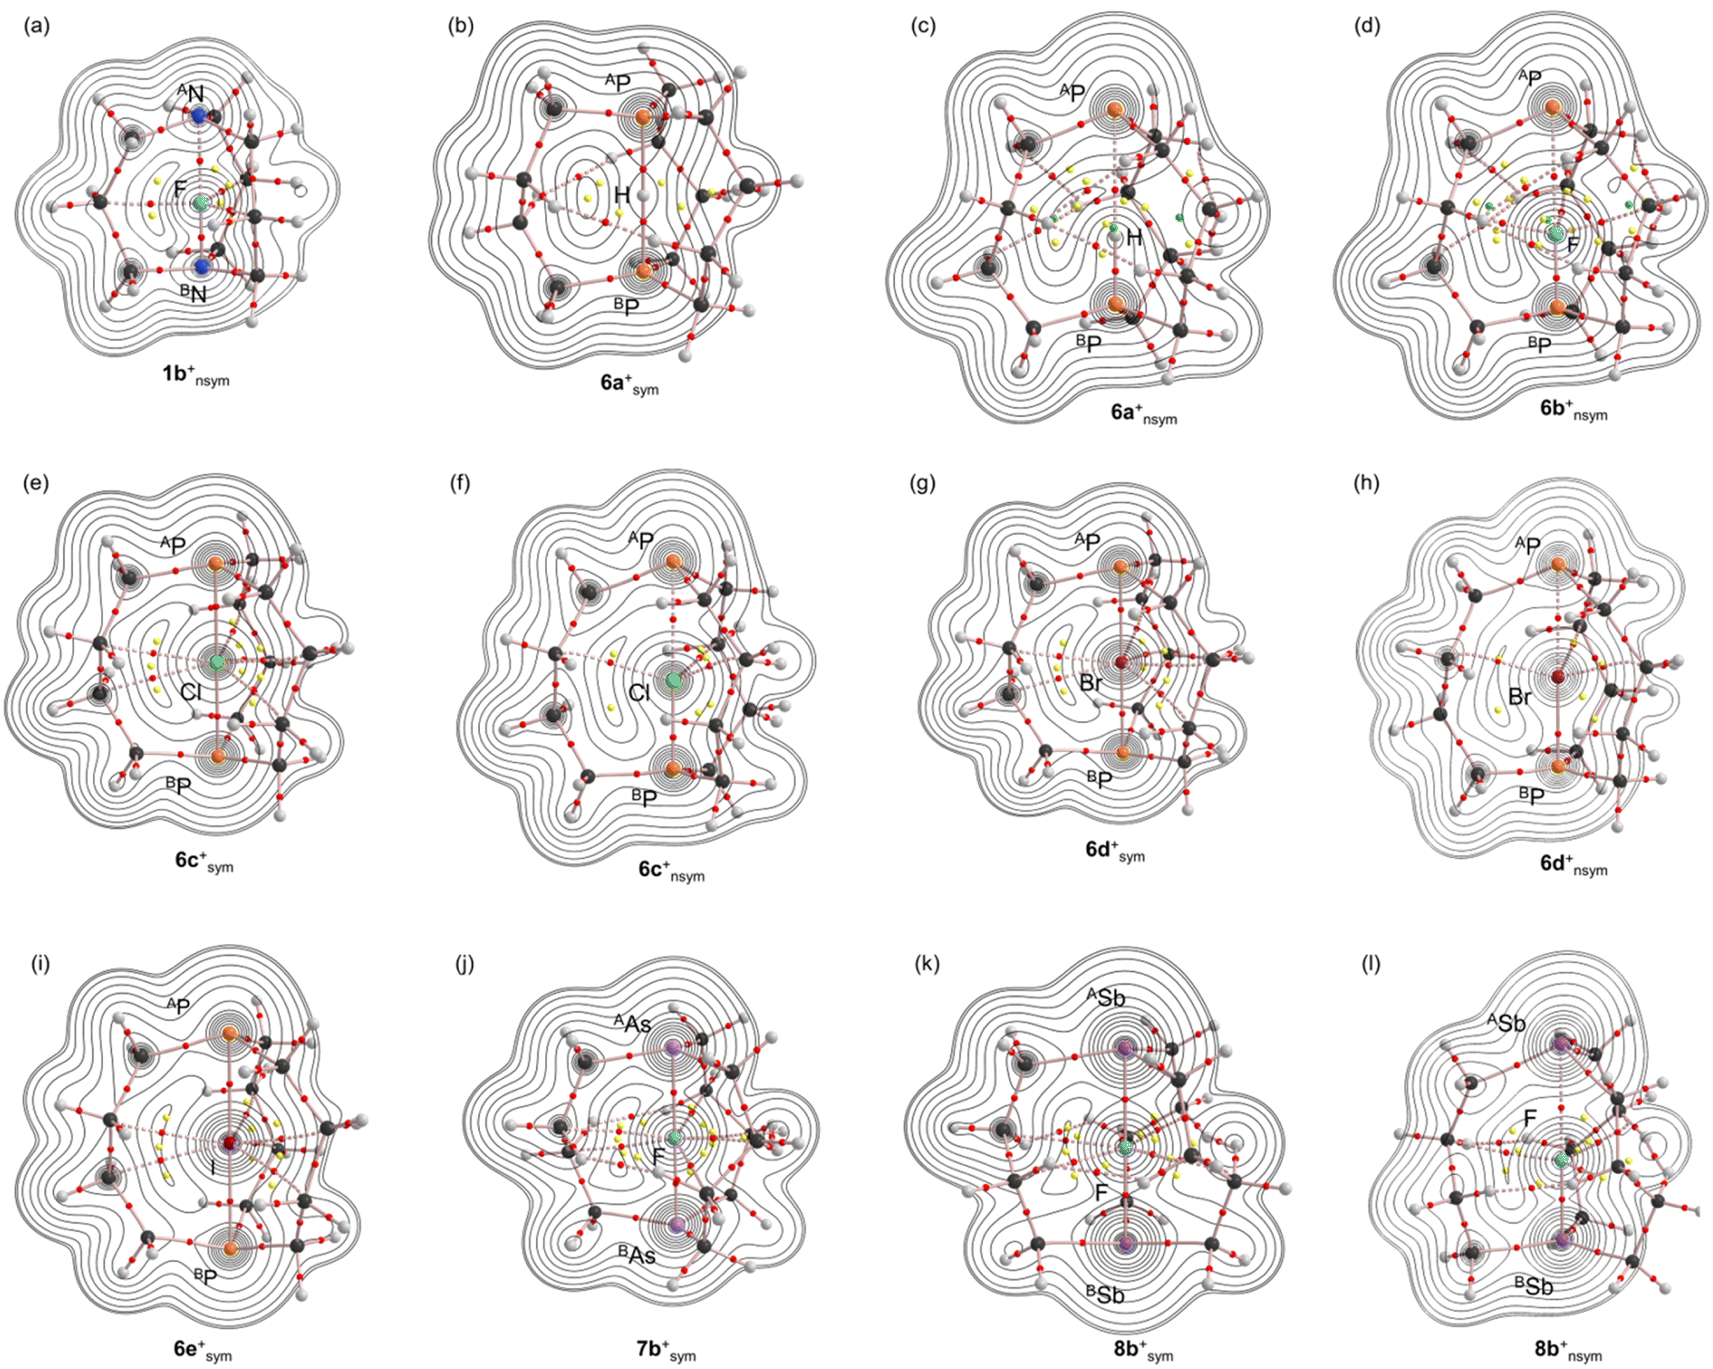 | ||
| Fig. 4 Molecular graphs with contour plots for 1b+nsym, 6a+sym, 6a+nsym, 6b+nsym, 6c+sym, 6c+nsym, 6d+sym, 6d+nsym, 6e+sym, 7b+sym, 8b+sym and 8b+nsym ((a)–(l), respectively), calculated with MP2/BSS-B. The BCPs are denoted by red dots, RCPs (ring critical points) by yellow dots, CCPs (cage critical points) by green dots and BPs by pink lines. Carbon, hydrogen, nitrogen, phosphorus, arsenic, antimony, fluorine, chlorine, bromine and iodine atoms are shown in black, grey, blue, orange, light purple, purple, light green, green, dark red and dark purple, respectively. Contour plots are drawn on the planes containing at least APn, BPn and X. | ||
The BPs in APn--*--BPn and APn-*-X appeared straight, as shown in Fig. 4 and S4–S6 of the ESI.† What is the linearity of the BPs for APn--*--BPn and Pn-*-X? The lengths of BPs (rBP) and the straight-line distances (RSL) corresponding to rBP of APn--*--BPn in 1, 5 and 6 and Pn-*-X in 1a+–8c+ are listed in Table S4 of the ESI,† along with the differences between rBP and RSL, ΔrBP (= rBP −RSL). The APn--*--BPn and Pn-*-X interactions in 1, 5, 6 and 1a+–8c+ were recognized to be straight, since the ΔrBP values were less than 0.01 Å. However, the BPs for H--*--H and H--*--BSb in 8a+nsym and some X--*--C were bent compared with those of APn--*--BPn and Pn-*-X, of which ΔrBP values are provided in Table S5 of the ESI.† The ΔrBP values were 0.02–0.23 Å for H--*--H, H--*--BSb in 8a+nsym, Cl--*--C in 6c+nsym, Br--*--C in 6d+sym and 6d+nsym, I--*--C in 6e+sym, and F--*--C in 7b+nsym, 8b+sym and 8b+nsym. For other X--*--C, the ΔrBP values were less than 0.20 Å; thus, they were approximately straight.
The values of ρb(rc), Vb(rc), Gb(rc) and Hb(rc), which were called the QTAIM functions here, were calculated at the BCPs that appeared in molecular graphs, as shown in Fig. 4, for example. Table 2 lists the values of the QTAIM functions of ρb(rc), Hb(rc) − Vb(rc)/2 and Hb(rc), evaluated with MP2/BSS-B.
| mx+sym/nsym (symmetry) (A/BPn-*-X) | ρb(rc) (eao−3) | c∇2ρb(rc)c (au) | Hb(rc) (au) | Rd (au) | θe (°) | Ciif (Å mdyn−1) | θpg (°) | κph (au−1) | Predicted nature |
|---|---|---|---|---|---|---|---|---|---|
| a See Table 1 for BSS-B.b Data are given at the BCPs.c c∇2ρb(rc) = Hb(rc) − Vb(rc)/2, where c = ħ2/8m.d R = (x2 + y2)1/2, where (x, y) = (Hb(rc) − Vb(rc)/2, Hb(rc)).e θ = 90° − tan−1(y/x).f Cij = ∂2E/∂fi∂fj, where i and j refer to internal coordinates, and fi and fj, corresponding to i and j, respectively, are the external force components acting on the system.g θp = 90° − tan−1(dy/dx).h κp = |d2y/dx2|/[1 + (dy/dx)2]3/2.i Two sets of very close data are predicted from ASb-*-H and BSb-*-H. One set of data are shown here.j Data from w = ±0.05, ±0.025 and 0 are used for the plot because a poor correlation is obtained for the data from w = ±0.1, ±0.05 and 0.0. | |||||||||
| 1a+nsym (C1) (AN--*--H) | 0.1815 | −0.0445 | −0.1805 | 0.1859 | 193.9 | 19.19 | 205.2 | 0.1 | SS/Cov-s |
| (BN-*-H) | 0.2364 | −0.1009 | −0.2959 | 0.3126 | 198.8 | 12.80 | 206.6 | 0.0 | SS/Cov-s |
| 1b+sym (C3h) (A/BN-*-F) | 0.1518 | 0.0626 | −0.0590 | 0.0860 | 133.3 | 0.155 | 155.0 | 7.4 | r-CS/CT-MC |
| 1b+nsym (C3) (AN--*--F) | 0.0860 | 0.0520 | −0.0155 | 0.0543 | 106.6 | 0.506 | 146.5 | 20.1 | r-CS/t-HBwc |
| (BN-*-F) | 0.3334 | −0.0212 | −0.3316 | 0.3323 | 183.7 | 0.302 | 199.0 | 0.1 | SS/Cov-s |
| 1c+sym (C3h) (AN-*-Cl) | 0.1790 | 0.0087 | −0.1148 | 0.1151 | 175.6 | 0.547 | 196.2 | 1.0 | r-CS/CT-TBP |
| 2a+sym (C3h) (A/BP-*-H) | 0.1088 | −0.0180 | −0.0709 | 0.0732 | 194.2 | 0.613 | 198.5 | 2.2 | SS/Cov-w |
| 2a+nsym (C3) (AP--*--H) | 0.0464 | 0.0098 | −0.0108 | 0.0146 | 137.7 | 0.860 | 182.7 | 28.9 | r-CS/CT-TBP |
| (BP-*-H) | 0.1980 | −0.0091 | −0.2209 | 0.2211 | 182.4 | 0.238 | 128.3 | 1.7 | SS/Cov-s |
| 2b+sym (C3h) (A/BP-*-F) | 0.0968 | 0.0237 | −0.0645 | 0.0687 | 159.8 | 0.247 | 116.8 | 39.8 | r-CS/t-HBwc |
| 2b+nsym (C3) (AP--*--F) | 0.0455 | 0.0230 | −0.0039 | 0.0234 | 99.7 | 0.480 | 157.6 | 79.2 | r-CS/CT-MC |
| (BP-*-F) | 0.1987 | 0.1707 | −0.1335 | 0.2167 | 128.0 | 0.125 | 106.4 | 0.1 | r-CS/t-HBwc |
| 3a+sym (C3h) (A/BAs-*-H) | 0.0924 | −0.0047 | −0.0487 | 0.0489 | 185.6 | 0.800 | 187.1 | 4.0 | SS/Cov-w |
| 3a+nsym (C3) (AAs--*--H) | 0.0438 | 0.0089 | −0.0101 | 0.0134 | 138.7 | 0.981 | 180.8 | 21.5 | r-CS/CT-TBP |
| (BAs-*-H) | 0.1800 | −0.0177 | −0.1457 | 0.1468 | 186.9 | 0.279 | 168.6 | 2.4 | SS/Cov-w |
| 3b+sym (C3h) (A/BAs-*-F) | 0.0918 | 0.0404 | −0.0321 | 0.0516 | 128.5 | 0.267 | 123.2 | 0.7 | r-CS/t-HBwc |
| 3b+nsym (C3) (AAs--*--F) | 0.0431 | 0.0213 | −0.0036 | 0.0216 | 99.6 | 0.584 | 140.7 | 22.0 | r-CS/t-HBwc |
| (BAs-*-F) | 0.1848 | 0.1156 | −0.1202 | 0.1668 | 136.1 | 0.154 | 128.8 | 1.4 | r-CS/t-HBwc |
| 4a+sym (C3) (A/BSb-*-H)i | 0.0764 | 0.0084 | −0.0305 | 0.0316 | 164.5 | 0.646 | 148.9 | 4.9 | r-CS/t-HBwc |
| 4a+nsym (C3) (ASb--*--H) | 0.0409 | 0.0076 | −0.0097 | 0.0123 | 142.0 | 1.174 | 169.6 | 15.4 | r-CS/CT-MC |
| (BSb-*-H) | 0.1308 | 0.0123 | −0.0744 | 0.0754 | 170.6 | 0.435 | 158.1 | 1.4 | r-CS/CT-MC |
| 4b+sym (C3h) (A/BSb-*-F)j | 0.0856 | 0.0654 | −0.0111 | 0.0663 | 99.7 | 0.282 | 109.3 | 164.4 | r-CS/t-HBwc |
| 5a+nsym (C3) (AN--*--H) | 0.1491 | −0.0306 | −0.1291 | 0.1327 | 193.3 | 10.36 | 204.6 | 0.2 | SS/Cov-w |
| (BN-*-H) | 0.2108 | −0.0895 | −0.2519 | 0.2673 | 199.6 | 6.953 | 206.1 | 0.0 | SS/Cov-s |
| 5b+sym (D3) (A/BN-*-F) | 0.1116 | 0.0487 | −0.0264 | 0.0554 | 118.5 | 0.305 | 148.0 | 9.8 | r-CS/t-HBwc |
| 5b+nsym (C3) (AN--*--F) | 0.0542 | 0.0330 | −0.0015 | 0.0331 | 92.5 | 1.156 | 128.4 | 30.8 | r-CS/t-HBwc |
| (BN-*-F) | 0.3091 | −0.0186 | −0.2833 | 0.2839 | 183.8 | 0.284 | 197.7 | 0.0 | SS/Cov-s |
| 5c+sym (C3) (A/BN-*-Cl) | 0.1722 | 0.0049 | −0.1042 | 0.1043 | 177.3 | 0.424 | 194.3 | 1.6 | r-CS/CT-TBP |
| 5d+sym (C2) (AN-*-Br) | 0.1508 | 0.0072 | −0.0963 | 0.0966 | 175.7 | 0.405 | 186.5 | 2.2 | r-CS/CT-TBP |
| 5e+sym (D3) (AN-*-I) | 0.1262 | 0.0225 | −0.0729 | 0.0763 | 162.8 | 0.403 | 149.6 | 14.8 | r-CS/t-HBwc |
| 6a+sym (C2) (A/BP-*-H) | 0.1242 | −0.0228 | −0.0736 | 0.0771 | 197.2 | 2.470 | 206.0 | 0.1 | SS/Cov-w |
| 6a+nsym (C2) (AP--*--H) | 0.0161 | 0.0048 | −0.0003 | 0.0048 | 93.9 | 3.611 | 134.2 | 260.5 | r-CS/t-HBwc |
| (BP-*-H) | 0.1857 | −0.0217 | −0.2041 | 0.2053 | 186.1 | 0.269 | 129.7 | 2.6 | SS/Cov-s |
| 6b+sym (D3) (A/BP-*-F) | 0.0738 | 0.0095 | −0.0352 | 0.0365 | 164.8 | 0.594 | 184.0 | 10.6 | r-CS/CT-TBP |
| 6b+nsym (C3) (AP--*--F) | 0.0212 | 0.0116 | 0.0023 | 0.0118 | 78.9 | 1.017 | 91.6 | 56.9 | p-CS/t-HBnc |
| (BP-*-F) | 0.1843 | 0.1406 | −0.1248 | 0.1880 | 131.6 | 0.149 | 105.3 | 0.3 | r-CS/t-HBwc |
| 6c+sym (C1) (A/BP-*-Cl) | 0.0895 | −0.0016 | −0.0488 | 0.0488 | 181.8 | 0.331 | 192.8 | 0.1 | SS/Cov-w |
| 6c+nsym (C1) (AP--*--Cl) | 0.0433 | 0.0123 | −0.0074 | 0.0144 | 120.8 | 0.623 | 170.1 | 56.4 | r-CS/CT-MC |
| (BP-*-Cl) | 0.1670 | 0.0120 | −0.1657 | 0.1661 | 175.9 | 0.201 | 121.4 | 3.4 | r-CS/t-HBwc |
| 6d+sym (C3) (A/BP-*-Br) | 0.0899 | −0.0014 | −0.0445 | 0.0445 | 181.8 | 0.326 | 193.8 | 1.9 | SS/Cov-w |
| 6d+nsym (C3) (AP--*--Br) | 0.0498 | 0.0112 | −0.0109 | 0.0157 | 134.3 | 0.590 | 181.3 | 32.2 | r-CS/CT-TBP |
| (BP-*-Br) | 0.1572 | −0.0297 | −0.1594 | 0.1621 | 190.6 | 0.259 | 155.2 | 20.3 | SS/Cov-s |
| 6e+sym (D3) (A/BP-*-I) | 0.0851 | −0.0014 | −0.0397 | 0.0397 | 182.1 | 0.586 | 196.9 | 1.0 | SS/Cov-w |
| 7a+nsym (C1) (AAs--*--H) | 0.0222 | 0.0054 | −0.0014 | 0.0056 | 104.8 | 3.013 | 153.3 | 199.5 | r-CS/CT-MC |
| (BAs-*-H) | 0.1717 | −0.0211 | −0.1337 | 0.1354 | 189.0 | 0.301 | 168.3 | 2.9 | SS/Cov-w |
| 7b+sym (D3) (A/BAs-*-F) | 0.0689 | 0.0226 | −0.0186 | 0.0293 | 129.4 | 0.622 | 133.6 | 17.3 | r-CS/t-HBwc |
| 7b+nsym (C3) (AAs--*--F) | 0.0200 | 0.0104 | 0.0020 | 0.0106 | 79.2 | 1.190 | 91.0 | 69.7 | p-CS/t-HBnc |
| (BAs-*-F) | 0.1734 | 0.0999 | −0.1094 | 0.1481 | 137.6 | 0.174 | 130.0 | 1.3 | r-CS/t-HBwc |
| 7c+sym (C2) (A/BAs-*-Cl) | 0.0757 | 0.0083 | −0.0301 | 0.0312 | 164.6 | 0.362 | 168.4 | 11.2 | r-CS/CT-MC |
| 7c+nsym (C1) (AAs--*--Cl) | 0.0394 | 0.0113 | −0.0061 | 0.0129 | 118.3 | 0.712 | 166.0 | 57.7 | r-CS/CT-MC |
| (BAs-*-Cl) | 0.1471 | 0.0113 | −0.0972 | 0.0979 | 173.4 | 0.245 | 157.5 | 2.7 | r-CS/CT-MC |
| 7d+sym (C2) (A/BAs-*-Br) | 0.0754 | 0.0057 | −0.0296 | 0.0302 | 169.2 | 0.358 | 176.5 | 6.9 | r-CS/CT-MC |
| 7d+nsym (C3) (AAs--*--Br) | 0.0464 | 0.0101 | −0.0098 | 0.0140 | 134.2 | 0.743 | 198.7 | 46.2 | r-CS/CT-TBP |
| (BAs-*-Br) | 0.1256 | −0.0038 | −0.0759 | 0.0760 | 182.9 | 0.504 | 178.4 | 14.9 | SS/Cov-w |
| 8a+sym (C3) (A/BSb-*-H) | 0.0689 | 0.0017 | −0.0267 | 0.0267 | 176.3 | 1.108 | 164.5 | 25.4 | r-CS/CT-MC |
| 8a+nsym (C1) (ASb--*--H) | 0.0220 | 0.0047 | −0.0019 | 0.0051 | 111.8 | 2.545 | 162.3 | 136.5 | r-CS/CT-MC |
| (BSb-*-H) | 0.1320 | 0.0098 | −0.0754 | 0.0760 | 172.6 | 0.357 | 153.0 | 1.4 | r-CS/CT-MC |
| 8b+sym (C3) (A/BSb-*-F) | 0.0632 | 0.0345 | −0.0072 | 0.0353 | 101.8 | 0.596 | 99.8 | 5.0 | r-CS/t-HBwc |
| 8b+nsym (C3) (ASb--*--F) | 0.0208 | 0.0096 | 0.0010 | 0.0096 | 84.3 | 1.821 | 102.6 | 66.6 | p-CS/t-HBnc |
| (BSb-*-F) | 0.1353 | 0.1004 | −0.0465 | 0.1106 | 114.8 | 0.200 | 121.6 | 1.5 | r-CS/t-HBwc |
| 8c+sym (D3) (A/BSb-*-Cl) | 0.0640 | 0.0162 | −0.0183 | 0.0244 | 138.5 | 0.418 | 124.0 | 7.8 | r-CS/t-HBwc |
| 8c+nsym (C3) (ASb--*--Cl) | 0.0336 | 0.0094 | −0.0051 | 0.0107 | 118.7 | 0.908 | 154.0 | 4.6 | r-CS/CT-MC |
| (BSb-*-Cl) | 0.1130 | 0.0314 | −0.0488 | 0.0580 | 147.3 | 0.272 | 134.6 | 2.0 | r-CS/t-HBwc |
Intrinsic dynamic and static natures of APn-*-X and BPn-*-X in 1a+–8c+, elucidated with QTAIM-DFA
The natures of the interactions in question in the optimized minimal species are mainly discussed in this section. Fig. 5 shows the QTAIM-DFA plots of Hb(rc) versus Hb(rc) − Vb(rc)/2, although the data are limited to those for A/BPn-*-X in mx+sym (see Table 2 for the data), while those for APn--*--X and BPn-*-X in mx+nsym are shown in Fig. S7 of the ESI.† Data from the perturbed structures generated with CIV are also employed for the plot. The 17 (data) points appeared in the SS region. While the plots for others than those above appeared in the r-CS region, except for three, which appeared in the p-CS region (see Fig. 5 and S7 of the ESI† for the interactions and the species). The results imply that APn-*-X, APn--*--X and BPn-*-X show various natures of the wide ranges over the p-CS to SS regions.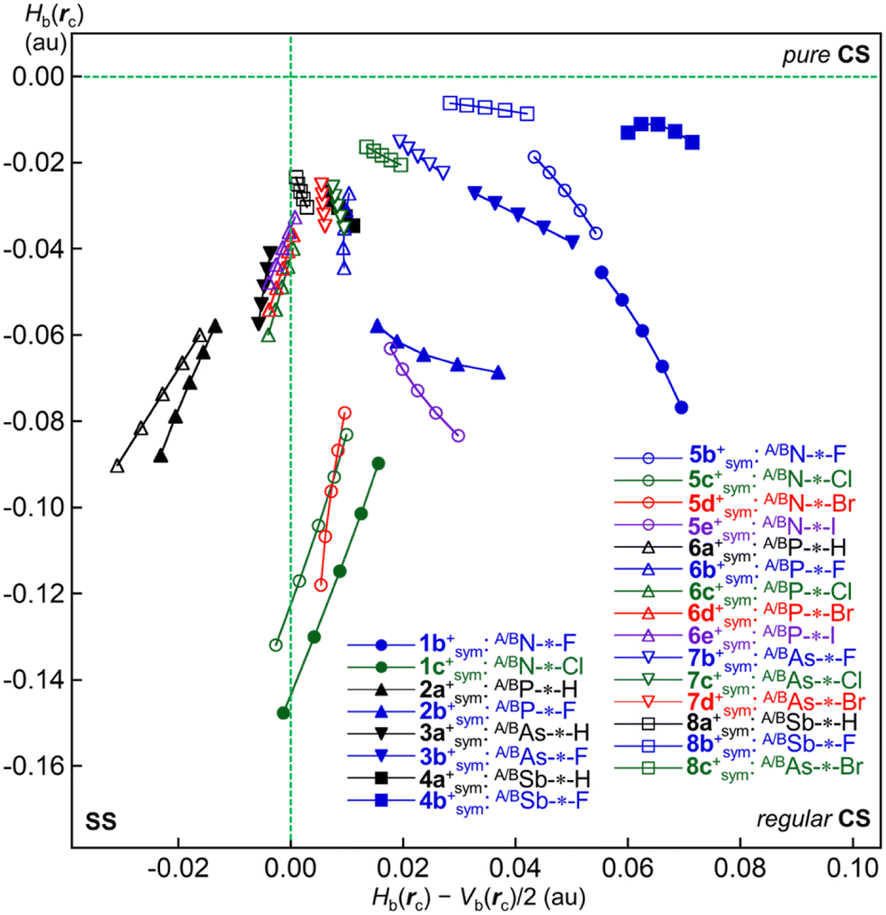 | ||
| Fig. 5 QTAIM-DFA plots of A/BPn-*-X in mx+sym for 1b+, 1c+, 2a+, 2b+, 3a+, 3b+, 4a+, 4b+, 5b+–5e+, 6a+–6e+, 7b+–7d+ and 8a+–8c+. See Table 2 for the values of Hb(rc) and Hb(rc) − Vb(rc)/2. | ||
The plots were analysed according to eqn (SA3)–(SA6) of the ESI.† (See the appendix in the ESI for eqn (SA3)–(SA6) and Fig. SA1†). The θ values of 180° < θ < 206.6° correspond to the shared-shell (SS) interactions of Hb(rc) − Vb(rc)/2 < 0, and the values less than 180° (θ < 180°) do to the closed-shell (CS) interactions of Hb(rc) − Vb(rc)/2 > 0. The CS interactions are subdivided into regular CS (r-CS) interactions by 90° < θ < 180° (Hb(rc) < 0 and Hb(rc) − Vb(rc)/2 > 0) and pure CS (p-CS) interactions by 45° < θ < 90° (Hb(rc) > 0 and Hb(rc) − Vb(rc)/2 > 0). The classical covalent interactions (Cov) of SS are subdivided by R into strong (Cov-s: R > 0.15 au) and weak (Cov-w: R < 0.15 au).
While the typical HB (t-HB) nature with covalency (t-HBwc), molecular complex formation through CT (CT-MC), and TBP adduct formation through CT (CT-TBP) are contained in r-CS, the t-HB nature with no covalency (t-HBnc) and van der Waals interactions (vdW) belong to p-CS. The nature of each Pn-*-X interaction in 1a+–8c+ was classified and characterized with the QTAIM-DFA parameters of (R, θ, θp), employing the criteria as guidance. Table 2 lists the analysed QTAIM-DFA parameters of (R, θ) and (θp, κp), along with the Cii values, corresponding to generate the perturbed structures, evaluated with MP2/BSS-B. Table 2 also provides the intrinsic dynamic and static natures predicted for the interactions.
After careful examination of (θ, θp) for standard interactions, the borderlines between the CS interactions were determined as follows: The (θ, θp) values of (75°, 90°), (90°, 125°), (115°, 150°), (150°, 180°) and (180°, 190°) correspond to the borderlines between vdW/t-HBnc, t-HBnc/t-HBwc, t-HBwc/CT-MC, CT-MC/CT-TBP and CT-TBP/Cov-w, respectively. The parameters in bold are superior to those in plain font in the prediction of the natures, while those in plain font are provided as tentative ones.
While θ classifies the interactions, θp characterizes them. The (R, θ, θp) values are (0.162–0.332 au, 182.4–199.6°, 128.3–206.6°), for AN--*--H and BN-*-H (1a+nsym), BN-*-F (1b+nsym and 5b+nsym), BP-*-H (2a+nsym and 6a+nsym), BN-*-H (5a+nsym) and BP-*-Br (6d+nsym); therefore, the interactions are predicted to have the SS/Cov-s nature. Similarly, the (R, θ, θp) values were (0.040–0.147 au, 181.8–197.2°, 168.3–206.0°) for A/BP-*-H (2a+sym and 6a+nsym), A/BAs-*-H (3a+sym), BAs-*-H (3a+nsym and 7a+nsym), AN--*--H (5a+nsym), A/BP-*-Cl (6c+sym), A/BP-*-Br (6d+sym), A/BP-*-I (6e+sym) and BAs-*-Br (7d+nsym); thus, these were predicted to be the SS/Cov-w nature. In the case of CS interactions, the r-CS/CT-TBP nature was predicted for A/BN-*-Cl (1c+sym and 5c+sym), AP--*--H (2a+nsym), AAs--*--H (3a+nsym), A/BN-*-Br (5d+sym), A/BP-*-F (6b+sym), AP--*--Br (6d+nsym) and AAs--*--Br (7d+nsym), of which the (θ, θp) values were (134.2–177.3°, 180.8–198.7°). The r-CS/CT-MC nature was predicted for A/BN-*-F (1b+sym), AP--*--F (2b+nsym), ASb--*--H/BSb-*-H (4a+nsym and 8a+nsym), AP--*--Cl (6c+nsym), AAs--*--H (7a+nsym), A/BAs-*-Cl (7c+sym), AAs--*--Cl/BAs-*-Cl (7c+nsym), A/BAs-*-Br (7d+sym), A/BSb-*-H (8a+sym) and ASb--*--Cl (8c+nsym), due to the (θ, θp) values of (99.7–176.3°, 153.0–176.5°).
The r-CS/t-HBwc nature was predicted for AN--*--F (1b+nsym and 5b+nsym), A/BP-*-F (2b+sym), BP-*-F (2b+nsym and 6b+nsym), A/BAs-*-F (3b+sym and 7b+sym), AAs--*--F (3b+nsym), BAs-*-F (3b+nsym and 7b+nsym), A/BSb-*-H (4a+sym), A/BSb-*-F (4b+sym and 8b+sym), A/BN-*-F (5b+sym), A/BN-*-I (5b+sym), AP--*--H (6a+nsym), BP-*-Cl (6c+nsym), BSb-*-F (8b+nsym), A/BSb-*-Cl (8c+sym) and BSb-*-Cl (8c+nsym), of which (θ, θp) values were (92.5–175.9°, 99.8–149.6°). The (θ, θp) values for AP--*--F (6b+nsym), AAs--*--F (7b+nsym) and ASb--*--F (8b+nsym) were (78.9–84.3°, 91.0–102.6°); thus, they were predicted to be the p-CS/t-HBnc nature.
The differences between θ and θp (Δθp = θp − θ) are positive for usual interactions, which show normal behaviour. However, the Δθp values are sometimes negative, which show inverse behaviour. The inverse versus normal behaviour of interactions in relation to the Δθp values, which we proposed recently, would correspond to some basic properties of interactions.61 The inverse behaviour is often observed when the interaction occurs between the atoms, of which atomic numbers are (very) large. Such cases can be easily found in Table 2. The abnormal character of Gb(rc) at the BCP for the interactions seems responsible for the inverse behaviour.
While the negative ∇2ρb(rc) values (= 8m/ħ2(Hb(rc) − Vb(rc)/2)) were predicted for some interactions, irrespective of the negative ΔrCov(A/BPn–X) values, which were examined in more detail through the negative Laplacian maps. Fig. 6 shows the maps for 5a+tp:TS, 5a+nsym, 6b+nsym, 6c+nsym, 7b+nsym and 8a+nsym, where the maps for 5a+tp:TS and 5a+nsym were very close to those previously reported.62 Similar maps for those other than those above are shown in Fig. S8 and S9 of the ESI.† The negative ∇2ρ(r) area near the electronegative atoms around the BPn–X interactions was more widely extended relative to that near the electropositive atoms for 2b+nsym, 3b+nsym, 4a+nsym, 6b+nsym, 6c+nsym, 7b+nsym, 7c+nsym, 8a+nsym, 8b+nsym and 8c+nsym, along with A/BPn–X one in 4b+sym.
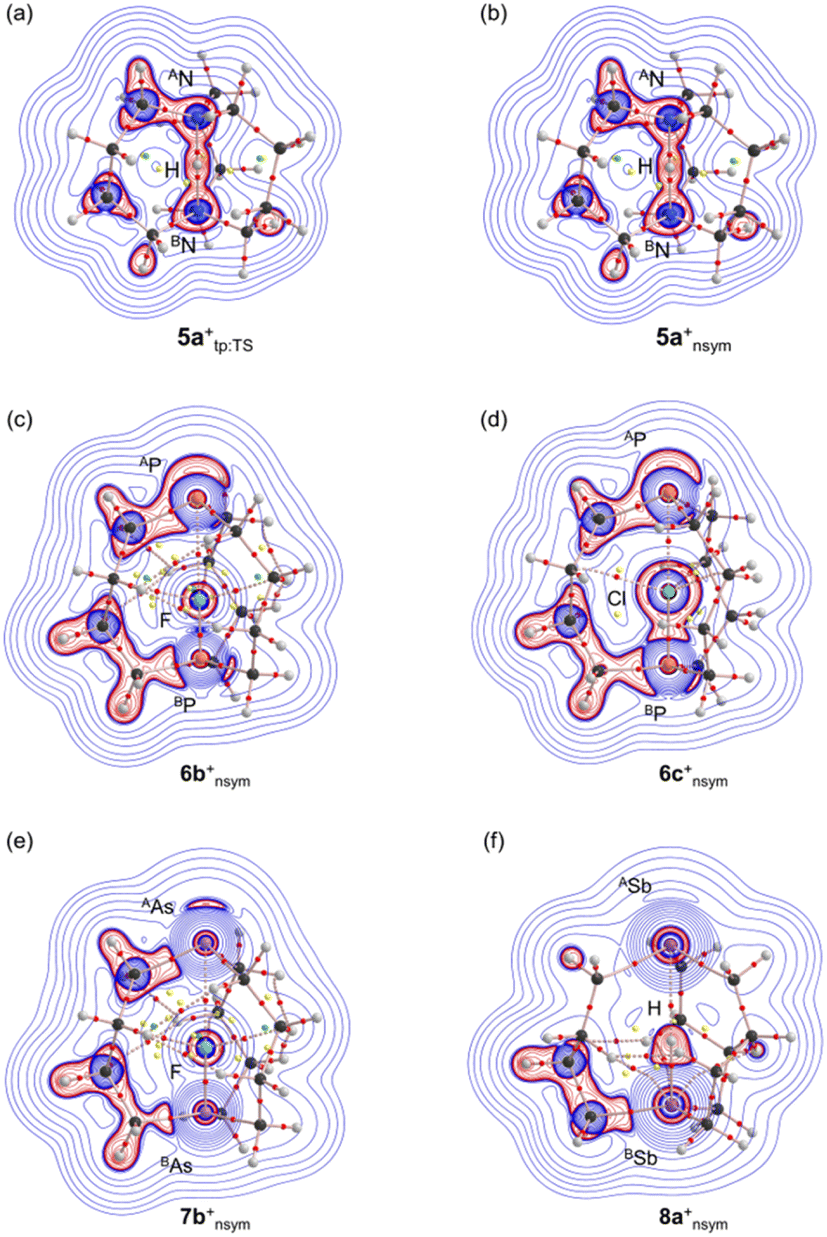 | ||
| Fig. 6 Negative Laplacian maps of 5a+tp:TS, 5a+nsym, 6b+nsym, 6c+nsym, 7b+nsym and 8a+nsym ((a)–(f), respectively), evaluated with MP2/BSS-B. The BCPs are denoted by red dots, RCPs (ring critical points) by yellow dots, CCPs (cage critical points) by green dots and BPs by pink lines. Carbon, hydrogen, phosphorus, arsenic, antimony, fluorine and chlorine atoms are shown in black, grey, orange, light purple, purple, light green and green, respectively. Contour plots are drawn on the planes containing at least APn, BPn and X. The red and blue lines correspond to the negative and positive areas of ∇2ρ(r), respectively. | ||
Cremer and Kraka reported that the homonuclear covalent bonds resided in the negative ∇2ρb(rc) area, except for F2, whereas the positive ∇2ρb(rc) values sometimes appeared around the heteronuclear bonds.63 They also demonstrated that distances from the hydrogen atoms to the BCPs changed depending on the differences in the electronegativities of the interacting atoms. As a result, the BCPs moved towards the electropositive atoms rather than the electronegative ones since the electronegative atoms were more negatively charged than the electropositive ones. Similar conditions were observed for BP-*-F (2b+nsym and 6b+nsym), BAs-*-F (3b+nsym and 7b+nsym), BSb-*-H (4a+nsym and 8a+nsym), A/BSb-*-F (4b+sym), BP-*-Cl (6c+nsym), BAs-*-Cl (7c+nsym), BSb-*-F (8b+nsym) and BSb-*-Cl (8c+nsym).
Hb(rc) is a better indicator than ∇2ρb(rc) to elucidate the nature of the CS interactions.63 The Hb(rc) values for all Pn⋯X⋯Pn bonds in question collected in Table 2 are arranged increasing order, which is shown in eqn (S1) of ESI.† Eqn (4)–(6) show the partial orders from eqn (S1) of ESI† for X = H, X = F, and X = Cl, Br and I, respectively. Eqn (4) shows that (1) Hb(rc) for Pn-*-H increases in the order of BPn-*-H (ma+nsym) < A/BPn-*-H (ma+sym) < APn--*--H (ma+nsym); (2) regarding m, Hb(rc) increases in the order of m = (1 and 5: Pn = N) < (2 and 6: Pn = P) < (3 and 7: Pn = As) < (4 and 8: Pn = Sb); (3) the order in (2) is clearly observed for the strong interactions in BPn-*-H and A/BPn-*-H whereas the order becomes vague for the weak APn--*--H. In the case of eqn (5), the trends for X = F are very close to that observed X = H in eqn (4), although some discrepancies are observed in the order, such as AN--*--F (1b+nsym: −0.016 and 5b+nsym: −0.0015) and A/BP-*-F (2b+sym: −0.065 and 6b+sym: −0.035). The order in eqn (6) implies that (1) Hb(rc) of Pn-*-X increases in the order of X = Cl < Br < I; (2) the same order for Hb(rc) of BPn-*-X (mx+nsym) < A/BPn-*-X (mx+sym) < APn--*--X (mx+nsym) was also observed for X = Cl, Br, and I. However, the order becomes unclear between BPn-*-X (mx+nsym) and A/BPn-*-X (mx+sym); (3) the difference in the reactivity between the bicyclo[4.4.4] system versus the bicyclo[3.3.3] system becomes much larger for X = Cl, Br, and I, if compared with the case of X = H and F.
Order of Hb(rc) for Pn-*-X (X = H):
| BN-*-H (1a+nsym: Hb(rc)/au = −0.296) < BN-*-H (5a+nsym: −0.252) < BP-*-H (2a+nsym: −0.221) < BP-*-H (6a+nsym: −0.204) < AN--*--H (1a+nsym: −0.181) < BAs-*-H (3a+nsym: −0.146) < BAs-*-H (7a+nsym: −0.134) < AN--*--H (5a+nsym: −0.129) < BSb-*-H (8a+nsym: −0.075) ≤ BSb-*-H (4a+nsym: −0.0744) ≤ A/BP-*-H (6a+sym: −0.0736) < A/BP-*-H (2a+sym: −0.071) < A/BAs--*--H (3a+sym: −0.049) < A/BSb-*-H (4a+sym: −0.030) < A/BSb-*-H (8a+sym: −0.027) < AP--*--H (2a+nsym: −0.0108) ≤ AAs--*--H (3a+nsym: −0.0101) < ASb--*--H (4a+nsym: −0.0097) < ASb--*--H (8a+nsym: −0.0019) ≤ AAs--*--H (7a+nsym: −0.0014) ≤ AP--*--H (6a+nsym: −0.0003) | (4) |
Order of Hb(rc) for Pn-*-X (X = F):
| BN-*-F (1b+nsym: Hb(rc)/au = −0.332) < BN-*-F (5b+nsym: −0.283) < BP-*-F (2b+nsym: −0.134) < BP-*-F (6b+nsym: −0.125) < BAs-*-F (3b+nsym: −0.120) < BAs-*-F (7b+nsym: −0.109) < A/BP-*-F (2b+sym: −0.065) < A/BN-*-F (1b+sym: −0.059) < BSb-*-F (8b+nsym: −0.047) < A/BP-*-F (6b+sym: −0.035) < A/BAs-*-F (3b+sym: −0.032) < A/BN-*-F (5b+sym: −0.0264) < A/BAs-*-F (7b+sym: −0.019) < AN--*--F (1b+nsym: −0.016) < A/BSb-*-F (4b+sym: −0.0111) < A/BSb-*-F (8b+sym: −0.0072) < AP--*--F (2b+nsym: −0.0039) ≤ AAs--*--F (3b+nsym: −0.0036)) < AN--*--F (5b+nsym: −0.0015) ≤ ASb--*--F (8b+nsym: 0.0010) ≤ AAs--*--F (7b+nsym: 0.0020) ≤ AP--*--F (6b+nsym: 0.0023) | (5) |
Order of Hb(rc) for Pn-*-X (X = Cl, Br, and I):
| BP-*-Cl (6c+nsym: Hb(rc)/au = −0166) < BP-*-Br (6d+nsym: −0.159) > A/BN-*-Cl (1c+sym: −0.115) < A/BN-*-Cl (5c+sym: −0.104) < BAs-*-Cl (7c+nsym: −0.097) ≤ A/BN-*-Br (5d+sym: −0.096) < BAs-*-Br (7d+nsym: −0.076) < A/BN-*-I (5e+sym: −0.0729) < A/BP-*-Cl (6c+sym: −0.04881) ≤ BSb-*-Cl (8c+nsym: −0.04880) < A/BP-*-Br (6d+sym: −0.045) < A/BP-*-I (6e+sym: −0.040) < A/BAs-*-Cl (7c+sym: −0.0301) ≤ A/BAs-*-Br (7d+sym: −0.0296) < A/BSb-*-Cl (8c+sym: −0.018) < AP--*--Br (6d+nsym: −0.0109) ≤ AAs--*--Br (7d+nsym: −0.0098) < AP--*--Cl (6c+nsym: −0.0074) ≤ AAs--*--Cl (7c+nsym: −0.0061) ≤ ASb--*--Cl (8c+nsym: −0.0051) | (6) |
The strengths of interactions become weakened inversely proportional to Hb(rc) being increased. Therefore, the orders in eqn (4) and (5) show the rough orders of the strengths of the interactions being weakened. However, some deviations were observed.
What is the behaviour of Hb(rc) in 1a+–8c+? Fig. 7 shows the plot of Hb(rc) versus ρb(rc) for the sym and nsym shapes of 1a+–8c+ (see Table 2 for the data). The plot was analysed, assuming the linear correlations, by the four groups of Group A (G(A)), G(B), G(C) and G(D). The correlations are very good for G(A) (y = 0.090–1.57x: Rc2 = 0.992), G(B) (y = 0.099–1.35x: Rc2 = 0.987) and G(C) (y = 0.136–1.38x: Rc2 = 0.994) and fairly good for G(D) (y = 0.007–0.35x: Rc2 = 0.78). The plot for G(A) appears most downside of the four and that for G(C) does most upside, while that for G(B) exists between the two. The data for G(D) correspond to those from the much weaker bonds of APn--*--X in the nsym shapes; therefore, the (data) points are located near the origin of the plots. The correlation constant for G(D) is about one-fourth to one-fifth of those for G(A), G(B) and G(C). Most of the data are contained in G(A), which consists of the data from 14 sym shapes and seven nsym shapes. G(B) contains those from five sym shapes and eight nsym shapes. While G(C) contains four sym shapes seven nsym shapes G(D) does those for 16 nsym shapes, except for four (see Fig. 7 for the interactions and the species).
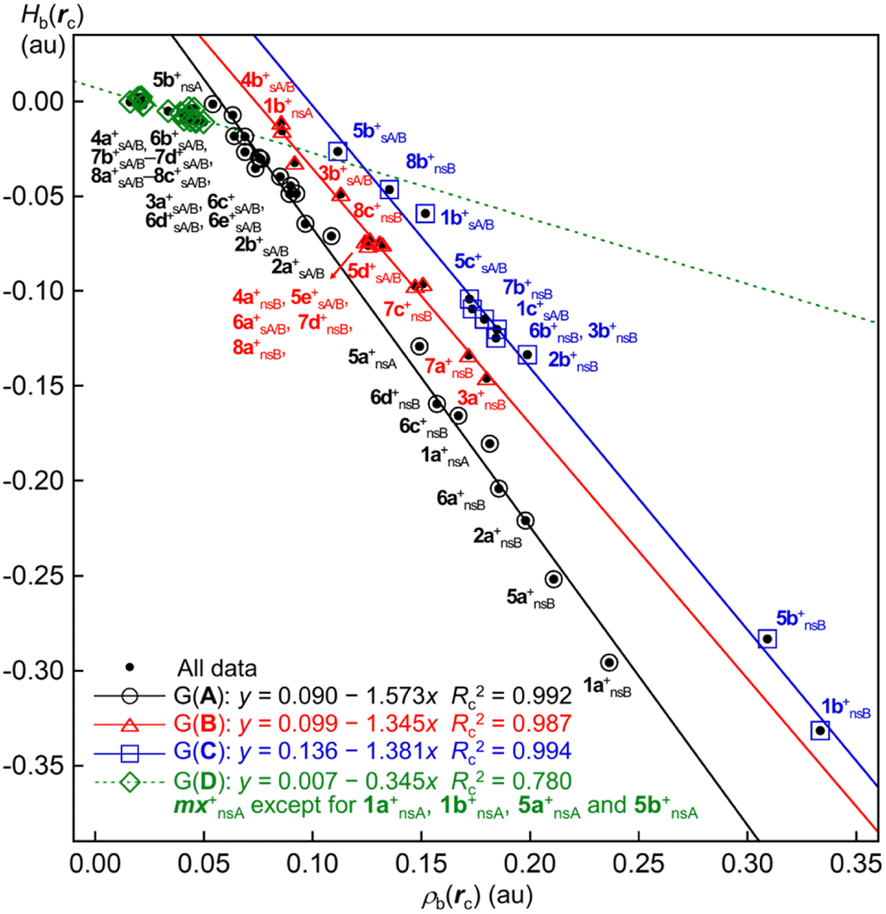 | ||
| Fig. 7 Plots of Hb(rc) versus ρb(rc) for Pn-*-X in 1a+–8c+, evaluated with MP2/BSS-B. | ||
The trend in the correlations can be variously explained, but our explanation is as follows: Almost common mechanisms are operating to give Hb(rc) and ρb(rc) for both sym and nsym shapes of 1a+–8c+. The mechanisms to give Hb(rc) and/or ρb(rc) would be very similar for most species but somewhat different for some species. The species with the negligibly small differences in the mechanisms forms a group of G(A), G(B), G(C) or G(D); however, there are some differences among the groups.
The natures of the secondary interactions of X--*--C and H--*--H for 1–8 and 1a+–8c+ were also investigated with MP2/BSS-B, along with APn--*--BPn of 1, 5 and 6. The QTAIM functions and QTAIM-DFA parameters are provided in Table S6 of the ESI,† along with the Cii values, corresponding to generate the perturbed structures, and the predicted natures. Various natures of p-CS/vdW, p-CS/t-HBnc, r-CS/t-HBwc and r-CS/CT-MC were predicted for X--*--C and H--*--H, together with APn--*--BPn. These interactions contributed to stabilizing the system, in addition to A/BPn-*-X, APn--*--X and BPn-*-X.
The natures were also elucidated for the interactions in question in the transition states. The analysed results by QTAIM-DFA are collected in Table S7 of the ESI,† along with molecular graphs and negative Laplacian maps shown in Fig. S10 and S11 of the ESI,† respectively.
Second-perturbation energies E(2)
The contributions from the CT terms of NBO(i)→NBO(j) to 1a+–8c+ were estimated through the second-perturbation energies (E(2)), calculated using the NBO analysis with M06-2X/BSS-B//MP2/BSS-B. Table 3 lists the E(2) values for 1a+–8c+. Several types of the CT terms contribute to stabilize the species. The first is the n(APn)→σ*(X–BPn) type, which operates in 17 species. The E(2) values are shown in parenthesis after the compound: The values larger than 30 kcal mol−1 are 1a+nsym (E(2) = 78 kcal mol−1), 5a+nsym (80 kcal mol−1), 1b+sym (344 kcal mol−1), 1c+sym (230 kcal mol−1), 2b+sym (565 kcal mol−1), 5b+sym (243 kcal mol−1), 5c+sym (191 kcal mol−1), 5d+sym (171 kcal mol−1), 5e+sym (132 kcal mol−1), 6a+sym (288 kcal mol−1), 6c+sym (357 kcal mol−1), 7c+sym (506 kcal mol−1), 8a+sym (349 kcal mol−1), 8b+sym (429 kcal mol−1), and 8c+sym (762 kcal mol−1). The E(2) values for the nsym shapes are small to moderate, whereas the values are very large for the sym shapes. The shorter interaction distances in the sym shapes would be responsible for the results.| Species (APn (BPn), X) | NBO(i)→NBO(j) | E(2)b (kcal mol−1) | F(i,j)c (au) | Species (APn (BPn), X) | NBO(i)→NBO(j) | E(2)b (kcal mol−1) | F (i,j)c (au) |
|---|---|---|---|---|---|---|---|
| a See Table 1 for BSS-B.b Second-perturbation energy.c The off-diagonal NBO Fock matrix elements.d Detected as σ(3c–4e).e Six CT contributions are detected.f Total values are given in parenthesis.g Three CT contributions are detected.h No CT contributions in question are detected. | |||||||
| 1a+nsym (N, H) | n(AN)→σ*(H–BN) | 77.6 | 0.212 | 6a+sym (P, H) | n(A/BP)→σ*(H–B/AP) | 288.1d | 0.256 |
| 1b+sym (N, F) | n(A/BN)→σ*(F–B/AN) | 344.2d | 0.198 | 6a+nsym (P, H) | σ(AP–C)→σ*(H–BP) | 4.2g (12.6)f | 0.052 |
| 1b+nsym (N, F) | n(AN) → σ*(F–BN) | 11.1 | 0.064 | 6b+sym (P, F) | n(F)→σ*(AP–BP) | 101.8 | 0.171 |
| 1c+sym (N, Cl) | n(A/BN)→σ*(Cl–B/AN) | 229.6d | 0.277 | 6b+nsym (P, F) | h | h | h |
| 2a+sym (P, H) | n(AP/BP)→s(H+) | 31.9 | 0.060 | 6c+sym (P, Cl) | n(A/BP)→σ*(Cl–B/AP) | 356.9d | 0.171 |
| σ(AP–C/BP–C)→s(H+) | 55.8e (334.8)f | 0.134 | 6c+nsym (P, Cl) | σ(AP–C)→σ*(Cl–BP) | 1.4g (4.1)f | 0.031 | |
| 2a+nsym (P, H) | σ(AP–C)→σ*(H–BP) | 10.1g (30.3)f | 0.083 | 6d+sym (P, Br) | σ(AP–C/BP–C)→n(Br+) | 61.5e (369.2)f | 0.116 |
| 2b+sym (P, F) | n(AP)→σ*(F–BP) | 565.0 | 0.142 | 6d+nsym (P, Br) | σ(AP–C)→σ*(Br–BP) | 8.3g (24.8)f | 0.066 |
| 2b+nsym (P, F) | σ(AP–C)→σ*(F–BP) | 1.2g (3.6)f | 0.027 | 6e+sym (P, I) | σ(AP–C/BP–C)→n(I+) | 58.9e (353.2)f | 0.122 |
| 3a+sym (As, H) | σ(AAs–C/BAs–C)→s(H+) | 74.6e (447.6)f | 0.138 | 7a+nsym (As, H) | σ(AAs–C)→σ*(H–BAs) | 7.0g (21.0)f | 0.065 |
| 3a+nsym (As, H) | σ(AAs–C)→σ*(H–BAs) | 13.5g (40.5)f | 0.091 | 7b+sym (As, F) | n(F)→σ*(AAs–BAs) | 80.0 | 0.147 |
| 3b+sym (As, F) | σ(AAs–C)→σ*(F–BAs) | 3.3g (9.8)f | 0.037 | 7b+nsym (As, F) | h | h | h |
| 3b+nsym (As, F) | σ(AAs–C)→σ*(F–BAs) | 1.2g (3.6)f | 0.025 | 7c+sym (As, Cl) | n(A/BAs)→σ*(Cl–B/AAs) | 505.8d | 0.151 |
| 4a+sym (Sb, H) | σ(ASb–C/BSb–C)→s(H+) | 94.3e (565.7)f | 0.123 | 7c+nsym (As, Cl) | σ(AAs–C)→σ*(Cl–BAs) | 4.3g (12.8)f | 0.046 |
| 4a+nsym (Sb, H) | σ(ASb–C)→σ*(H–BSb) | 14.3g (43.0)f | 0.086 | 7d+sym (As, Br) | σ(AAs–C/BAs–C)→n(Br+) | 76.6e (459.5)f | 0.111 |
| 4b+sym (Sb, F) | n(F)→n(Sb+) | 66.8 | 0.066 | 7d+nsym (As, Br) | σ(AAs–C)→σ*(Br–BAs) | 9.9g (29.7)f | 0.067 |
| 5a+nsym (N, H) | n(A/BN)→σ*(H–B/AN) | 80.4d | 0.220 | 8a+sym (Sb, H) | n(A/BSb)→σ*(H–B/ASb) | 348.6d | 0.184 |
| 5b+sym (N, F) | n(A/BN)→σ*(F–B/AN) | 242.7d | 0.162 | 8a+nsym (Sb, H) | σ(ASb–C)→σ*(H–BSb) | 6.7g (20.0)f | 0.059 |
| 5b+nsym (N, F) | n(AN)→σ*(F–BN) | 12.0 | 0.058 | 8b+sym (Sb, F) | n(ASb)→σ*(F–BSb) | 429.2 | 0.086 |
| 5c+sym (N, Cl) | n(A/BN)→σ*(Cl–B/AN) | 191.4d | 0.259 | 8b+nsym (Sb, F) | n(F)→σ*(ASb–C) | 1.7g (5.1)f | 0.042 |
| 5d+sym (N, Br) | n(A/BN)→σ*(Br–B/AN) | 170.5d | 0.251 | 8c+sym (Sb, Cl) | n(A/BSb)→σ*(Cl–B/ASb) | 762.1d | 0.130 |
| 5e+sym (N, I) | n(A/BN)→σ*(I–B/AN) | 131.8d | 0.231 | 8c+nsym (Sb, Cl) | σ(ASb–C)→σ*(H–BSb) | 2.9g (8.6)f | 0.035 |
The second is the σ(APn–C/BPn–C)→np(X+) type, which operates in 6 species of 2a+sym (335 kcal mol−1), 3a+sym (448 kcal mol−1), 4a+sym (566 kcal mol−1), 6d+sym (369 kcal mol−1), 6e+sym (353 kcal mol−1) and 7d+sym (460 kcal mol−1). Total six equivalent σ(Pn–C) bonds from three σ(APn–C) and three σ(BPn–C) bonds contribute to this type; therefore, the total contribution is six times larger than that of each contribution. The total values are also very large. The third case is the σ(APn–C)→σ*(X–BPn) form, which operates in 14 species. The total contribution is three times larger than that of each contribution. The total contributions larger than 30 kcal mol−1 are 3a+nsym (41 kcal mol−1), 4a+nsym (43 kcal mol−1). The fourth is the np(F)→σ*(APn–BPn), which operated in 6b+sym (102 kcal mol−1) and 7b+sym (80 kcal mol−1). Other cases of which contributions larger than 10 kcal mol−1 are n(AP/BP)→σ(H+) (32 kcal mol−1) in 2a+sym and n(F)→n(Sb+) (67 kcal mol−1) in 4b+sym.
The high contributions from the CT terms mainly arise from the n(APn)→σ*(X–BPn) types. The σ(APn–C/BPn–C)→np(X+) type interactions also have the substantially high contributions. The reason for the contributions was intriguing at first glance but it would be difficult to explain. The reason could be interpreted by considering the through space and the through bond mechanisms. The contributions increased rapidly as the interaction distances became shorter. The contributions in question could be understood based on the same reason. A similar mechanism would also operate in the CT interactions in σ(APn–C/BPn–C)→np(X+).
The very high contributions from the of n(APn)→σ*(X–BPn) type, accompanied by the very large E(2) values, must correlate deeply to the (very) high p-characters in n(APn). The occupancy ratios between s- and p-characters in n(APn) were calculated under the same conditions. The results are shown in Table S8 of the ESI.† The planarity around APn will affect much to the ratio of the p-character, together with the energy difference between atomic s- and p-orbitals of APn. High ratios of p-characters over 70% were predicted for n(APn) in 1a+–1c+ (86.0–98.7%), 2b+ (97.6%), 3b+ (97.4%), 5a+–5e+ (84.4–99.6%), 6a+ (87.9%), 6c+ (96.2%), 7c+ (96.5%), 8a+ (92.6%), 8b+(97.7%) and 8c+ (96.3%). However, the predicted rations were 32.1–62.4% for the others. Indeed, high ratios of the p-characters are expected to enlarge E(2) for n(APn)→σ*(X–BPn), but the correlation between the ratio and E(2) seems unclear, as shown in Table 3. Other factors, such as the atomic types of APn, X and BPn, must also operate to control the E(2) values.
The NBO analysis demonstrated the large contributions from the APn--X--BPn and APn⋯X–BPn interactions and clarified the reasons for the high contributions from n(APn)→σ*(X–BPn). While the σ(APn–C/BPn–C)→np(X+) interactions also contribute much to stabilise the system, the contributions from σ(APn–C)→σ*(X–BPn) seem smaller. The contribution from n(F)→ns(Sb+) was also of interest. The n(F)→ns(Sb+) interaction, in place of np(Sb)→σ*(F–Sb), contributed to 4b+sym. A heavy CT occurred from Sb to F+ due to the very large electronegativity of F, relative to Sb, resulting in the formation of F and Sb+, which led to the above interaction, as listed in Table 3.
Characteristic nature of [Pn--X--Pn]+ with the behaviour of charge
What is the character of Pn--X+--Pn in 1a+–8c+? The ψ3, ψ2 and ψ1 orbitals of σ(3c–4e) are looked for among MOs in 1a+–8c+. Fig. 8 shows HOMO-5, HOMO and LUMO of 6c+sym, for example, which correspond to the orbitals, respectively. The results clearly demonstrate the σ(3c–4e) nature for Pn--X+--Pn.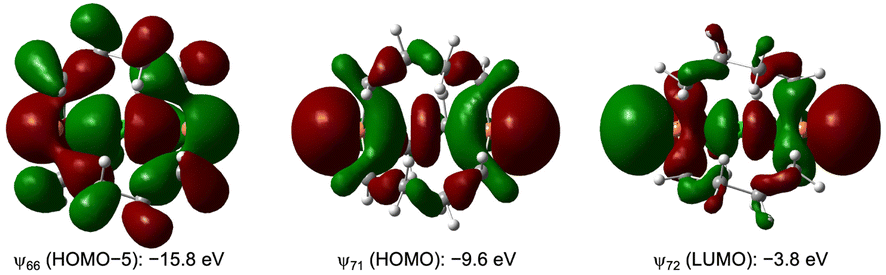 | ||
| Fig. 8 HOMO–5, HOMO and LUMO in 6c+sym (Pn = P, X = Cl), which correspond to ψ1, ψ2 and ψ3 of σ(3c–4e), respectively. | ||
How are the behaviour of Qn, in relation to σ(3c–4e)? The sym and nsym shapes are optimized for all 6a+–6e+, except for 6e+sym; therefore, it is convenient to discuss the overall trends in the changes of Qn, so are 5+, 7+ and 8+. Fig. 9 shows the plot of Qn(AP), Qn(X), Qn(BP) and Qn(Total) (= Qn(T) = Qn(AP) + Qn(X) + Qn(BP)) for 6a+sym–6e+sym and 6a+nsym–6d+nsym versus X. The values of Qn(AP), Qn(X), Qn(BP) and Qn(T) for 1–8 and 1a+–8c+ are collected in Table S8 of the ESI.†
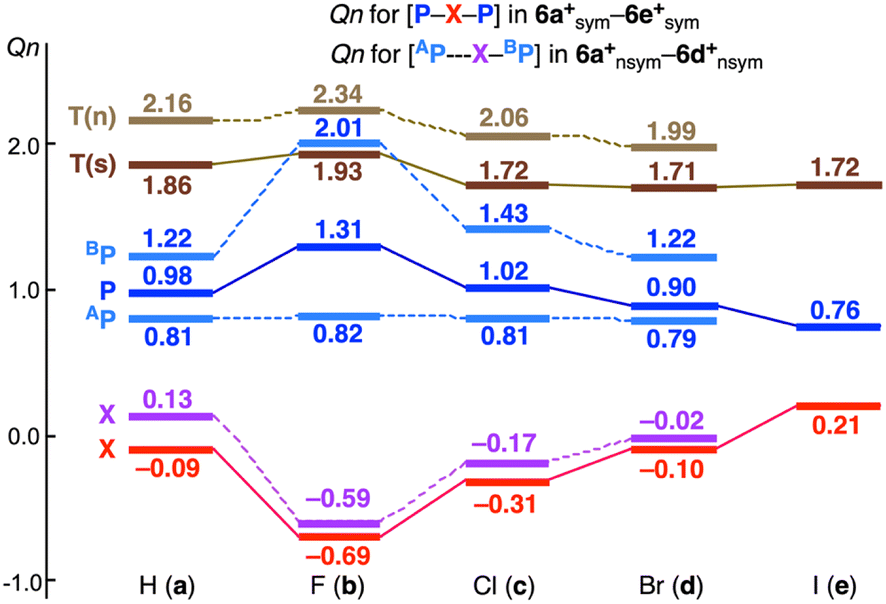 | ||
| Fig. 9 Plots of Qn(APn), Qn(X), Qn(BPn) and Qn(T) versus X for 6a+–6e+. | ||
The Qn(X) values in sym and nsym shapes of 6a+–6e+ become larger in the order of X = F < Cl < Br < I, as expected, where Qn(H) seems close to Qn(Cl) or Qn(Br). Qn(P) behaves the exact opposite of Qn(X). The exact opposite behaviour between Qn(P) (or Qn(BPn)) and Qn(X) are confirmed by examining Qn(T), which are almost constant for both shapes. It is noteworthy that Qn(AP) are almost constant in the nsym shapes, irrespective of the large changes in Qn(X) and Qn(BPn). The results may support the formation of the (very) strong BP–X bond with the (very) weak APn⋯X in the nsym shapes. The plots for 5+, 7+ and 8+, drawn in Fig. S12 of the ESI,† are very similar to that in Fig. 9.
It seems curious that the Qn(T) values of 6a+sym–6e+sym are close to 2 (e+), which is much larger than 1 (e+), originated from X+, at first glance. The results could be very different from those generally expected for the formation of σ(3c–4e). Fig. 10 explains the changes of Qn(A/BP) and Qn(X) in the formation of 6c+sym, starting from 6nsym + Cl+, via [6c+nsym]CT=0. Our explanation for the change in Qn is as follows. The mechanism for the change is explained by the three processes, starting from the neutral 6nsym + Cl+. (1) The Qn(APn/BPn) values in 6nsym are 0.78e+ and 0.82e+, respectively. (2) When Cl+ is incorporated into P⋯P of 6nsym, the double donation occurs from the lone pair electrons of P to the vacant p-orbital of Cl+. The Qn(Pn) and Qn(Cl) values would be 1.8e+ and −1.0e+, respectively, where the donated electrons are assumed to share equally between P and Cl. The primitive structure with no CT is denoted by [6c+nsym]CT=0. (3) The charges in P–Cl–P of [6c+nsym]CT=0 redistribute to form 6c+sym.
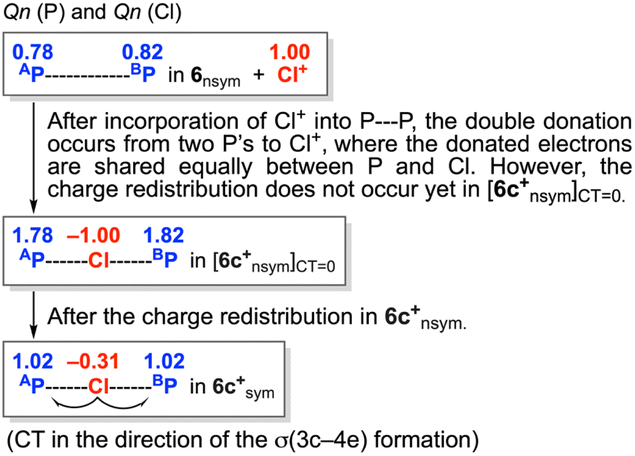 | ||
| Fig. 10 Changes in Qn(A/BPn) and Qn(X) in the formation of 6c+sym via [6c+nsym]CT=0. | ||
The CT occurs from [6c+nsym]CT=0 to 6c+sym, contrary to the electronegativities of P and Cl, in this process, resulting in Qn(Pn) = 1.02e+ and Qn(Cl) = −0.31e+. The σ(3c–4e) character of APn--X+--BPn is demonstrated again, through the examination of the changes of the charges on the atoms. Indeed, some Pn--X+--Pn interactions would not be typical σ(3c–4e), depending on the combination of Pn and X, but the bonds, analysed in this work, are recognized to be the σ(3c–4e) type, for the unified understanding of the bonds.
The σ-hole on a halogen atom must correlate deeply in the behavior of APn--X+--BPn and/or Pn⋯X+–Pn. Molecular electrostatic potentials (MEPs) will present a fine picture for the visualization. The MEPs are shown in Fig. S13 of the ESI,† exemplified by 6d+nsym, [H–C(CH2CH2CH2CH2)3P–Br]+ (9d+) and [H–C(CH2CH2CH2CH2)3P–I]+ (9e+).
Conclusions
The possibility of large atoms to incorporate in stable cage compounds of medium rings was examined with the atoms X of H (a), F (b), Cl (c), Br (d) and I (e). The skeletons of bicyclo[3.3.3]undecane and bicyclo[4.4.4]tetradecane were employed for the purpose, in which the bridgehead atoms were substituted by pnictogens (APn = BPn = N, P, As and Sb: 1x+–8x+). In this system, X acted as X+ to form the linear APn--X+--BPn σ(3c–4e) type interactions, which were fixed by the bicyclo systems. Moreover, 1+ (APn = BPn = N) was successfully optimized for X of each H, F and Cl, and 2x+ (APn = BPn = P), 3x+ (APn = BPn = As) and 4x+ (APn = BPn = Sb) were carefully optimized when X = H and F. In the case of 5x+ (APn = BPn = N) and 6x+ (APn = BPn = P) were successfully optimized for X of H, F, Cl, Br and I, 7x+ (APn = BPn = As) was optimized for X of H, F, Cl and Br, and 8x+ (APn = BPn = Sb) was optimized for X of H, F and Cl. The structures of the symmetric and nonsymmetric shapes were optimized for 1a+–8c+, with their relative stabilities, and their transition states. The symmetric shapes appeared to be more stabilized as APn, BPn and X became larger, with the exception of APn = BPn = N.The intrinsic dynamic and static natures of the Pn-*-X interactions were elucidated for 1a+–8c+ with QTAIM-DFA. Various natures from vdW to Cov-s were predicted. The BP-*-F (2b+nsym and 6b+nsym), BAs-*-F (3b+nsym and 7b+nsym), BSb-*-H (4a+nsym and 8a+nsym), A/BSb-*-F (4b+sym), BP-*-Cl (6c+nsym), BAs-*-Cl (7c+nsym), BSb-*-F (8b+nsym) and BSb-*-Cl (8c+nsym) interactions were predicted to be r-CS/t-HBwc or r-CS/CT-MC, respectively, although their r(A/BPn–X) were shorter than the rCov(A/BPn–X). In contrast, the SS/Cov-w or SS/Cov-s natures were predicted for BPn-*-X interactions than the above such as BN-*-H in 1a+nsym and 5a+nsym (with 1a+tp:TS and 5a+tp:TS). The secondary interactions of H-*-H and X-*-C were also detected, of which the predicted natures were p-CS/vdW, p-CS/t-HBnc, r-CS/t-HBwc and r-CS/CT-MC. They also contributed to stabilising the systems, along with the main interactions. The order of the interaction strengths was estimated using the Hb(rc) values.
The NBO analysis was applied to the interactions and evaluated the contributions from the CT terms to the interactions in question. Several types of NBO(i) to NBO(j) interactions were detected in this case. Among the several types, the np(APn)→σ*(X–BPn) interactions highly contributed, together with σ(APn–C)→σ*(X–BPn) and σ(APn–C/BPn–C)→np(X+). In the case of 4b+, the CT interaction was described by np(F)→ns(Sb+), not by np(Sb)→σ*(F–Sb). The very large electronegativity of F was likely responsible for the change. The charge distributions on the atoms of APn--X+--BPn were confirmed to show the σ(3c–4e) type behaviour.
Our results provide important insights into the nature of the interactions, especially the hypervalent 3c–4e interactions of the symmetric and nonsymmetric shapes, where the interactions are fixed linearly by the bicyclo systems. These interactions can also be considered as the extension of the hydrogen and halogen bonds. These results are useful to design materials containing X+, as in 1–8.
Author contributions
S. H. formulated the project. T. N. contributed to conceptualization, investigation and writing – original draft. W. N. and S. H. contributed to supervision, data curation, resources and writing – review & editing. All authors have read and agreed to the published version of the manuscript.Conflicts of interest
The authors declare no conflicts of interest.Acknowledgements
The computations were partially performed at the Research Centre for Computational Science, Okazaki, Japan.Notes and references
- W. Nakanishi, S. Hayashi and K. Narahara, J. Phys. Chem. A, 2009, 113, 10050–10057 CrossRef CAS PubMed.
- W. Nakanishi and S. Hayashi, Curr. Org. Chem., 2010, 14, 181–197 CrossRef CAS.
- W. Nakanishi and S. Hayashi, J. Phys. Chem. A, 2010, 114, 7423–7430 CrossRef CAS PubMed.
- W. Nakanishi, S. Hayashi, K. Matsuiwa and M. Kitamoto, Bull. Chem. Soc. Jpn., 2012, 85, 1293–1305 CrossRef CAS.
- S. Hayashi, K. Matsuiwa, M. Kitamoto and W. Nakanishi, J. Phys. Chem. A, 2013, 117, 1804–1816 CrossRef CAS PubMed.
- S. Hayashi, T. Nishide, W. Nakanishi, L. Sancineto and C. Santi, RSC Adv., 2019, 9, 39435–39446 RSC.
- G. Montà-González, F. Sancenón, R. Martínez-Máñez and V. Martí-Centelles, Chem. Rev., 2022, 122, 13636–13708 CrossRef PubMed.
- X. Yang, Z. Ullah, J. F. Stoddart and C. T. Yavuz, Chem. Rev., 2023, 123, 4602–4634 CrossRef CAS PubMed.
- R. W. Alder, Tetrahedron, 1990, 46, 683–713 CrossRef CAS.
- J. G. Verkade, Coord. Chem. Rev., 1994, 137, 233–295 CrossRef CAS.
- R. W. Alder and D. Read, Coord. Chem. Rev., 1998, 176, 113–133 CrossRef CAS.
- J. L. Vennerstrom, J. Med. Chem., 1989, 32, 64–67 CrossRef CAS PubMed.
- R. Gleiter, K. Hövermann, J. Ritter and B. Nuber, Angew. Chem., Int. Ed., 1995, 34, 789–791 CrossRef CAS.
- J. Kobayashi, K. Goto, T. Kawashima, M. W. Schmidt and S. Nagase, J. Am. Chem. Soc., 2002, 124, 3703–3712 CrossRef CAS PubMed.
- S. Nakafuji, J. Kobayashi, T. Kawashima and M. W. Schmidt, Inorg. Chem., 2005, 44, 6500–6502 CrossRef CAS PubMed.
- J. Kobayashi, K. Goto, T. Kawashima, M. W. Schmidt and S. Nagase, Chem.–Eur. J., 2006, 12, 3811–3820 CrossRef CAS PubMed.
- J. Kobayashi and T. Kawashima, C. R. Chim., 2010, 13, 1249–1259 CrossRef CAS.
- J. Tang, J. Dopke and J. G. Verkade, J. Am. Chem. Soc., 1993, 115, 5015–5020 CrossRef CAS.
- P. B. Kisanga, J. G. Verkade and R. Schwesinger, J. Org. Chem., 2000, 65, 5431–5432 CrossRef CAS PubMed.
- J. G. Verkade, New Aspects in Phosphorus Chemistry II, ed. J. P. Majoral, Springer, Berlin, Heidelberg, 2003, pp. 1–44 Search PubMed.
- M.-Y. Xu, W.-T. Jiang, Y. Li, Q.-H. Xu, Q.-L. Zhou, S. Yang and B. Xiao, J. Am. Chem. Soc., 2019, 141, 7582–7588 CrossRef CAS PubMed.
- D. Tanaka, A. Konishi and M. Yasuda, Chem.–Asian J., 2021, 16, 3118–3123 CrossRef CAS PubMed.
- M.-Y. Xu and B. Xiao, Chem. Commun., 2021, 57, 11764–11775 RSC.
- J. K. Puri, R. Singh and V. K. Chahal, Chem. Soc. Rev., 2011, 40, 1791–1840 RSC.
- S. N. Adamovich, Appl. Organomet. Chem., 2019, 33, e4940 CrossRef.
- V. V. Istratov, V. A. Vasnev and G. D. Markova, Molecules, 2021, 26, 1893 CrossRef CAS PubMed.
- S. N. Adamovich, I. A. Ushakov, E. N. Oborina, S. V. Lukyanova and V. Y. Komarov, Int. J. Mol. Sci., 2023, 24, 9965 CrossRef CAS PubMed.
- R. W. Alder, R. B. Sessions, J. M. Mellor and M. F. Rawlins, J. Chem. Soc., Chem. Commun., 1977, 747–748 RSC.
- R. W. Alder and R. B. Sessions, J. Am. Chem. Soc., 1979, 101, 3651–3652 CrossRef CAS.
- R. W. Alder, D. D. Ellis, R. Gleiter, C. J. Harris, H. Lange, A. G. Orpen, D. Read and P. N. Taylor, J. Chem. Soc., Perkin Trans., 1998, 1, 1657–1668 RSC.
- R. W. Alder, C. P. Butts, A. G. Orpen and D. Read, J. Chem. Soc., Perkin Trans., 2001, 2, 288–295 RSC.
- R. W. Alder, A. Casson and R. B. Sessions, J. Am. Chem. Soc., 1979, 101, 3652–3653 CrossRef CAS.
- R. W. Alder, R. J. Arrowsmith, A. Casson, R. B. Sessions, E. Heilbronner, B. Kovac, H. Huber and M. Taagepera, J. Am. Chem. Soc., 1981, 103, 6137–6142 CrossRef CAS.
- R. W. Alder, R. E. Moss and R. B. Sessions, J. Chem. Soc. Chem. Commun., 1983, 997–998 RSC.
- R. W. Alder, A. G. Orpen and R. B. Sessions, J. Chem. Soc. Chem. Commun., 1983, 999–1000 RSC.
- R. W. Alder, R. E. Moss and R. B. Sessions, J. Chem. Soc. Chem. Commun., 1983, 1000–1002 RSC.
- S. A. Harry, S. Vemulapalli, T. Dudding and T. Lectka, J. Org. Chem., 2022, 87, 8413–8419 CrossRef CAS PubMed.
- Y. Wang and Z.-X. Yu, J. Org. Chem., 2020, 85, 397–402 CrossRef CAS PubMed.
- Cage compounds with compressed CX–π interactions, called “iron maiden,” were also studied.64,65.
- A. Karim, M. Reitti, A.-C. C. Carlsson, J. Gräfenstein and M. Erdélyi, Chem. Sci., 2014, 5, 3226–3233 RSC.
- M. Bedin, A. Karim, M. Reitti, A.-C. C. Carlsson, F. Topić, M. Cetina, F. Pan, V. Havel, F. Al-Ameri, V. Sindelar, K. Rissanen, J. Gräfenstein and M. Erdélyi, Chem. Sci., 2015, 6, 3746–3756 RSC.
- S. Lindblad, K. Mehmeti, A. X. Veiga, B. Nekoueishahraki, J. Gräfenstein and M. Erdélyi, J. Am. Chem. Soc., 2018, 140, 13503–13513 CrossRef CAS PubMed.
- L. Turunen and M. Erdélyi, Chem. Soc. Rev., 2020, 49, 2688–2700 RSC.
- A. C. Reiersølmoen, S. Battaglia, S. Øien-Ødegaard, A. K. Gupta, A. Fiksdahl, R. Lindh and M. Erdélyi, Chem. Sci., 2020, 11, 7979–7990 RSC.
- Atoms in Molecules. A Quantum Theory, ed. R. F. W. Bader, Oxford University Press, Oxford, UK, 1990 Search PubMed.
- C. F. Matta and R. J. Boyd, An Introduction to the Quantum Theory of Atoms in Molecules, in The Quantum Theory of Atoms in Molecules: from Solid State to DNA and Drug Design, ed. C. F. Matta and R. J. Boyd, WILEY-VCH, Weinheim, Germany, 2007, ch. 1 Search PubMed.
- W. Nakanishi and S. Hayashi, Int. J. Quantum Chem., 2018, 118, e25590 CrossRef.
- K. Brandhorst and J. Grunenberg, Chem. Soc. Rev., 2008, 37, 1558–1567 RSC.
- K. Brandhorst and J. Grunenberg, J. Chem. Phys., 2010, 132, 184101–184107 CrossRef.
- M. J. Frisch, G. W. Trucks, H. B. Schlegel, G. E. Scuseria, M. A. Robb, J. R. Cheeseman, G. Scalmani, V. Barone, B. Mennucci, G. A. Petersson, H. Nakatsuji, M. Caricato, X. Li, H. P. Hratchian, A. F. Izmaylov, J. Bloino, G. Zheng, J. L. Sonnenberg, M. Hada, M. Ehara, K. Toyota, R. Fukuda, J. Hasegawa, M. Ishida, T. Nakajima, Y. Honda, O. Kitao, H. Nakai, T. Vreven, J. A. Montgomery Jr., J. E. Peralta, F. Ogliaro, M. Bearpark, J. J. Heyd, E. Brothers, K. N. Kudin, V. N. Staroverov, R. Kobayashi, J. Normand, K. Raghavachari, A. Rendell, J. C. Burant, S. S. Iyengar, J. Tomasi, M. Cossi, N. Rega, J. M. Millam, M. Klene, J. E. Knox, J. B. Cross, V. Bakken, C. Adamo, J. Jaramillo, R. Gomperts, R. E. Stratmann, O. Yazyev, A. J. Austin, R. Cammi, C. Pomelli, J. W. Ochterski, R. L. Martin, K. Morokuma, V. G. Zakrzewski, G. A. Voth, P. Salvador, J. J. Dannenberg, S. Dapprich, A. D. Daniels, Ö. Farkas, J. B. Foresman, J. V. Ortiz, J. Cioslowski and D. J. Fox, Gaussian 09, Revision D.01 and E.01, Gaussian, Inc., Wallingford CT, 2009 Search PubMed.
- T. Noro, M. Sekiya and T. Koga, Theor. Chem. Acc., 2012, 131, 1–8 Search PubMed.
- C. Møller and M. S. Plesset, Phys. Rev., 1934, 46, 618–622 CrossRef.
- E. D. Glendening, C. R. Landis and F. Weinhold, J. Comput. Chem., 2013, 34, 1429–1437 CrossRef CAS PubMed.
- F. Biegler-König, J. Comput. Chem., 2000, 21, 1040–1048 CrossRef.
- T. A. Keith, AIMAll (Version 17.11.14), TK Gristmill Software, Overland Park, KS, 2017, https://aim.tkgristmill.com/ Search PubMed.
- R. W. Alder and S. P. East, Chem. Rev., 1996, 96, 2097–2112 CrossRef CAS PubMed.
- The postulated symmetry was often broken during the optimizations, but not significantly altered.
- P. Pyykkö and M. Atsumi, Chem.–Eur. J., 2009, 15, 186–197 CrossRef PubMed.
- A. Bondi, J. Phys. Chem., 1964, 68, 441–451 CrossRef CAS.
- M. Mantina, A. C. Chamberlin, R. Valero, C. J. Cramer and D. G. Truhlar, J. Phys. Chem. A, 2009, 113, 5806–5812 CrossRef CAS PubMed.
- W. Nakanishi, S. Hayashi, R. Imanaka, T. Nishide, E. Tanaka and H. Matsuoka, Int. J. Mol. Sci., 2023, 24, 2798 CrossRef CAS PubMed.
- D. B. DuPré, J. Phys. Chem. A, 2003, 107, 10142–10148 CrossRef.
- D. Cremer and E. Kraka, Croat. Chem. Acta, 1984, 57, 1259–1281 Search PubMed.
- R. A. Pascal, Eur. J. Org Chem., 2004, 3763–3771 CrossRef CAS.
- M. Jabłoński, J. Comput. Chem., 2022, 43, 1206–1220 CrossRef PubMed.
Footnote |
| † Electronic supplementary information (ESI) available: Additional tables and figures, explanation of QTAIM-DFA, and the fully optimized and transition structures given by Cartesian coordinates, together with total energies of 1a+–8c+. See DOI: https://doi.org/10.1039/d3ra08926f |
| This journal is © The Royal Society of Chemistry 2024 |