
 Open Access Article
 This Open Access Article is licensed under a
 Creative Commons Attribution 3.0 Unported Licence
Theoretical prediction of nanosizing effects and role of additives in the decomposition of Mg(BH4)2†
Stefano
Pantaleone
 ,
Elisa
Albanese
,
Lorenzo
Donà
,
Marta
Corno
,
Marcello
Baricco
and
Bartolomeo
Civalleri
*
,
Elisa
Albanese
,
Lorenzo
Donà
,
Marta
Corno
,
Marcello
Baricco
and
Bartolomeo
Civalleri
*
Dipartimento di Chimica and NIS Interdepartmental Centre, Università degli Studi di Torino, via P. Giuria 7, 10125, Torino, Italy. E-mail: bartolomeo.civalleri@unito.it
First published on 20th February 2024
Abstract
The energetic transition towards renewable resources is one of the biggest challenges of this century. In this context, the role of H2 is of paramount importance as a key source of energy that could substitute traditional fossil fuels. This technology, even if available in several manufactures, still needs to be optimized at all levels (production, storage and distribution) to be integrated on a larger scale. Among materials suitable to store H2, Mg(BH4)2 is particularly interesting due to its high content of H2 in terms of gravimetric density. Nanosizing effects and role of additives in the decomposition of Mg(BH4)2 were studied by density functional theory (DFT) modelling. Both effects were analyzed because of their contribution in promoting the decomposition of the material. In particular, to have a quantitative idea of nanosizing effects, we used thin film 2D models corresponding to different crystallographic surfaces and referred to the following reaction: Mg(BH4)2 → MgB2 + 4H2. When moving from bulk to nanoscale (2D models), a remarkable decrease in the decomposition energy (10–20 kJ mol−1) was predicted depending on the surface and the thin film thickness considered. As regards the role of additives (Ni and Cu), we based our analysis on their effect in perturbing neighboring borohydride groups. We found a clear elongation of some B–H bonds, in particular with the NiF2 additive (about 0.1 Å). We interpreted this behavior as an indicator of the propensity of borohydride towards dissociation. On the basis of this evidence, we also explored a possible reaction pathway of NiF2 and CuF2 on Mg(BH4)2 up to H2 release and pointed out the major catalytic effect of Ni compared to Cu.
1 Introduction
Since many decades, the response to the more and more increasing energetic demand has focused its attention on the optimization of existing industrial processes, on their environmental impact, and on the development of new sustainable techniques. In this context, the hydrogen economy plays a key role,1–8 because hydrogen is abundant on the earth (obviously not in its molecular form) and the only product of the reaction of a fuel cell is water, with no byproducts that may cause environmental pollution;9 in particular, one of the most important research lines is to find an efficient way to store it.10,11 The first fuel cell vehicle prototype was developed in 1966 by General Motors,12 but only in 2004 hydrogen was used for public transportation in the city of Stockholm,13 and only in 2008 Honda built the first car for private usage.14 In the recent years this technology is becoming more and more available for daily uses,15,16 but still needs to be optimized to be cost-effective in comparison to classical fossil fuels.The research is focusing its attention on all the stages of this technology: the H2 production, its storage and distribution, and an efficient way to make it cost-competitive and available for the most common usage (automotive and whatever means of transport, industrial, residential, etc.). In the present study we will focus in particular on its storage.
The principal ways to store hydrogen are as: pressured gas, cryogenic liquid, and using carriers (liquid organic molecules or solid metal and complex hydrides) or confinement/adsorption in microporous scaffolds as metal–organic frameworks (MOF). Since compressed gas and cryogenic liquid present several problems related to efficiency, hydrogen storage using solid carriers represents a more suitable choice. Indeed, several materials present high concentration of hydrogen, such as alanates (AlH4−), amides (NH2−), borohydrides (BH4−), but also simpler binary compounds (metal hydrides),17 which, by thermal decomposition, produce molecular hydrogen (H2).18–22 To be sustainable, the cost-efficiency trade-off of this novel technology must satisfy some parameters imposed by EERA (European Energy Research Alliance) and HER (Hydrogen Europe Research), whose targets, in term of gravimetric and volumetric hydrogen density, are 4–10 wt% and 80–150 gH2 L−1, respectively.23 In recent years, Mg(BH4)2, among others, has been intensively studied24–32 because it contains a large amount of hydrogen in particular in terms of gravimetric density (14.9 wt%), also keeping the volumetric density (113.0 gH2 L−1) acceptable.25 The above-mentioned feature refers in particular to the β-Mg(BH4)2 allotrope, which is the one of interest in the present work. However, borohydrides with high hydrogen content belonging to I and II group (alkali and alkaline earth metals as counterions of the borohydride group) often suffer from poor reversibility and high dehydrogenation temperatures.33 On the contrary, transition metal borohydrides are too unstable to be used as hydrogen storage materials, i.e. their decomposition is too favorable, and the re-hydrogenation process is difficult. There are many strategies to reach to best balancing between de-hydrogenation and hydrogenation cycles, such as formation of mixed borohydrides,34 inclusion of additives,35–37 nanostructuration38–40 and nanoconfinement.39,40
Specifically, in mixed borohydrides the stability of the bare material can be modified and tuned by combining different metals. Recent theoretical and experimental studies41,42 demonstrated that for pure α-Mg(BH4)2 the decomposition starts around 250 °C, while with a proper amount of ZnCl2 the decomposition temperature halves. Of course, the substitution is not limited to the cation, but also to the anion.43 A similar strategy is the inclusion of additives, which not only helps the decomposition, but also the reversibility of the reaction. In particular, transition metals-based additives have been proven to reduce the reactive conditions to promote the re-hydrogenation.44–47 Another method to promote hydrogen desorption is to take advantage of nanosizing effects, because it is well known in literature that nanoparticles have different properties with respect to the bulk, and in particular a lower decomposition energy.48,49 In a recent paper, it has been demonstrated that hydrated LiBH4 nanosheets release hydrogen up to 10 wt% at 70 °C.50 Nanoconfinement is a technique where porous materials (e.g. carbon nanotubes and MOF51–55) are used to synthesize nanoparticles of required sizes. It can be considered as an effect of nanostructuration, where the size of the nanoparticles is driven by the porosity of a certain material.56 Using this technique, a considerable reduction of the decomposition temperature of LiBH4 has been achieved (ΔT = 120 °C).57 Finally, it is also worth mentioning some recent works, where two of the above-mentioned strategies are applied at the same time. As an example, alkali58 and alkaline earth59 borohydride mixtures confined in Al porous scaffolds and in carbon nanospheres, respectively, have shown a good efficiency, both in terms of working temperature and re-hydrogenation cycle. Similarly, also the using of additives was combined with nanoconfinement,60–62 where, in some cases, the additive is used to change the properties of the scaffold.63,64
As abovementioned, Mg(BH4)2 still represents one of the best candidates for the optimization process of this technology. In particular, nanostructuring effects and the inclusion of additives, which we investigate in detail in this work, provided promising results,65–67 as also the combination of these two strategies.68
Here, we present a theoretical study of nanosizing effects and the role of additives in the decomposition of Mg(BH4)2 through first principles DFT calculations. Fully periodic boundary conditions were applied to all the model systems by using the CRYSTAL code. In the first part of the work we discuss the modelling of the decomposition of both bulk (3D) and surfaces (2D) to investigate nanosizing effects. In the second part, being inspired by the experimental work of Hauback and coworkers,69 we present the results of the doping of the bare 2D systems with different transition metals as possible additives to favor the decomposition of Mg(BH4)2.
Finally, we also studied the reaction pathway of the borohydride decomposition comparing the effect of two different metals: Ni and Cu.
2 Computational details
2.1 A model system for Mg(BH4)2
Magnesium borohydride presents several polymorphs that have been observed experimentally70 and other hypothetical phases that have been predicted theoretically;71 a few of them are listed in Table 1.![[3 with combining macron]](https://www.rsc.org/images/entities/char_0033_0304.gif)
From the experimental viewpoint, the most interesting polymorph is the β phase (Fddd space group), because it is stable at high temperature and it decomposes to release hydrogen;72–75 however, it contains 704 atoms in the unit cell (Fig. 1a) and, accordingly, the cost of the simulations, especially for surfaces (for which the number of atoms is a multiple of the bulk), would become unaffordable.
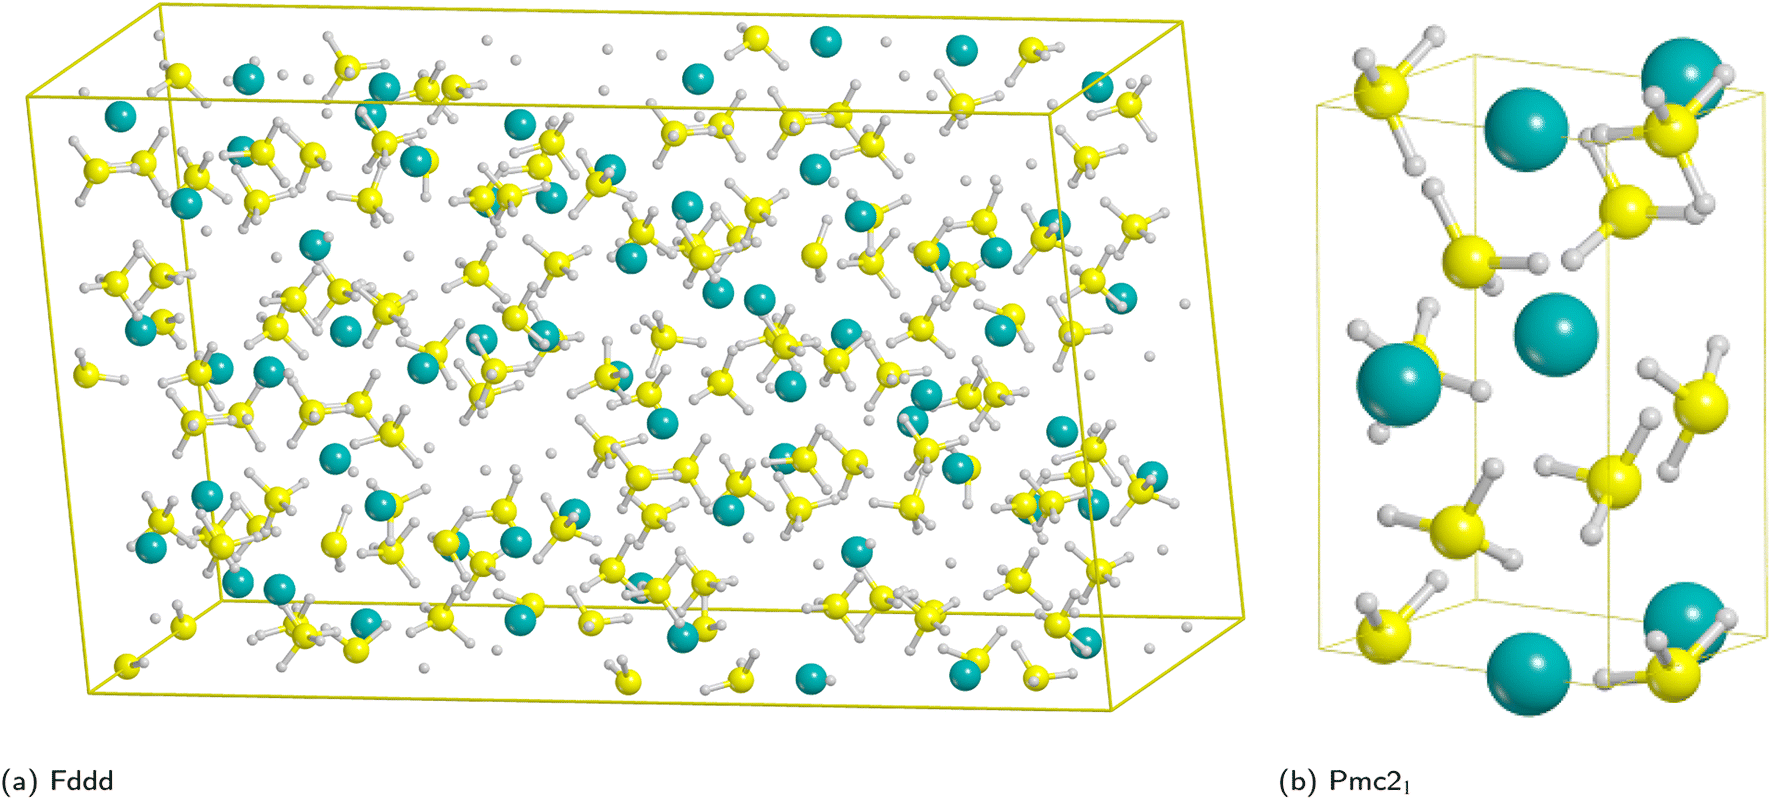 | ||
| Fig. 1 Unit cells of the high temperature Fddd Mg(BH4)2 polymorph (left) and Pmc21 model system (right). Hydrogen in white, boron in yellow, magnesium in cyan. | ||
Therefore, for the purpose of this work we decided to adopt a simpler model system as similar as possible to the β-phase. We then considered the known experimental polymorphs and theoretically predicted structures of Table 1,76,77 for which the relative stability (ΔE) with respect to the athermal limit (T = 0 K, no zero-point-energy corrections) and the density obtained for each polymorph have been reported.
On the basis of present and previous calculations carried out with the same DFT method the polymorph selected for the surface analysis is the theoretically proposed Pmc21 phase (Fig. 1b).77
In fact, by comparing the densities and the relative energies, it becomes apparent that the Pmc21 structure closely mimics the features of the Fddd phase. To verify this assumption, in Fig. 2 we report a comparison between the experimental Raman spectrum of the Fddd phase78vs. the simulated one of the Pmc21. The match is particularly good, considering that no shift was applied to any frequency, even for the B–H stretching (1800–2500 cm−1) and H![[B with combining circumflex]](https://www.rsc.org/images/entities/char_0042_0302.gif) H bending (1000–1500 cm−1) regions, that normally are difficult to reproduce, due to the strong anharmonicity of H-bearing moieties. The position of the peaks is correctly reproduced even in the fingerprint region below 500 cm−1. The great advantage of the Pmc21 phase is that it has just 22 atoms in the unit cell thus making the calculations faster. Despite this can be considered a too strong simplification, given the complexity of the Fddd phase, the evidence above corroborates the hypothesis that the two phases could show a similar behavior toward decomposition. Therefore, in the present study, we adopted the hypothetical Pmc21 polymorph (Fig. 1b) to model and understand the properties of Mg(BH4)2 surfaces and their decomposition reaction along with the role of additives in destabilizing the borohydride.
H bending (1000–1500 cm−1) regions, that normally are difficult to reproduce, due to the strong anharmonicity of H-bearing moieties. The position of the peaks is correctly reproduced even in the fingerprint region below 500 cm−1. The great advantage of the Pmc21 phase is that it has just 22 atoms in the unit cell thus making the calculations faster. Despite this can be considered a too strong simplification, given the complexity of the Fddd phase, the evidence above corroborates the hypothesis that the two phases could show a similar behavior toward decomposition. Therefore, in the present study, we adopted the hypothetical Pmc21 polymorph (Fig. 1b) to model and understand the properties of Mg(BH4)2 surfaces and their decomposition reaction along with the role of additives in destabilizing the borohydride.
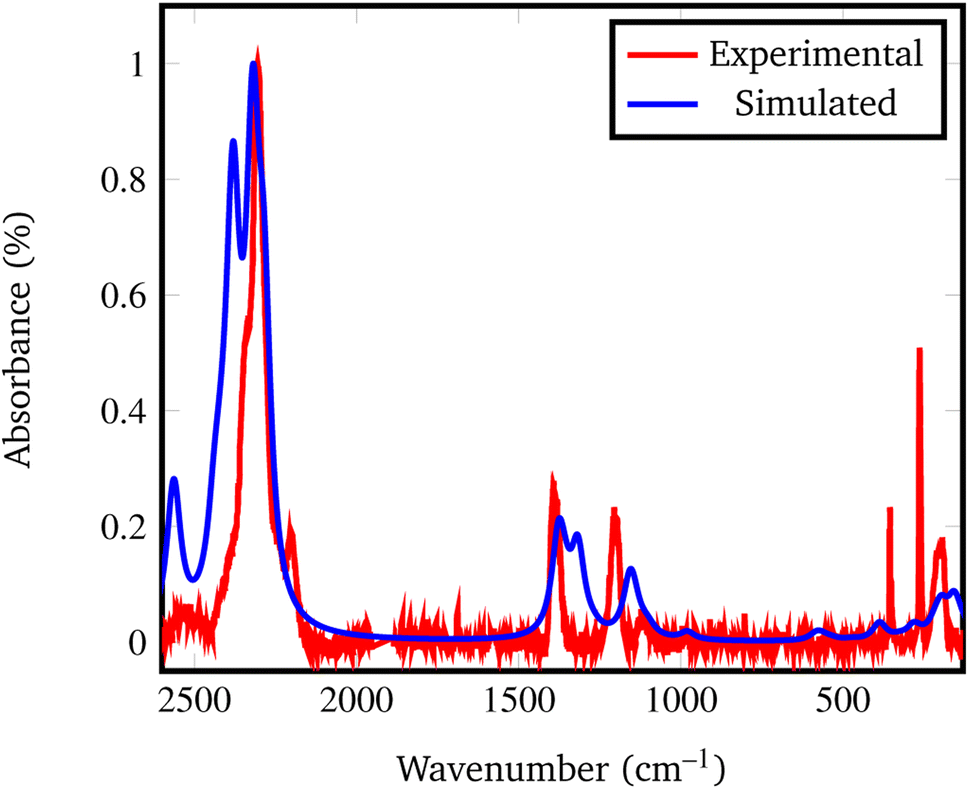 | ||
| Fig. 2 Experimental vs. simulated Pmc21 Mg(BH4)2 Raman spectrum. The experimental spectrum was recorded from the Fddd β phase, taken and adapted from ref. 78. | ||
2.2 Methods
The theoretical investigation of Mg(BH4)2 in its bulk and surface structures was carried out with periodic density functional theory (DFT) calculations by employing mostly the PBE-D*79 GGA functional and, to validate some results (vide infra for details), the M06-D*80,81 hybrid mGGA functional. These methods correspond to the PBE and M06 functionals, respectively, augmented with the Grimme's DFT-D2 (ref. 82 and 83) empirical dispersion correction, as modified for solids by Civalleri et al.84 The empirical term is based on an atom–atom pairwise C6,ij/Rij6 contribution (i.e. a London-type correction). All calculations were carried out with the ab initio CRYSTAL program.85,86 Crystalline orbitals are represented as linear combinations of Bloch functions (BF), and are evaluated over a regular three-dimensions mesh of points in reciprocal space. Each BF is built from local atomic orbitals (AO), which are contractions (linear combinations with constant coefficients) of Gaussian-type-functions (GTF) which, in turn, are the product of a Gaussian times a real solid spherical harmonic function. All electron basis sets were used for all the atoms. In particular, we used a 6-311G(d,p) basis set for H, B, F, Cl and Mg and a TZVP for Ni and Cu.87 For the numerical integration of the exchange and correlation terms for all calculations we adopted 75 radial points and 947 angular points (XLGRID) in a Lebedev scheme in the region of chemical interest were adopted. The Pack–Monkhorst/Gilat shrinking factors for the reciprocal space were set to 8. The accuracy of the integral calculations was increased by setting the tolerances to 9, 9, 7, 7, 18 for the pure system and 7, 7, 7, 7, 18 for the doped systems. The self-consistent field (SCF) iterative procedure was converged to a tolerance in total energy of ΔE = 1 × 10⁻⁷ a.u., and to accelerate convergence in the self-consistent calculations a modified Broyden's scheme88 following the method proposed by Johnson89 was adopted; the method was applied after 10 SCF iterations, with 50% of Fock/KS matrices mixing and with the Johnson parameter set to 0.05. As regards the geometry optimization of the slab models, only the atomic positions were optimized while the cell parameters were kept fixed at their optimized values calculated on the bulk structure. Calculations with the additives were carried out on a (2 × 1) supercell model in order to simulate an isolated additive inclusion/substitution and with the unrestricted Kohn–Sham formalism. Vibrational frequencies, referred to the Γ point,90,91 were calculated at the optimized geometry by means of mass-weighted Hessian matrix, which is obtained by numerical differentiation of the analytical first derivatives, to be sure that all the structures are minima of the potential energy surface (PES). For MgB2 phonon dispersion has been calculated throughout the supercell approach, adopting a (2 × 2 × 2) supercell in order to obtain a cell volume similar to Mg(BH4)2, thus balancing the number of normal modes between the two different unit cells when calculating decomposition energies. Thermal corrections to the decomposition reactions were carried out at 300, 450, 600 K (see details in Table S1†). Raman intensities were calculated through the CPKS approach (Couple Perturbed Kohn–Sham);92,93 to match the experimental spectrum, the temperature and laser wavelength were set to 15 K and 488 nm, respectively.Regarding the transition state search, a numerical estimation of the initial hessian was requested in order to follow the correct eigenvector and, to this end, the SCF tolerance was increased to ΔE = 1 × 10⁻¹¹ a.u. The structures of reactants and products were found by performing a rigid scan along the normal mode of the imaginary frequency of the transition state and optimizing the last point of the scan in both the directions.
3 Results and discussion
3.1 Surfaces stability
As discussed in a previous work on Ca(BH4)2 surfaces,49 it is important to predict which is the most stable surface, because it is the most representative one in experimentally synthesized nanoparticles and, accordingly, the one where the inclusion of the additive occurs with the highest probability. To this purpose we investigated several low-index surfaces, namely: (100), (010), (001), (110), (101) and (011). We adopted a slab model approach (i.e. a 2D thin film of a given thickness) that was successfully applied to model the Ca(BH4)2 surfaces. Here, we briefly recall that a slab model, to be physically stable, must be comprised of stoichiometric (i.e. neutral) and non-polar (i.e. no net dipole moment perpendicular to the slab) repeat units (RU). Accordingly, three out of them (i.e. (001), (101) and (011)) are not physically stable, as shown in Fig. 3. The remaining faces (i.e. (110), (010) and (100)) are stoichiometric and non-polar. The repeat units used to create the slab model are reported in Fig. 3. For the (100) surface, a structural rearrangement of the repeat unit is needed to make it stoichiometric. Specifically, two BH4− units were removed. Slab models of different thickness from 1-RU up to 7-RU were then investigated to identify the minimum thickness of the slab that leads to converged properties. To this purpose, the surface formation energy (Es) was used as the reference property and it was computed for all the optimized slabs of the (110), (010) and (100) surfaces according to the following equation: | (1) |
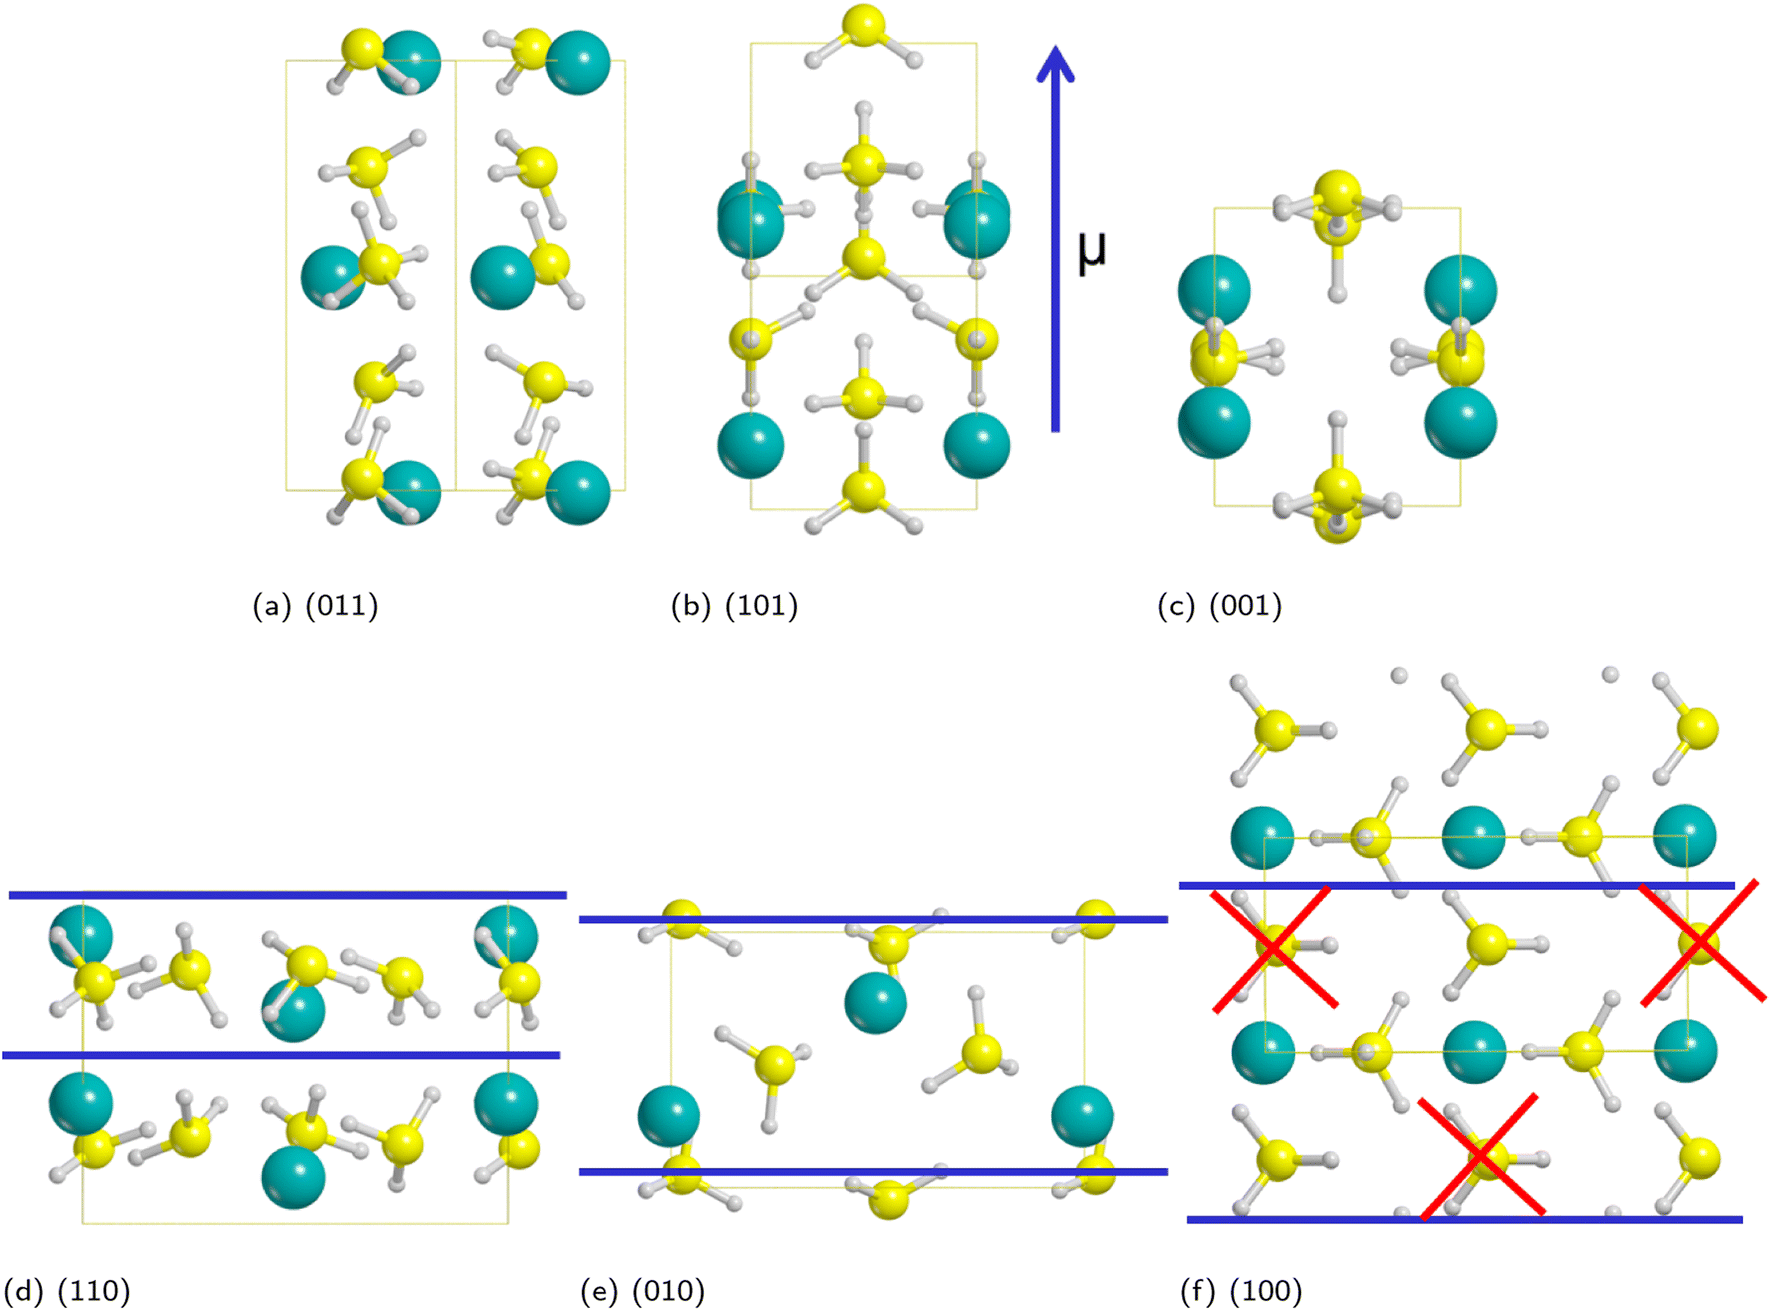 | ||
| Fig. 3 Non-physically (a–c) and physically (d–f) stable surfaces of Pmc21 Mg(BH4)2 phase. The repeat unit needed to create the slab model is highlighted between blue lines. For the (100) face, two BH4− units were removed to make the slab stoichiometric. Hydrogen in white, boron in yellow, magnesium in cyan. | ||
Fig. 4 shows that the Es converges to a constant value of about 0.08 J m−2 (4-RU), 0.27 J m−2 (4-RU) and 0.38 J m−2 (2-RU) for (010), (110) and (100) faces, respectively. Overall, the convergence is reached for a slab thickness of about 15 Å (see Fig. 4). It turns out that the relative stability of the different faces is: (010) > (110) > (100), with the (010) surface being significantly more stable than the other two faces.
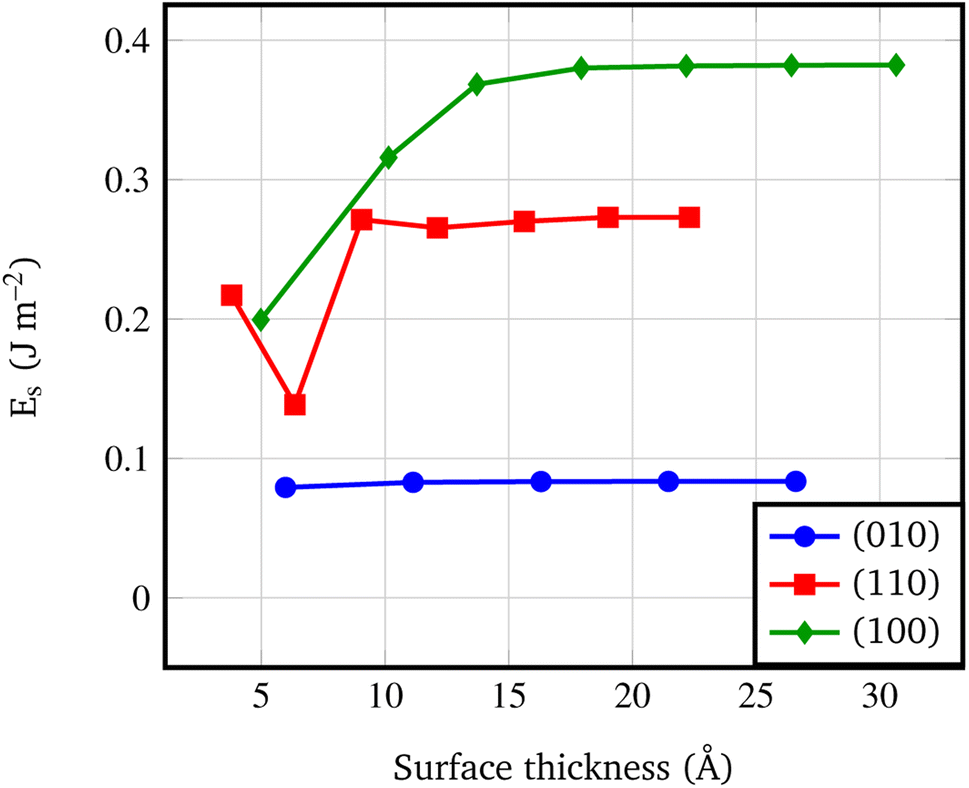 | ||
| Fig. 4 Surface formation energy (J m−2) vs. slab thickness. The surface thickness corresponds to slab models ranging from 1 to 7 repeat units. | ||
3.2 Nanosizing effects
An important byproduct of the study of the relative stability of the different surfaces of Pmc21 Mg(BH4)2 is the possibility to model nanosizing effects on the decomposition of Mg(BH4)2. Indeed, one can refer to the slab model as a thin film of a given thickness and consider the decomposition of films of decreasing thickness. In this study, we considered the following decomposition reaction:94| Mg(BH4)2(s) → MgB2(s) + 4H2(g) | (2) |
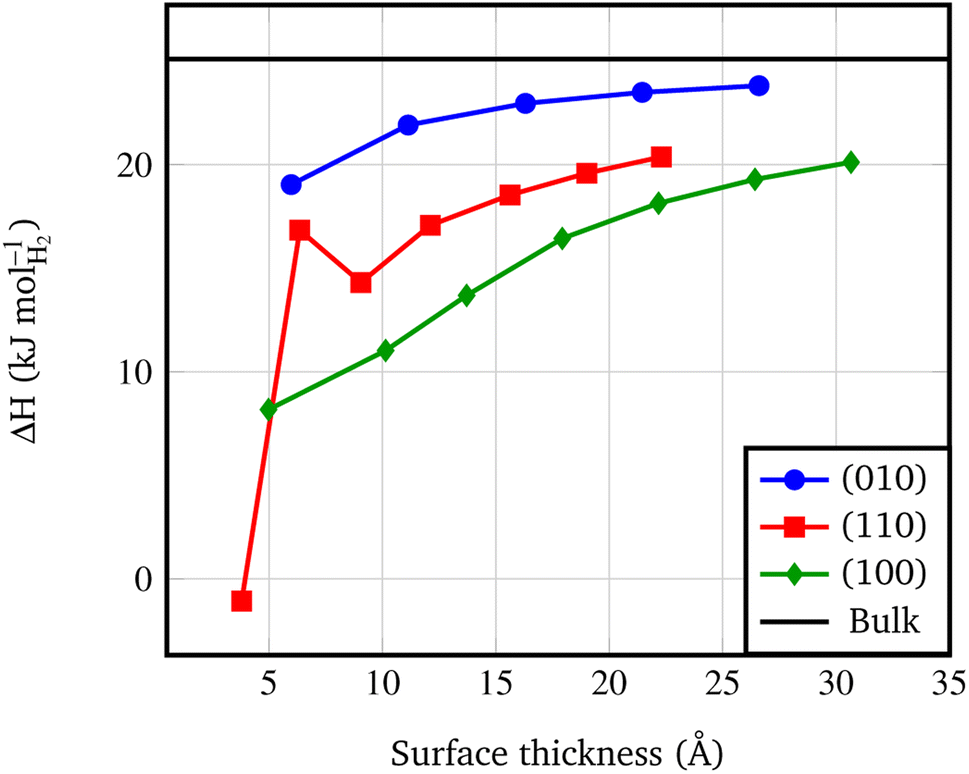 | ||
| Fig. 5 Surface decomposition enthalpies (kJ molH2−1, calculated at 450 K) vs. slab thickness. The surface thickness corresponds to slab models ranging from 1 to 7 repeat units. The black line corresponds to the decomposition energy of the Pmc21 Mg(BH4)2 bulk structure, according to the following reaction: Mg(BH4)2 → MgB2 + 4H2. | ||
3.3 The role of additives
On the basis of the results of the surface stability, we simulated the inclusion of different additives on top of the Pmc21 Mg(BH4)2 (010) surface model. In particular, according to the recent study carried out by Hauback and coworkers69 on the role of Ni-based additives in the decomposition of Mg(BH4)2, three different kinds of additive species were explored, namely: the substitutional defect (Ni2+), the interstitial defect (Ni0), and the doping with nickel halides (i.e. NiF2 and NiCl2). Along with NiF2, we also modeled the inclusion of CuF2 on the surface. This allowed us to compare the results for two transition metals and to evaluate their performance toward the decomposition process. For the calculations, a slab model of about 11 Å (2 RU) of thickness was adopted and a 2 × 1 supercell was employed to reduce the density of additives on the surface. According to the structure of the Pmc21 Mg(BH4)2 (010) surface different sites for the Ni-based additives can be investigated. Fig. 6 shows the possible locations of the doping sites for the different additive species studied in the present work. For the substitutional and the interstitial additive two possible sites were explored around the outermost and the innermost Mg ions, respectively, while for the metal halides a single site was modelled, due to the larger size of the additive, that fit the cavity on the surface.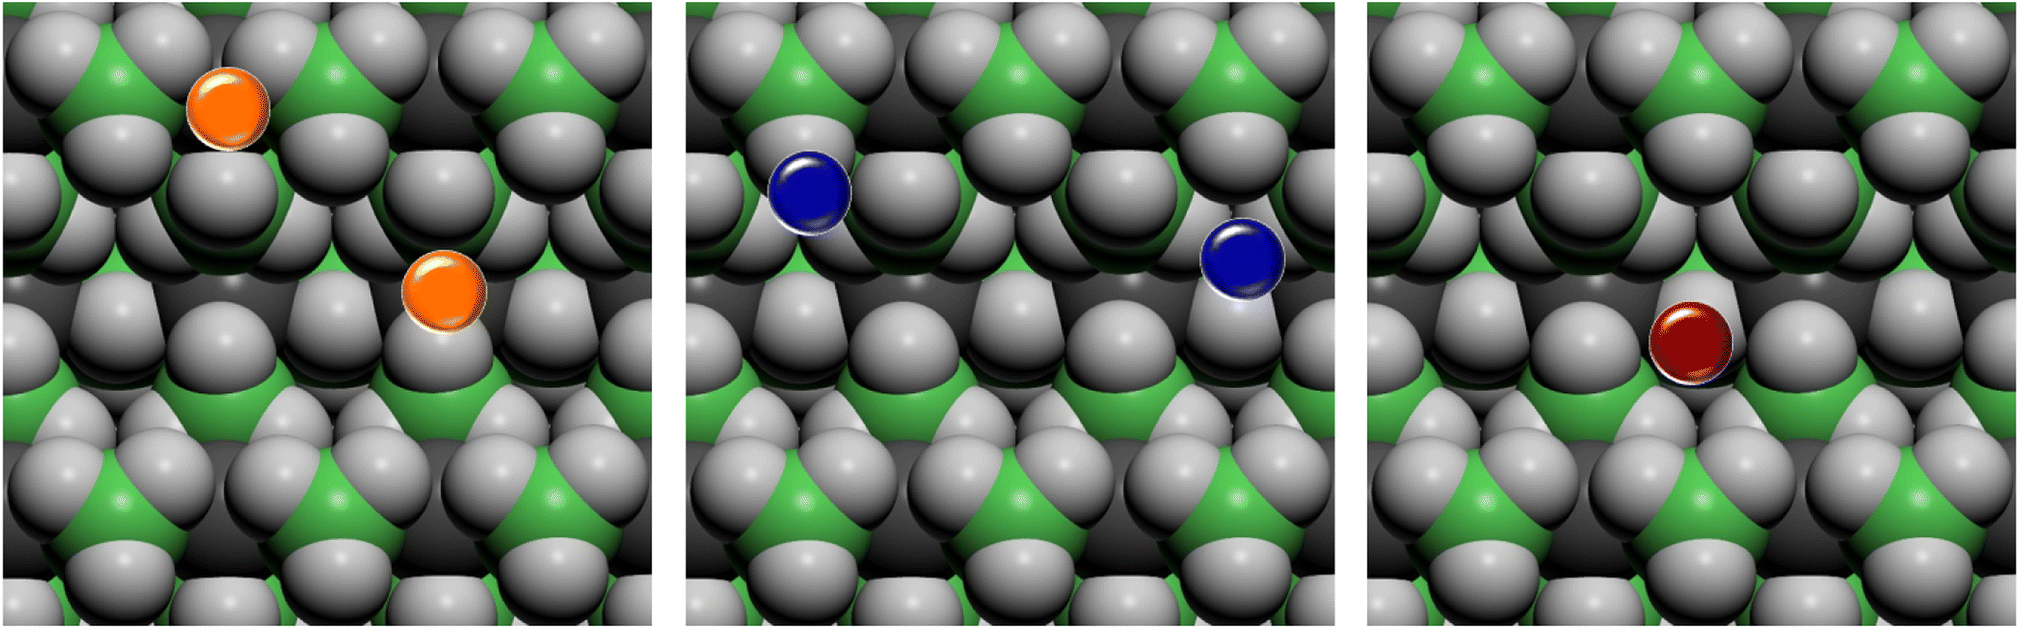 | ||
| Fig. 6 Top view of possible doping sites on the Pmc21 Mg(BH4)2 (010) surface for the different additive species. Substitutional defective site (Ni2+) in orange, interstitial defective site (Ni0) in blue, doping site of nickel and copper halides (NiF2, NiCl2 and CuF2) in red. Hydrogen in light grey, boron in green, magnesium in dark grey. | ||
We analyzed the results on the basis of the structural deformation that the additive produces to the surrounding borohydride ions with respect to the bare material. As a general evidence, the presence of the additive in the structure leads to a remarkable rearrangement of its first coordination sphere. The closest BH4− ion, indeed, appears very distorted with respect to the pure system. The deformation of the B–H bond lengths can then be considered as an indicator of the propensity of the borohydride to decompose. It turns out that the longer the B–H bond distance (i.e. the weaker the B–H bond), the easier the decomposition. A comparison between the optimized structures without and with the Ni based additives and CuF2 is reported in Fig. 7. For sake of simplicity, the metal atom/ion/halide with the surrounding borohydrides is shown as extracted from the optimized slab models.
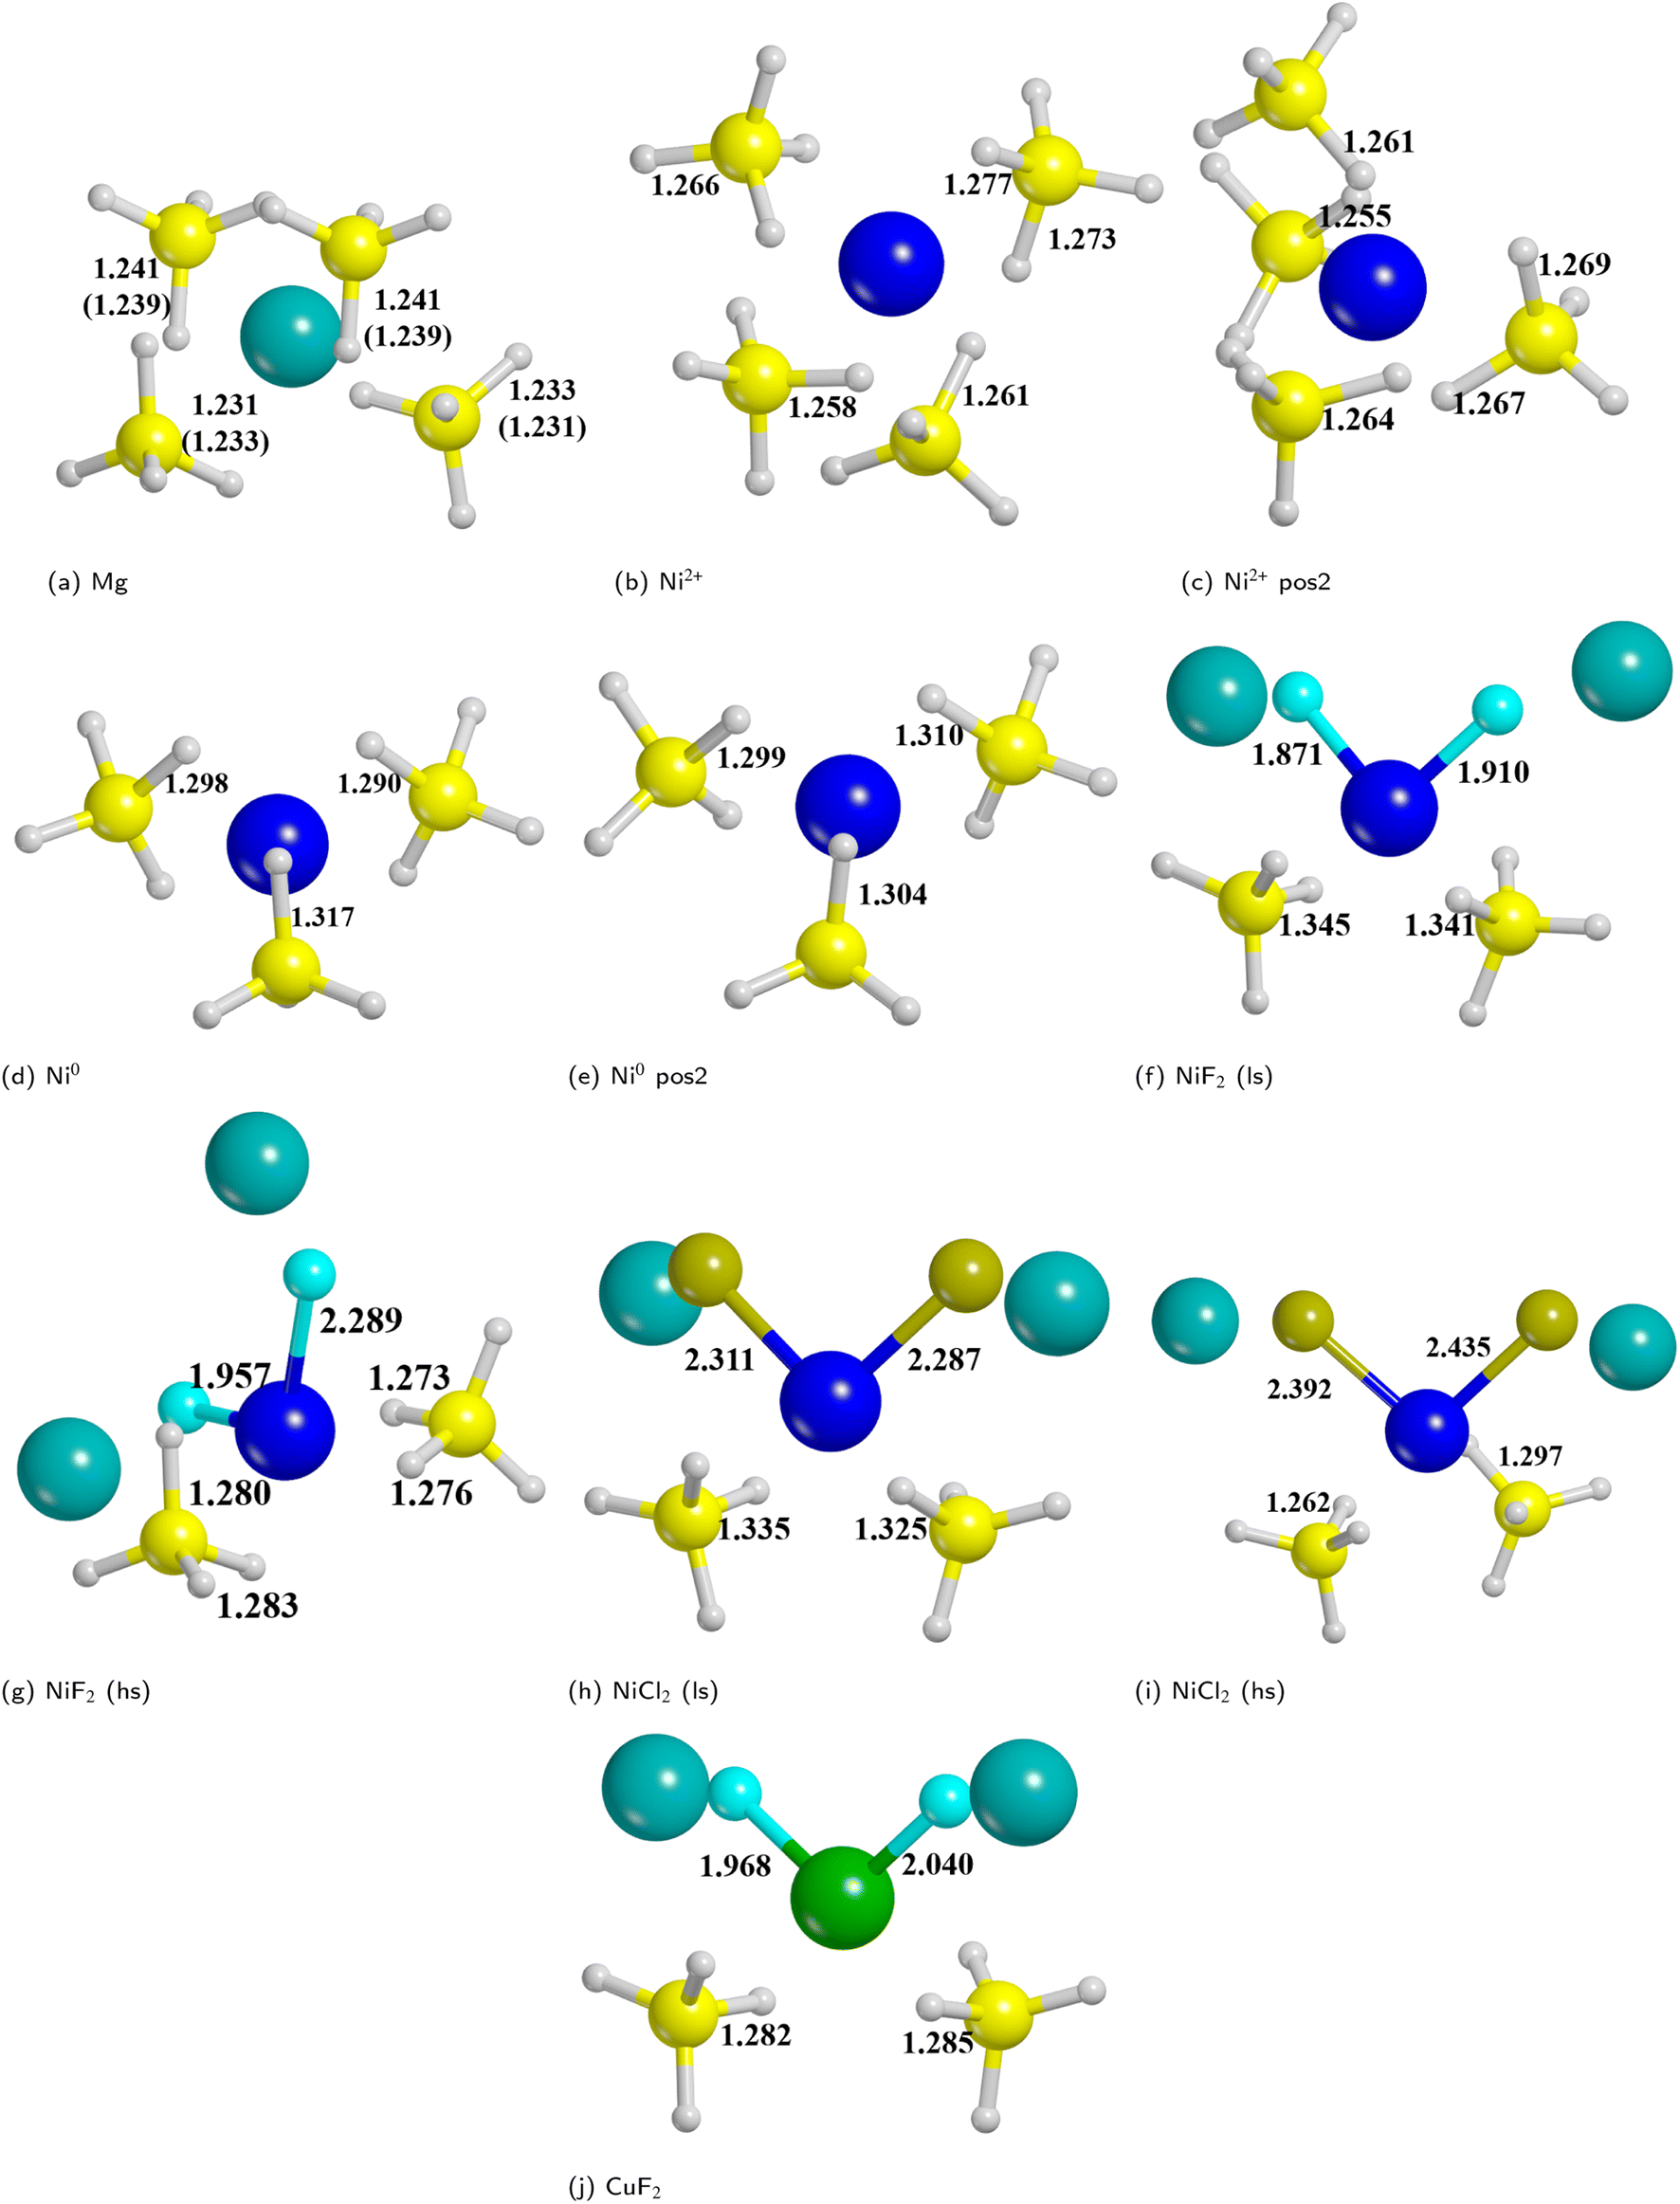 | ||
| Fig. 7 Metal ion/atom/halide with the surrounding borohydrides as extracted from the optimized slab models for bare and doped surfaces. (a) Bare surface (the numbers in parenthesis refers to deeper borohydrides); (b) substitutional defect of outermost Mg; (c) substitutional defect of innermost Mg; (d) interstitial defect in the middle of outermost BH4−; (e) interstitial defect in the middle of innermost BH4−; (f) NiF2 additive (low spin); (g) NiF2 additive (high spin); (h) NiCl2 additive (low spin); (i) NiCl2 additive (high spin); (j) CuF2 additive. Some relevant B–H and M–X distances (in Å) are reported. Hydrogen in white, boron in yellow, magnesium in cyan, nickel in blue, copper in green. | ||
As expected, the geometry around the substitutional defective site is perturbed by the substitution with Ni2+, but it maintains a typical tetrahedral coordination. For the interstitial defective site, instead, the Ni0 atom tends to rearrange the BH4− groups in a trigonal-planar coordination with three borohydrides in closer contact with the metal center. In the case of the metal halides additives, both Ni and Cu are tetra-coordinated with two halide atoms and two BH4− groups.
The structural deformation of the BH4− groups around the metal can be clearly seen from the B–H bond distances as reported in Fig. 7. For all additive species, an elongation of the B–H bonds is observed with respect to the non-doped surface. In the chart of Fig. 8, the B–H bond distances (in Å) for the four nearest neighbouring BH4− groups of the metal are shown. On average, the largest elongation is predicted for atomic Ni as an interstitial site. In the other cases, one BH4− groups out of four is definitely more perturbed by the presence of the additive. The effect of the metal on the B–H bond is particularly relevant for both NiF2 and NiCl2. Interestingly, CuF2 is not as effective as Ni-based additives in perturbing the BH4− groups. Therefore, it is expected that Ni would outperform Cu in favouring the decomposition of Mg(BH4)2.
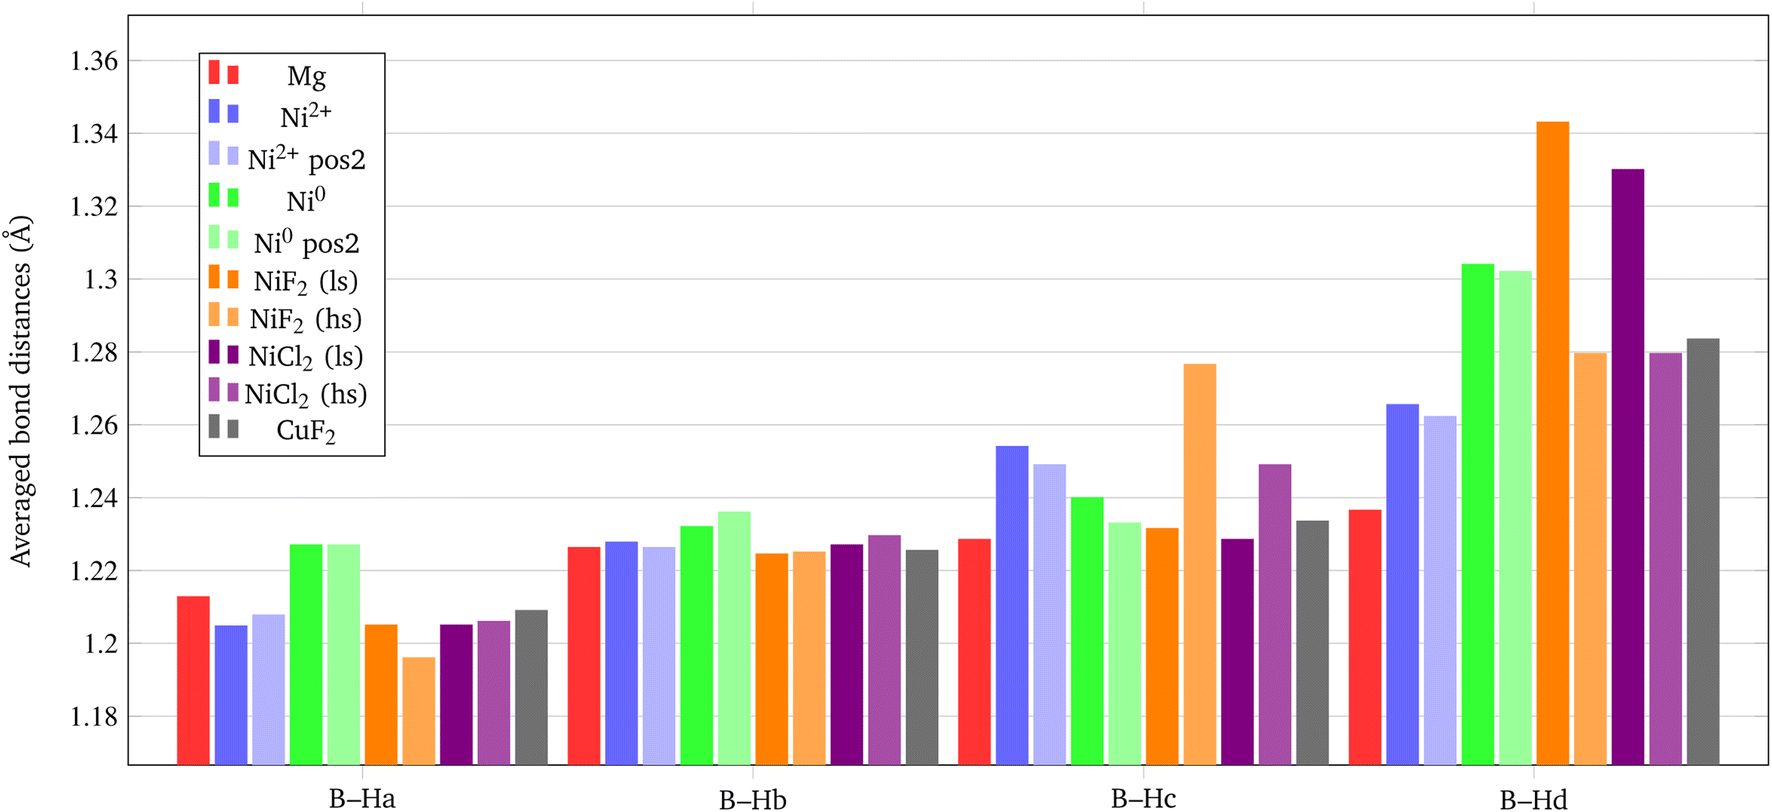 | ||
| Fig. 8 Average B–H bond distances (in Å) for the BH4− groups closest to the metal center. | ||
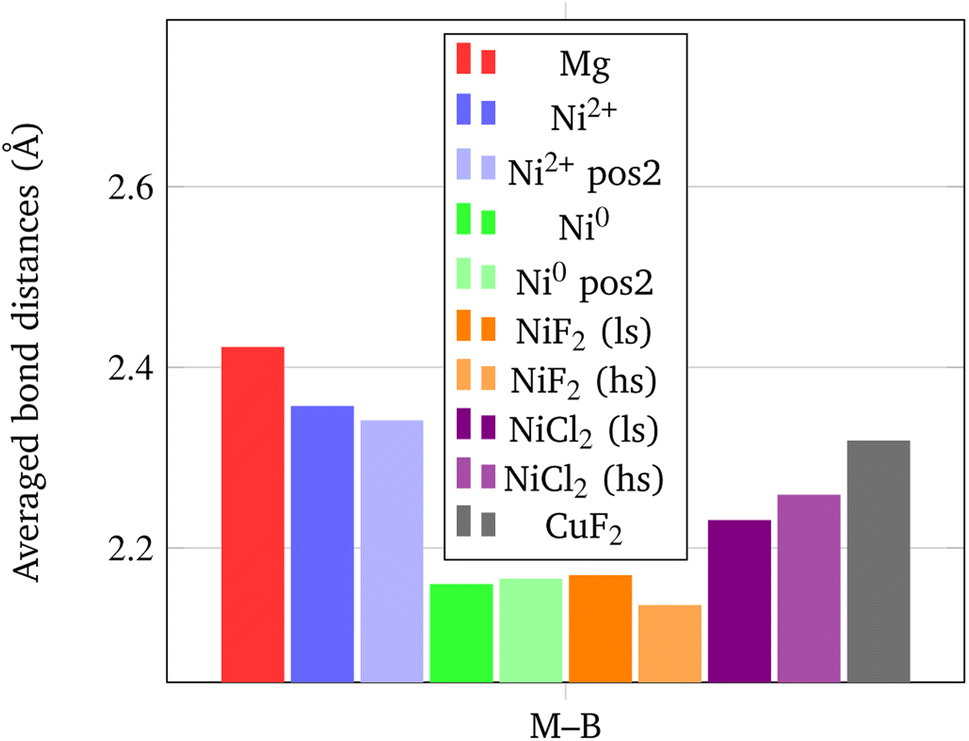
In addition, it is important to point out that also the Ni–B distance can be used as a further indicator of the increased propensity of the borohydride toward dissociation. In fact, it has been shown by Saldan et al.69 that the decomposition of Mg(BH4)2 always occurs concurrently with the formation of the metal boride. Therefore, a shorter Ni–B distance can be interpreted as an increased tendency to the decomposition of the BH4− groups. The mechanism of Mg(BH4)2 involve a redox reaction where the H is oxidized from −1 in the [BH4]− group to its native state in the H2 molecule, and the boron is reduced from +3 to −1 in the metal boride. As clearly seen in Fig. 9, Ni0 in the interstitial site leads to a remarkable shortening of the mean Ni–B distance in the borohydride, followed by Ni and Cu halides. Details on structural features are available in Fig. S1–S18 and Tables S1–S9.†
 | ||
| Fig. 9 Average M–B bond distances (in Å) for the BH4− groups closest to the metal center. | ||
On the latter system (i.e. NiF2), which seems to be the most promising one in promoting the decomposition of Mg(BH4)2, we also improved the level of theory to have a better description of the nickel spin state and validate the PBE-D* results. Therefore, we relied on the more accurate rung of the Jacob's ladder of DF approximations by using a hydrid functional, the M06-D*, which has been shown to be particularly good in describing transition metals and, moreover, because the inclusion of a 27% of the exact Hartree–Fock exchange allows a more correct localization of unpaired electrons. According to PBE-D* results, we found a more stable structure for the Ni in high spin state (see Fig. S15, S16 and Table S9†) instead of the low spin (see Fig. S13, S14 and Table S8†), with a difference of ΔE = 34.22 kJ mol−1 and ΔH = 35.14 kJ mol−1. M06-D* confirms this result from a qualitative point of view, but it further stabilizes the high spin state solution with a ΔE of 79.33 kJ mol−1. Differences in the geometries with the two levels of theory are negligible on B–H distances, even if a systematic increasing of the bond distances of PBE-D* with respect to M06-D* is predicted. In contrast, M06-D* tends to elongate the Ni–B distance with respect to PBE-D*, and in this case the difference in the two geometries is larger, thus indicating that a proper description of the metal where the spin is localized is crucial. Details on the comparison between PBE and M06 are in Fig. S19–S21.†
3.4 NiF2 and CuF2 additives reactivity
In this section we study the reactivity of NiF2, the most promising additive according to the results provided in the previous section, as compared to CuF2 to confirm the stronger catalytic effect of Ni. Since F atom shows a rather small ionic radius with respect to other halides, it is well known that it tends to substitute H atoms of BH4− to form BH(4−n)Fn− groups.98 Then we explored a hypothetical reaction pathway from NiF2 through Ni–H2, i.e. with H atoms chemisorbed on the metal centre, to Ni⋯H2 where molecular hydrogen is physisorbed on the surface, until the complete H2 desorption (Ni + H2). The same strategy was also adopted for CuF2 additive.From the intermediate Ni–I2 (see Fig. S24d†), a different product with respect to the above-mentioned was modelled because of the formation of a BH2F group and its proximity with the other F atom bound to the nickel. We then built up another product in which two F atoms substitute the same BH4− to form a BH2F2− group, as shown in Fig. S24g† (Ni–P3, ΔH = −68.1 kJ mol−1). This structure is more stable than Ni–P1 and Ni–P2, indicating that multiple substitutions on the same BH4− group lead to a more favorable product. This is not unexpected because it has already been shown in the case of F− substitutions in LiBH4.98
Interestingly, the Ni–P3 product also present an incipient H2 molecule chemisorbed on Ni, which is expected to be more prone to dissociate and release molecular hydrogen than Ni–P1 and Ni–P2. Therefore, we further explored the reaction path by desorbing the quasi-H2 molecule. This allowed us to evaluate the cost of the reaction also from a kinetic point of view by calculating the reaction barrier. Thus, we identified the transition state (Ni-TS) with an activation barrier equal to 36.5 kJ mol−1 with respect to Ni–P3, and, from the Intrinsic Reaction Coordinate (IRC) calculation performed over the transition state, we landed to the product with a formal H2 molecule physisorbed on the surface (Ni–P3–H2, −62.3 kJ mol−1 see Fig. S24i†), i.e. not chemically bound to the Ni. Finally, we optimized the final product with the H2 released, i.e. not interacting at all with the surface (Ni–P3 + H2 −58.4 kJ mol−1, see Fig. S24j†).
The IRC calculation leads to a product (Cu–P–H2 −4.2 kJ mol−1, see Fig. S25e†) in which the metal adopts a different coordination sphere with respect to the previous reactant and intermediates, due to the changing of the oxidation number of Cu. As for the NiF2 doped system after the H2 release, one can observe a strong rearrangement of the structure. Curiously, we obtained a porous structure (see Fig. S24d–f†), as one can see from the cylindrical channels of the slab structure, which somehow reminds the Fddd polymorph.
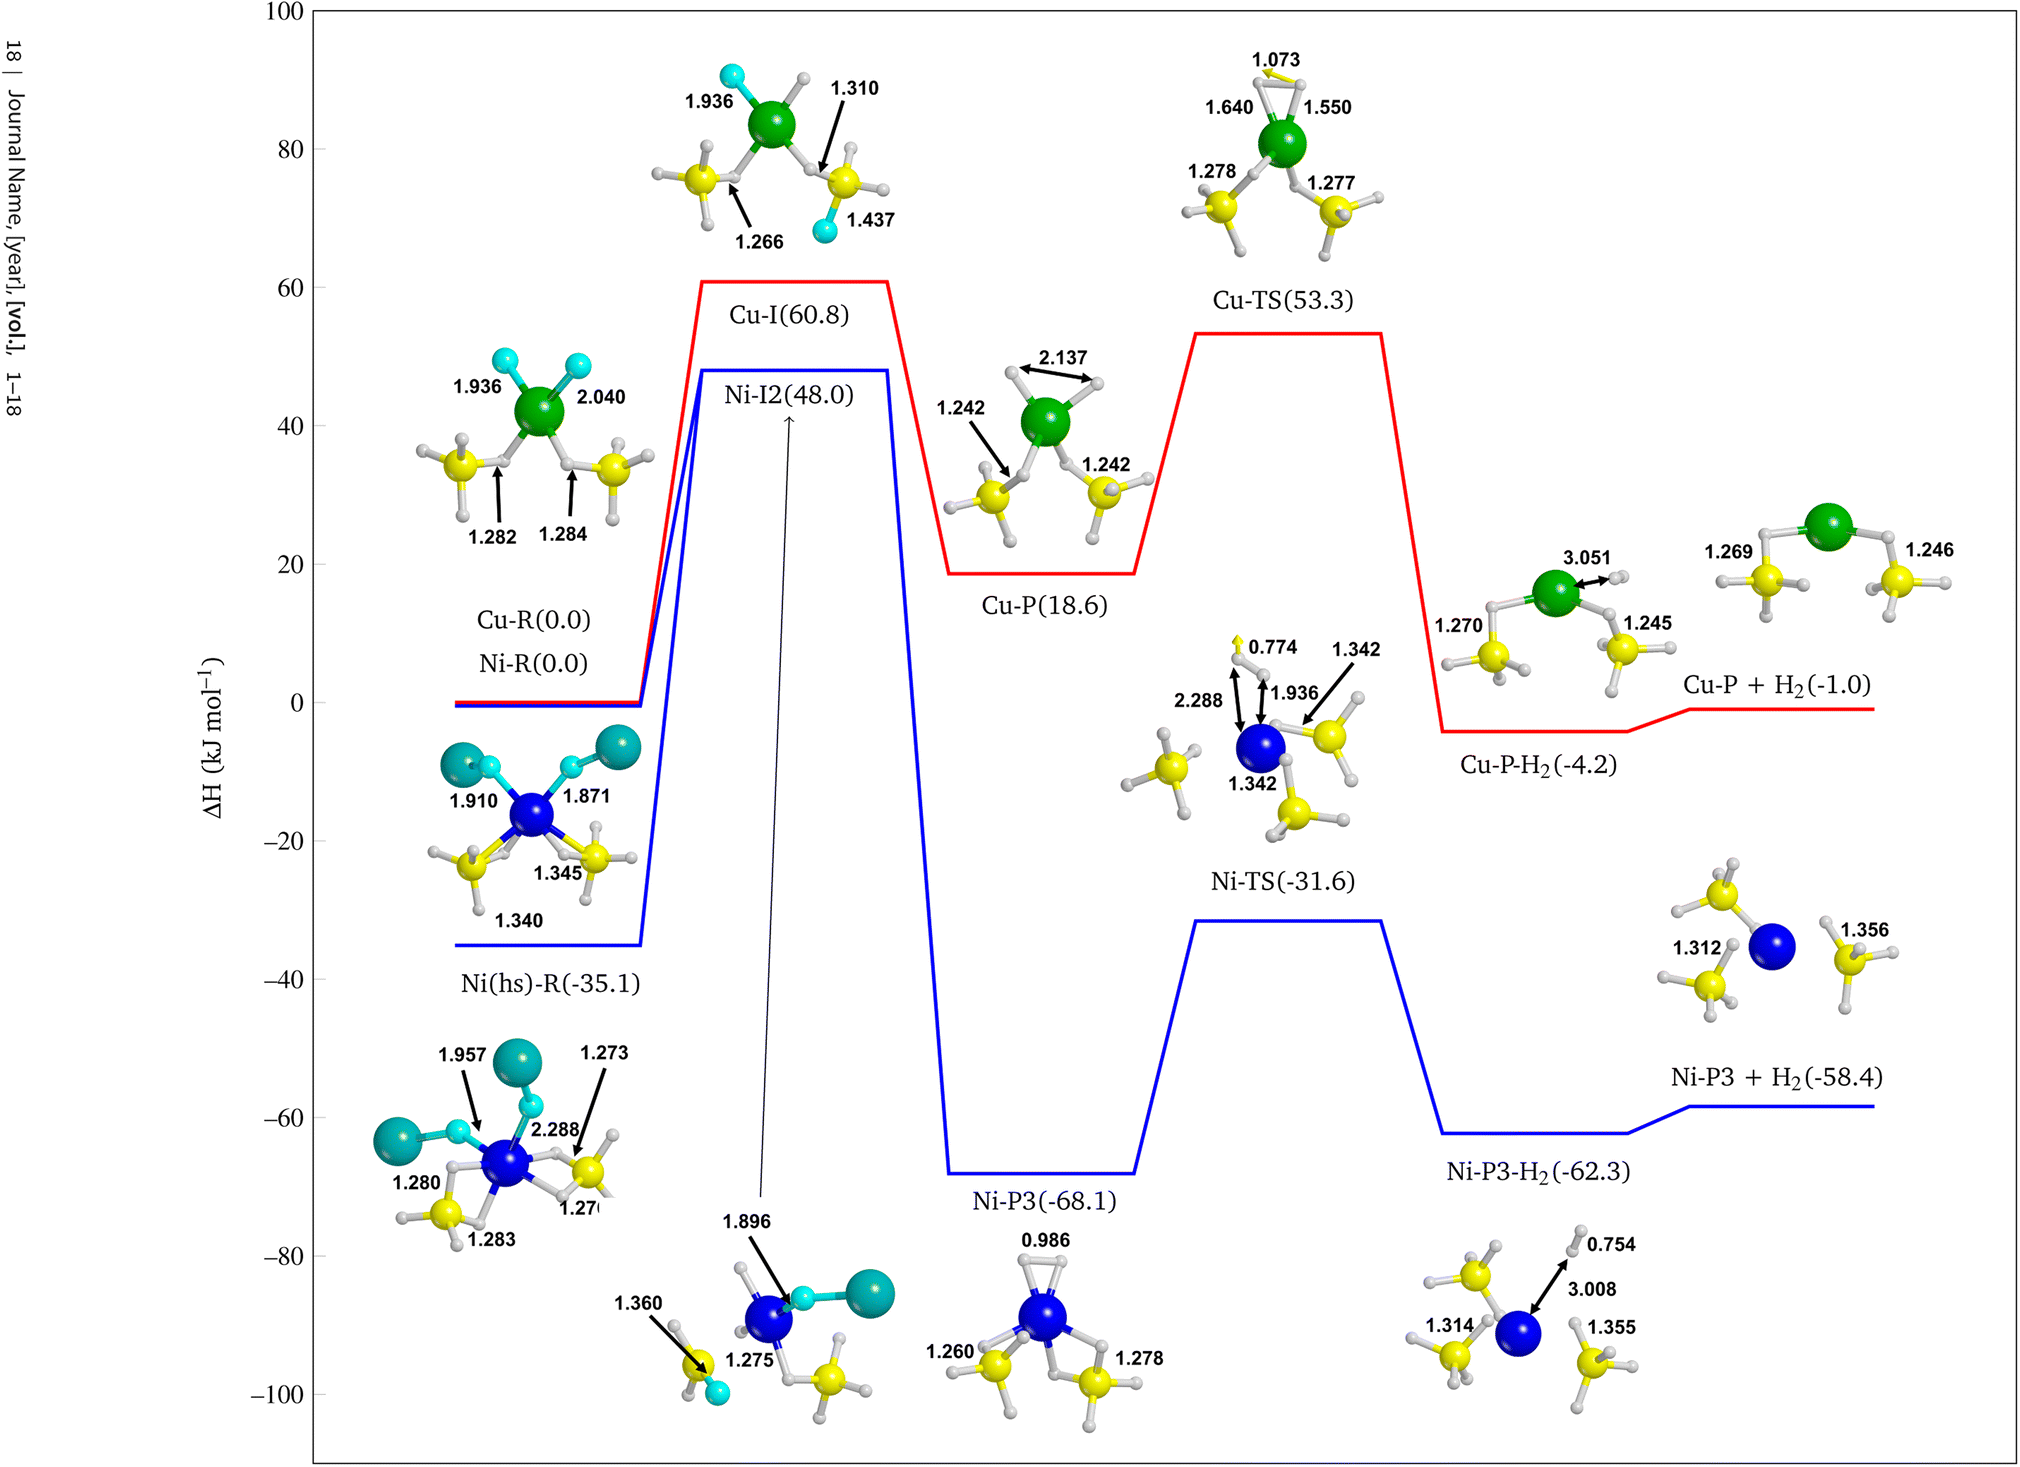 | ||
| Fig. 10 Reaction pathway for the NiF2 (blue line) and CuF2 (red line) doped systems. Details cut from the periodic structures. Bond distances are in Å. Energy values are in kJ mol−1. Boron in yellow, magnesium in dark cyan, nickel in blue, copper in green, fluorine in cyan and hydrogen in white. | ||
4 Conclusions
In this work we modelled nanosizing effects and the role of additives on the decomposition of Mg(BH4)2 through quantum mechanical calculations. On the basis of present results we can draw the following conclusions:• The Mg(BH4)2Pmc21 phase, which does not exist in nature, appears to be a physically reasonable model system of the Mg(BH4)2 β-phase in terms of density, relative stability, and vibrational features.
• At nanoscale, thin films present a lower decomposition enthalpy with respect to the bulk up to 20 kJ mol−1. Not surprisingly, according to the surface stability, faces exposed at the surface show different decomposition enthalpy: the lower the stability of the surface, the lower the decomposition enthalpy.
• Among the examined additives, the best candidate to promote Mg(BH4)2 decomposition is NiF2, whereas Cu is not so effective. This can be simply deduced by the elongation of some B–H bonds and, at the same time, by the decreasing of M–B bond distance. These two indicators can be interpreted as the tendency of the [BH4]− to dissociate, thus forming H2 on one side and Ni–B species on the other side. Although the effectiveness of Ni agrees with the findings of ref. 69, our results are to be considered from a qualitative viewpoint, as it is not possible to compare them with experimental re-hydrogenation temperature and pressure at this stage.
• Finally, we confirmed the evidence above by investigating the reaction pathway for the H2 release from the NiF2 and CuF2 doped Mg(BH4)2 (010) surfaces. The most important reactive step that determines the higher efficiency of Ni with respect to Cu in catalysing the reaction is the formation of an incipient hydrogen molecule chemisorbed on the metal. For Ni, this step is exothermic, while for Cu is endothermic of about 20 kJ mol−1. Indeed, the H–H bond length in Ni–P3 is very closed to molecular H2 (i.e. 0.99 Å vs. 0.76 Å) thus promoting the reaction towards the final product. From Fig. 10 it is also clear the major catalytic effect of the NiF2 doped system, as all its structures are more stable than the CuF2 doped one.
In conclusion, the present theoretical work corroborates the evidence that nanostructured metal borohydrides show advantages for energy storage applications compared to their bulk counterparts and that the role of additives as the doping with transition metals (e.g. Ni) can further facilitate the release of H2.
Conflicts of interest
There are no conflicts to declare.Acknowledgements
This research has received funding from the Project CH4.0 under the MUR program “Dipartimenti di Eccellenza 2023–2027” (CUP: D13C22003520001).Notes and references
- P. Jena, J. Phys. Chem. Lett., 2011, 2, 206–211 CrossRef CAS
.
- J. Ritter, A. D. Ebner, J. Wang and R. Zidan, Mater. Today, 2003, 6, 18–23 CrossRef CAS
- M. Ball and M. Weeda, Int. J. Hydrogen Energy, 2015, 50, 7903–7919 CrossRef
- J. O. Abe, A. Popoola, E. Ajenifuja and O. Popoola, Int. J. Hydrogen Energy, 2019, 44, 15072–15086 CrossRef CAS
- S. Niaz, T. Manzoor and A. H. Pandith, Renewable Sustainable Energy Rev., 2015, 50, 457–469 CrossRef CAS
- H. Nazir, C. Louis, S. Jose, J. Prakash, N. Muthuswamy, M. E. Buan, C. Flox, S. Chavan, X. Shi and P. Kauranen,
et al.
, Int. J. Hydrogen Energy, 2020, 45, 13777–13788 CrossRef CAS
- H. Nazir, N. Muthuswamy, C. Louis, S. Jose, J. Prakash, M. E. Buan, C. Flox, S. Chavan, X. Shi and P. Kauranen,
et al.
, Int. J. Hydrogen Energy, 2020, 45, 20693–20708 CrossRef CAS
- H. Nazir, N. Muthuswamy, C. Louis, S. Jose, J. Prakash, M. E. Buan, C. Flox, S. Chavan, X. Shi and P. Kauranen,
et al.
, Int. J. Hydrogen Energy, 2020, 45, 28217–28239 CrossRef CAS
- L. Schlapbach and A. Züttel, Nature, 2001, 414, 39–45 CrossRef
- E. Albanese, B. Civalleri, S. Casassa and M. Baricco, J. Phys. Chem. C, 2014, 118, 23468–23475 CrossRef CAS
- S. Dutta, Annu. Rev. Chem. Biomol. Eng., 2014, 20, 1148–1156 CAS
- J. T. Salihi, P. D. Agarwal and G. J. Spix, IEEE Trans. Ind. Appl., 1967, IGA-3, 463–469 Search PubMed
- K. Haraldsson, A. Folkesson, M. Saxe and P. Alvfors, Int. J. Hydrogen Energy, 2006, 31, 317–325 CrossRef CAS
- J. Andrews and B. Shabani, Wiley Interdiscip. Rev.: Energy Environ., 2014, 3, 474–489 Search PubMed
- M. Davids, M. Lototskyy, M. Malinowski, D. van Schalkwyk, A. Parsons, S. Pasupathi, D. Swanepoel and T. van Niekerk, Int. J. Hydrogen Energy, 2019, 44, 29263–29272 CrossRef CAS
- M. Lototskyy, I. Tolj, Y. Klochko, M. W. Davids, D. Swanepoel and V. Linkov, Int. J. Hydrogen Energy, 2020, 45, 7958–7967 CrossRef CAS
- B. Sakintuna, F. Lamari-Darkrim and M. Hirscher, Int. J. Hydrogen Energy, 2007, 32, 1121–1140 CrossRef CAS
- S. Orimo, Y. Nakamori, J. R. Eliseo, A. Züttel and C. M. Jensen, Chem. Rev., 2007, 107, 4111–4132 CrossRef CAS PubMed
- M. B. Ley, L. H. Jepsen, Y. S. Lee, Y. W. Cho, J. M. B. von Colbe, M. Dornheim, M. Rokni, J. O. Jensen, M. Sloth, Y. Filinchuk, J. E. JØrgensen, F. Besenbacher and T. R. Jensen, Mater. Today, 2014, 17, 122–128 CrossRef CAS
- A. Züttel, Mater. Today, 2003, 24–33 CrossRef
- M. Paskevicius, L. H. Jepsen, P. Schouwink, R. Černý, D. B. Ravnsbæk, Y. Filinchuk, M. Dornheim, F. Besenbacher and T. R. Jensen, Chem. Soc. Rev., 2017, 46, 1565–1634 RSC
- L. Bannenberg, M. Heere, H. Benzidi, J. Montero, E. Dematteis, S. Suwarno, T. Jaroń, M. Winny, P. Orłowski and W. Wegner,
et al.
, Int. J. Hydrogen Energy, 2020, 45, 33687–33730 CrossRef CAS
- Key Performance Indicators (KPIs) for FCH research and innovation, 2020–2030, https://www.eera-fch.eu/component/attachments/?task=download%26id=429 Search PubMed.
- O. Zavorotynska, S. Deledda and B. C. Hauback, Int. J. Hydrogen Energy, 2016, 41, 9885–9892 CrossRef CAS
- O. Zavorotynska, A. El-Kharbachi, S. Deledda and B. C. Hauback, Int. J. Hydrogen Energy, 2016, 41, 14387–14403 CrossRef CAS
- V. A. Yartys, M. V. Lototskyy, E. Akiba, R. Albert, V. Antonov, J.-R. Ares, M. Baricco, N. Bourgeois, C. Buckley and J. B. Von Colbe,
et al.
, Int. J. Hydrogen Energy, 2019, 44, 7809–7859 CrossRef CAS
- M. Hirscher, V. A. Yartys, M. Baricco, J. B. von Colbe, D. Blanchard, R. C. Bowman Jr, D. P. Broom, C. E. Buckley, F. Chang and P. Chen,
et al.
, J. Alloys Compd., 2020, 827, 153548 CrossRef CAS
- E. M. Dematteis, M. B. Amdisen, T. Autrey, J. Barale, M. E. Bowden, C. E. Buckley, Y. W. Cho, S. Deledda, M. Dornheim and P. De Jongh,
et al.
, Prog. Energy, 2022, 4, 032009 CrossRef CAS
- Y. Huang, Y. Zheng, J. Li, X. Bao, J. Guo, J. Shen, Y. Guo, Q. Zhang, J. Li and W. Lei,
et al.
, J. Mater. Sci. Technol., 2023, 153, 809–820 CrossRef
- Y. Lv and Y. Wu, Prog. Nat. Sci., 2021, 31, 809–820 CrossRef CAS
- K. Suárez-Alcántara and J. R. Tena García, Materials, 2021, 14, 2561 CrossRef
- H. Hagemann, Molecules, 2021, 26, 7425 CrossRef CAS
- E. R. Pinatel, E. Albanese, B. Civalleri and M. Baricco, J. Alloys Compd., 2015, 645, S64–S68 CrossRef CAS
- D. Ravnsbæk, Y. Filinchuk, Y. Cerenius, H. J. Jakobsen, F. Besenbacher, J. Skibsted and T. R. Jensen, Angew. Chem., Int. Ed., 2009, 48, 6659–6663 CrossRef PubMed
- R. A. Varin and R. Parviz, Int. J. Hydrogen Energy, 2012, 37, 1584–1593 CrossRef CAS
- O. Zavorotynska, I. Saldan, S. Hino, T. D. Humphries, S. Deledda and B. C. Hauback, Int. J. Hydrogen Energy, 2012, 37, 1584–1593 CrossRef
- C. J. Webb, J. Phys. Chem. Solids, 2015, 84, 96–106 CrossRef CAS
- X. Yu, Z. Tang, D. Sun, L. Ouyang and M. Zhu, Prog. Mater. Sci., 2017, 88, 1–48 CrossRef
- A. Schneemann, J. L. White, S. Kang, S. Jeong, L. F. Wan, E. S. Cho, T. W. Heo, D. Prendergast, J. J. Urban and B. C. Wood,
et al.
, Chem. Rev., 2018, 118, 10775–10839 CrossRef CAS PubMed
- X. Yu, Z. Tang, D. Sun, L. Ouyang and M. Zhu, Prog. Mater. Sci., 2017, 88, 1–48 CrossRef
- E. Albanese, G. N. Kalantzopoulos, J. G. Vitillo, E. Pinatel, B. Civalleri, S. Deledda, S. Bordiga, B. C. Hauback and M. Baricco, J. Alloys Compd., 2013, 580, S282–S286 CrossRef CAS
- G. N. Kalantzopoulos, J. G. Vitillo, E. Albanese, E. Pinatel, B. Civalleri, S. Deledda, S. Bordiga, M. Baricco and B. C. Hauback, J. Alloys Compd., 2014, 615, S702–S705 CrossRef CAS
- R. Skoryunov, O. Babanova, A. Soloninin, A. Skripov and S. Orimo, J. Alloys Compd., 2020, 823, 153821 CrossRef CAS
- O. Zavorotynska, I. Saldan, S. Hino, T. D. Humphries, S. Deledda and B. C. Hauback, J. Mater. Chem. A, 2015, 3, 6592–6602 RSC
- X. Wang, X. Xiao, J. Zheng, X. Huang, M. Chen and L. Chen, Int. J. Hydrogen Energy, 2020, 45, 2044–2053 CrossRef CAS
- J. Zheng, X. Wang, X. Xiao, H. Cheng, L. Zhang and L. Chen, Chem. Eng. J., 2021, 412, 128738 CrossRef CAS
- X. Wang, X. Xiao, J. Zheng, Z. Hang, W. Lin, Z. Yao, M. Zhang and L. Chen, Int. J. Hydrogen Energy, 2021, 46, 23737–23747 CrossRef CAS
- A. Pundt and R. Kirchheim, Annu. Rev. Mater. Res., 2006, 36, 555–608 CrossRef CAS
- E. Albanese, M. Corno, M. Baricco and B. Civalleri, Res. Chem. Intermed., 2021, 47, 345–356 CrossRef CAS
- R. Wu, Z. Ren, X. Zhang, Y. Lu, H. Li, M. Gao, H. Pan and Y. Liu, J. Phys. Chem. Lett., 2019, 10, 1872–1877 CrossRef CAS
- M. P. Suh, H. J. Park, T. K. Prasad and D.-W. Lim, Chem. Rev., 2012, 112, 782–835 CrossRef CAS PubMed
- H. W. Langmi, J. Ren, B. North, M. Mathe and D. Bessarabov, Electrochim. Acta, 2014, 128, 368–392 CrossRef CAS
- J. Ren, H. W. Langmi, B. C. North and M. Mathe, Int. J. Energy Res., 2015, 39, 607–620 CrossRef CAS
- S. P. Shet, S. S. Priya, K. Sudhakar and M. Tahir, Int. J. Hydrogen Energy, 2021, 46, 11782–11803 CrossRef CAS
- X. Zhang, P. Liu and Y. Zhang, Inorg. Chim. Acta, 2023, 121683 CrossRef CAS
- M. Rueda, L. M. Sanz-Moral and A. Martin, J. Supercrit. Fluids, 2018, 141, 198–217 CrossRef CAS
- S. Thiangviriya and R. Utke, Int. J. Hydrogen Energy, 2015, 40, 4167–4174 CrossRef CAS
- J. Zheng, Z. Yao, X. Xiao, X. Wang, J. He, M. Chen, H. Cheng, L. Zhang and L. Chen, Int. J. Hydrogen Energy, 2021, 46, 852–864 CrossRef CAS
- M. V. Sofianos, A.-L. Chaudhary, M. Paskevicius, D. A. Sheppard, T. D. Humphries, M. Dornheim and C. E. Buckley, J. Alloys Compd., 2019, 775, 474–480 CrossRef CAS
- J. Zhang, S. Yan and H. Qu, Int. J. Hydrogen Energy, 2018, 43, 1545–1565 CrossRef CAS
- N. A. Strange, N. Leick, S. Shulda, A. Schneemann, V. Stavila, A. S. Lipton, M. F. Toney, T. Gennett and S. T. Christensen, ACS Appl. Energy Mater., 2022, 5, 1690–1700 CrossRef CAS
- M. Fitzgerald, S. Shulda, N. A. Strange, A. Schneemann, V. Stavila, L. F. Wan, K. Gross, T. Gennett, S. Christensen and S. Pylypenko,
et al.
, J. Phys. Chem. C, 2022, 126, 19024–19034 CrossRef CAS
- Y. Jia and X. Yao, Int. J. Hydrogen Energy, 2017, 42, 22933–22941 CrossRef CAS
- K. Xian, B. Nie, Z. Li, M. Gao, Z. Li, C. Shang, Y. Liu, Z. Guo and H. Pan, Chem. Eng. J., 2021, 407, 127156 CrossRef CAS
- Z. Huang, Y. Wang, D. Wang, F. Yang, Z. Wu, L. Wu and Z. Zhang, Phys. Chem. Chem. Phys., 2019, 21, 11226–11233 RSC
- M. Rueda, Ó. Benito-Román, A. Girella, P. Cofrancesco and C. Milanese, J. Energy Storage, 2020, 31, 101674 CrossRef
- A. Schneemann, L. F. Wan, A. S. Lipton, Y.-S. Liu, J. L. Snider, A. A. Baker, J. D. Sugar, C. D. Spataru, J. Guo and T. S. Autrey,
et al.
, ACS Nano, 2020, 14, 10294–10304 CrossRef CAS PubMed
- D. Clémençon, C. Davoisne, J.-N. Chotard and R. Janot, Int. J. Hydrogen Energy, 2019, 44, 4253–4262 CrossRef
- I. Saldan, S. Hino, T. D. Humphries, O. Zavorotynska, M. Chong, C. M. Jensen, S. Deledda and B. C. Hauback, J. Phys. Chem. C, 2014, 118, 23376–23384 CrossRef CAS
- N. A. Strange, N. Leick, R. T. Bell, M. A. Fitzgerald, S. Pylypenko, A. Schneemann, V. Stavila and T. Gennett, Chem. Mater., 2022, 34, 10940–10951 CrossRef CAS
- V. Ozolins, E. Majzoub and C. Wolverton, Phys. Rev. Lett., 2008, 100, 135501 CrossRef CAS PubMed
- K. Chlopek, C. Frommen, A. Léon, O. Zabala and M. Fichtner, J. Mater. Chem., 2007, 17, 3496–3503 RSC
- H. W. Li, K. Kikuchi, Y. Nakamori, K. Miwa, S. Towata and S. Orimo, Scr. Mater., 2007, 57, 679–682 CrossRef CAS
- R. Cerny, Y. Filinchuk, H. Hagemann and K. Yvon, Angew. Chem., 2007, 119, 5867–5869 CrossRef
- J. H. Her, P. W. Stephens, Y. Gao, G. L. Soloveichik, J. Rijssenbeek, M. Andrus and J. C. Zhao, Acta Crystallogr., Sect. B, 2007, 63, 561–568 CrossRef CAS PubMed
- J. Voss, J. Hummelshøj, Z. Łodziana and T. Vegge, J. Phys.: Condens.Matter, 2009, 21, 012203 CrossRef CAS PubMed
- A. Bil, B. Kolb, R. Atkinson, D. G. Pettifor, T. Thonhauser and A. N. Kolmogorov, Phys. Rev. B, 2011, 83, 224103 CrossRef
- A. Giannasi, D. Colognesi, L. Ulivi, M. Zoppi, A. Ramirez-Cuesta, E. Bardají, E. Roehm and M. Fichtner, J. Phys. Chem. A, 2010, 114, 2788–2793 CrossRef CAS PubMed
- J. P. Perdew, K. Burke and M. Ernzerhof, Phys. Rev. Lett., 1996, 77, 3865–3868 CrossRef CAS PubMed
- Y. Zhao and D. Truhlar, Theor. Chem. Acc., 2006, 120, 215–241 Search PubMed
- Y. Zhao and D. Truhlar, J. Phys. Chem. A, 2006, 110, 13126–13130 CrossRef CAS
- S. Grimme, J. Comput. Chem., 2006, 27, 1787–1799 CrossRef CAS PubMed
- S. Grimme, J. Comput. Chem., 2004, 25, 1463–1473 CrossRef CAS PubMed
- B. Civalleri, C. M. Zicovich-Wilson, L. Valenzano and P. Ugliengo, CrystEngComm, 2008, 10, 405–410 RSC
- R. Dovesi, R. Orlando, A. Erba, C. M. Zicovich-Wilson, B. Civalleri, S. Casassa, L. Maschio, M. Ferrabone, M. D. L. Pierre, P. D. Y. Noel, M. Causà, M. Rérat and B. Kirtman, Int. J. Quantum Chem., 2014, 114, 1287–1317 CrossRef CAS
-
R. Dovesi, V. R. Saunders, C. Roetti, R. Orlando, C. M. Zicovich-Wilson, F. Pascale, B. Civalleri, K. Doll, N. M. Harrison, I. J. Bush, P. D'Arco, M. Llunell, M. Causà and Y. Noël, CRYSTAL 2014 User's Manual, University of Torino, Torino, 2014 Search PubMed
- M. F. Peintinger, D. V. Oliveira and T. Bredow, J. Comput. Chem., 2013, 34, 451–459 CrossRef CAS PubMed
- C. G. Broyden, Math. Comput., 1965, 19, 577–593 CrossRef
- D. D. Johnson, Phys. Rev. B: Condens. Matter Mater. Phys., 1988, 38, 12807–12813 CrossRef PubMed
- F. Pascale, C. Zicovich-Wilson, F. Lopez, B. Civalleri, R. Orlando and R. Dovesi, J. Comput. Chem., 2004, 25, 888–897 CrossRef CAS PubMed
- C. Zicovich-Wilson, F. Pascale, C. Roetti, V. R. Saunders, R. Orlando and R. Dovesi, J. Comput. Chem., 2004, 25, 1873–1881 CrossRef CAS PubMed
- M. Ferrero, M. Rérat, R. Orlando and R. Dovesi, J. Comput. Chem., 2008, 29, 1450–1459 CrossRef CAS PubMed
- M. Ferrero, M. Rérat, B. Kirtman and R. Dovesi, J. Chem. Phys., 2008, 129, 244110 CrossRef
- Y. Zhang, E. Majzoub, V. Ozolins and C. Wolverton, J. Phys. Chem. C, 2012, 116, 10522–10528 CrossRef CAS
- S. Kang, T. W. Heo, M. D. Allendorf and B. C. Wood, ChemPhysChem, 2019, 20, 1340–1347 CrossRef CAS
- I. H. Nayyar, B. Ginovska, M. Bowden, G. Edvenson, B. Tran and T. Autrey, J. Phys. Chem. A, 2022, 126, 444–452 CrossRef CAS PubMed
- L. F. Wan, T. Autrey and B. C. Wood, J. Phys. Chem. Lett., 2022, 13, 1908–1913 CrossRef CAS PubMed
- M. Corno, E. Pinatel, P. Ugliengo and M. Baricco, J. Alloys Compd., 2011, 509, S679–S683 CrossRef CAS
Footnote |
| † Electronic supplementary information (ESI) available: Detailed structural information, zoomed figures, and full reaction pathways with energetic data. See DOI: https://doi.org/10.1039/d3ra08710g |
| This journal is © The Royal Society of Chemistry 2024 |