 Open Access Article
Preparation, characterization, and photocatalytic performance of a PVDF/cellulose membrane modified with nano Fe3O4 for removal of methylene blue using RSM under visible light†
Shaghayegh Mohammadpoura,
Peyman Najafi Moghadama and
Parvin Gharbani *bc
*bc
aDepartment of Organic Chemistry, Faculty of Chemistry, Urmia University, Urmia, 57153-165, Iran
bDepartment Chemistry, Ahar Branch, Islamic Azad University, Ahar, Iran. E-mail: parvingharbani@yahoo.com
cIndustrial Nanotechnology Research Center, Tabriz Branch, Islamic Azad University, Tabriz, Iran
First published on 15th March 2024
Abstract
In this work, a polymeric membrane-based polyvinylidene fluoride coated with cellulose and loaded with iron oxide nanoparticles (PVDF/cellulose/Fe3O4) was synthesized and was characterized using FESEM, XRD, AFM, and contact angle measurements. The activity and modification of the PVDF/cellulose/Fe3O4 membrane under visible light for the removal of methylene blue were studied using the central composite design. The effect of influential variables such as pH, methylene blue concentration, amount of Fe3O4 in the membrane, and irradiation time on MB removal was investigated. Analysis of variance was used to determine the significance of experimental factors and their interactions. About 72.5% methylene blue removal using the PVDF/cellulose/Fe3O4 membrane under visible light was achieved at optimum conditions of a pH of 9, methylene blue concentration of 600 mg L−1, Fe3O4 amount of 0.03 g, and irradiation time of 117 min. Finally, results confirmed that the proposed membrane has good performance for methylene blue removal under visible light.
Introduction
It is very important to provide high-quality water for various industries and communities, as well as to remove and recycle toxic components from industrial wastewater.1 The most critical pollutants of industrial wastewater are organic substances, toxins, surfactants, heavy metals, antibiotics, and dyes, which cause irreparable damage when entering the environment.2 Various methods have been proposed for the removal of pollutants (i.e., adsorption, biological, electrochemical, photocatalytic separation techniques, nanomembrane, and ultra-membrane systems).3,4 Membrane systems have been widely used due to their low energy consumption, non-pollution properties, and ease of conversion to a larger scale.4New types of membranes have been prepared for water and wastewater filtration based on polymers such as polysulfone,4 polyvinylidene fluoride,5 polyaniline,6 and polyacrylonitrile,7 which have shown high efficiency in filtration. In recent years, nanocomposite membranes have expanded, enhancing the separation performance in membrane technology.8 These membranes may show better mechanical, chemical, and thermal stability and high separation yield, high reactivity, and capacity.
Polyvinylidene fluoride (PVDF) is a fluoropolymer with repeating units of –CH2 and –CF2 groups. These groups create polarity on the polymer chain and allow the dissolving of the polymer in certain solvents. The arrangement of –CF2 and –CH2 groups along the polymer chain creates distinct properties of polymer crystal structure. The factors that directly affect the mechanical properties and resistance of the membrane include polymer crystallinity and membrane morphology. Increasing the crystallinity of PVDF causes hardness and creep resistance. Until now, PVDF/SiO2,9 PVDF/GeO2,9 PVDF/GO,10 and nanocomposites have been prepared, but these produced composites had poor mechanical properties. Therefore, modifying materials is required to increase the mechanical properties of PVDF.
Cellulose is a carbohydrate with abundant functional groups on its surface with a high surface area.11 These surface functional groups (C![[double bond, length as m-dash]](https://www.rsc.org/images/entities/char_e001.gif) O and C–OH) can increase the dispersion of cellulose and strengthen the intermolecular interaction with PVDF due to the extended chain composition.12
O and C–OH) can increase the dispersion of cellulose and strengthen the intermolecular interaction with PVDF due to the extended chain composition.12
On the other hand, the CF groups of PVDF and the –COOH/–OH in cellulose form a hydrogen bond, leading to an all-trans TTTT conformation.13 Also, cellulose has high thermal stability and hydrophobicity and its high thermal stability will lead to a decrease in the degree of crystalline and, as a result, a better coating on PVDF.14 Therefore, it can be a good candidate to composite with PVDF.
Research shows that the addition of nanoparticles to the polymer matrix has a positive effect on the membrane properties and can significantly improve its separation properties.15,16 It means adding nanoparticles and metal oxides to polymer membranes is a very effective method in reducing membrane fouling and increasing the removal efficiency.17
Among the various nanoparticles, Fe3O4 is considered the most effective due to the easy preparation, exceptional conductivity, favorable magnetic properties, non-toxicity, and finally the nature of high photo responsiveness.18 Also, Fe3O4 nanoparticles exhibit a high surface-to-volume ratio and show an enhanced capacity for pollutant removal.19 The remarkable activity of Fe3O4 in removing environmental pollution has been proved by researchers. However, its disadvantage is the high rate of electron–hole pair recombination and agglomeration, which reduces its photo catalytic efficiency. Therefore, it should be modified in combination with other materials.20
The objectives of this study were to create a PVDF polymeric membrane with the addition of cellulose and nano Fe3O4 for the photo catalytic removal of Methylene blue (MB). In the Photo catalytic process, light was used to degrade organic pollutants.21
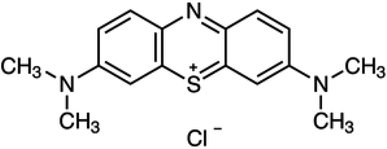
Methylene blue as a cationic dye is widely used in dyeing industries (Fig. 1). It can cause harmful effects such as eye irritation, heart palpitations, and shortness of breath in humans. Therefore, its removal from industrial wastewater has become a serious problem.22–25
In these membranes, the exitance of Fe3O4 nanoparticles improves the oxidation of Methylene Blue dye under visible light. On the other hand, the stabilization of Fe3O4 in the polymer matrix reduces the costs associated with conventional heterogeneous catalysis, where the nanoparticles must be recovered after use. For the optimization process, the response surface methodology (RSM) was chosen to evaluate the membrane performance. Four effective parameters i.e., MB concentration, pH, amount of Fe3O4 in the membrane matrix, and irradiation time were used as input variables.
Materials and methods
Polyvinylidene fluoride (PVDF, Mw ∼534![[thin space (1/6-em)]](https://www.rsc.org/images/entities/char_2009.gif) 000 g mol−1), methylene blue, cellulose (microcrystalline, powder, 20 μm) and Fe3O4 nanoparticles (Av = 30 nm) were prepared from Sigma-Aldrich. Dimethylformamide, HCl, NaOH and acetone were purchased from Merck Company.
000 g mol−1), methylene blue, cellulose (microcrystalline, powder, 20 μm) and Fe3O4 nanoparticles (Av = 30 nm) were prepared from Sigma-Aldrich. Dimethylformamide, HCl, NaOH and acetone were purchased from Merck Company.
Preparation of PVDF/cellulose/Fe3O4 membrane
1.4 g of PVDF, 10 mL of acetone, and 10 mL DMF were stirred for 20 min at 30 °C. Then 0.02 g of cellulose and 0.01, 0.02, and 0.03 g of Fe3O4 nanoparticles were added and stirred for 1 h at 30 °C. The obtained solution was ultrasound for 2 h. Then, the membrane-casting dope was cast on clean glass using a blade and left during the night at room temperature. The PVDF and PVDF/cellulose membranes were prepared as mentioned except without adding cellulose and Fe3O4, respectively. The obtained membranes were rinsed with distillate water and dried at room temperature.Removal of methylene blue
The Box–Behnken Design (BBD) was used to design the experiments and produce the quadratic model of the process. Variables including MB concentration (A), pH (B), Fe3O4 amount in the membrane matrix (C) and irradiation time (D) were selected (Table 1).| Parameter | Levels | ||
|---|---|---|---|
| −1 | 0 | +1 | |
| x1: [MB]0 (mg L−1) | 200 | 400 | 600 |
| x2: pH | 3 | 6 | 9 |
| x3: [Fe3O4]0 (g) | 0.01 | 0.02 | 0.03 |
| x4: Irradiation time (min) | 60 | 90 | 120 |
Using variables at three levels, twenty-nine experiments were designed. The photocatalytic performance of the prepared membrane was performed in a batch system that included a crystallizer with a volume of 100 mL containing MB solution and Xe lamp (λ > 420 nm) as a light source which was located on top of the wooden box. The membrane was cut into small pieces (2 cm2) and was added to the dye solution in a wooden box on a stirrer. The pH of the MB solution was determined using HCl and NaOH solutions. At certain time intervals, 5 mL of the solution was collected for analysis by UV-vis spectrophotometer, model DR5000-15V (HACH Co, America) at 434 nm. The photocatalytic degradation of MB was obtained using the following equation (eqn (1)).26
 | (1) |
Results and discussion
Characterization
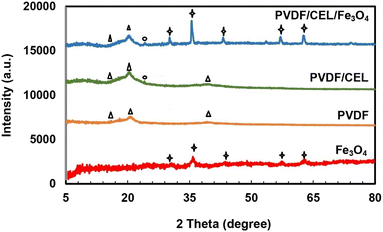
XRD analysis was used to study the crystal structure of synthesized samples.27 X-ray diffraction patterns of Fe3O4, PVDF, PVDF/cellulose, and PVDF/cellulose/Fe3O4 membranes are shown in Fig. 2. In the XRD pattern of Fe3O4, an observed peak at 35.71° (3 11) belongs to a crystal plane. Other peaks appeared at 2θ = 30.31° (2 0 0), 43.37° (4 0 0), 57.39° (5 1 1), and 62.86° (4 0 0) according to JCPDS Card No. 19-0629.28 In the XRD pattern of PVDF, three peaks appear around 2θ = 18.04, 20.65, and 36.4° correspond to the crystalline peaks (021), (110), and (020) of PVDF crystalline phase,6 respectively. Standard XRD patterns of cellulose, Fe3O4 and PVDF is shown in Fig. 2. In the XRD of the PVDF/cellulose, in addition to the peaks of PVDF, a peak is seen at 2θ = 22°, which is related to the crystalline phase (001) of cellulose that emphasizes the presence of cellulose.13 The presence of peaks appearing at 2θ = 30.16, 57, and 63° in the XRD of PVDF/cellulose/Fe3O4 confirms the presence of pure Fe3O4 with a spinel structure. The peaks of PVDF and cellulose can also be seen.FESEM analysis was used to evaluate the morphology of prepared membranes.29 Fig. 3 shows the FESEM images of the surface and cross-section of prepared membranes. The surface image of the PVDF membrane shows a relatively dense membrane, while its cross-sectional image shows a relatively non-uniform structure. The surface image of the PVDF/cellulose membrane shows a very uniform and porous surface, which confirms that the addition of cellulose has made the relatively uniform surface of the PVDF. The cross-sectional image of PVDF/cellulose shows that cross-links are formed. After adding Fe3O4 nanoparticles to the PVDF/cellulose membrane, the Fe3O4 nanoparticles (red pen) are uniformly distributed on the surface of the PVDF/cellulose membrane. The cross-sectional FESEM image clearly shows the dispersion of Fe3O4 spherical nanoparticles on the membrane.
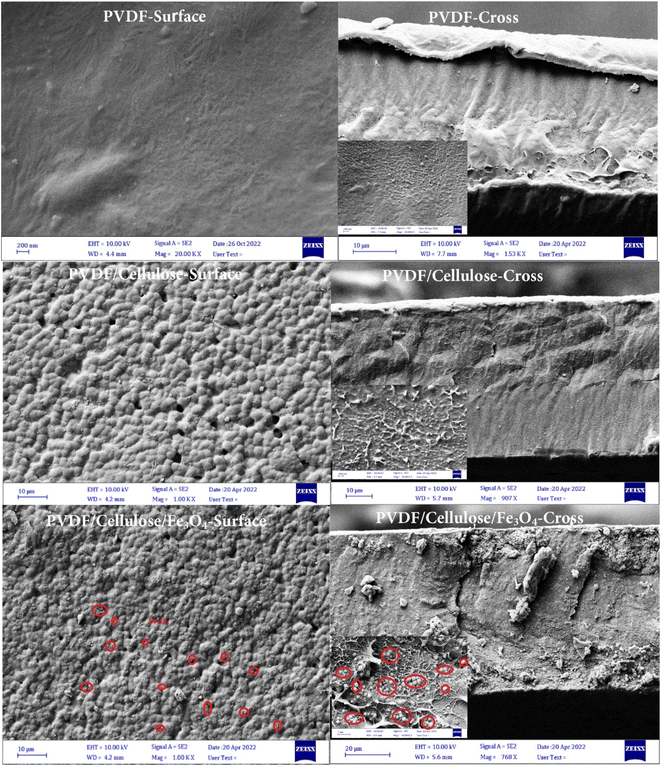 | ||
| Fig. 3 FESEM images of surface and cross-section of PVDF, PVDF/cellulose and PVDF/cellulose/Fe3O4 membranes. | ||
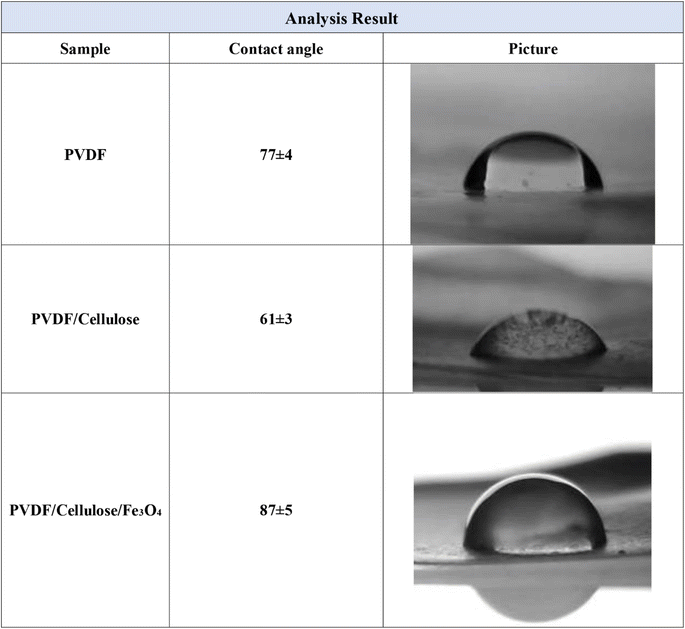
Contact Angle (CA) measurement is a simple method to obtain and collect information about the hydrophobicity/hydrophilicity of the membranes. The contact angle of the outer surface of the membranes was measured before and after the coating (Fig. 4). As seen, the contact angles of the PVDF, PVDF/cellulose, and PVDF/cellulose/Fe3O4 membranes are about 77, 61, and 87. The contact angle decreases slightly with the increase of cellulose concentration, while it increases slightly with the dispersion of Fe3O4 nanoparticles on PVDF/cellulose. However, it can be concluded that all three membranes are hydrophile and the dispersion of Fe3O4 nanoparticles on the PVDF/cellulose membrane slightly decreases the hydrophilicity of the membrane.
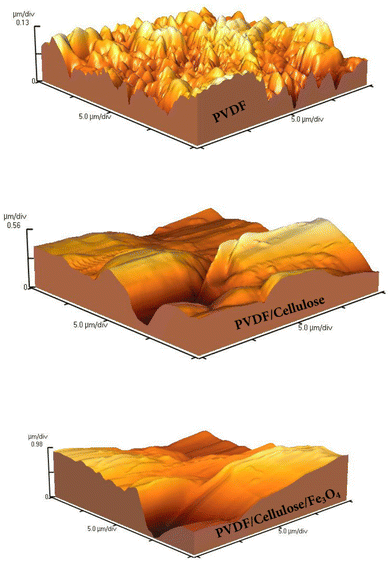
AFM analysis was used to evaluate the surface morphology and roughness of membranes.29 Root mean square (RMS) was obtained from the AFM images. The thickness, average roughness (Ra), and RMS roughness of prepared membranes are presented in Table 2. As seen, the Ra values for PVDF, PVDF/cellulose, and PVDF/cellulose/Fe3O4 were obtained at 32.92, 141.3, and 311.7 nm, respectively. Likewise, the RMS values for PVDF, PVDF/cellulose and PVDF/cellulose/Fe3O4 were obtained at about 40.83 nm, 180.4 nm, and 384 nm, respectively. The results confirm that the roughness of the PVDF membrane increased with the addition of cellulose and Fe3O4 nanoparticles due to increasing the viscosity of the solution.5 It is important to state that the contact angle between the water drop and the surface of the material in addition to the hydrophilicity of the surface, also depends on its roughness. The results show that the addition of mineral particles into the polymer matrix increases the surface roughness. The results of AFM analysis for prepared membranes are shown in Fig. 5.
| Membrane | Thickness (μm) | RMS (nm) | Ra (nm) |
|---|---|---|---|
| PVDF | 162.1 | 40.83 | 32.92 |
| PVDF/cellulose | 796.3 | 180.4 | 141.3 |
| PVDF/cellulose/Fe3O4 | 1818 | 384.0 | 311.7 |
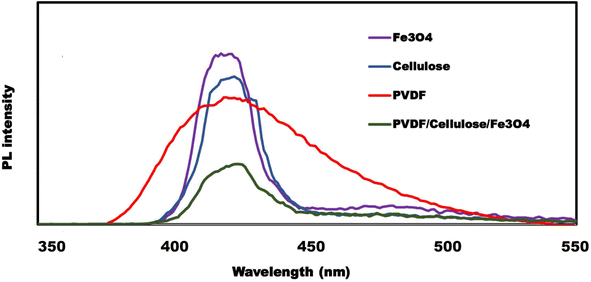
Recombination of electron–hole pairs in semiconductors releases energy in the form of photoluminescence (PL), and lower PL intensity indicates a lower carrier recombination rate, which leads to efficient photocatalytic activity.32
The intensity of the PL spectrum depends on the rate of recombination of electron–hole pairs and PL spectroscopy is used to investigate photogenerated electron–hole trapping, migration, and transport. Fig. 7 shows the photoluminescence (PL) of cellulose, PVDF, Fe3O4 and PVDF/cellulose/nana Fe3O4 with an excitation wavelength of 320 nm. The low PL intensity of PVDF/cellulose/nana Fe3O4 indicates more separation of photogenerated electron–hole pairs, which is very satisfactory for efficient photocatalytic performance. Therefore, the decrease in electron–hole recombination rate leads to high photocatalytic activity.33
Box–Behnken Design (BBD) and statistical analysis
Under the design conditions and various experiments proposed by the RSM (Table 3), the removal percentage of MB increases from 52.55 to 76.44%.| Run | Parameter values | Removal (%) | |||
|---|---|---|---|---|---|
| x1 | x2 | x3 | x4 | Exp. | |
| 1 | 400 | 6 | 0.03 | 60 | 65.53 |
| 2 | 400 | 6 | 0.02 | 90 | 65.55 |
| 3 | 200 | 6 | 0.02 | 120 | 69.00 |
| 4 | 200 | 6 | 0.03 | 90 | 70.71 |
| 5 | 400 | 9 | 0.02 | 120 | 74.93 |
| 6 | 600 | 6 | 0.02 | 120 | 65.65 |
| 7 | 400 | 6 | 0.02 | 90 | 64.33 |
| 8 | 600 | 6 | 0.03 | 90 | 66.64 |
| 9 | 200 | 3 | 0.02 | 90 | 54.61 |
| 10 | 400 | 3 | 0.01 | 90 | 52.55 |
| 11 | 400 | 6 | 0.01 | 120 | 62.40 |
| 12 | 400 | 3 | 0.02 | 60 | 53.95 |
| 13 | 200 | 6 | 0.02 | 60 | 62.22 |
| 14 | 400 | 6 | 0.03 | 120 | 72.16 |
| 15 | 600 | 6 | 0.02 | 60 | 59.36 |
| 16 | 400 | 6 | 0.01 | 60 | 55.25 |
| 17 | 400 | 3 | 0.02 | 120 | 60.59 |
| 18 | 400 | 6 | 0.02 | 90 | 64.03 |
| 19 | 400 | 9 | 0.01 | 90 | 66.53 |
| 20 | 600 | 9 | 0.02 | 90 | 69.72 |
| 21 | 400 | 3 | 0.03 | 90 | 61.22 |
| 22 | 200 | 6 | 0.01 | 90 | 61.90 |
| 23 | 600 | 3 | 0.02 | 90 | 54.18 |
| 24 | 400 | 9 | 0.02 | 60 | 68.10 |
| 25 | 200 | 9 | 0.02 | 90 | 73.76 |
| 26 | 400 | 6 | 0.02 | 90 | 64.94 |
| 27 | 600 | 6 | 0.01 | 90 | 57.71 |
| 28 | 400 | 6 | 0.02 | 90 | 64.63 |
| 29 | 400 | 9 | 0.03 | 90 | 76.44 |
A polynomial mathematical equation showing the obtained R%, as a function of MB concentration (A), pH (B), Fe3O4 nanoparticles amount in the membrane matrix (C), and irradiation time (D) is revealed using eqn (2).
| R = 64.7 − 1.58 × A + 7.7 × B + 4.7 × C + 3.36 × D − 0.9 × A × B + 0.03 × A × C0.12 × A × D + 0.31 × B × C + 0.048 × B × D − 0.13 × C × D − 0.63 × A2 − 0.49 × B2 − 0.18 × C2 − 0.17D2 | (2) |
Analysis of variance (ANOVA)
ANOVA was used as a statistical method to analyze the responses. R2 and R2 Adj determined the quality of the presented polynomial model. The results of ANOVA and multiple regression coefficients of MB removal are tabulated in Table 4. The significance and influence of each independent variable were determined using F-values. The practicability and statistical significance results were confirmed using prob > F. In general, a significance level of 0.05 is considered in RSM.34 In this research, the upper F value of 88.38 and p < 0.0001 expresses the significance of the model (F < prob less than 0.05 indicates that the model is statistically significant), and the results show that the model can explain the percentage of MB removal. On the other hand, the lack of fit (LOF) of 0.1245 indicates that the regression equation can be used to explain the relationship between the response variables and the removal percentage. According to the p-value of the independent variables, the variables A, B, C, and D are statistically significant (p < 0.05), while, AC, AD, AB, BC, BD, CD, A2, B2, C2, and D2 are not significant (p > 0.05). The high value of the linear regression coefficient R2 (0.9888) and R2 adjusted (0.9776) indicate a good performance of the model. Notably, R2 of 0.9888 indicates that more than 98.88% of the changes in the response function can be justified by the obtained model. In other words, the regression model is statistically significant. Adeq precision of 35.77 > 4 indicates the signal-to-noise ratio was desirable for the model. Parallel to these results, the relatively low value of CV% = 1.5 for variables confirms the accuracy of the measurements and the reliability of the tests. Std dev. of 0.96 and press of 69.12 indicate the matching of the model with the experimental results.| Sum of | Mean | F | p-Value | ||
|---|---|---|---|---|---|
| Source | Squares | Df | Square | Value | Prob > F |
| Model | 1148.52 | 14 | 82.04 | 88.38 | < 0.0001 |
| A-concentration | 29.88 | 1 | 29.88 | 32.19 | < 0.0001 |
| B-pH | 711.14 | 1 | 711.14 | 766.1 | < 0.0001 |
| C-Fe3O4 | 264.71 | 1 | 264.71 | 285.16 | < 0.0001 |
| D-time | 135.5 | 1 | 135.5 | 145.98 | < 0.0001 |
| AB | 3.25 | 1 | 3.25 | 3.51 | 0.0822 |
| AC | 3.58 × 10⁻³ | 1 | 3.58 × 10⁻³ | 3.86 × 10⁻³ | 0.9513 |
| AD | 0.062 | 1 | 0.062 | 0.067 | 0.8 |
| BC | 0.38 | 1 | 0.38 | 0.41 | 0.5308 |
| BD | 9.35 × 10⁻³ | 1 | 9.35 × 10⁻³ | 0.01 | 0.9215 |
| CD | 0.069 | 1 | 0.069 | 0.074 | 0.7898 |
| A2 | 2.57 | 1 | 2.57 | 2.77 | 0.1182 |
| B2 | 1.56 | 1 | 1.56 | 1.68 | 0.2155 |
| C2 | 0.21 | 1 | 0.21 | 0.23 | 0.6417 |
| D2 | 0.18 | 1 | 0.18 | 0.2 | 0.6651 |
| Residual | 13 | 14 | 0.93 | ||
| Lack of fit | 11.63 | 10 | 1.16 | 3.41 | 0.1245 |
| Pure error | 1.37 | 4 | 0.34 | ||
| Cor total | 1161.52 | 28 | |||
| Std dev. | 0.96 | R-squared | 0.9888 | ||
| Mean | 64.09 | Adj. R-squared | 0.9776 | ||
| C.V. % | 1.5 | Pred. R-squared | 0.9405 | ||
| Press | 69.12 | Adeq. precision | 35.776 | ||
Effect of the variables as a response surface and 3D plots
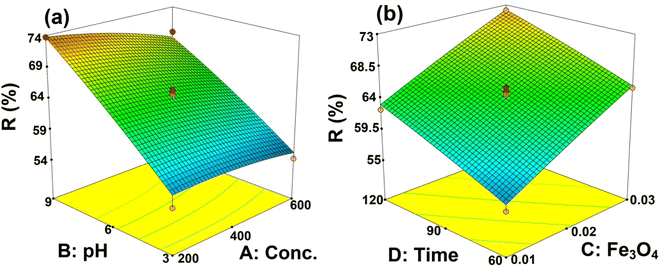
To study the interaction of variables, three-dimensional (3D) plots were used. The effect of the input parameters on the response variable is shown in Fig. 8. This figure shows that increasing the initial concentration of the MB, irradiation time, the amount of Fe3O4 in the membrane, and the pH leads to an increase in MB removal.The pH of the solution is one of the important parameters in the photocatalytic process, which affects the charge of active sites available on the membrane surface. As can be seen in Fig. 8a, the prepared membrane is more effective in an alkaline solution. At high pH values, the surface of the membrane is negatively charged and since the MB is a cationic dye, significant electrostatic interaction with the positively charged MB and negatively charged membrane is obtained.35 Also, the produced hydroxyl radicals can enhance the MB removal at higher pHs.
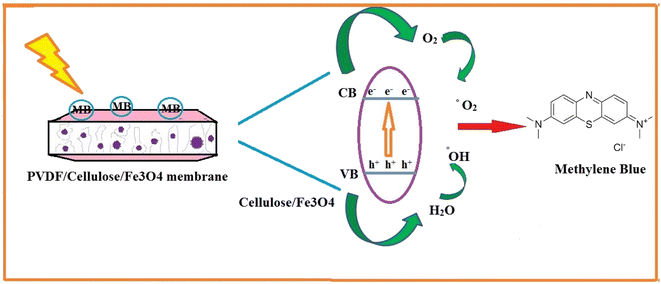
Increasing the initial concentration of MB has a positive effect on MB removal efficiency (Fig. 8a). In fact, increasing the initial concentration of MB provides a higher driving force to overcome all existing resistances in MB mass transfer between the surface membrane and liquid phase. Fig. 8b shows that Fe3O4 increasing in the membrane has an affirmative effect on MB removal. The photogenerated electrons and holes from the conduction and valence band of Fe3O4 participate in the degradation process.36 Also, since OH radicals are generated and react in the vicinity of Fe3O4, it is important that MB molecules can attach to the Fe3O4 surface for the catalytic reaction to occur. It can be stated that MB molecules are adsorbed first on Fe3O4 active catalytic sites and then oxidized by photo-induced OH radicals. Under visible light, Fe3O4 is excited, electrons and holes are generated, and MB degradation is enhanced.37 Also, Fig. 8b illustrates irradiation time on the removal of MB under visible light. The increase in MB removal with increasing irradiation time can be related to more MB adsorption and more Fe3O4 oxidation on the surface of the membrane with increasing time.
Optimization
The main goal of the experiment design is to achieve the optimal values of the variables for the MB removal. The optimization results indicate that about 72.5% of MB is removed with PVDF/cellulose/Fe3O4 membrane at a pH of 9, MB concentration of 600 mg L−1, and 0.03 g of Fe3O4 at 117 min.Table 5 shows the photo degradation efficiency of MB removal compared with other Fe3O4-based photocatalyst.
| Photocatalyst | Pollutant | % removal | Ref |
|---|---|---|---|
| Fe3O4-MWCNTs | Methylene blue | 98.46 | 40 |
| Fe3O4@Ag@TiO2 | Methylene blue | 79.91 | 41 |
| r-GO-Fe3O4 | Methylene blue | 98.38 | 42 |
| δ-Fe3O4@GO | Methylene blue | 90.6 | 43 |
| Fe3O4@SiO2 @TiO2 | Methylene blue | 97.0 | 44 |
| GO-LaFeO3 | Methylene blue | 91.21 | 45 |
| Fe3O4@SiO2 | Methylene blue | 94.83 | 46 |
| Fe3O4@SiO2 @TiO2 | Methylene blue | 94.8 | 47 |
| Fe2O3/graphene/CuO | Methylene blue | 94.27 | 48 |
| Fe3O4@C@Ru | Methylene blue | 92.71 | 49 |
| PVDF/cellulose/Fe3O4 | Methylene blue | 72.50 | This paper |
As seen in Table 5, the efficiency of PVDF/cellulose/nano Fe3O4 membrane on removal of MB in comparison to others is lower. In contrast, other photocatalysts need to recover after usage but in the case of this membrane, there is no need to recover the photocatalyst after the removal of MB.
Conclusion
In this research, PVDF/cellulose/Fe3O4 membrane was synthesized and analyzed using XRD, FESEM, AFM, and contact angle measurement (CA). The design of experiments was done using response surface methodology and modeling and optimization of operational parameters were carried out. The results showed that the increase of pH, irradiation time, MB concentration, and amount of Fe3O4 in the membrane had an affirmative effect on the MB removal. Therefore, the PVDF/cellulose/Fe3O4 membrane is an efficient membrane for removing MB under visible light. Also, the RSM has a good agreement with being able to provide a suitable model for the removal of MB, and the percentage of predicted removal of MB is in good agreement with the experimental results.Data availability
All data generated or analysed during this study are included in this published article (and its ESI† files).Author contributions
Parvin Gharbani: conceptualization, methodology, formal analysis, writing – review & editing. Peyman Najafi Moghadam: funding acquisition, project administration, writing – review & editing. Shaghayegh Mohammadpour: methodology.Conflicts of interest
The authors declare that there is no conflict of interest.References
- A. Mehrizad, M. Aghaie, P. Gharbani, S. Dastmalchi, M. Monajjemi and K. Zare, J. Environ. Health Sci. Eng., 2012, 9, 1–6 Search PubMed.
- H. Sun, L. Wang, F. Guo, Y. Shi, L. Li, Z. Xu, X. Yan and W. Shi, J. Alloys Compd., 2022, 900, 163410–163423 CrossRef CAS.
- Z. Xu, Y. Shi, L. Li, H. Sun, M. S. Amin, F. Guo, H. Wen and W. Shi, J. Alloys Compd., 2022, 895, 162667–162678 CrossRef CAS.
- S. Gasemloo, M. R. Sohrabi, M. Khosravi, S. Dastmalchi and P. Gharbani P, Water Sci. Technol., 2016, 14, 2611–2619 CrossRef PubMed.
- P. Hassanzadeh, P. Gharbani, F. Derakhshanfard and B. M. Maher, J. Polym. Environ., 2021, 1–10 Search PubMed.
- M. Beheshtikya and P. Gharabani, J. water wastewater, 2019, 61–72 CAS.
- N. Scharnagl N and H. Buschatz, Desalination, 2001, 139, 191–198 CrossRef.
- S. Sorribas, P. Gorgojo, C. Téllez, J. Coronas and A. G. Livingston, J. Am. Chem. Soc., 2013, 135, 15201–15208 CrossRef CAS.
- E. Kar, N. Bose, S. Das, N. Mukherjee and S. Mukherjee, Phys. Chem. Chem. Phys., 2015, 17, 22784–22798 RSC.
- P. Gharbani, A. Mehrizad and I. Jafarpour, Pol. J. Chem. Technol., 2015, 17, 95–99 CrossRef CAS.
- J. E. Lee, Y. E. Shin, G. H. Lee, J. Kim, H. Ko and H. G. Chae, Composites, Part B, 2021, 223, 109098 CrossRef CAS.
- B. Ma, J. Yang, Q. Sun, W. Jakpa, X. Hou and Y. Yang, J. Mater. Sci., 2017, 52, 9946–9957 CrossRef CAS.
- Y. Li, Q. Hu, R. Zhang, W. Ma, S. Pan, Y. Zhao, Q. Wang and P. Fang, Materials, 2022, 10, 7026 CrossRef PubMed.
- M. Li, B. Jiang, S. Cao, X. Song, Y. Zhang, L. Huang and Q. Yuan, RSC Adv., 2023, 13, 10204–10214 RSC.
- J.-E. Lee, Y.-E. Shin, G.-H. Lee, J. Kim, H. Ko and H. G. Chae, Composites, Part B, 2021, 223, 109098 CrossRef CAS.
- E.-S. Kim, Y. Liu and M. G. El-Din, J. Membr. Sci., 2013, 429, 418–427 CrossRef CAS.
- Y. Zhao, Z. Xu, M. Shan, C. Min, B. Zhou, Y. Li, B. Li, L. Liu and X. Qian, Sep. Purif. Technol., 2013, 103, 78–83 CrossRef CAS.
- P. Mishra, S. Patnaik and K. Parida, Catal. Sci. Technol., 2019, 9, 916–941 RSC.
- P. Mishra, A. Behera, D. Kandi, S. Ratha and K. Parida, Inorg. Chem., 2020, 59, 4255–4572 CrossRef CAS.
- D. K. Padhi, T. K. Panigrahi, K. Parida, S. K. Singh and D. P. Mishra, ACS Sustain. Chem. Eng., 2017, 5, 10551–10562 CrossRef CAS.
- A. Mehrizad and P. Gharbani, Prog. Color, Color. Coat., 2016, 9(2), 135–143 CAS.
- S. Nayak, K. K. Das and K. Parida K, J. Colloid Interface Sci., 2023, 634, 121–137 CrossRef CAS PubMed.
- W. Shi, H. Chenchen, S. Yuxing, F. Guo and Y. Tang, Sep. Purif. Technol., 2023, 304, 122337–122340 CrossRef CAS.
- D. K. Padhi, K. M. Parida and S. K. Singh, J. Environ. Chem. Eng., 2016, 4, 3498–3511 CrossRef CAS.
- J. Pan, L. Wang, Y. Shi, L. Li, Z. Xu, H. Sun, F. Guo and W. Shi, Sep. Purif. Technol., 2022, 284, 120270–120280 CrossRef CAS.
- S. Nayak, G. Swain and K. Parida, ACS Appl. Mater. Interfaces, 2019, 11, 20923–20942 CrossRef CAS PubMed.
- K. K. Das, D. P. Sahoo, S. Mansingh and K. Parida, ACS Omega, 2021, 6, 30401–30418 CrossRef PubMed.
- S. Mansingh, D. K. Padhi and K. Parida, Appl. Surf. Sci., 2019, 466, 679–690 CrossRef CAS.
- F. Guo, Z. Chen, X. Huang, L. Cao, X. Cheng, W. Shi and L. Chen, Sep. Purif. Technol., 2021, 275, 119223–119233 CrossRef CAS.
- K. K. Das, S. Patnaik, B. Nanda, A. C. Pradhan and K. Parida, ChemistrySelect, 2019, 4, 1806–1819 CrossRef CAS.
- K. K. Das, S. Patnaik, S. Mansingh, A. Behera, A. Mohanty, C. Acharya and K. M. Parida, J. Colloid Interface Sci., 2020, 561, 551–567 CrossRef CAS PubMed.
- X. Sun, K. He, Z. Chen, H. Yuan, F. Guo and W. Shi, Sep. Purif. Technol., 2023, 324, 124600 CrossRef CAS.
- K. K. Das, S. Mansingh, R. Mohanty, D. P. Sahoo, N. Priyadarshini and K. Parida, J. Phys. Chem. C, 2022, 127, 22–40 CrossRef.
- P. Gharbani, J. Mol. Liq., 2017, 242, 229–234 CrossRef CAS.
- X. Lin, X. Wang, Q. Zhou, C. Wen, S. Su, J. Xiang, P. Cheng, X. Hu, Y. Li and X. Wang, ACS Sustain. Chem. Eng., 2018, 7, 1673–1682 CrossRef.
- W. Shi, H. Chenchen, F. Yongming, G. Feng, T. Yubin and Y. Xu, J. Chem. Eng., 2022, 433, 133741–133744 CrossRef CAS.
- P. Gharbani, A. Mehrizad and S. A. Mosavi, npj Clean Water, 2022, 5(1), 34 CrossRef CAS.
- S. Mansingh, S. Sultana, R. Acharya, M. K. Ghosh and K. M. Parida, Inorg. Chem., 2020, 59, 3856–3873 CrossRef CAS PubMed.
- L. Chen, J. Wang, X. Li, C. Zhao, X. Hu, Y. Wu and Y. He, Inorg. Chem. Front., 2022, 9, 2714–2722 RSC.
- S. Hussain, M. D. Alam, M. Imran, M. A. Ali, T. Ahamad, A. S. Haidyrah, S. M. A. Raji Alotaibi and M. Shariq, Alexandria Eng. J., 2022, 61(11), 9107–9117 CrossRef.
- W. J. Tseng, Y.-C. Chuang and Y.-A. Chen, Adv. Powder Technol., 2018, 29(3), 664–671 CrossRef CAS.
- M. Imran, M. M. Alam, S. Hussain, M. A. Ali, M. Shkir, A. Mohammad, T. Ahamad, A. Kaushik, K. Irshad, M. M. Alam, S. Hussain, M. A. Ali, M. Shkir, M. Akbar, T. Ahamad, A. Kaushik and K. Irshad, Ceram. Int., 2021, 47(22), 31973–31982 CrossRef CAS.
- A. Rehman, A. Daud, M. F. Warsi, I. Shakir, P. O. Agboola, M. I. Sarwar and S. Zulfiqar, Mater. Chem. Phys., 2020, 256, 123752 CrossRef CAS.
- C. I. Tarcea, C. M. Pantilimon, E. Matei, A. M. Predescu, A. C. Berbecaru, M. Rapa, A. Turcanu and C. Predescu, IOP Conf. Ser.: Mater. Sci. Eng., 2020, 877, 012008 CAS.
- M. A. Mutalib, F. Aziz, N. A. Jamaludin, N. Yahya, A. F. Ismail, M. A. Mohamed, M. Z. M. Yusop, W. N. W. Salleh, J. Jaafar and N. Yusof, Korean J. Chem. Eng., 2018, 35(2), 548–556 CrossRef.
- S. Dagher, A. Soliman, A. Ziout, N. Tit, A. Hilal-Alnaqbi, S. Khashan, F. Alnaimat and J. Abu Qudeiri, Mater. Res. Express, 2018, 5(6), 065518–065531 CrossRef.
- Í. L. Fernandes, D. Pereira Barbosa, S. Botelho de Oliveira, V. Antônio da Silva, M. Henrique Sousa, M. Montero-Muñoz and J. A. H. Coaquira, Appl. Surf. Sci., 2022, 580, 152195 CrossRef.
- P. Nuengmatcha, P. Porrawatkul, S. Chanthai, P. Sricharoen and N. Limchoowong, J. Environ. Chem. Eng., 2019, 7, 103438 CrossRef CAS.
- Q. Zhang, L. Yu, C. Xu, J. Zhao, H. Pan, M. Chen, Q. Xu and G. Diao, Appl. Surf. Sci., 2019, 483, 241–251 CrossRef CAS.
Footnote |
| † Electronic supplementary information (ESI) available. See DOI: https://doi.org/10.1039/d3ra08599f |
| This journal is © The Royal Society of Chemistry 2024 |

