DOI:
10.1039/D3RA08317A
(Paper)
RSC Adv., 2024,
14, 4165-4178
Exploring the mechanical, vibrational optoelectronic, and thermoelectric properties of novel half-Heusler FeTaX (X = P, As): a first-principles study
Received
6th December 2023
, Accepted 6th January 2024
First published on 30th January 2024
Abstract
In this study, the density functional theory (DFT) was employed to study the structural, electronic, optical, and thermoelectric characteristics of half-Heusler (HH) FeTaX (X = P or As). Optimization of the structures was achieved using Perdew–Burke–Ernzerhof (PBE) parametrized generalized gradient approximation (GGA). These HH FeTaX (X = P, As) showed indirect bandgaps of 0.882 eV and 0.748 eV, respectively. The predicted density of states (DOS) spectra suggest that Fe-d and Ta-d states contribute predominantly to both valence and conduction bands, whereas P/As-p states contribute less. Optical properties were investigated to assess their potential in optoelectronic applications. The estimated values of various optical parameters and low loss suggest that the studied HH FeTaX (X = P, As) are suitable for optoelectronic device applications. The thermoelectric responses of the studied HH FeTaX (X = P, As) were computed, and their highest power factors at high temperature reflects their usage in thermoelectric devices.
1. Introduction
In response to the escalating energy demands and the depletion of natural resources, there is a pressing necessity for alternative energy sources. A promising approach to address this issue is the development of novel thermoelectric (TE) materials that enable the direct conversion of waste heat into electricity.1–3 The performance of these materials in thermoelectric devices can be assessed using a parameter known as the figure of merit (ZT). ZT is expressed as S2σT/κ, where S2σ stands for the power factor (PF), S is the Seebeck coefficient, σ is the electrical conductivity, κ is the thermal conductivity, and T is the absolute temperature. For maximum performance, a material must have low κ and optimum S2σ.4,5 Owing to their outstanding mechanical stability and high ZT values, half-Heusler materials are currently attracting the attention of researchers.
HH materials that are examined so far are bulk TE materials, which largely fulfill these criteria. HH materials are well-suited for various applications, including large-scale TE power generation as well as magnetic and spintronic applications. Although their high thermal conductivity in a lattice restricts their overall efficiency in converting heat to electricity, their strong electrical properties make them suitable for power generation applications.6–8 Owing to their excellent combination of technical attributes and TE performances, HH materials stand out as promising candidate for TE applications.
Therefore, the focus of several theoretical and experimental investigations is their transport features. Materials with an 8-valence electron count are predicted to have a semiconducting nature. Based on the atoms that make up their structure, HH compounds (those with 8 valence electrons) may have a broad bandgap. For instance, 20 HH compounds, according to Thomas Gruhn et al., are suitable for optical purposes.9 P. S. Kacimi et al. studied I-II-V and I-III-IV HH compounds, revealing their physical properties.10 The thermoelectricity of KScM (M = C and Ge) HH materials, which exhibit considerable transport qualities, have been reported by Yasemin O. Ciftci et al.11 In their study, they found that its thermoelectricity was 1.5 times greater than Bi2Te3. Half-Heusler compounds have great thermal stability, outstanding electrical characteristics, and excellent mechanical resilience, which make them potential mid-to-high-temperature thermoelectric materials. Other factors to consider while using these HH compounds in thermoelectric applications include their availability and high value of power factor. Ciesielski et al. investigated the high-temperature power factor of HH RENiSb (RE = Sc, Dy, Ho, Er, Tm, Lu).12 Winiarski et al. studied the thermoelectric behaviour of the p-type half-Heusler alloy ScMSb (M = Ni, Pd, Pt) using ab initio calculations.13 Pan et al. investigated superconductivity and magnetic order in the non-centrosymmetric half-Heusler compound ErPdBi.14 Furthermore, traditional techniques have substantially reduced the typically high lattice thermal conductivity of conventional ternary half-Heusler compounds, such as ZrNiSn, TiCoSb, and NbFeSb. For example, using band engineering or multi-element alloying, ZT values of more than 1.3 were obtained for n-type materials, such as (Ti, Zr, Hf)NiSn.15 The wide range of HH compositions makes it simpler to find, alter, or produce materials suitable for TE and spintronic applications. Recently, the use of nanocomposites, nanostructuring, and isoelectronic alloying has improved the TE efficiency of HH semiconductors.16,17 This improvement, however, significantly depends on the high ZT values of the optimal parent alloys. Advancements have been made to increase the TE efficiency of HH semiconductors by employing nanocomposites, nanostructuring, and isoelectronic alloying.8–18 This progress, however, primarily relies on the excellent ZT values of the parent alloys.
Wang et al.19 experimentally demonstrated an enhancement in the thermoelectric performance of Ti(Fe, Co, Ni)Sb half-Heusler alloys by varying the ratio of Fe/Co/Ni. They could achieve power factors as high as 1.80 mW m−1 K−2 and 2.21 mW m−1 K−2 and ZT values 0.65 and 0.85 at 973 K for n-type TiFe0.3Co0.2Ni0.5Sb and p-type TiFe0.5Co0.15Ni0.35Sb, respectively. Attempts have been made to reduce the lattice thermal conductivity of half-Heuser compounds, including TiCoSb, ZrNiSn and NbFeSb. Multi-element alloying has been shown to obtain high ZT values (∼1.2) in the half-Heusler compounds (Ti, Zr, Hf)NiSn, with low lattice thermal conductivity ∼2 W m−1 K−1. Among the compounds found by Zhu et al.,20 the p-type TaFeSb-based half-Heusler material showed very promising thermoelectric performance. It achieved a ZT peak of approximately 1.52 at 973 K and an average ZT of around 0.93 in the 300–973 K temperature range. However, when the structural, elastic, mechanical, electronic, magnetic and optical properties of half-Heusler compounds CoFeZ (Z = P, As, Sb) were investigated by Zahir et al.21 using GGA + U approximation, these materials were found to be optically active in the range of intermediate energy. i.e. between (2–30) eV.
These established facts and studies on different materials motivated us to explore a new group of HH compounds, namely FeTaX (X = P, As). These materials are of great importance due to anomalous characteristics with respect to their semiconducting nature, low energy band gap, good optical conductivity, moderate PF, and thermal and electrical conductivities. In this work, we have utilized first-principles calculations based on DFT in combination with the semiclassical Boltzmann theory. Specifically, our study focuses on examining physical characteristics, including mechanical, vibrational optoelectronic and thermoelectric properties, of FeTaX (X = P, As) HH materials. To our knowledge, these compounds have not been thoroughly examined in the past. In this research, we have employed the hypothetical Tran-Blaha-modified Becke–Johnson exchange (Tb-mBJ)22 to precisely compute bandgap. Our findings show that the FeTaX (X = P, As) HH compounds may be suitable for thermoelectric generators and optical devices.
2. Computational method
The computations in this work were aimed at quantum mechanics and carried out considering the WIEN2k code23 in DFT based on the linearized augmented plane wave (FP-LAPW) technique.24 The electronic exchange-correlation energy (GGA-PBE)25 was employed for analyzing the structural features using generalized gradient approximation based on Perdew et al. A RMT × KMAX cut-off value of 7.0 was used in this study.26 KMAX denotes the reciprocal lattice vectors with the largest selected value to expand the plane wave. RMT is the smallest atomic radius. A self-consistent accuracy of total energy = 10−4 Ry was employed in the simulations. The radii of the Fe, Ta, P, and As atoms in the MT atomic spheres (RMT) were taken as 2.01, 1.96, 2.35, and 2.45 au, respectively. The energy concentration was set up to 10−6 Ry. The elastic properties were computed using the IRelast software package.27
Optical investigations are commonly employed to determine the electronic band structure of solids in a quantitative manner. In this regard, the optical performance of the considered materials was examined using the WIEN2K code.
The dielectric function ε(ω) provides valuable insights into the optical properties of a material as it quantifies the linear response of the system to an external electromagnetic field and is described by the equation formulated by Ehrenreich and Cohen,28 as shown below.
| | |
ε(ω) = ε1(ω) + iε2(ω).
| (1) |
The formula for the imaginary part ε2(ω) is
| |
 | (2) |
Moreover, Kramers–Kronig Transformation (KKT) gives the value of the real part of ε(ω) i.e. ε1(ω)
| |
 | (3) |
We also calculated the refractive index n(ω) based on the complex dielectric function, as follows:29
| |
 | (4) |
The reflectivity R(ω) was obtained directly from ε1(ω) and ε2(ω).
Further, the BoltzTrap code30 using the semi-classical Boltzmann theory was used to examine the thermoelectric properties. The thermoelectric parameters, including figure of merit (ZT), power factor (PF), and electrical and thermal conductivities, were evaluated. A material that has ZT ∼ 1 is efficient for thermoelectric generators; however, its applicability further depends on various parameters, such as PF and thermal conductivity (κ/τ), where τ (∼10−15) is the relaxation time.
where PF further depends on the Seebeck coefficient (
S) and electrical conductivity (
σ/
τ).
where the Seebeck coefficient (
S) measures the magnitude of the thermoelectric voltage induced between two materials when a particular temperature difference is maintained between them.
3. Results and discussion
3.1. Structural properties
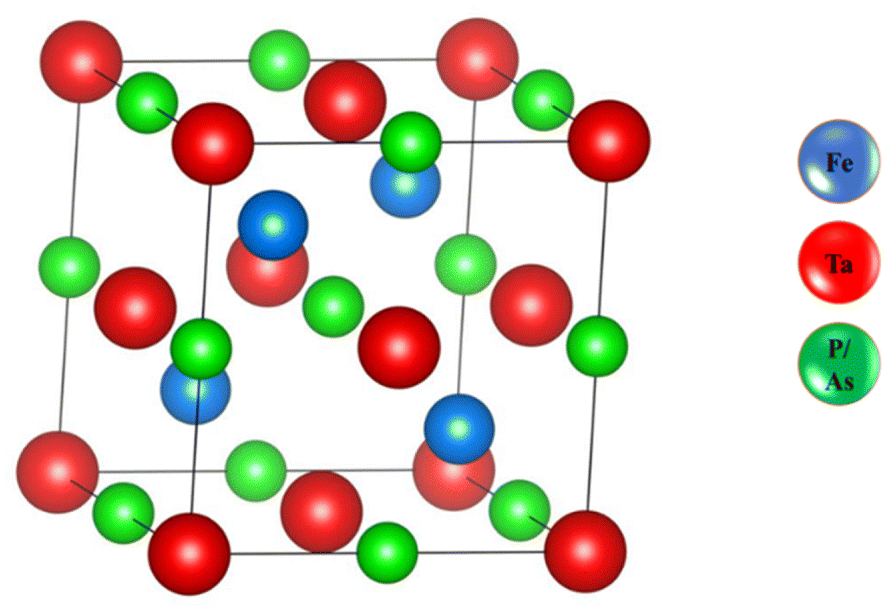
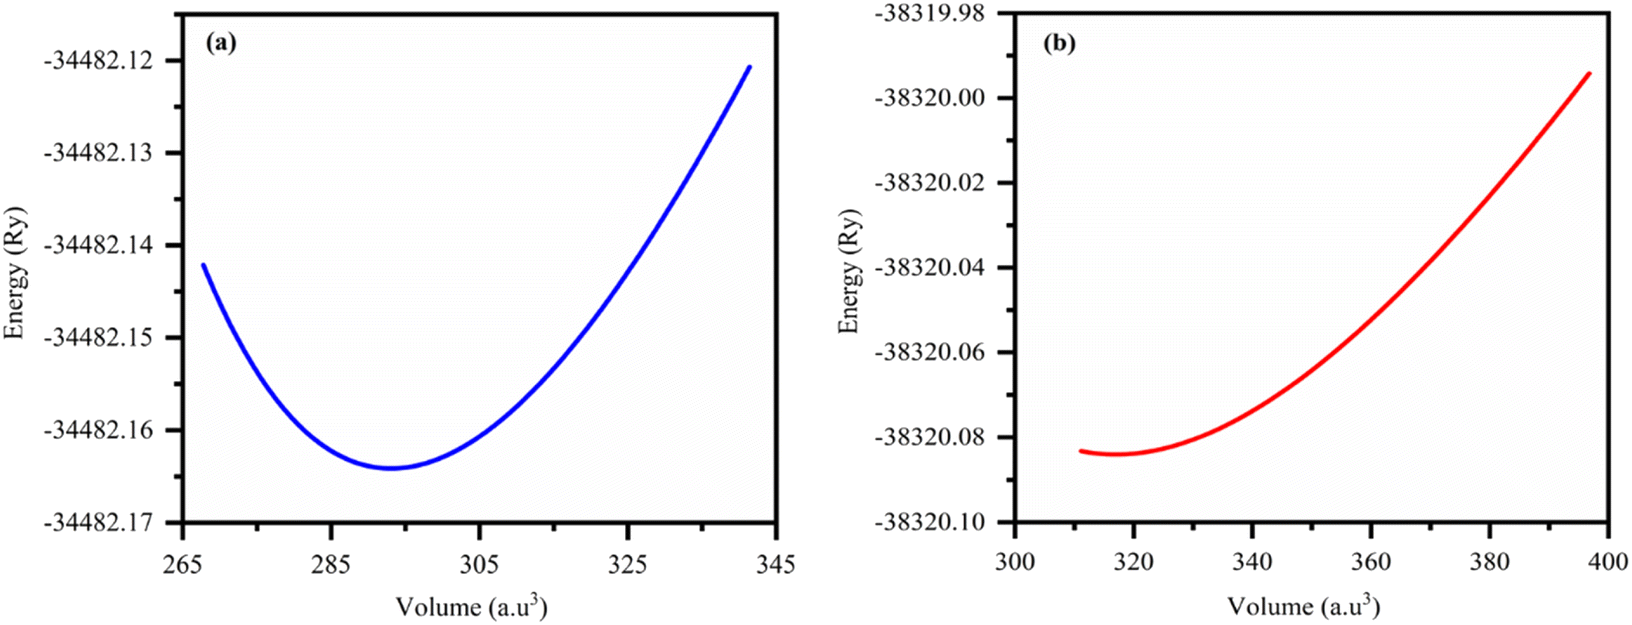
As shown in Fig. 1, we estimated the optimized structure of the investigated HH FeTaX (X = P, As) and found that they exist as cubic crystal structures (SG: Fm![[3 with combining macron]](https://www.rsc.org/images/entities/i_char_0033_0304.gif) m). The Fe, Ta, and X atoms are positioned at 2a (0, 0), 2d (1/3, 2/3, 3/4), and 2c (1/3, 2/3, 1/4), respectively. Table 1 shows computed values of the structural parameters. Furthermore, to assess the structural stability, we computed the lattice parameters based on the Birch–Murnaghan equation,31 as shown in Fig. 2. Table 1 compares results from past investigations with the estimated lattice constant and unit cell volume of FeTaX (X = P, As). The computed outcomes are in accordance with other experimental and theoretical reports.19,34 Furthermore, we computed the formation energy (Eform) to evaluate the thermodynamical stability of the considered materials using eqn (7):
m). The Fe, Ta, and X atoms are positioned at 2a (0, 0), 2d (1/3, 2/3, 3/4), and 2c (1/3, 2/3, 1/4), respectively. Table 1 shows computed values of the structural parameters. Furthermore, to assess the structural stability, we computed the lattice parameters based on the Birch–Murnaghan equation,31 as shown in Fig. 2. Table 1 compares results from past investigations with the estimated lattice constant and unit cell volume of FeTaX (X = P, As). The computed outcomes are in accordance with other experimental and theoretical reports.19,34 Furthermore, we computed the formation energy (Eform) to evaluate the thermodynamical stability of the considered materials using eqn (7):| | |
Eform = EFeTaXTotal − EbulkFe − EbulkTa − EbulkX
| (7) |
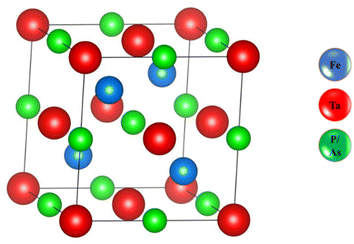 |
| | Fig. 1 The optimized structure of the FeTaX (X = P, As) compounds. The blue balls represent Fe atoms, the red balls represent Ta atoms, and the green balls represent P or As atoms. | |
Table 1 The calculated lattice parameter (a), unit cell volume (V), bulk modulus (B), first order pressure derivative of B (B′), optimized total energy (ETotal), formation energy (EForm), and Bader charge of FeTaX (for X = P, As). The parameters were calculated for configurations in magnetic and non-magnetic phases. (Bader charge: “+” denotes addition of electrons, “−” denotes removal of electrons)
| HHs |
a (Å) |
V (au)3 |
B (GPa) |
B′ (Gpa) |
ETotal (Ry) |
EForm (eV per atom) |
Bader charges |
| FeTaP |
5.58 |
293.17 |
233.16 |
6.31 |
−34482.164127 |
−0.45 |
Fe = 0.98 |
| P = 0.78 |
| Ta = −0.72 |
| FeTaAs |
5.72 |
316.70 |
202.57 |
4.85 |
−38320.084029 |
−0.49 |
Fe = 0.96 |
| As = 0.74 |
| Ta = −0.68 |
| Other works |
5.86 [theory]34 |
|
195.59 [theory]34 |
4.17 [theory]34 |
— |
— |
— |
| 5.89 [expt]19,61 |
 |
| | Fig. 2 The total energy versus volume optimization curves for (a) FeTaP and (b) FeTaAs. | |
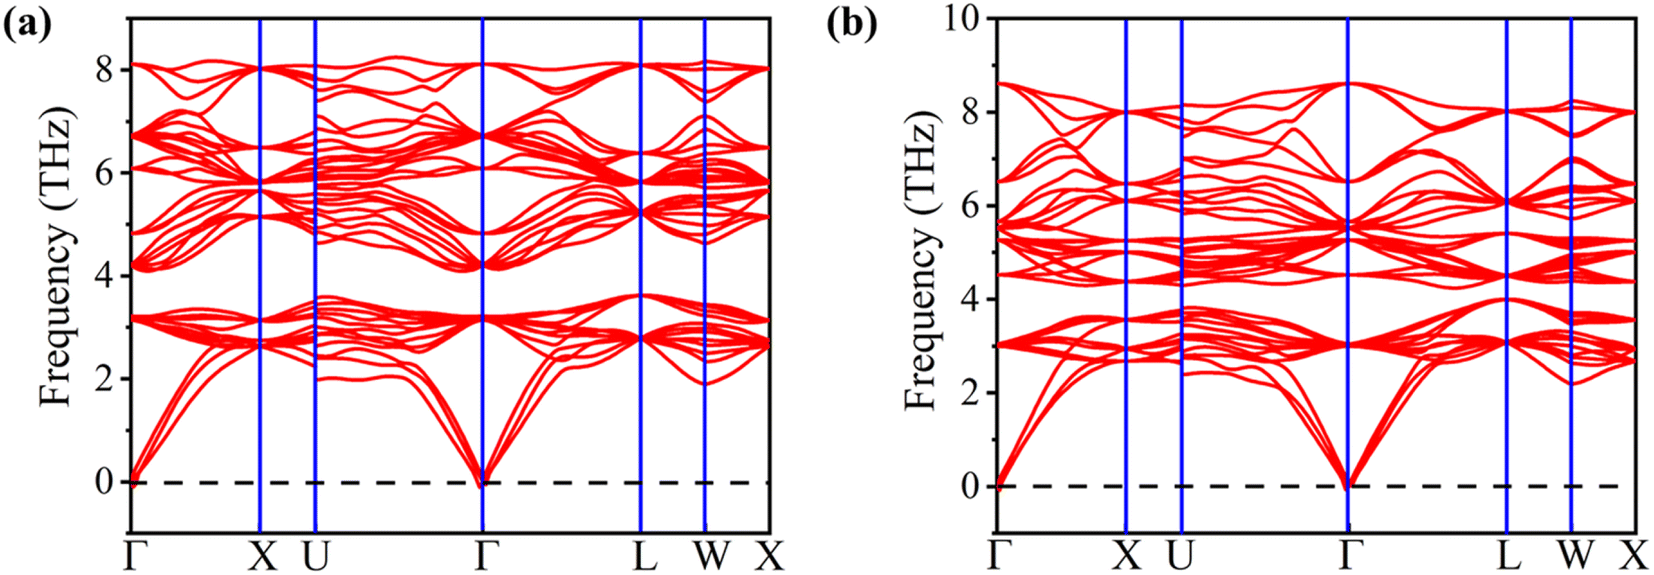
The computed formation energies for FeTaP and FeTaAs were −0.45 eV per atom and −0.59 eV per atom, respectively, indicating the stability of these compounds.32 The negative formation energy values confirm their stability. In order to determine their dynamic stability, we computed phonon dispersion using the Vienna Ab initio Simulation Package (VASP). The phonon dispersion plots of FeTaX (X = P, As) are represented in Fig. 3. The absence of imaginary frequencies in the plots represents the dynamic stability of the investigated compounds.
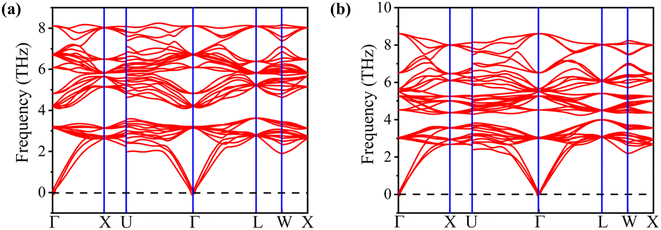 |
| | Fig. 3 The phonon dispersion plots for (a) FeTaP and (b) FeTaAs HHs. | |
3.2. Elastic properties
While designing solids for commercial applications, it is crucial to consider their mechanical properties, such as anisotropy (A), bulk modulus (B), shear modulus (G), Pung ratio (B/G), and second-order elastic constants (Cij for i, j = 1, 2). In a cubic system, the dimensional strength relies on the interplay of three elastic constants: C11 representing resistance to strain, C12 signifying shear stress, and C44 indicating opposition to shear deformation.33 Table 2 provides the calculated elastic constants for the cubic FeTaX (X = P, As) compounds in comparison with other theoretical and experimental results34 and demonstrates good agreement with them. To assess the stability of the combinations under investigation, the Born–Huang stability condition35,36 was applied, as stated below:| | |
(C11 − C12)/2 > 0, (C11 + 2C12) > 0, C44 > 0
| (8) |
Table 2 The calculated values of the elastic constants C11, C12, C44; bulk modulus B; shear modulus G (GPa); Young's modulus E; bulk modulus to shear modulus ratio B/G ratio; Poisson's ratio ν; Zener anisotropy factor A; Cauchy pressure Cp; sound velocity (transverse υt, longitudinal υl, mean υm); Debye temperature θD; and melting temperature Tm of the FeTaX (for X = P, As) compounds using PBE-GGA
| Parameters |
FeTaP |
FeTaAs |
Other works |
Other works |
| Theory34 |
Expt62 |
| C11 (GPa) |
175.31 |
209.3 |
304.82 |
184.7, 214.9 |
| C12 (GPa) |
56.90 |
76.2 |
156.93 |
|
| C44 (GPa) |
51.34 |
69.4 |
117.97 |
|
| B (GPa) |
96.37 |
120.5 |
206 |
|
| G (GPa) |
54.57 |
70.1 |
97.82 |
|
| E (GPa) |
137.61 |
174.4 |
|
161.1, 171.6 |
| B/G (GPa) |
1.77 |
1.79 |
2.11 |
|
| ν |
0.27 |
0.26 |
0.295 |
0.223, 0.271 |
| A (GPa) |
0.85 |
1.07 |
|
|
| Cp = (C12 − C44) (GPa) |
4.66 |
6.8 |
|
|
| υt (m s−1) |
2524 |
3266 |
|
|
| υl (m s−1) |
4341 |
5631 |
|
|
| υm (m s−1) |
2801 |
3621 |
|
|
| θD (K) |
307.5 |
407.3 |
|
|
| Tm (K) |
2912.3 |
3461 |
|
|
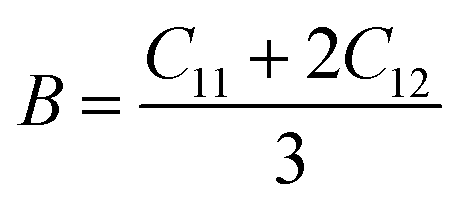
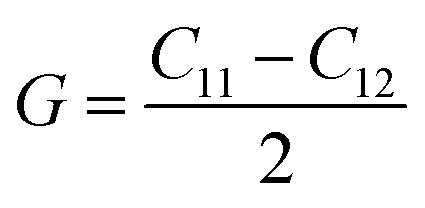
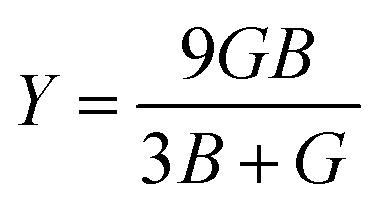
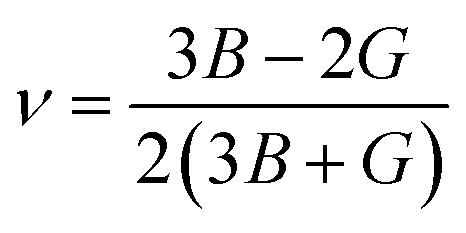
The compounds can be considered stable based on our computational assessment as they fulfill the Born–Huang stability criteria. We used the following equations to calculate a range of elastic constants, namely bulk modulus (B), shear modulus (G), Young's modulus (Y), Poisson's ratio (ν), and anisotropy (A), with a focus on cubic structures.
| |
 | (9) |
| |
 | (10) |
| |
 | (11) |
| |
 | (12) |
| |
 | (13) |
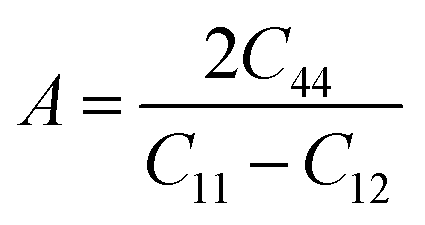
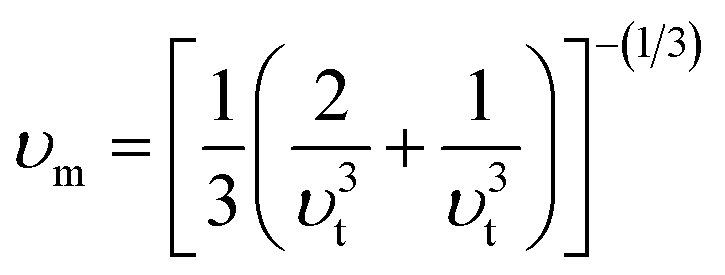
The bulk modulus (B) of a material indicates its resistance to volume change when subjected to compression and reflects its crystal strength. A higher B value signifies greater crystal strength. On the other hand, the shear modulus (G) quantifies the ability of the crystal to resist plastic deformation. In the case of the FeTaX (X = P, As) compounds, the estimated B values were 96.37 GPa and 120.5 GPa, respectively.37 This suggests that FeTaAs exhibits greater resistance to volume change than FeTaP due to its higher B value. Additionally, the higher G value of FeTaAs indicates stronger resistance to transverse bending. Pugh ratio (B/G) is the measure of brittleness or ductility of a material.38,39 If the B/G ratio exceeds 1.75, the material is considered ductile; otherwise, it is considered brittle. Table 2 provides the estimated B/G values of the FeTaX (X = P, As) compounds, indicating their inherent ductility. Frantsevich et al. used the Poisson ratio (ν) to distinguish between brittleness and ductility, with 0.26 serving as the critical value for these characteristics. When ν falls below 0.26, the material is considered brittle; when it exceeds 0.26, it is considered ductile.40 The estimated values of the FeTaX (X = P, As) compounds were 0.27 and 0.26, respectively, affirming their ductile nature. This assessment was further corroborated by Cauchy pressure calculation based on the formula Cp = C12 − C44. The positive Cauchy pressure values obtained for the examined compounds indicate the ionic nature of their crystal bonds.41 Moreover, A = 1 suggests isotropic crystals, while values other than 1 indicate anisotropy.42,43 Two thermodynamic factors related to elastic properties, namely melting point (Tm) and Debye temperature (θD), were also investigated. The Debye temperature (θD) was determined based on the mean sound velocity (υm) using the formula:44
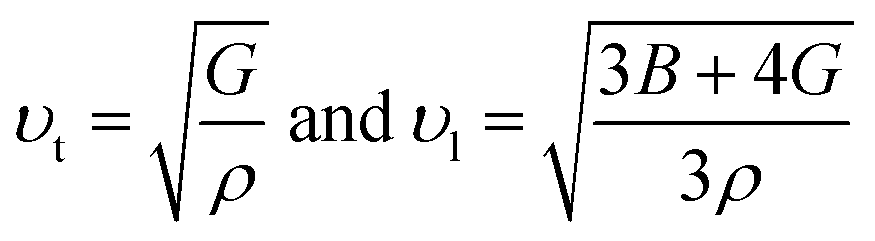
The calculated Debye temperature values are presented in Table 2. The mean sound velocity (υm) in the substances under investigation was determined using the equation:
| |
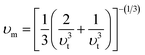 | (14) |
where the longitudinal (
υl) and transverse (
υt) sound velocities are derived from the shear modulus and bulk modulus, respectively, as given below.
| |
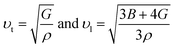 | (15) |
Table 2 presents the calculated values of υt, υι, υm, θD, and Tm
3.3. Electronic properties
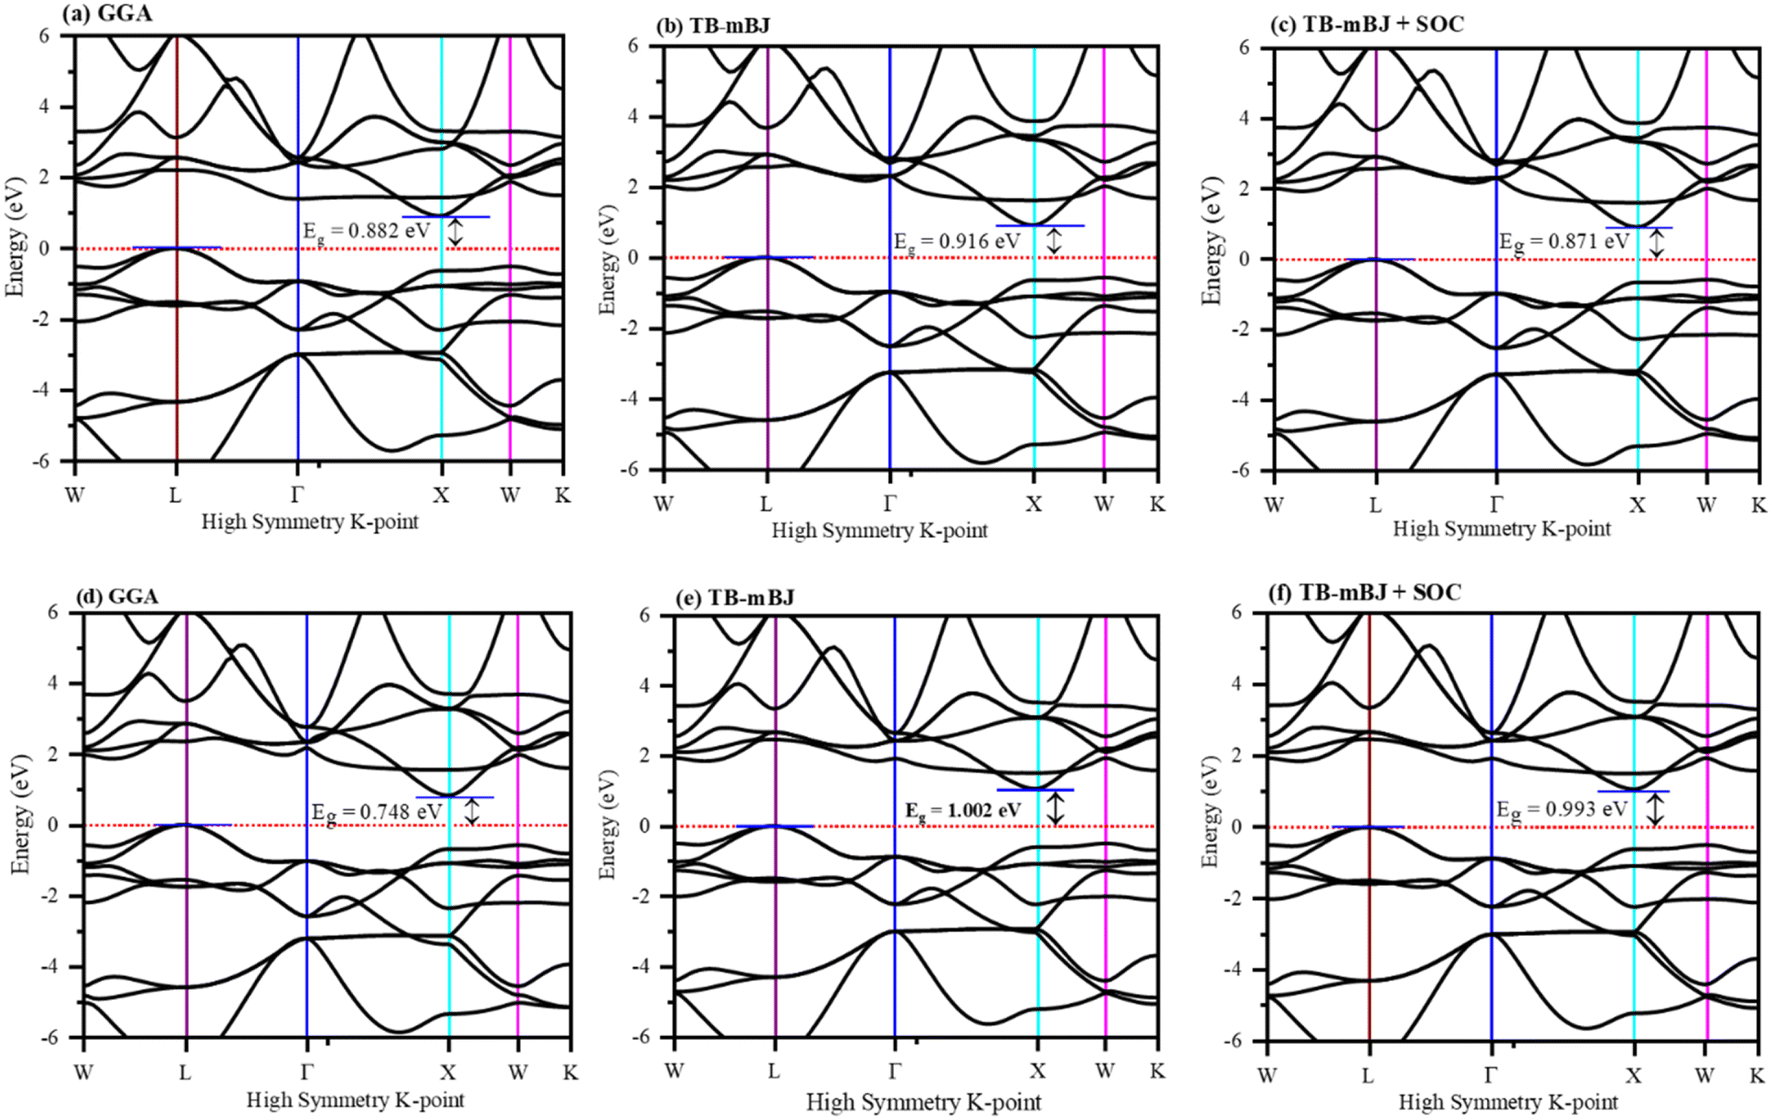
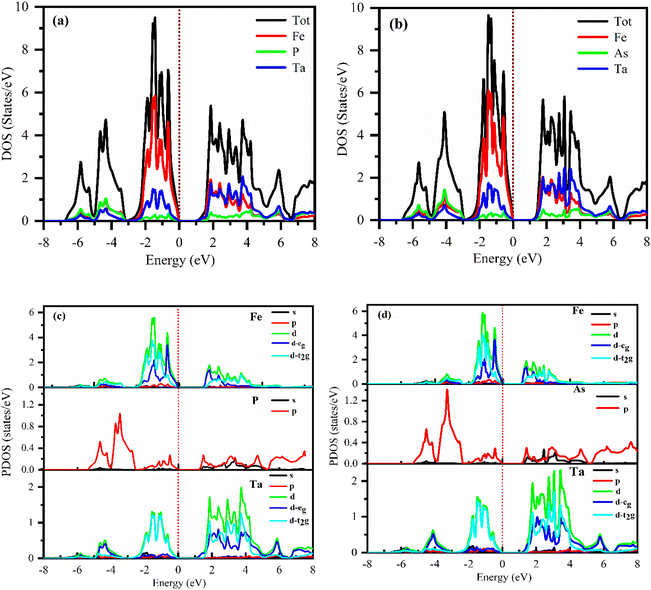
The electronic properties computed for FeTaX (X = P, As) are represented in Fig. 4. The GGA-PBE functional generally underestimates bandgap values, while multiple investigations have demonstrated that the TB-mBJ potential may predict bandgap values that are closer to the experimental values. The illustrations demonstrate that the valence band (VB) maximum is at the L-point, and the conduction band (CB) minimum is at the X-point in the first Brillion zone for both compounds.45 These results suggest that FeTaP and FeTaAs are indirect band gap semiconductors with computed bandgaps of about 0.882 eV and 0.748 eV, respectively, by employing the GGA functional, as depicted in Fig. 4(a) and (d). Additionally, the bandgaps of FeTaP and FeTaAs computed using the TB-mBJ functional were enhanced, reaching 0.916 eV and 1.002 eV, respectively, as demonstrated in Fig. 4(b) and (e). Moreover, when spin–orbit coupling (SOC) was included, the band gap values reduced to 0.871 eV and 0.993 eV for FeTaP, and FeTaAs, respectively, as shown in Fig. 4(c) and (f). Degeneration of the CB maximum at the X-point of FeTaX increased due to SOC, with splitting between the states respectively, confirming a strong SOC effect on the band structure feature of the FeTaX (X = P and As) compounds.46 However, the maximum bandgap was obtained from the mBJ compared with mBJ + SOC. Therefore, we considered mBJ for further computations. The density of states (DOS) helps us understand how different atomic states affect the band structure. Therefore, in Fig. 5, total and partial DOS obtained using the TB-mBJ functional are presented. Fig. 5(a) and (b) clearly signify that the VB is dominated by the Fe-d state, and the CB is mainly dominated by a combination of the Fe/Ta-d states with approximately equal intensities in both compounds.47,48 Furthermore, the lower intensity of the peaks associated with the P and As atoms in both compounds indicates that the presence of these atoms has a minimal impact on the VB and CB. Furthermore, the PDOS demonstrated in Fig. 5(c) and (d) shows the contribution of individual atoms to the VB and CB. In general, the bandgap increases with the substitution of atoms with larger ionic radii, such as As instead of P. This is due to the fact that the ionic radius increases as one moves down the periodic table.
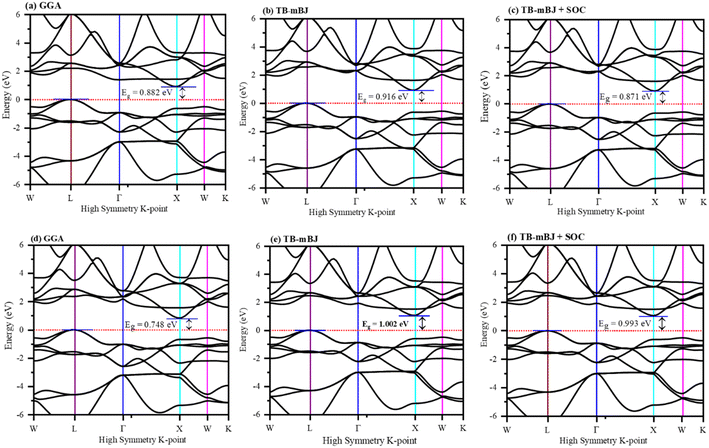 |
| | Fig. 4 The band structure of (a)–(c) FeTaP and (d)–(f) FeTaAs evaluated using (a) and (d) GGA, (b) and (e) TB-mBJ, and (c) and (f) TB-mBJ + SOC. The Fermi level is set to zero. | |
 |
| | Fig. 5 DFT-calculated total DOS (a) and (b) and (c) and (d) partial DOS of (a) and (c) FeTaP and (b) and (d) FeTaAs. The Fermi level is set at zero. | |
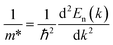
We also calculated the effective mass of electrons and holes using the following relationship:
| |
 | (16) |
Accordingly, the effective masses of electrons and holes in FeTaX (X = P and As), respectively, were around 0.35 and 0.13 (FeTaP) and 0.36 and 0.17 (FeTaAs). The results indicate that the HHs under investigation exhibit extremely low effective carrier masses.49 This reduced effective mass is advantageous for solar materials as it facilitates efficient carrier mobility. According to these findings, FeTaX (where X can be P or As) can demonstrate effectiveness in photovoltaic applications. To investigate the bonding between the constituent atoms, we analyzed the electronic density of those atoms. The blue contours represent electron loss, while the red counters represent electron gain in Fig. 6. As shown in Fig. 6(a) and (b), the As atom accepts electrons from the Fe–Ta network. This is additionally confirmed by the negative Bader charge of ‘As’, as presented in Table 1, which supports the aforementioned outcomes.
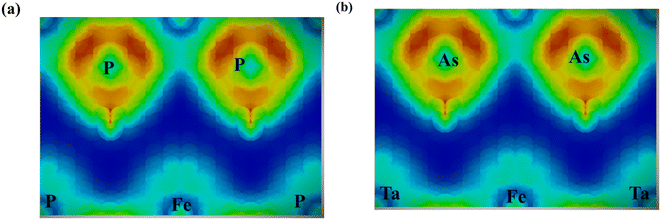 |
| | Fig. 6 Electron density plots for (a) FeTaP and (b) FeTaAs. | |
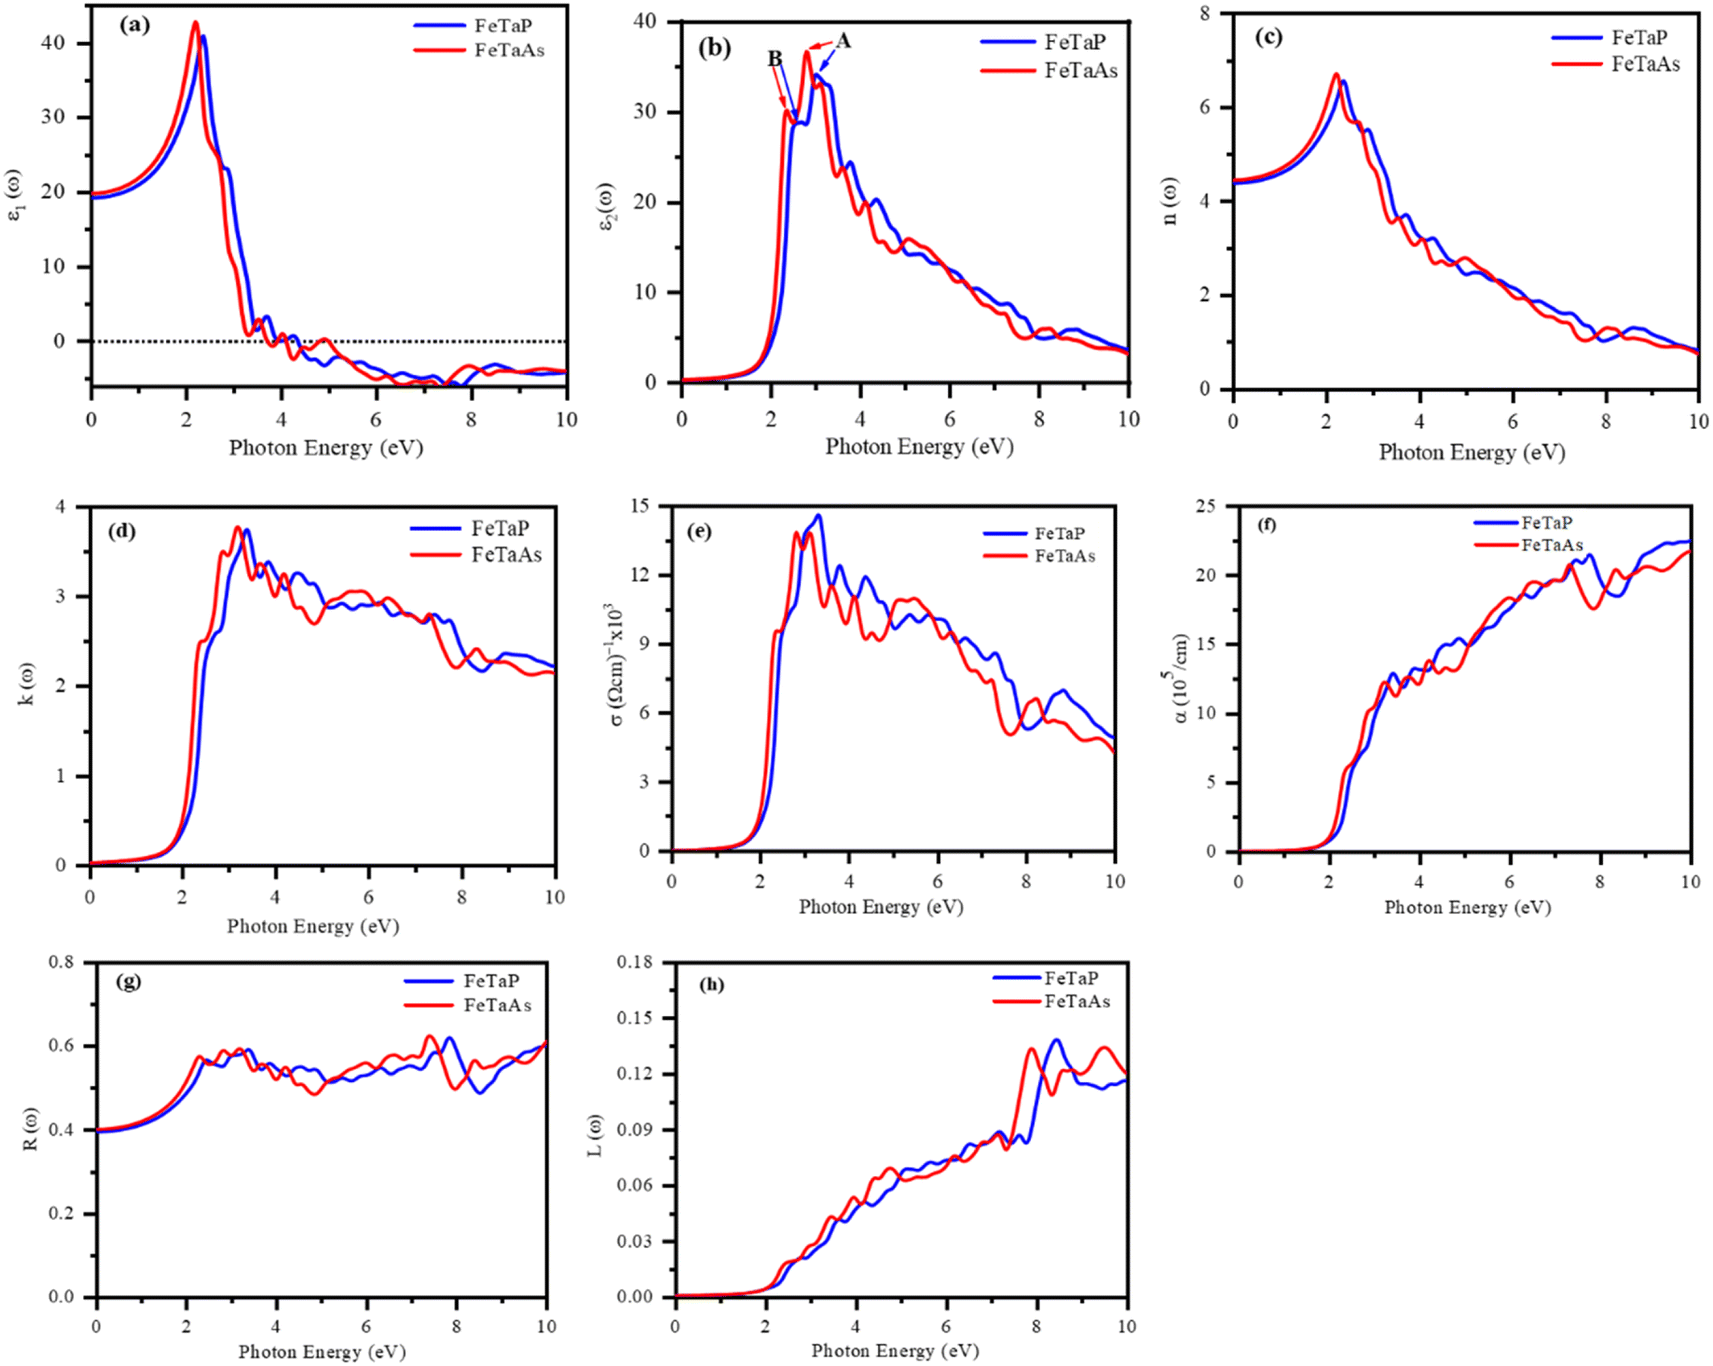
3.4. Optical properties
We estimated the optical properties of FeTaX (X = P, As) in response to electromagnetic radiation. The TB-mBJ functional was used to calculate all the parameters. Fig. 7 shows the predicted optical characteristics of FeTaX (X = P, As) for up to 10 eV. The complex dielectric function ε(ω) was employed to determine the optical response of the studied compounds. Fig. 7(a) displays the computed real dielectric function ε1(ω) versus photon energy. At zero energy level, it is known as static dielectric constant ε1(0), which was found to be 19.66 and 19.96 for FeTaP and FeTaAs, respectively. The variation in the magnitude of ε1(ω) is closely associated with the bandgap.50 The value was observed to increase and attained the maximum value at 1.98 eV and 1.96 eV, respectively, for FeTaP and FeTaAs; then, they decreased drastically to zero at about 4.1 eV and 3.8 eV, respectively. The variation in the ε2(ω) spectra of the FeTaX (X = P, As) compounds with respect to photon energy is represented in Fig. 7(b), which is characterized by two main peaks (marked as A and B) in the visible region. Both first peaks (A) of ε2(ω) at 2.78/3.00 eV are principally due to the transition from the Fe d–d states, while the second B peaks at 2.35/2.62 eV originate from the Ta d–d state transition.
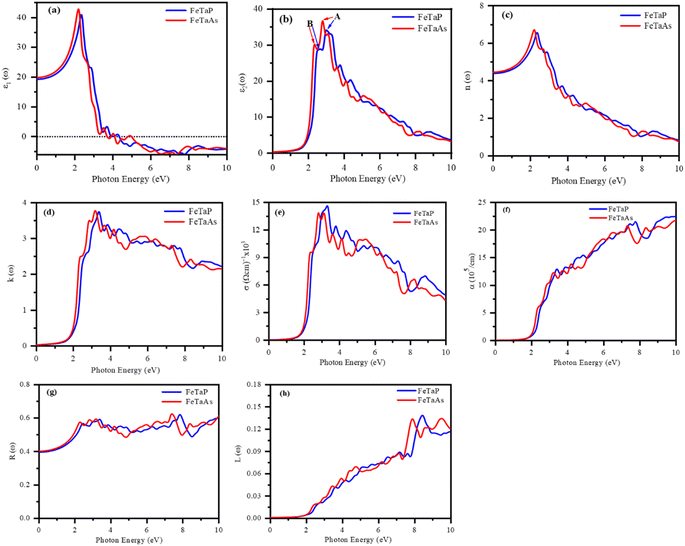 |
| | Fig. 7 DFT-calculated optical spectra of the (a) real component ε1(ω) and (b) imaginary component ε2(ω) of the dielectric function, (c) refractive index n(ω), (d) extinction coefficient k(ω), (e) optical conductivity σ(ω), (f) absorption coefficient α(ω), (g) optical reflectivity R(ω), and (h) energy loss L(ω) of FeTaX (X = P, As). | |
Fig. 7(c) shows the variation in refractive index n(ω) as a function of photon energy. Refractive index n(0) showed static values of 4.43 and 4.46 for FeTaP and FeTaAs, respectively. These n(0) values fulfill the relationship n(0)2 = ε1(0),51 validating the calculation precision. We found that n(ω) in the infrared region reached the highest magnitude at 2.1/2.12 eV for FeTaP/As, then started falling and finally reached unity after 8 eV photon energy. The significant decrease in n(ω) within the visible region strongly indicates that the suggested materials are valuable candidates for future optical device applications.
The amount of light lost into the medium as a result of absorption and scattering per unit volume is known as the extinction coefficient k(ω).52 Fig. 7(d) displays the variation in extinction coefficient with photon energy. The first high peak of the extinction coefficient represents the photon energy. For the compounds FeTaP and FeTaAs, this was centered at 1.98 eV and 1.96 eV, respectively, corresponding to zero of ε2(ω).
When an object is exposed to electromagnetic radiation, the covalent bonds are disrupted, enabling the flow of electric current within the material. As a result, this phenomenon, which is known as optical conductivity, converts solar light into electricity. The relationship between optical conductivity and photon energy is depicted in Fig. 7(e). The initial peaks were positioned at energies of 2.33 eV and 2.38 eV, respectively, for compounds FeTaP and FeTaAs.
The photon absorption coefficients of the FeTaX (X = P, As) HHs are shown in Fig. 7(f). The absorption coefficient was greater than 104 cm−1 in the visible region, with the maximum absorption at about 13.5 × 105 cm−1 and 14.2 × 105 cm−1 for FeTaX (X = P, As), respectively, as shown in Fig. 7(f). Notably, the absorption spectrum exhibited multiple peaks, which arise from interband transitions between the bonding and anti-bonding bands, respectively (Table 3).
Table 3 The calculated energy bandgaps (in eV) using different potentials PBE, mBJ and mBJ + SOC
| Properties |
FeTaP |
FeTaAs |
Other works |
| Expt63 |
| PBE |
0.882 |
0.748 |
1.052 |
| mBJ |
0.916 |
1.002 |
| mBJ + SOC |
0.871 |
0.993 |
Fig. 7(g) depicts the reflectivity R(ω) versus photon energy curves of FeTaX (X = P, As) HHs. At zero frequency, the reflectivity R(0) was about 39% and 40% for FeTaP and FeTaAs, respectively. In Fig. 7(h), the L(ω) curves of the FeTaX compounds depict the energy loss experienced by fast electrons as they pass through the material. According to Fig. 7(h), the L(ω) spectra steadily increase from approximately 1.5 eV until their peak values at around 10 eV. The optical property results advocate the suitability of these materials in optical applications. We have compared our results with those of other experimental works in Table 4.
Table 4 The calculated optical properties of the FeTaX (for X = P, As) compounds using TB-mBJ potential
| Optical properties |
Material property |
FeTaP |
FeTaAs |
Other works |
| Expt64 |
| |
ε1(0) |
19.66 |
19.96 |
22.0 |
| n(0) |
4.43 |
4.46 |
|
| R(0) |
0.39 |
0.40 |
0.75 |
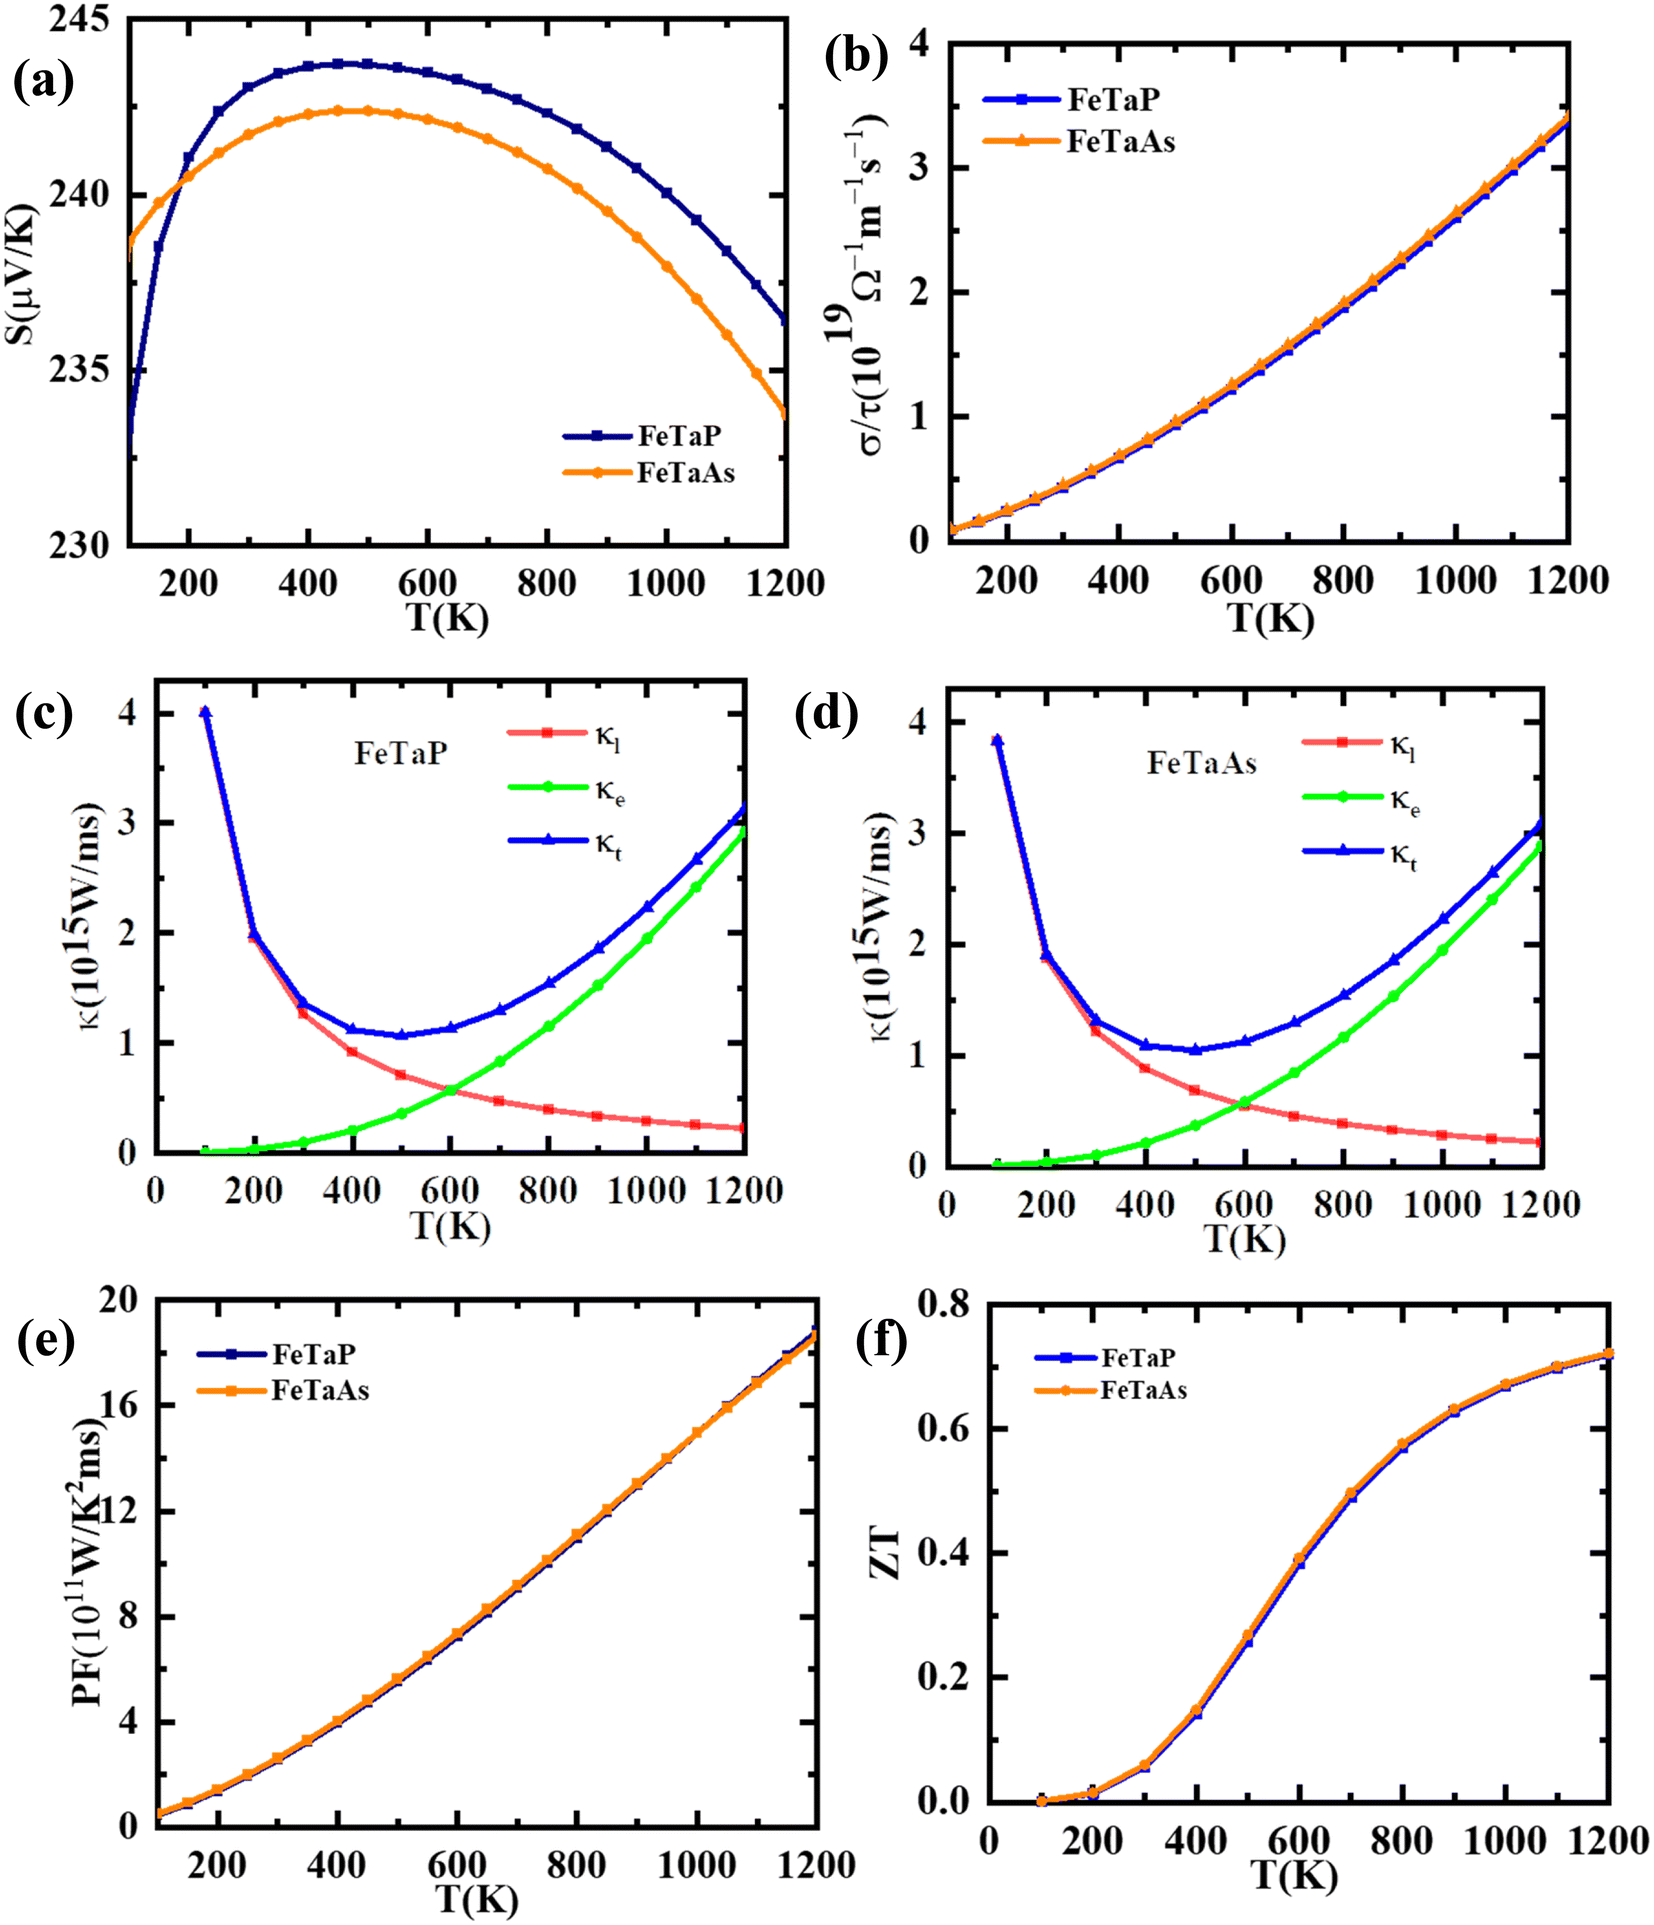
3.5. Thermoelectric properties
A number of parameters, including the Seebeck coefficient (S), electrical conductivity (σ), and thermal conductivity (κ), influence the performance of a thermoelectric material. Using the Boltzmann semi-classical transport theory, which was implemented in the BoltzTrap code, we computed each of these parameters to determine the thermoelectric response and applicability of the studied compounds. The variation of the Seebeck coefficient of the FeTaX (X = P, As) compounds as a function of temperature is shown in Fig. 8(a), which reveals p-type behavior with a positive Seebeck coefficient magnitude. At room temperature, the computed values of the Seebeck coefficient were found to be 242 μV K−1, and 240 μV K−1 for FeTaX (X = P, As) respectively. It was also observed that the values of Seebeck coefficients of FeTaX (X = P, As) decrease as the temperature increases. Due to the intensified random thermal motion and narrow bandgap, which cause the primary charges (such as holes) to jump from the valence band to the conduction band, a phenomenon known as the bipolar effect occurs.53 This causes compensation of carriers and changes in the DOS. The computed outcomes of this study are represented in Table 5 along with the previously available theoretical and experimental results. Our theoretical results are in accordance with those of other experimental works (Table 5). The higher magnitude of S of the studied compounds suggests their applicability in thermoelectric devices.
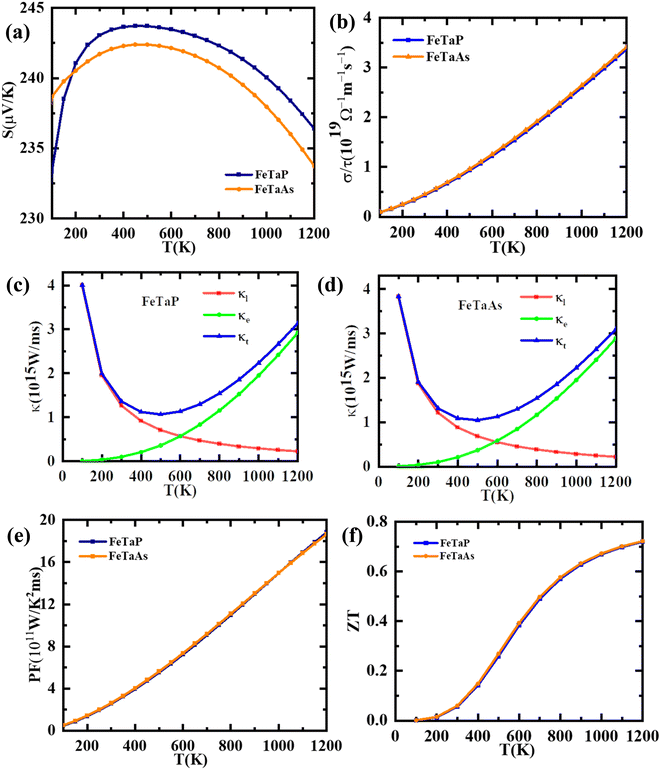 |
| | Fig. 8 The computed (a) Seebeck coefficients, (b) electrical conductivity, (c) thermal conductivity, (FeTaP) (d) thermal conductivity (FeTaAs) (e) power factors and (f) figures of merit of FeTaP and FeTaAs as functions of temperature. | |
Table 5 The calculated transport properties of the FeTaX (for X = P, As) compounds at room temperature using TB-mBJ
| Transport properties (300 K) |
Material property |
FeTaP |
FeTaAs |
Other works Theory |
Other works Expt |
| |
S (μV K−1) |
242 |
240 |
23560 |
∼22965 |
| ∼13519 |
| σ/τ (Ωms)−1(1019) |
0.49 |
0.50 |
|
0.4119 |
| ke/τ (1015) (W m−1 K−1 s−1) |
0.1 |
0.1 |
0.3560 |
|
| kl/τ (1015) (W m−1 K−1 s−1) |
1.20 |
1.21 |
|
4.619 |
| k/τ (1015) (W m−1 K−1 s−1) |
1.23 |
1.24 |
|
4.819 |
| PF (1010) (W K−2 m−1 s−1) |
2.1 |
2.0 |
0.5660 |
∼2.865 |
| ∼1.1119 |
Electrical conductivity per relaxation time (σ/τ) in relationship with temperature is shown in Fig. 8(b). In contrast to the Coulomb potential, the potential factor shows the energy needed to transfer the charge carriers n and p, demonstrating the electrical conductance of a substance produced by the passage of electrons caused by a temperature differential. We observed that σ/τ increases to reach a maximum of about 2.24 × 10¹⁹ (Ω mS)−1 and 2.25 × 10¹⁹ (Ω mS)−1 at 900 K for FeTaX (X = P, As) respectively, as represented in Fig. 8(b). However, in Table 5, the values of electrical conductivity at room temperature are reported with other available experimental and theoretical results. The electron and hole velocities, which define the electronic thermal conductivity (κe), are related to electrical conductivity by the Wiedemann–Franz law.54
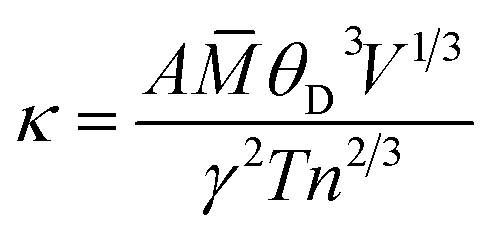
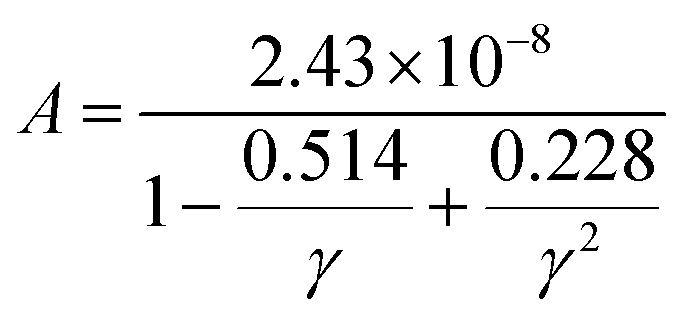
As for thermal conductivity (κ/τ), we independently estimated the electronic thermal conductivity (κe/τ) and lattice thermal conductivity (κl/τ) of the materials under consideration. Moreover, the BoltzTrap code was utilised to estimate κe/τ, and the Slack equation55,56 was applied to estimate κl/τ during the calculation process:
| |
 | (17) |
where
![[M with combining macron]](https://www.rsc.org/images/entities/i_char_004d_0304.gif)
is the average atomic mass,
θD is the Debye temperature,
V is the volume per atom,
n is the number of atoms per unit cell,
γ is the Gruneisen parameter and
A is defined as follows:
| |
 | (18) |
Therefore, κ/τ is a combination of κe/τ and κl/τ calculated as κ = κt = κe+ κl. In Fig. 8(c) and (d), we have plotted the individual and combined variation in thermal conductivity of FeTaP and FeTaAs HHs with temperature, respectively. The highest contribution of κe/τ to the overall thermal conductivity of both compounds can be clearly seen in the figure in comparison with κl/τ. The decrease in κl/τ is caused by an increase in phonon scattering, which happens when temperature increases. κe/τ substantially rises with temperature and reaches the maximum at a high temperature, demonstrating the same trend as the electrical conductivity. The calculated values at room temperature are summarized in Table 5 and compared with the available experimental and theoretical reports. Fig. 8(e) displays the power factor (eqn (6)) as a function of temperature. The PF of both compounds is strongly influenced by the change in temperature. The calculated values of PF at room temperature are given in Table 5. These results are compared with the other materials.
Fig. 8(f) illustrates the temperature-dependent behavior of the thermoelectric figure of merit (ZT) of the FeTaX materials. The data reveals that as the temperature rises, the ZT of FeTaP increases, reaching a peak value of approximately 0.71 at 1200 K. In contrast, FeTaAs achieves a maximum value of about 0.72 at 1200 K. These findings indicate the potential suitability of the FeTaX materials for use in thermoelectric devices.
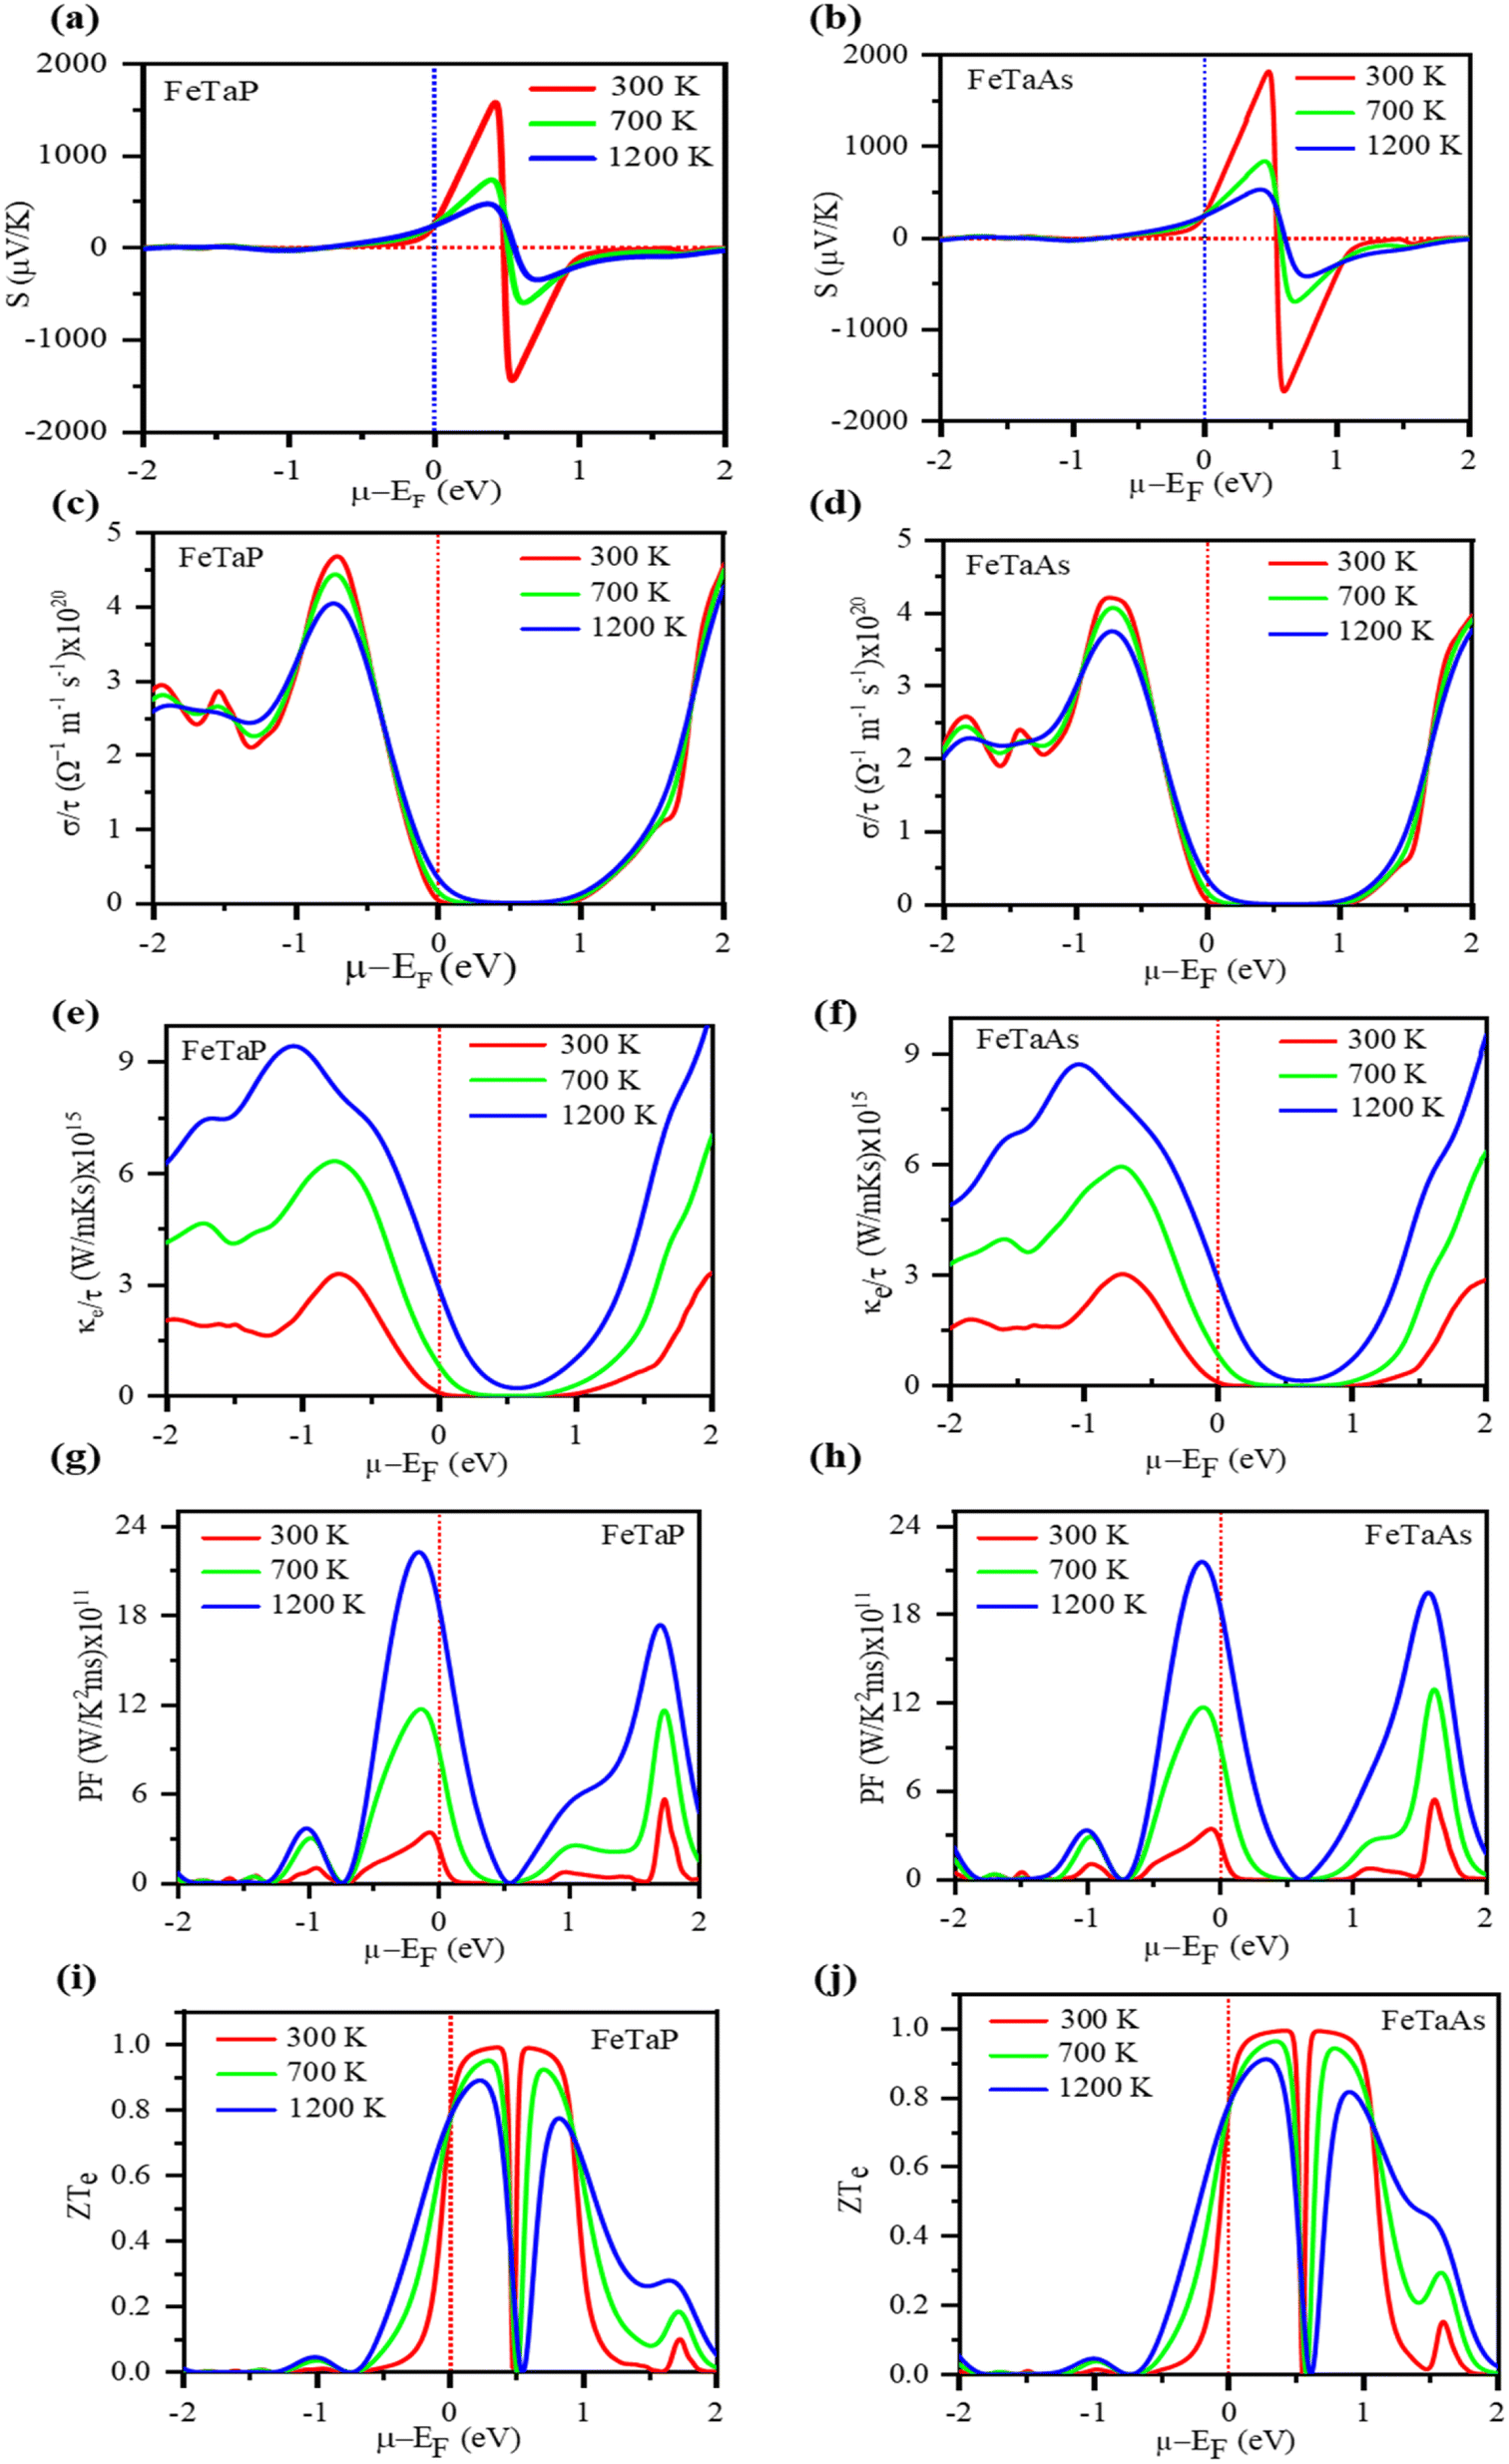
Fig. 9(a) and (b) depict the Seebeck coefficient (S) as a function of the chemical potential (μ). Along the chemical potential axis, the doping range of a material is shown as positive for n-type and negative for p-type. Fig. 9(a) and (b) demonstrate that the Seebeck coefficients decrease with temperature.57 The maximum Seebeck coefficient was determined to be 1681 μV K−1 for FeTaP at 300 K and 0.5 eV and 1825 for FeTaAs. Fig. 9(c) and (d) show the electrical conductivity per relaxation time (τ) of the two compounds in the chemical potential range of −2.0 eV to 2.0 eV at various temperatures, such as 300 K, 700 K, and 1200 K. In the chemical range of 0.0 eV to 1.0 eV, the value was found to be zero. Thereafter, it starts to increase with both sides of the chemical potential, exhibiting opposite behaviour above 1.48 eV for FeTaP in the investigated chemical potential range. FeTaAs also follows a similar trend. FeTaP is observed to exhibit the reverse behaviour of decreasing with temperature above 0.6 eV when the same trend is followed for that material. The highest value of electrical conductivity was discovered to be for p-type in both compounds, that is, on the negative side of the chemical potential axis. In Fig. 8(e) and (f), the fluctuations of electronic thermal conductivity with chemical potential are presented. The value is 0 at chemical potentials between 0.3 and 0.7 eV. From 300 K to 1200 K, the electronic thermal conductivity of both compounds increases with temperature. As shown in Fig. 9(g) and (h), the dependency of power factor (PF) on the chemical potential was explored for both compounds in the chemical potential range of −2.0 eV to 2.0 eV at 300 K, 700 K, and 1200 K, respectively. While FeTaP revealed an ideal power factor value of −0.2 eV, FeTaAs had a peak value of −0.2 eV. At different temperatures (300 K, 700 K, and 1200 K), the fluctuation of the figure of merit with the chemical potential was investigated in the chemical potential range of −2.0 eV to 2.0 eV, and the results are shown in Fig. 9(i) and (j).58 As demonstrated in Fig. 9(i), for both compounds, the figure of merit is close to the Fermi level at ambient temperature and reaches the ideal value of roughly unity at 0.3 eV. In the range of 0 eV to 1.3 eV in the n-type region, it decreases with temperature in the cases of FeTaP and FeTaAs, but in the p-type region, it increases with temperature.59 The high figures of merit exhibited by the compounds in a suitable chemical potential range indicate that they are possible candidates for thermoelectric applications.
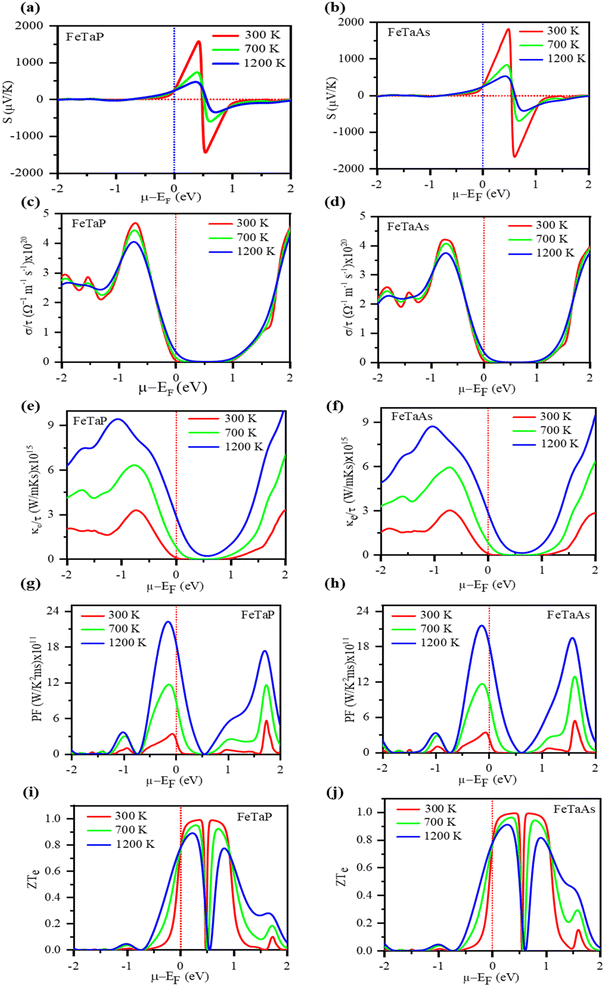 |
| | Fig. 9 The computed (a) and (b) Seebeck coefficients, (c) and (d) electrical conductivity, (e) and (f) electrical conductivities, (g) and (h) power factors, and (i) and (j) figures of merit (ZT) of FeTaP and FeTaAs as functions of chemical potential, respectively. | |
4. Conclusion
In this investigation, we employed the FP-LAPW method to perform ab initio computations, focusing on the structural, optical, and thermoelectric characteristics of cubic FeTaX (X = P, As) compounds. To determine the structural ground state, we utilized PBE-GGA exchange correlations. The TB-mBJ approach was considered for the estimation of the electronic properties of the investigated FeTaX (X = P, As) compounds. The calculated lattice constants, bulk modulus, and other ground-state characteristics are in good accordance with other theoretical findings. The cubic FeTaX (X = P, As) compounds exhibit semiconducting properties, as per the estimated electronic properties. Their optical spectra were calculated in the energy range of 0–10 eV, and the optical characteristics were analyzed. The study shows that FeTaX (X = P, As) are optically active. However, the investigated materials exhibit low values of ZT at room temperature (0.71 and 0.72 at 1200 K for FeTaP and FeTaAs, respectively). The compounds can be used in thermoelectric devices due to their high figures of merit at high temperatures. Further, under suitable chemical potentials, these materials may exhibit high values of ZT even at room temperature.
Data availability
The raw/processed data can be made available with a reasonable request to the corresponding author.
Conflicts of interest
The authors declare that they have no known competing financial interests or personal relationships that could have appeared to influence the work reported in this paper.
Acknowledgements
This research was funded by the Princess Nourah bint Abdulrahman University Researchers Supporting Project number (PNURSP2024R7), Princess Nourah bint Abdulrahman University, Riyadh, Saudi Arabia. The authors extend their appreciation to the Deanship of Scientific Research at King Khalid University for funding this work through research groups program under grant number (RGP.2/586/44).
References
- M. H. Elsheikh, D. A. Shnawah, M. F. M. Sabri, S. B. M. Said, M. H. Hassan, M. B. A. Bashir and M. Mohamad, A Review on Thermoelectric Renewable Energy: Principle Parameters That Affect Their Performance, Renewable Sustainable Energy Rev., 2014, 30, 337–355 CrossRef.
- J. A. Abraham, D. Behera, K. Kumari, A. Srivastava, R. Sharma and S. K. Mukherjee, A Comprehensive DFT Analysis on Structural, Electronic, Optical, Thermoelectric, SLME Properties of New Double Perovskite Oxide Pb2ScBiO6, Chem. Phys. Lett., 2022, 139987 CrossRef.
- J. Twidell, Renewable Energy Resources, Routledge, 2021, ISBN 0429452160 Search PubMed.
- N. Mingo, Thermoelectric Fig. of Merit and Maximum Power Factor in III–V Semiconductor Nanowires, Appl. Phys. Lett., 2004, 84, 2652–2654 CrossRef CAS.
- D. Nemir and J. Beck, On the Significance of the Thermoelectric Fig. of Merit Z, J. Electron. Mater., 2010, 39, 1897–1901 CrossRef CAS.
- Z. Liu, S. Guo, Y. Wu, J. Mao, Q. Zhu, H. Zhu, Y. Pei, J. Sui, Y. Zhang and Z. Ren, Design of High-performance Disordered Half-Heusler Thermoelectric Materials Using 18-electron Rule, Adv. Funct. Mater., 2019, 29, 1905044 CrossRef CAS.
- J. A. Abraham, R. Sharma, S. Ahmad and A. Dey, DFT Investigation on the Electronic, Optical and Thermoelectric Properties of Novel Half-Heusler Compounds ScAuX (X= Si, Ge, Sn, Pb) for Energy Harvesting Technologies, Eur. Phys. J. Plus, 2021, 136, 1091 CrossRef CAS.
- D. Behera, A. Azzouz-Rached, A. Bouhenna, M. M. Salah, A. Shaker and S. K. Mukherjee, First-Principles Studies on the Physical Properties of the Half Heusler RbNbCd and RbNbZn Compounds: A Promising Material for Thermoelectric Applications, Crystals, 2023, 13, 618 CrossRef CAS.
- T. Gruhn, Comparative Ab Initio Study of Half-Heusler Compounds for Optoelectronic Applications, Phys. Rev. B, 2010, 82, 125210 CrossRef.
- S. Kacimi, H. Mehnane and A. Zaoui, I–II–V and I–III–IV Half-Heusler Compounds for Optoelectronic Applications: Comparative Ab Initio Study, J. Alloys Compd., 2014, 587, 451–458 CrossRef CAS.
- Y. O. Ciftci and S. D. Mahanti, Electronic Structure and Thermoelectric Properties of Half-Heusler Compounds with Eight Electron Valence Count—KScX (X= C and Ge), J. Appl. Phys., 2016, 119, 145703 CrossRef.
- K. Ciesielski, K. Synoradzki, I. Wolańska, P. Stachowiak, L. Kȩpiński, A. Jeżowski, T. Toliński and D. Kaczorowski, High-Temperature Power Factor of Half-Heusler Phases RENiSb (RE= Sc, Dy, Ho, Er, Tm, Lu), J. Alloys Compd., 2020, 816, 152596 CrossRef CAS.
- M. J. Winiarski, K. Bilińska, K. Ciesielski and D. Kaczorowski, Thermoelectric Performance of P-Type Half-Heusler Alloys ScMSb (M= Ni, Pd, Pt) by Ab Initio Calculations, J. Alloys Compd., 2018, 762, 901–905 CrossRef CAS.
- Y. Pan, A. M. Nikitin, T. V. Bay, Y. K. Huang, C. Paulsen, B. H. Yan and A. De Visser, Superconductivity and Magnetic Order in the Noncentrosymmetric Half-Heusler Compound ErPdBi, Europhys. Lett., 2013, 104, 27001 CrossRef.
- S. Populoh, M. H. Aguirre, O. C. Brunko, K. Galazka, Y. Lu and A. Weidenkaff, High Fig. of Merit in (Ti, Zr, Hf) NiSn Half-Heusler Alloys, Scr. Mater., 2012, 66, 1073–1076 CrossRef CAS.
- C. Fu, S. Bai, Y. Liu, Y. Tang, L. Chen, X. Zhao and T. Zhu, Realizing High Fig. of Merit in Heavy-Band p-Type Half-Heusler Thermoelectric Materials, Nat. Commun., 2015, 6, 8144 CrossRef PubMed.
- J.-W. G. Bos, Recent Developments in Half-Heusler Thermoelectric Materials, Thermoelectr. Energy Convers., 2021, 125–142 CAS.
- D. Behera, J. A. Abraham, R. Sharma, S. K. Mukerjee and E. Jain, First Principles Study
of New D0 Half-Metallic Ferromagnetism in CsBaC Ternary Half-Heusler Alloy, J. Supercond. Novel Magn., 2022, 35, 3431–3437 CrossRef CAS.
- Q. Wang, X. Xie, S. Li, Z. Zhang, X. Li, H. Yao, C. Chen, F. Cao, J. Sui, X. Liu and Q. Zhang, Enhanced thermoelectric performance in Ti (Fe, Co, Ni) Sb pseudo-ternary half-Heusler alloys, J. Materiomics, 2021, 7(4), 756–765 CrossRef.
- H. Zhu, J. Mao, Y. Li, J. Sun, Y. Wang, Q. Zhu, G. Li, Q. Song, J. Zhou, Y. Fu and R. He, Discovery of TaFeSb-based half-Heuslers with high thermoelectric performance, Nat. Commun., 2019, 10(1), 270 CrossRef PubMed.
- S. Zahir, N. Mehmood, R. Ahmad, S. Khan, A. U. Rahman and A. Dahshan, Structural, elastic, mechanical, electronic, magnetic and optical properties of half-Heusler compounds CoFeZ (Z= P, As, Sb): A GGA+ U approximation, Mater. Sci. Semicond. Process., 2022, 143, 106445 CrossRef CAS.
- D. Koller, F. Tran and P. Blaha, Merits and Limits of the Modified Becke-Johnson Exchange Potential, Phys. Rev. B, 2011, 83, 195134 CrossRef.
- P. Blaha, K. Schwarz, G. K. H. Madsen, D. Kvasnicka and J. Luitz, Wien2k. An augmented plane wave+ local orbitals program for calculating crystal properties, 2001, vol. 60 Search PubMed.
- C. Ambrosch-Draxl and J. O. Sofo, Linear Optical Properties of Solids within the Full-Potential Linearized Augmented Planewave Method, Comput. Phys. Commun., 2006, 175, 1–14 CrossRef CAS.
- J. P. Perdew, K. Burke and M. Ernzerhof, Generalized Gradient Approximation Made Simple, Phys. Rev. Lett., 1996, 77, 3865 CrossRef CAS PubMed.
- D. Behera, R. Sharma, H. Ullah, H. S. Waheed and S. K. Mukherjee, Electronic, Optical, and Thermoelectric Investigations of Zintl Phase AAg2Se2 (A= Sr, Ba) Compounds: A First First-Principles Approach, J. Solid State Chem., 2022, 123259 CrossRef CAS.
- M. Jamal, M. Bilal, I. Ahmad and S. Jalali-Asadabadi, IRelast Package, J. Alloys Compd., 2018, 735, 569–579 CrossRef CAS.
- H. Ehrenreich and M. H. Cohen, Self-consistent field approach to the many-electron problem, Phys. Rev., 1959, 115(4), 786 CrossRef.
- J. Sun, H.-T. Wang, J. He and Y. Tian, Ab initio investigations of optical properties of the high-pressure phases of ZnO, Phys. Rev. B, 2005, 71(12), 125132 CrossRef.
- G. K. H. Madsen and D. J. Singh, BoltzTraP. A Code for Calculating Band-Structure Dependent Quantities, Comput. Phys. Commun., 2006, 175, 67–71 CrossRef CAS.
- T. Katsura and Y. Tange, A Simple Derivation of the Birch–Murnaghan Equations of State (EOSs) and Comparison with EOSs Derived from Other Definitions of Finite Strain, Minerals, 2019, 9, 745 CrossRef CAS.
- D. Behera and S. K. Mukherjee, Theoretical Investigation of the Lead-Free K2InBiX6 (X= Cl, Br) Double Perovskite Compounds Using First Principle Calculation, JETP Lett., 2022, 1–10 Search PubMed.
- D. Behera, B. Mohammed, S. Taieb, B. Mokhtar, S. Al-Qaisi and S. K. Mukherjee, First-Principle Investigations on Optoelectronics and Thermoelectric Properties of Lead-Free Rb2InSbX6 (X= Cl, Br) Double Perovskites: For Renewable Energy Applications, Eur. Phys. J. Plus, 2023, 138, 520 CrossRef CAS.
- O. M. Abid, S. Menouer, A. Yakoubi, H. Khachai, S. B. Omran, G. Murtaza, D. Prakash, R. Khenata and K. D. Verma, Structural, Electronic, Elastic, Thermoelectric and Thermodynamic Properties of the NbMSb Half Heusler (M= Fe, Ru, Os) Compounds with First Principle Calculations, Superlattices Microstruct., 2016, 93, 171–185 CrossRef CAS.
- Born, M. K. Huang, Dynamical Theory of Crystal Lattices. Oxford University Press, 1954 Search PubMed.
- I. Waller, Dynamical Theory of Crystal Lattices by M. Born and
K. Huang, Acta Crystallogr., 1956, 9, 837–838 CrossRef.
- S. Lakra and S. Kumar Mukherjee, Study of Structural, Electronic, Optical and Thermodynamic Properties of SnSiO3 Compound: A DFT Study, Mater. Today: Proc., 2023 DOI:10.1016/j.matpr.2023.01.231.
- S. F. Pugh, XCII. Relations between the Elastic Moduli and the Plastic Properties of Polycrystalline Pure Metals, Lond. Edinb. Dublin philos. mag. j. sci., 1954, 45, 823–843 CrossRef CAS.
- S. F. Pugh, Lond. Edinb. Dublin philos. mag. j. sci., 1954, 45, 823 CrossRef CAS.
- I. N. Frantsevich, Elastic Constants and Elastic Moduli of Metals and Insulators. Reference book, 1982 Search PubMed.
- M. E. Eberhart and T. E. Jones, Cauchy Pressure and the Generalized Bonding Model for Nonmagnetic Bcc Transition Metals, Phys. Rev. B, 2012, 86, 134106 CrossRef.
- C. M. Kube, Elastic Anisotropy of Crystals, AIP Adv., 2016, 6, 95209 CrossRef.
- S. Al-Qaisi, H. Rached, T. A. Alrebdi, S. Bouzgarrou, D. Behera, S. K. Mukherjee, M. Khuili, M. Adam, A. S. Verma and M. Ezzeldien, Study of Mechanical, Optical, and Thermoelectric Characteristics of Ba2XMoO6 (X= Zn, Cd) Double Perovskite for Energy Harvesting, J. Comput. Chem., 2023, 44, 2442–2452 CrossRef CAS PubMed.
- S. A. Dar, V. Srivastava, U. K. Sakalle, V. Parey and G. Pagare, DFT investigation on electronic, magnetic, mechanical and thermodynamic properties under pressure of some EuMO3 (M= Ga, In) perovskites, Mater. Res. Express, 2017, 4(10), 106104 CrossRef.
- M. K. Y. Chan and G. Ceder, Efficient Band Gap Prediction for Solids, Phys. Rev. Lett., 2010, 105, 196403 CrossRef CAS PubMed.
- D. Behera, M. Manzoor, M. W. Iqbal, S. Lakra and S. K. Mukherjee, Revealing Excellent Electronic, Optical, and Thermoelectric Behavior of EU Based EuAg2Y2 (Y = S/Se): for Solar Cell Applications, Comput. Condens. Matter, 2022, 32, e00723 CrossRef.
- X. Ma, Y. Wu, Y. Lv and Y. Zhu, Correlation Effects on Lattice Relaxation and Electronic Structure of ZnO within the GGA+U Formalism, J. Phys. Chem. C, 2013, 117, 26029–26039, DOI:10.1021/jp407281x.
- D. Behera and S. K. Mukherjee, First-Principles Calculations to Investigate Structural, Optoelectronics and Thermoelectric Properties of Lead Free Cs2GeSnX6 (X= Cl, Br), Mater. Sci. Eng. B, 2023, 292, 116421 CrossRef CAS.
- O. Rubel, F. Tran, X. Rocquefelte and P. Blaha, Perturbation Approach to Ab Initio Effective Mass Calculations, Comput. Phys. Commun., 2021, 261, 107648 CrossRef CAS.
- L. Hnamte, H. Joshi and R. K. Thapa, Electronic and Optical Properties of Double Perovskite Oxide Pb 2 ScSbO 6: A First Principles Approach, IOSR J. Appl. Phys, 2018, 10, 39–44 Search PubMed.
- D. Behera, A. Dixit, B. Nahak, A. Srivastava, R. Sharma, R. Khenata, S. Bin-Omran, S. A. M. Abdelmohsen, A. M. M. Abdelbacki and S. K. Mukherjee, Theoretical Insight on the Electronic Band Structure, Mechanical, Vibrational and Thermodynamic Characteristic of Antiperovskites RE3InN (RE= Y and La), Mater. Today Commun., 2023, 35, 105618 CrossRef CAS.
- D. Behera, M. Manzoor, M. Maharana, M. W. Iqbal, T. Zahid, S. Lakra, S. K. Mukherjee and S. S. Alarfaji, Structural, Electronic, Optical, and Thermoelectric Response of Zintl Phase AAg2S2 (A= Sr/Ba) Compounds for Renewable Energy Applications, Phys. B, 2023, 649, 414446 CrossRef CAS.
- V. Ponnambalam, S. Lindsey, W. Xie, D. Thompson, F. Drymiotis and T. M. Tritt, High Seebeck Coefficient AMXP2 (A= Ca and Yb; M, X= Zn, Cu and Mn) Zintl Phosphides as High-Temperature Thermoelectric Materials, J. Phys. D: Appl. Phys., 2011, 44, 155406 CrossRef.
- M. Jonson and G. D. Mahan, Mott's Formula for the Thermopower and the Wiedemann-Franz Law, Phys. Rev. B, 1980, 21, 4223 CrossRef CAS.
- G. A. Slack, in Solid State Physics: Advances in Research and Applications, ed. H. Ehrenreich, F. Seitz, and D. Turnbull, Academic Press, New York, 1979, vol. 34, p. 1 Search PubMed.
- G. A. Slack, Nonmetallic crystals with high thermal conductivity, J. Phys. Chem. Solids, 1973, 34(2), 321–335 CrossRef CAS.
- A. Saxena, A. Dixit, D. Behera, J. A. Abraham, R. Sharma and S. K. Mukherjee, Insight on Structural, Electronic and Thermoelectric Properties of Perovskite AgBaCl3 by an Ab-Initio for Solar Cell and Renewable Energy, Mater. Today: Proc., 2023 Search PubMed.
- N. Wang, C. Shen, Z. Sun, H. Xiao, H. Zhang, Z. Yin and L. Qiao, High-Temperature Thermoelectric Monolayer Bi2TeSe2 with High Power Factor and Ultralow Thermal Conductivity, ACS Appl. Energy Mater., 2022, 5, 2564–2572 CrossRef CAS.
- V. F. Kharlamov, Thermoelectric Fig. of Merit of a Material Consisting of Semiconductor or Metal Particles, J. Exp. Theor. Phys., 2013, 117, 83–88 CrossRef CAS.
- D. Behera and S. K. Mukherjee, Insight to Structural, Electronic, Optical and Thermoelectric Properties of NaCaSb and KCaSb Half Heusler Compounds: A DFT Approach, JETP Lett., 2023, 1–14 Search PubMed.
- A. K. Verma, K. K. Johari, K. Tyagi, D. K. Sharma, P. Kumar, S. Kumar, S. Bathula, S. R. Dhakate and B. Gahtori, Role of sintering temperature on electronic and mechanical properties of thermoelectric material: A theoretical and experimental study of TiCoSb half-Heusler alloy, Mater. Chem. Phys., 2022, 281, 125854 CrossRef CAS.
- G. Rogl, A. Grytsiv, M. Gürth, A. Tavassoli, C. Ebner, A. Wünschek, S. Puchegger, V. Soprunyuk, W. Schranz, E. Bauer, H. Müller, M. Zehetbauer and P. Rogl, Mechanical properties of half-Heusler alloys, Acta Mater., 2016, 107, 178–195 CrossRef CAS.
- S. Kacimi, H. Mehnane and A. Zaoui, I–II–V and I–III–IV half-Heusler compounds for optoelectronic applications: Comparative ab initio study, J. Alloys Compd., 2014, 587, 451–458 CrossRef CAS.
- S. Ouardi, G. H. Fecher, C. Felser, J. Hamrle, K. Postava and J. Pištora, Transport and optical properties of the gapless Heusler compound PtYSb, Appl. Phys. Lett., 2011, 99, 211904 CrossRef.
- I. Ioannou, S. P. Ioannou, A. Delimitis, Y. Gelbstein, I. Giapintzakis and T. Kyratsi, High thermoelectric performance of p-type half-Heusler (Hf,Ti)Co(Sb,Sn) solid solutions fabricated by mechanical alloying, J. Alloys Compd., 2021, 858, 158330 CrossRef CAS.
|
| This journal is © The Royal Society of Chemistry 2024 |
Click here to see how this site uses Cookies. View our privacy policy here. 
 Open Access Article
 This Open Access Article is licensed under a Creative Commons Attribution-Non Commercial 3.0 Unported Licence
 ab,
D. Beherac,
Ramesh Sharma
ab,
D. Beherac,
Ramesh Sharma