
 Open Access Article
 This Open Access Article is licensed under a Creative Commons Attribution-Non Commercial 3.0 Unported Licence
Fabrication and application of glutathione biosensing SPCE strips with gold nanoparticle modification
Yu-Ling Sun†
a,
Hui-Fang Chang†bc,
Ping-Hsuan Chiangb,
Meng-Wei Linb,
Cheng-Han Linb,
Chiu-Mei Kuod,
Tzu-Ching Line and
Chih-Sheng Lin *bf
*bf
aAquatic Technology Research Center, Agricultural Technology Research Institute, Hsinchu 300, Taiwan
bDepartment of Biological Science and Technology, National Yang Ming Chiao Tung University, Hsinchu 300, Taiwan. E-mail: lincs@nycu.edu.tw
cDivision of Endocrinology, Department of Internal Medicine, Hsinchu Mackay Memorial Hospital, Hsinchu 300, Taiwan
dDepartment of Chemical Engineering, Chung Yuan Christian University, Taoyuan City 320, Taiwan
eDivision of Pharmacy, Koo Foundation Sun Yat-Sen Cancer Center, Taipei 100, Taiwan
fCenter for Intelligent Drug Systems and Smart Bio-devices (IDS2B), National Chiao Tung University, Hsinchu 300, Taiwan
First published on 25th January 2024
Abstract
Glutathione (GSH) is a major antioxidant in organisms. An alteration in GSH concentration has been implicated in a number of pathological conditions. Therefore, GSH sensing has become a critical issue. In this study, a disposable strip used for tyrosinase-modified electrochemical testing was fabricated for the detection of GSH levels in vivo. The system is based on tyrosinase as a biorecognition element and a screen-printed carbon electrode (SPCE) as an amperometric transducer. On the tyrosinase–SPCE strips, the oxidation reaction from catechol to o-quinone was catalyzed by tyrosinase. The tyrosinase–SPCE strips were modified with gold nanoparticles (AuNPs). In the presence of AuNPs of 25 nm diameter, the cathodic peak current of cyclic voltammetry (CV) was significantly enhanced by 5.2 fold. Under optimized conditions (250 μM catechol, 50 mM phosphate buffer, and pH 6.5), the linear response of the tyrosinase–SPCE strips ranged from 31.25 to 500 μM GSH, with a detection limit of approximately 35 μM (S/N > 3). The tyrosinase–SPCE strips have been used to detect real samples of plasma and tissue homogenates in a mouse experiment. The mice were orally administrated with N-acetylcysteine (NAC) 100 mg kg−1 once a day for 7 days; the plasma GSH significantly enhanced 2.8 fold as compared with saline-treated mice (1123 vs. 480 μM μg−1 protein). NAC administration also could alleviate the adverse effect of GSH reduction in the mice treated with doxorubicin.
1 Introduction
Glutathione (GSH) is the principal non-protein thiol compound present in most mammalian cells. This tripeptide acts as a major bio-reducing agent. It plays an essential role in protecting cells from free radicals and reactive oxygen species and maintains an adequate intracellular redox status. Traditional methods for analyzing GSH concentration include absorbance, fluorescence probes, liquid chromatography, spectrofluorometry, and potentiometry.1,2 The separation of reactants by high-performance liquid chromatography (HPLC) allows the accurate and reliable quantitation of GSH and glutathione disulfide (GSSG) due to the separation of individual derivatized or electrochemically active products.3,4 However, it has also been indicated that these methods are not suitable in certain situations due to large derivatization processes being required. Although all of these methods are currently available for GSH determination, most of them involve complicated and time-consuming protocols, as well as insufficient sensitivity for small samples. For biological samples, the most commonly used assay is Ellman's method.5 This is based on the reaction between GSH and 5,5′-dithiobis(2-nitrobenzoic acid), which generates 2-nitro-5-mercapto-benzoic acid, which was monitored spectrophotometrically at 412 nm. This test has to use an expensive instrument and is not sensitive to other techniques.6To solve this problem, many biosensors have been developed for the detection of GSH.7–9 Among the various biosensors, electrochemical biosensors have attracted particular attention because they provide a sensitive, simple, and miniaturized platform. However, only a few have been used as analytical methods for the detection of GSH in real samples. Disposable sensors are based on a combination of screen-printed electrochemical sensors and enzymes adsorbed on the electrode surface (in this case, mainly carbon). The use of the sensor for only one measurement limited the use of complicated immobilization procedures to the simplest possible extent, such as those based only on adsorption on the carbon surface. This electrode surface acted as a sponge, and the large protein was easily immobilized even if the bond was weak. This approach is useful only for quick and rapid measurements. The potential of this fabrication method for the production of commercial devices is exemplified by the personal glucose biosensor used widely by diabetics.10–12
Gold nanoparticles (AuNPs) have received great interest because of their attractive electronic, unique optical, thermal, and physical properties, as well as catalytic properties, and potential applications in the fields of bio-nanotechnology and in the rapid development of biosensors.13,14 AuNPs have interesting optical and electronic properties that have served as versatile platforms for exploring many basic science faces. They can exhibit plasmon coupling, which may redshift the resonance wavelength. Generally, the exact plasmon resonance band can be determined by the size, shape, medium, and relative distance between particles.15,16 AuNPs have received much attention and have great potential applications in the field of biosensors owing to their special physical – chemical character.17 Therefore, the synthesis and characterization of AuNPs have attracted considerable attention. Furthermore, they have been proposed as future building blocks in nanotechnology.18
In this study, we propose a sensitive and amplified electrochemical assay using screen-printed carbon electrode (SPCE) strips for GSH detection in real samples. To fabricate this biosensor, the AuNP conditions were optimized, and the properties of AuNPs were characterized. Furthermore, enzyme-based (tyrosinase) biosensing SPCE strips were fabricated and optimized. The specificity of the enzyme-based biosensing strips was investigated. Therefore, the developed biosensor was used to detect GSH under buffer conditions and was calibrated. The biosensing platform was used to detect GSH in plasma and tissue samples.
2 Materials and methods
In this study, AuNPs and ferrocenecarboxylic acid (FeDC) were immobilized on a strip and modified working and reference electrodes. Electrochemical characteristics were investigated using cyclic voltammetry (CV) and amperometric tests. The parameters affecting the response current were optimized. Finally, we investigated the application of tyrosinase–SPCE strips in vivo for the determination of GSH.2.1 Instruments
CV and amperometric measurements were performed using a CV50W voltammetric analyzer (Bioanalytical Systems, West Lafayette, IN, USA). The analyzer was connected to a personal computer and a battery-powered and handheld PalmSens/Personal Digital Assistant instrument (Palm instruments, BZ Houten, Netherlands) for data collection and calculation. The SPCE surface was observed using a High-Resolution Scanning Electrode Microscope (SEM), Energy Dispersive Spectrometer (EDS) (Hitachi S-4700I), and a Cressington 108 automatic sputter coater (Cressington Scientific Instruments Ltd, England, UK). The size of the AuNPs was verified by dynamic light scattering (DLS) (BI-200SM; Brookhaven Instruments, Holtsville, NY, USA) The absorbance values of plate tyrosinase inhibition assay was recorded at 530 nm using the SpectraMax 190 spectrophotometer (Molecular Devices Corporation Sunnydale, CA, USA) and the absorbance values of plate GSH assay were recorded at 412 nm.2.2 Reagents and solutions
All chemicals were of analytical grade and used without further purification. Sodium citrate and ethanol were obtained from Merck (Darmstadt, Germany). Tyrosinase (from mushrooms, EC1.14.18.1) was purchased from Sigma-Aldrich (St. Louis, MO, USA). FeDC, chloroauric acid (HAuCl4), ammonium hydroxide (NH4OH; 25% NH3 basis), catechol, GSH, 2-nitro-5-thiobenzoic acid (TNB), 5,5′-dithiobis(2-nitrobenzoic acid) (DTNB), meta-phosphoric acid (MPA), bovine serum albumin (BSA), doxorubicin, dibasic sodium phosphate, monobasic sodium phosphate, glutaraldehyde, and potassium chloride were obtained from Sigma-Aldrich. For the preparation of the biosensor, the following solutions were used 100 U μL−1 tyrosinase, 2.5% glutaraldehyde solution and 1% BSA solution were prepared in 50 mM phosphate buffer at pH 6.5. Stock 100 mM solution of catechol (99%; Sigma-Aldrich) and all the working solutions were prepared daily by dilution in phosphate buffer. Five mM FeDC dissolved in 95% ethanol was used as the mediator applied in the tyrosinase biosensor system. Water was obtained by passing twice-distilled water through a Milli-Q system (18 MΩ cm; Millipore, Billerica, MA, USA).2.3 Preparation of AuNPs
AuNPs were prepared according to our reports19,20 with minor modifications. In a 100 mL beaker, 1.5 mL of 38.8 mM sodium citrate was quickly added to a boiling solution (25 mL) of 1 mM HAuCl4 with vigorous stirring for 10 min. The solution was cooled to room temperature with continuous stirring for 15 min, after which the AuNP solution was concentrated to 259 nM. AuNPs with an average diameter of 25 nm were produced and stored at 4 °C. The reaction sequence is as follows.| HAuCl4(aq) + C6H5O7Na3(aq) → Au (colloid) |
2.4 Fabrication and analysis of modified bilateral electrode on SPCE
A framework for electrochemical strip-based SPCE was fabricated (Fig. 1). In the treatment of SPCE strips, a 2.5 μL and 0.8 μL of NH4OH solution were respectively deposited separately on the working and reference surface for 30 min at 37 °C. The electrode was then washed with water and dried in air. A 2.5 μL and 0.8 μL of 25 nm AuNPs solution was dropped on the NH4OH-treated electrodes for 30 min at 37 °C and then washed in water and dried in air. A 2.5 μL and 0.8 μL of 50 mM PB buffer was dropped on the AuNPs-treated electrodes for 30 min at 37 °C and then washed in water and dried in air. Finally, 2.5 μL of 10 U tyrosinase solution was dropped on the working electrode.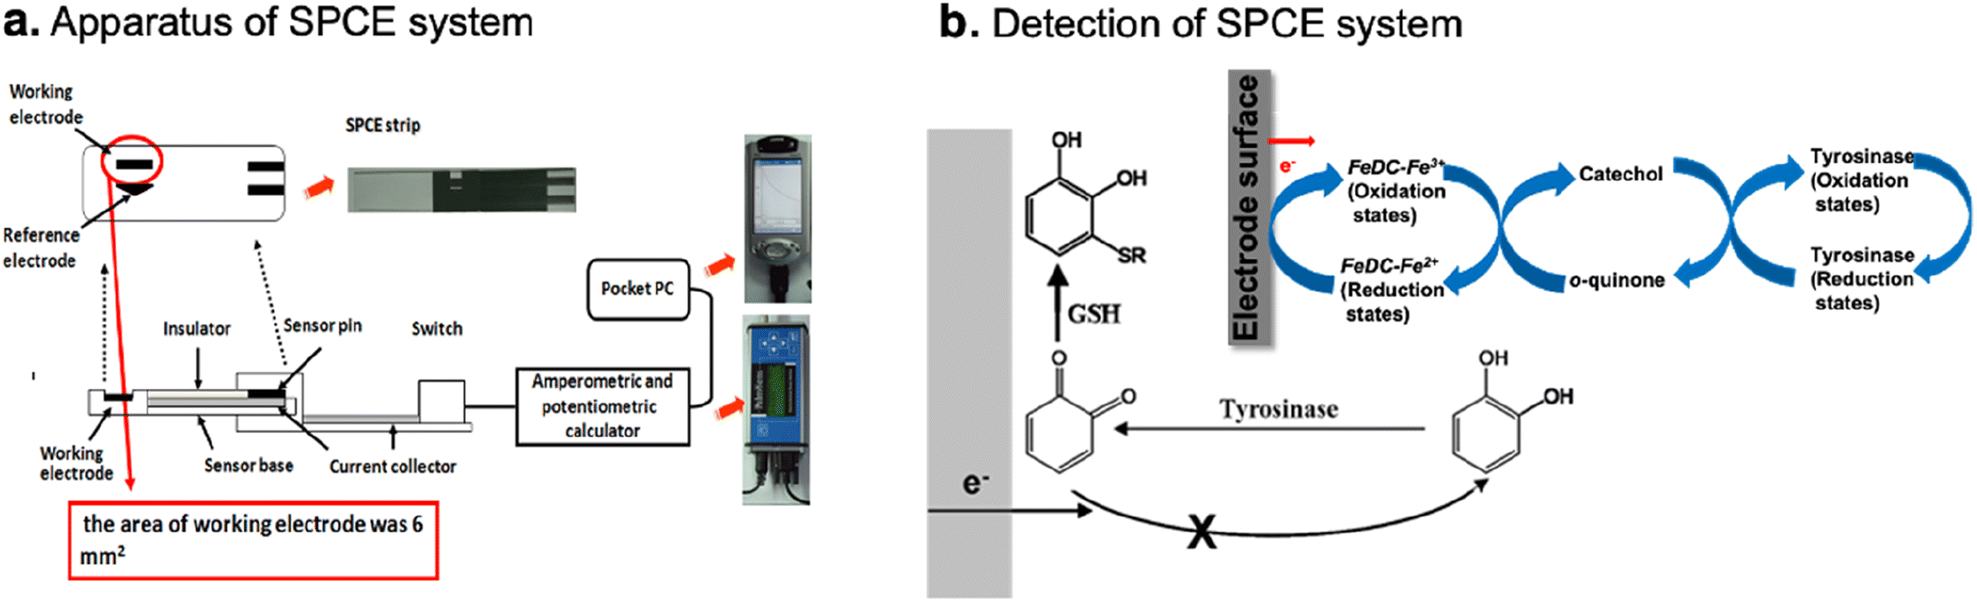 | ||
| Fig. 1 Schematic diagram of the apparatus and detection of SPCE system. The CV50W-PC and PalmSense-PDA were used for the detections of CV and amperometry, respectively. The size of SPCE strip was 2 mm × 3 mm and the area of working electrode was 6 mm2. The distance between working electrode and counting/reference electrode was 1 mm and the filled-full volume of reaction area was 10 μL (a). The detection of the reduced glutathione (GSH) is accomplished by suppressing the recycling process which occurs between tyrosinase and electrode of biostrip. The GSH reacted with o-quinone and GSH–quinone complex was produced. The production of GSH–quinone complex reduced the quantity of o-quinone and made the reduction current decreasing (b). The detection model would be described detail in the section of Materials and methods. | ||
2.5 Fabrication and analysis of AuNPs modified SPCE
The protocol for fabricating the AuNP-modified SPCE was described in our previous report.21,22 The SPCEs were constructed and sequentially printed with silver-resin inks and carbon/graphite ink using an automated screen-printer and oven (BUILT-IN Corp, Taichung, Taiwan), coated with NH4OH, and electrochemically characterized by tyrosinase, which reacts with catechol to generate electrodes for detection. The SPCEs consisted of 6 mm2 carbon-surface electrodes, a working electrode, and a counter/reference electrode. In the treatment of working electrode of SPCEs, a 2.5 μL and 0.8 μL of NH4OH solution were deposited separately on the working and reference surface for 30 min at 37 °C, respectively. The electrodes were then washed with water and dried in air. A 2.5 μL and 0.8 μL of 25 nm AuNPs concentrate solution was dropped on the NH4OH-treated electrodes for 30 min at 37 °C and then washed in water and dried in air. The surface morphology of AuNPs-SPCE was investigated using a Cressington 108 automatic sputter coater (<0.05 mBar, Pt coating with 20 Ma, 2 min) and a Quanta 400 FEG SEM (high-vacuum: <4.5 × 10⁻⁵ Pa; voltage 20–25 kV; detectors: 50% SE and 50% BSE; resolution: 2–3 nm).2.6 CV and amperometric assays
Experiments were performed in 10 μL of catechol solution (in 50 mM phosphate buffer, pH 6.5) dropped onto the electrochemical reaction area of the SPCE strip. CV was carried out using a signal generator and a potentiostat (CV 50 W Voltammetric analyzer; Bioanalytical Systems, West Lafayette, IN, USA). Differential pulse voltammetric measurements were performed from −600 mM to +600 mM at a scan rate of 100 mM s−1.All amperometric experiments were performed in 10 μL of catechol solution dropped onto the electrochemical reaction area of the SPCE strips and incubated for 40 s at 25 °C. A fixed potential of, −200 mV vs. the counter/reference electrode was applied after the incubation period. The current signal was defined in the study: response current (RC) was the sum of the current signals collected per 0.1 s during the following 50 s.
2.7 Catechol detection
Different concentrations of catechol solutions were prepared (0, 7.6, 15, 31, 62, 125, 250, 500, 1000, 2500, 5000, 7500, and 10![[thin space (1/6-em)]](https://www.rsc.org/images/entities/char_2009.gif) 000 μM) in PB buffer. All samples were analysed using a tyrosinase–SPCE strip at 25 °C for 50 s. A fixed potential of, −200 mV vs. counter/reference electrode was applied after the incubation period. The calibration curve for the tyrosinase–SPCE strip with increasing catechol concentration was obtained by recording the recycling reaction of catechol.23
000 μM) in PB buffer. All samples were analysed using a tyrosinase–SPCE strip at 25 °C for 50 s. A fixed potential of, −200 mV vs. counter/reference electrode was applied after the incubation period. The calibration curve for the tyrosinase–SPCE strip with increasing catechol concentration was obtained by recording the recycling reaction of catechol.23
2.8 Glutathione detection
All samples were analysed using the proposed tyrosinase–SPCE strip for GSH and Ellman's test method. In Ellman's test, GSH is oxidized by DTNB to give GSSG with the formation of TNB in the thiolate anion form, which is a yellow-colored product.For the amerometric measurements, 20 μL of the sample was diluted in 50 mM phosphate buffer. Diluted blood samples (10 L) were mixed with 10 μL of a 250 mM catechol solution. The final concentration of catechol was 125 μM, and 10 μL of the analyte was used for the amperometric method.
For spectrophotometric measurements, the method described by Anderson24 was used, which is based on the reaction of GSH and DTNB (Ellman's reagent), generate 2-nitro-5-mercapto-benzoic acid. This method was used as a reference for GSH detection. First, a DTNB stock solution and a 1 M Tris dilution buffer (pH 8.0) were prepared. The DTNB stock solution contained 50 mM sodium acetate and 2 mM DTNB in water. The sample was mixed with 50 μL DTNB stock solution, 100 μL Tris solution, and water. The final volume of the sample was 1000 μL. The mixture was mixed well and incubated at 37 °C for 5 min. The mixture 100 μL mixture to a 96-well plate and monitored using a spectrometer at 412 nm.
2.9 Animal experiment for the detection of blood, plasma and organs GSH
Twenty 6 week-old male C57BL/6JNarl mice weighting approximately 15–20 g were obtained from National Laboratory Animal Center (NLAC), Taiwan. The mice were randomly assigned to four groups of five animals each. They were housed in a plastic suspended cage placed in a well-ventilated mouse house, provided with mouse pellets and water ad libitum, and subjected to a natural photoperiod of 12 h light and 12 h dark cycle. Mice in the control group were administered normal saline. Animals in Group II–III were treated with an intraperitoneal (i.p.) injection of 14 mg kg−1 doxorubicin. Groups III were treated orally with N-acetylcysteine (NAC) 100 mg kg−1 once a day for 7 or 14 days. Group IV was treated with NAC 100 mg kg−1 once a day for 7 or 14 days. The experiment lasted for 7 or 14 days. The GSH levels in the plasma and tissues (heart, lung, and liver) of C57BL/6JNarl mice were measured on day-7 or day-14 after doxorubicin treatment as well as NAC administration.All animal experiments conformed to the “Guide for the Care and Use of Laboratory Animals published by the National Institutes of Health” (NIH Publication No. 85-23, revised 1996) and were approved by the Animal Welfare Committee of the National Chiao Tung University. The number of mice used in this study was evaluated and minimized with best efforts.
2.10 Preparation of plasma and tissue samples
After the experiments, the mice were sacrificed after anesthetization by injection of avertin (250 mg kg−1) and blood was collected by direct cardiac puncture. Blood samples without heparin were centrifuged (3000g, 15 min at 4 °C) to obtain plasma (supernatants). The hearts, lungs, and livers of the mice were excised after perfusion with 0.9% NaCl solution. All plasma and tissue samples were stored at −80 °C until use.For tissue homogenate preparation, weighed tissue samples (200 mg) were homogenized with the lysis buffer PRO-PREP™ Protein Extraction Solution (iNtRON Biotechnology, Kyungki-Do, Korea). The samples were centrifuged (12000g for 10 min at 4 °C) to separate the supernatant from the pellets. The supernatants obtained were used for biochemical assays. The protein concentration of the homogenous extract was measured using Bradford dye binding assay (Bio-Rad Laboratories, Hercules, CA, USA) with BSA as the standard.
2.11 Data analysis
The electrochemical experimental data were analysed using the P-Sensor software of the ADS system in real time. Each experiment was repeated five times using five different SPCE devices to test the reproducibility of the SPCE strips. All data are presented as the mean ± standard deviation (SD). Differences between groups were evaluated using two-tailed Student's t-test. Statistical significance was set than 0.05.3 Results and discussion
3.1 Preparation and characterization of the AuNPs
Citrate reduction is the most commonly used method to produce colloidal AuNPs. Frens et al.25 reported that the size variation of AuNPs ranging between 10 and 150 nm in diameter could be readily achieved by simply changing the concentration of sodium citrate. In this study, we chose and prepared AuNPs of four different sizes (5, 13, 25, and 40 nm) to optimize our system. The size of the AuNPs was confirmed using dynamic light scattering (DLS). DLS can be used to determine the particle size in transparent media and the particle size over the size range from a few nanometers to new micros.26 DLS results for colloidal AuNPs indicated that the mean diameters of AuNPs of different sizes were 13 nm, 25 nm, and 40 nm (Fig. 2). AuNPs are larger diameter particles (20 and 50 nm) that provide lower impedance changes and smaller diameter particles (2, 5, 10, and 15 nm) that provide larger impedance changes if they are adsorbed onto the electrode surface.27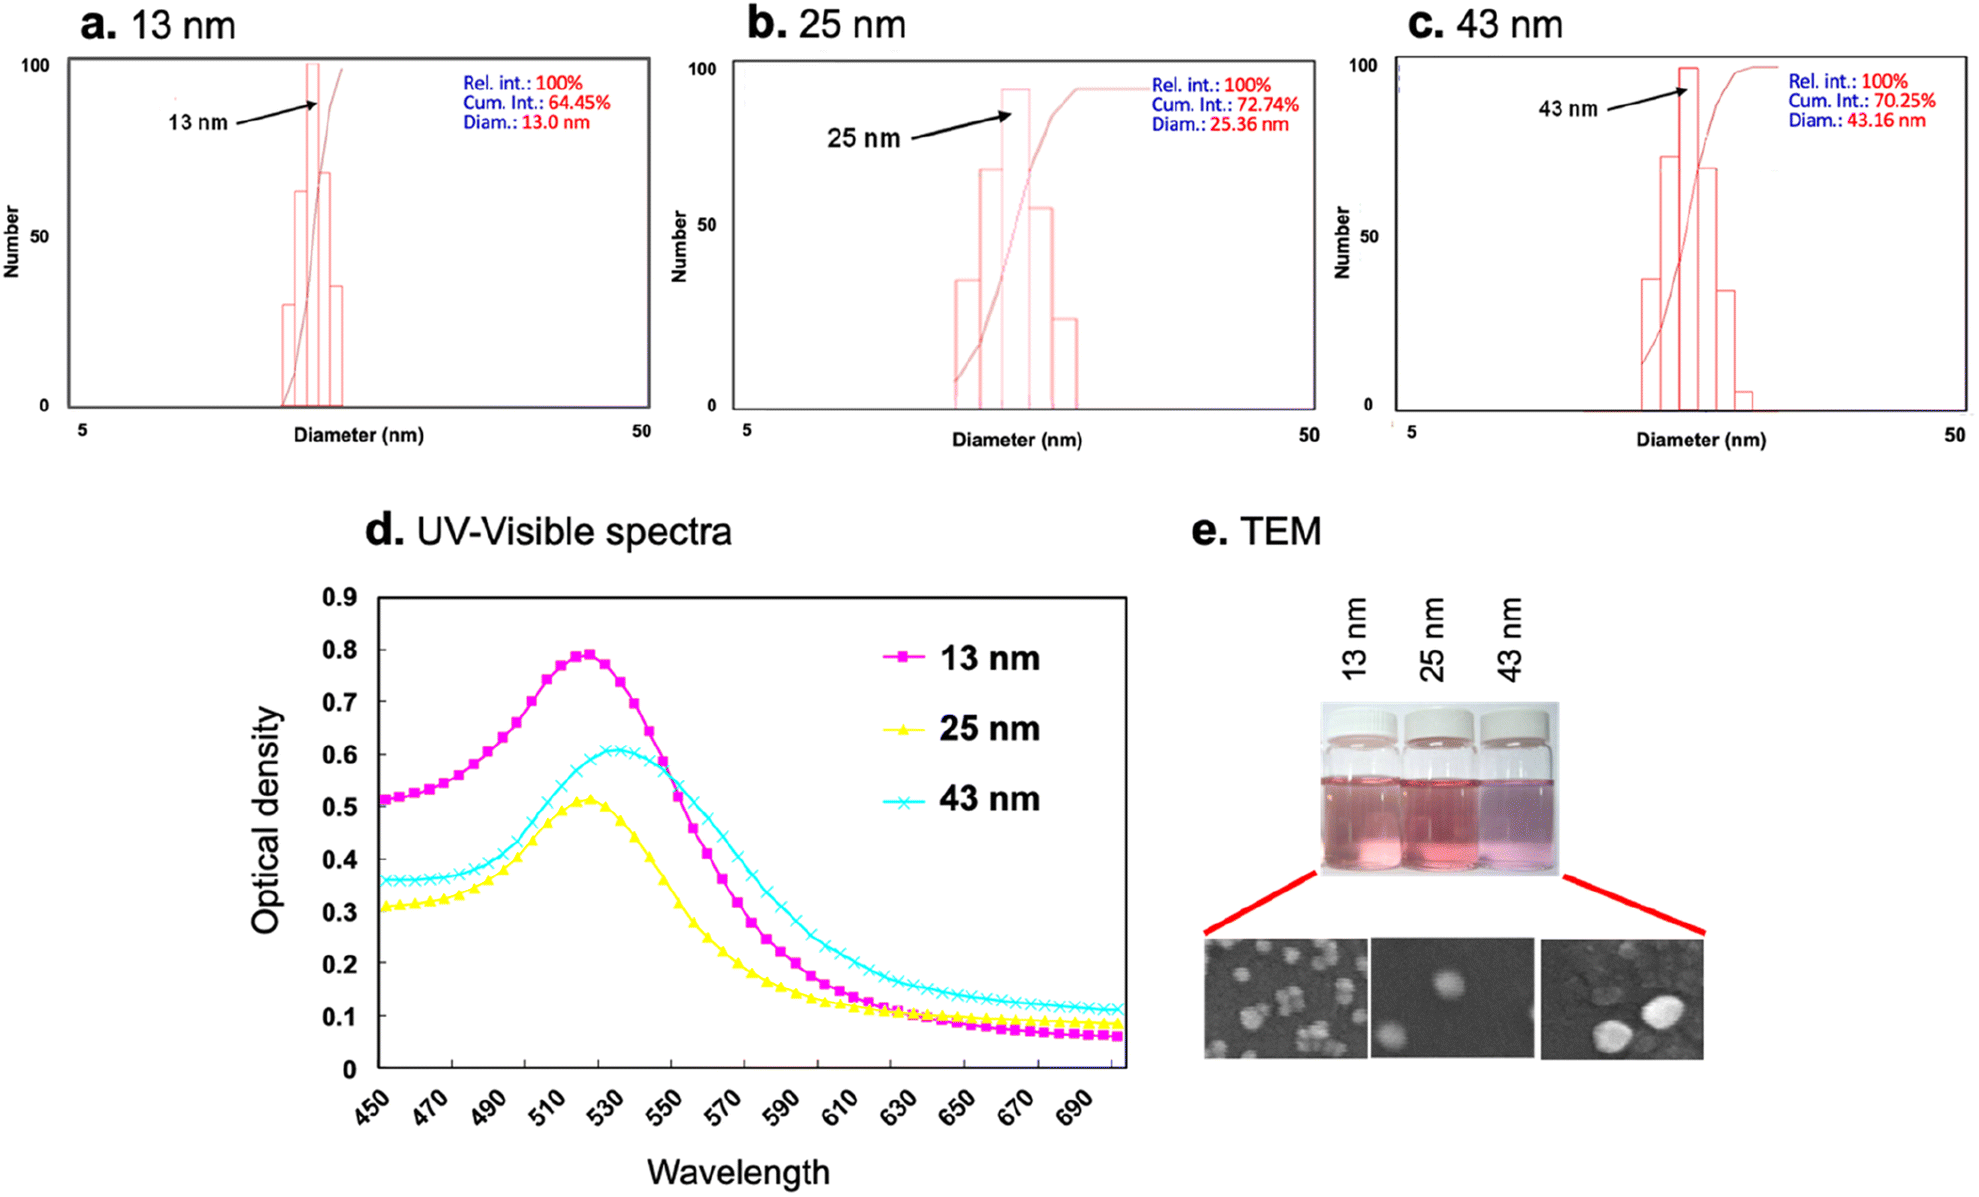 | ||
| Fig. 2 The size of prepared AuNPs was measured by dynamic light scattering (DLS), UV-visible spectra and transmission electron microscope (TEM). The different diameters of AuNPs were prepared and determined by DLS, including 13 nm (a), 25 nm (b) and 43 nm (c). The prepared AuNPs were also detected by UV-visible spectra (d) and observed by TEM (e). | ||
According to the CV and amperometric methods, the electronic conductivity was much better with increasing size (Fig. 3). Finally, 25 nm AuNPs were applied in our electrochemical system. In addition to the size effect of AuNPs, the concentration effect of AuNPs is also an important issue to investigate. In this study, we synthesized six different concentration of 25 nm AuNPs (259, 130, 65, 32, 26, and 16 nM). In accordance with the CV method and amperometric method, the electronic conductivity was much better and better with the increasing concentration (Fig. 4). Finally, 259 nM of 25 nm AuNPs was applied to our electrochemical biosensor.
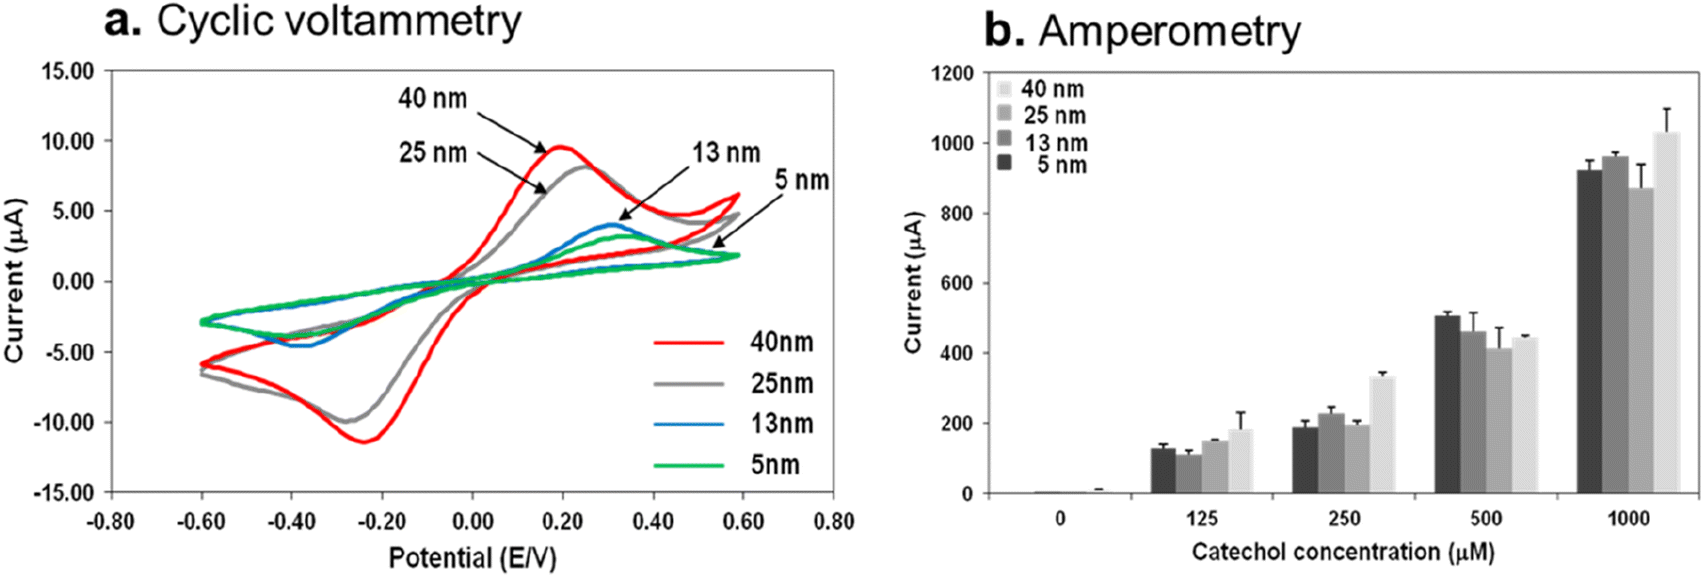 | ||
| Fig. 3 CV and amperometry determinations of the tyrosinase–modification strips with different sizes of AuNPs. (a) Preparation of SPCE strips modified with AuNPs of different sizes (5, 13, 25, and 40 nm), FeDC, and tyrosinase (10 U per strip), and CV was recorded in 125 μM catechol (10 U per strip tyrosinase, 50 mM phosphate buffer at pH 6.5) at a scan rate of 100 mV s−1. (b) Preparation of SPCE strips modified with AuNPs of different sizes (5, 13, 25, and 40 nm) and amperometric detection in catechol (0, 125, 250, 500, and 1000 μM). Each bar indicates mean ± SD (n = 5). | ||
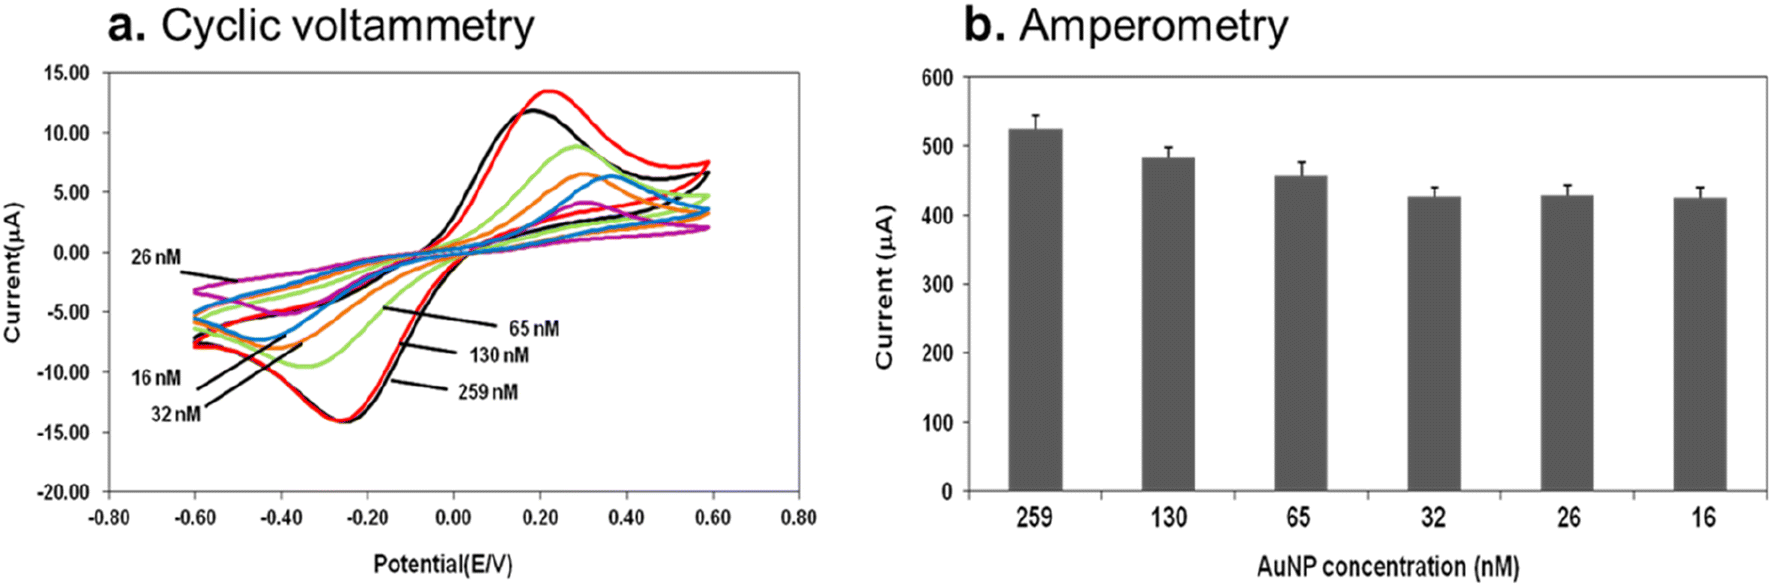 | ||
| Fig. 4 CV and amperometric tests of the tyrosinase–SPCE strips with different concentration of 25 nm AuNPs. (a) Preparation of SPCE strips modified with AuNPs, FeDC, and tyrosinase (10 U per strip). CV was recorded in 125 μM catechol (10 U per strip tyrosinase, 50 mM phosphate buffer at pH 6.5) at a scan rate of 100 mV s−1. (b) Amperometric test of tyrosinase–SPCE strips was performed. Each value was derived from five independent detections, and the error bars indicate the SD (n = 5). | ||
In this study, 25 nm AuNP were produced using the sodium citrate reduction method. The absorption spectra of the 25 nm AuNPs were scanned using an Ultrospec 3300 pro UV-vis spectrophotometer. The extinction coefficients of AuNPs are typically very high.28 In previous reports, the optical spectrum was used to estimate the particle size of AuNPs, and the maximum absorbance (λmax) of 25 nm AuNPs was located at 525 nm.29 In this study, the UV-vis absorption spectra of the 25 nm AuNPs were confirmed. The red-colored AuNPs (25 nm in diameter) exhibited a surface plasmon resonance band at 525 nm (data not shown).
The change in size of the modified AuNPs was investigated by DLS (Fig. 2). In the process of the 25 nm AuNPs synthesized by sodium citrate reduction, citrate and free chloride ions were adsorbed on the surface of the AuNPs and provided a negative charge to the AuNP surface. The AuNPs were nearly dispersive on the chip because the negative charge of AuNPs would repel each other, and the average particle size of the AuNPs was 25 ± 3.6 nm.
The scanning electron microscope (SEM) was used to evaluate the physical appearance and surface characteristics of the AuNPs modified strip. Fig. 5 shows the morphologies of the bare and AuNP-modified SPCE. The surface of the bare SPCE was uneven. When AuNPs were modified and immobilized on the surface of the SPCE, there was a good distribution of AuNPs on the surface. The size of the AuNPs was uniform and they were approximately 25 nm in diameter.
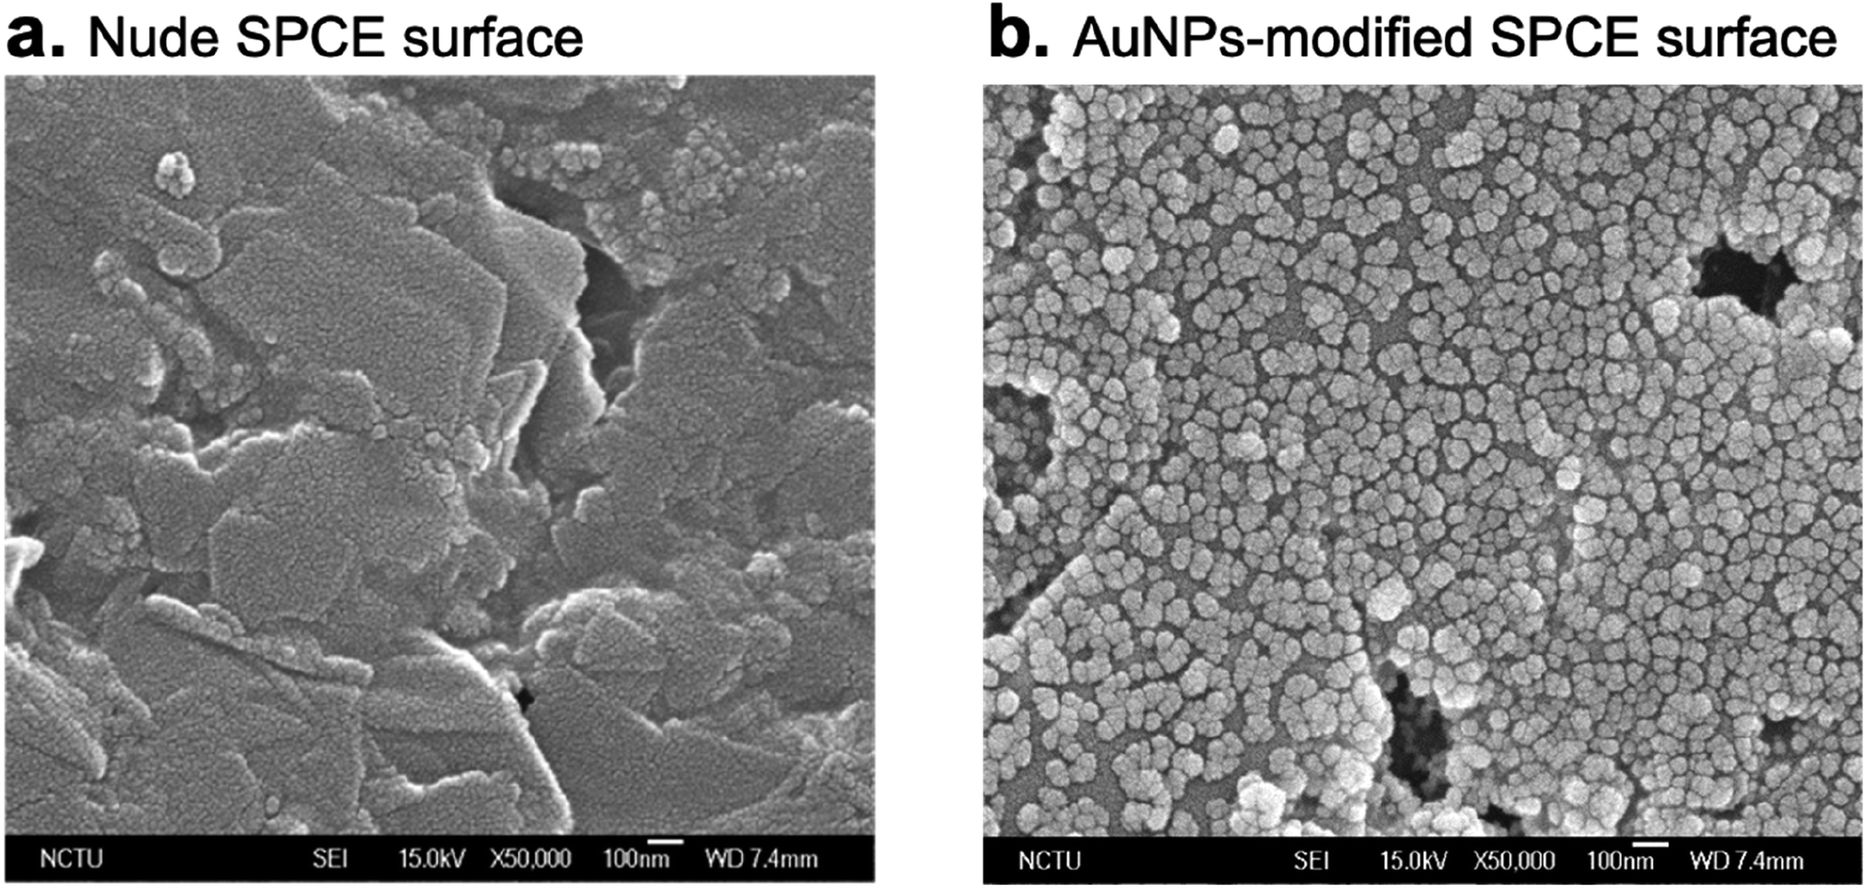 | ||
| Fig. 5 The distribution of AuNPs was observed on the biosensing strips by scanning electron micrographs (SEM). (a) Nude SPCE surface and (b) AuNPs-modified SPCE surface were shown. The AuNPs addressed on the surface of SPCE were 25 nm diameters. On the surface of SPCE modified with AuNPs, it shows a uniform distribution of AuNPs on the surface. | ||
Sodium citrate was used as a reducing agent. After the reaction, negatively charged citrate ions are adsorbed onto the AuNPs, introducing a surface charge that prevents aggregation.30 The negative charge surrounding the AuNPs resulted in good distribution on the surface.
3.2 CV test of the modified electrodes
A good CV of the prepared sensor was required to develop an amperometric sensor. In previous studies, FeDC was used as the mediator in the H2O2-peroxidase electrochemical reaction, and the biosensor was operated at 150–420 mV. Therefore, a non-enzymatic FeDC redox system was investigated at a cyclic scan range of −600 to +600 mV and a scan rate of 100 mV s−1 to evaluate the effects on the electrochemical characteristics of the modified SPCE. We evaluated the effect of the modification of AuNPs and the mediator (FeDC) on the SPCE electrode surface. The AuNP/FeDC-modified SPCE strip was slightly modified as described in Lin's protocol.21Fig. 6(a) shows the CV of various modified SPCE electrodes obtained in 125 μM catechol in the applied potential range from −600 mV to +600 mV at a scan rate of 100 mV s−1. The test SPCE electrodes included bare SPCE strips; SPCE/NH4OH/Try (SPCE modified with NH4OH and tyrosinase); SPCE/NH4OH/AuNPs/Try (SPCE modified with NH4OH, AuNPs, and tyrosinase); SPCE/NH4OH/FeDC/Try (SPCE modified with NH4OH, FeDC, and tyrosinase) and SPCE/NH4OH/AuNPs/FeDC/Try (SPCE modified with NH4OH, AuNPs, FeDC, and tyrosinase).
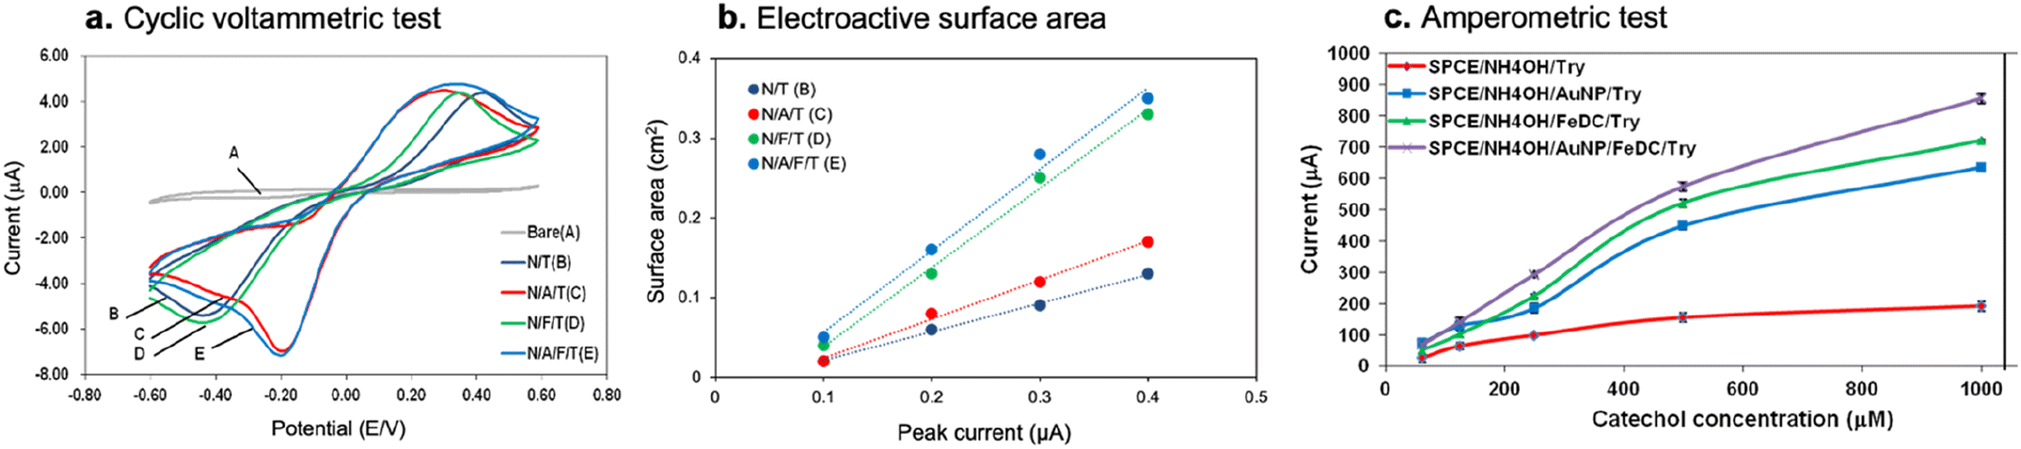 | ||
| Fig. 6 CV, electroactive surface area and amperometric determinations of the modified electrodes of SPCE strips. CV was performed and recorded in 125 μM catechol (10 U per strip tyrosinase, 50 mM phosphate buffer, pH 6.5) at a scan rate of 100 mV s−1 (a). Symbol A, bare SPCE strips; B, SPCE strips modified with NH4OH and tyrosinase 10 U per strip; C, SPCE strips modified with NH4OH, AuNPs, and tyrosinase; D, SPCE strips modified with NH4OH, FeDC, and tyrosinase; E, SPCE strips modified with NH4OH, AuNPs, FeDC, and tyrosinase. The electroactive surface area (ECSA) and amperometric measurements were recorded using catechol (125 μM) as the substrate (b and c, respectively). The potential of the electrode was −200 mV, and the electrolyte was 50 mM phosphate buffer (pH 6.5). The response currents of the SPCE modified with 10 U per strip tyrosinase (SPCE/NH4OH/Tyr), SPCE modified with AuNPs and tyrosinase (SPCE/NH4OH/AuNP/Tyr), SPCE modified with FeDC and tyrosinase (SPCE/NH4OH/FeDC/Tyr), and SPCE modified with AuNPs, FeDC, and tyrosinase (SPCE/NH4OH/AuNP/FeDC/Tyr) were detected. Each value represents the mean ± standard deviation (SD) derived from five independent detections. | ||
No peak was observed for the bare SPCE (curve “A” in Fig. 6(a)), at which the CV displayed a low background current. Thus, the response of SPCE/NH4OH/Try (curve “B”) was attributed to the redox reaction of the electroactive center of the immobilized tyrosinase. The SPCE/NH4OH/AuNPs/Try, SPCE/NH4OH/FeDC/Try and SPCE/NH4OH/AuNPs/FeDC/Try (curve “C,” “D” and “E” in Fig. 6(a), respectively) also show the response of tyrosinase. In the tyrosinase-immobilized SPCE in the presence of AuNPs, SPCE/NH4OH/AuNPs/Try, and the cathodic peak current of the CV was 5.2 times larger than that of SPCE/NH4OH/Try. The results showed that AuNPs played an important role in the tyrosinase–SPCE strip. AuNPs are favourable for the orientation of the tyrosinase molecule on the electrode surface, which can more conveniently realize direct electron transfer between the enzyme and the electrode.31–33 Simultaneously, the distance between the enzyme and the electrode surface could be shortened by AuNPs, thus improving electron transfer.34
When the catechol solution was added to the SPCE/NH4OH/FeDC/Try strip, the FeDC mediator enhanced the voltammetric response of the analyte, especially in the cathodic domain. This indicates a possible beneficial effect of adding a mediator to the tyrosinase–SPCE strip to improve its performance. Indeed, the cathodic peak of the CV curve recorded in a catechol solution using an FeDC/Try configuration on SPCE (curve “D”) was more intense compared to that observed in the absence of mediator deposit (curve “B”). This beneficial effect of the mediator on the response of the tyrosinase–SPCE strip is explained by the reaction involved in the biodetection process. Additionally, the SPCE/NH4OH/Try strip (curve “B” in Fig. 6(a)) showed a couple of redox peaks at −591 mV and +489 mV, and SPCE/NH4OH/FeDC/Try (curve “D” in Fig. 6(a)) showed greater responses at potential of −416 mV and +269 mV. This indicates that the use of a mediator helps lower the detection potential to the level.
3.3 Amperometric test of tyrosinase-modified electrodes
The measurements of the electroactive surface area (ECSA) and amperometric tyrosinase–SPCE strips was illustrated in Fig. 6(b) and (c), respectively. The measurement principle of the amperometric tyrosinase–SPCE strips is illustrated in Fig. 6(b). Tyrosinase was immobilized on the SPCE by cross-linking with NH4OH. Catechol is a substrate for the tyrosinase biosensor system. The enzymatically formed o-quinone could be electrochemically reduced back to catechol at a low applied potential; thus, a reduction current was detected. The electron transfer pathway occurring at the tyrosinase–SPCE strip can be assumed to be in the following reaction sequence:| Catechol + tyrosinase (red) → o-quinone + tyrosinase (ox) |
| Tyrosinase (ox) + FeDC (Fe2+) → tyrosinase (red) + FeDC (Fe3+) |
| FeDC (Fe3+) + e− → FeDC (Fe2+) |
3.4 Optimization of the tyrosinase–SPCE strips
The electrochemical reaction was affected by the pH, phosphate buffer concentration, enzyme loading, and substrate concentration.Enzyme activity is highly pH-dependent and the optimum pH for an enzymatic assay must be determined empirically. The effect of pH on tyrosinase activity on the tyrosinase–SPCE strip was investigated using phosphate buffer (50 mM at pH 4.5 and 8.0). The result shows the optimum response was obtained at pH 6.5. The optimum response in the condition at pH 6.5 is not a sharp maximum; instead, a high activity region (>80%) between is pH 6 and 8. The response decreases severely at pH less than 6.0, due to enzyme denaturation at that pH. This agrees well with the optimum pH range reported for free enzymes,36 and also with the fact that tyrosinase immobilization via weak interaction in various matrices was not found to drastically alter its pH response characteristics.37 Based on these results, pH 6.5 was chosen as the optimum pH and used for further studies.
The influence of the phosphate buffer concentration from 20 mM to 80 mM on the amperometric response was also investigated. The results showed that the optimum response was obtained using 50 mM phosphate buffer. This proved that tyrosinase catalytic activity was slightly affected. Hence, 50 mM phosphate buffer was chosen as the electrolyte for subsequent experiments.
The detection of inhibitors with tyrosinase–SPCE strips is based on the assumption that tyrosinase activity is inhibited and the response current is decreased.38 The decrease in tyrosinase activity was equivalent to the decrease in the concentration of tyrosinase. Three different concentrations of tyrosinase were used, indicating that half of the enzyme activity was inhibited by the inhibitor. The effect of the catechol concentration on the response of the tyrosinase biosensor was investigated. At low substrate concentrations, the immobilized enzyme was not saturated with the substrate, and the results showed that the decreasing response current was not obvious, whereas the tyrosinase concentration was reduced to half. However, at high substrate concentrations, the enzyme was saturated with substrate. There was a noticeable difference in the response currents at high substrate concentrations. Finally, 250 μM catechol was selected for further studies on tyrosinase–SPCE strips.
3.5 Applications of tyrosinase–SPCE strips
The enzymatically formed o-quinone can be electrochemically reduced to catechol at a low applied potential, and the reduction current can be measured. Under the optimized working conditions (50 mM phosphate buffer and 4 U per strip tyrosinase at pH 6.5), the amperometric response at −200 mV was obtained as a function of the catechol concentration in the tyrosinase–SPCE strip. A stationary signal was observed at high catechol concentrations (>1000 μM), indicating the saturation of the immobilized enzyme (data not shown). Tyrosinase has been extensively used in the development of biosensors for the detection of phenolic, organophosphorus, and carbamate compounds.10,39 Inhibition of tyrosinase activity has been utilized in the detection of toxic pollutants in environmental and biological samples.40–42 In this study, we investigated the application of tyrosinase–SPCE strips in clinical diagnosis for the detection of GSH.The enzymatically formed o-quinone can be electrochemically reduced to catechol at a low applied potential. GSH reacts with o-quinone derived from the reaction of catechol and tyrosinase to produce the GSH–quinone complex, which reduces the quantity of o-quinone and reaction current. Under optimized working conditions (50 mM phosphate buffer and 4 U per strip tyrosinase at pH 6.5), the amperometric response at −200 mV was obtained as a function of GSH concentration in the tyrosinase–SPCE strip. The curve illustrated in Fig. 7 shows the relationship over the investigated concentration range. A linear relationship from 31.25 to 500 μM with a linear regression equation of y = 0.1154x + 14.257, R2 = 0.9625 (p < 0.001), where y represents the response inhibition (%) and x represents the GSH concentration (μM). The calibration curve of GSH was used for the subsequent detection of GSH concentration in the sample. The detection limit of developed tyrosine-SPCE strips is approximate 35 μM (signal-to-noise ratio, S/N > 3).
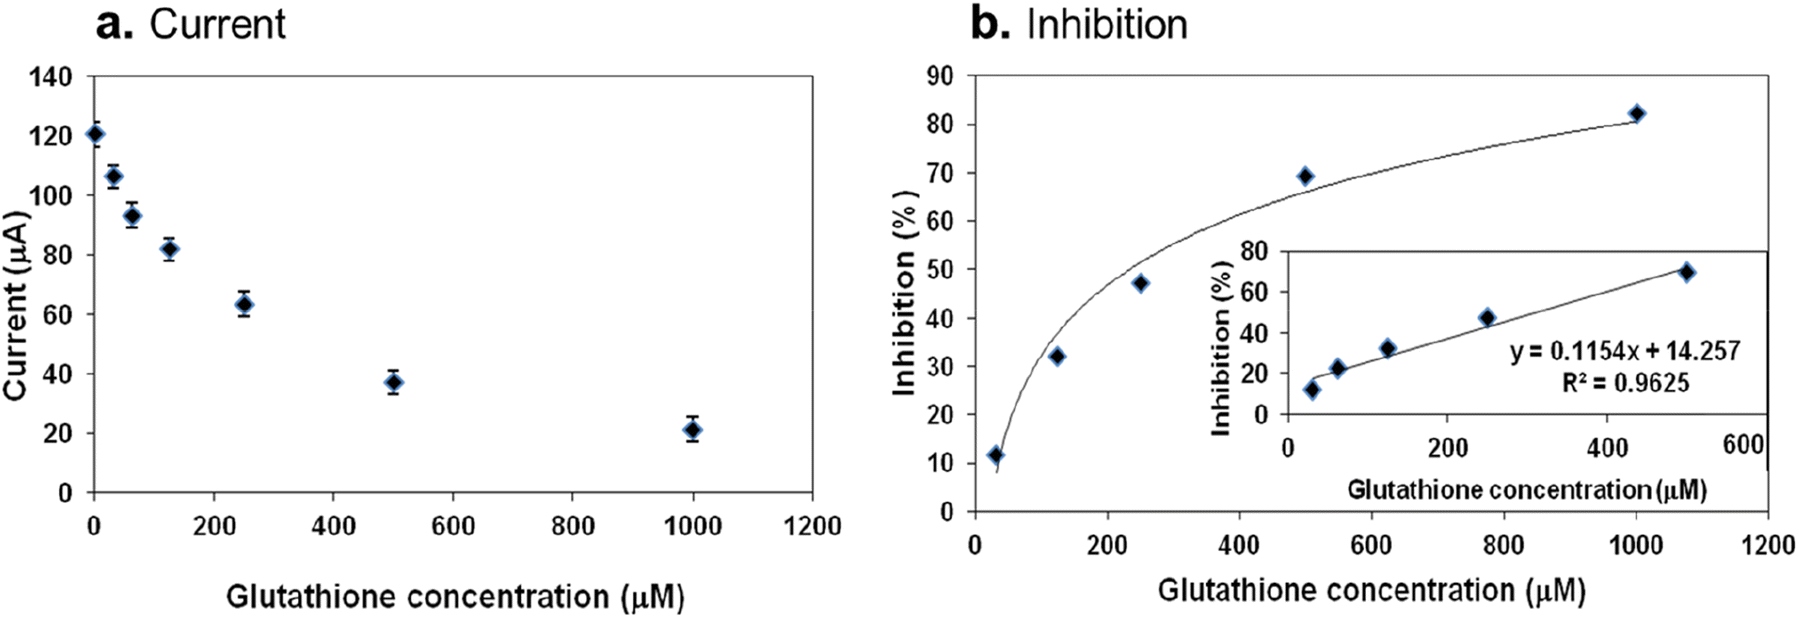 | ||
| Fig. 7 Detection of reduced glutathione (GSH) concentration using the tyrosinase–SPCE strips. (a) Different concentrations of GSH mixed volume equally with 125 μM catechol was obtained for the detection of GSH by the tyrosinase–SPCE strips. The potential was −200 mV and the electrolyte was 4 U per strip tyrosinase, 50 mM phosphate buffer, pH 6.5. (b) The inhibition (%) was calculated and the inset figure shows the linear relationship ranging from 31.25 μM to 500 μM of GSH with regression equation, y = 0.1154x + 14.257, R2 = 0.9625 (p < 0.001), where y represents the response inhibition (%) and x represents the GSH concentration (μM). Each value was derived from five independent detections and error bars indicate SD. | ||
3.6 Studies of the selectivity, recovery and stability of the tyrosinase SPCE strips
The selectivity of the sensor should be tested as we are aiming to apply this sensor to measure glutathione in real samples which contain some biologically important biomolecules and thiols that may interfere with glutathione determination.43 Fig. 8 shows the interfering molecules ascorbic acid, cysteine and methionine and that commonly present with.44 The influence of these molecules was examined under the optimum conditions. Briefly, the percentage change in the current response of 31.25 μM glutathione was measured after addition of up to 2-folds of ascorbic acid, methionine, and cysteine. The influence of these biomolecules on glutathione determination was measured as a percent recovery from the original current of glutathione prior to the addition of interferents. Table 1 shows the interference results for ascorbic acid, cysteine, and methionine. From these results, it is obvious that the maximum contribution percent of ascorbic acid, methionine, and cysteine not exceeds 8.2%, 6.5%, and 4.9%, respectively.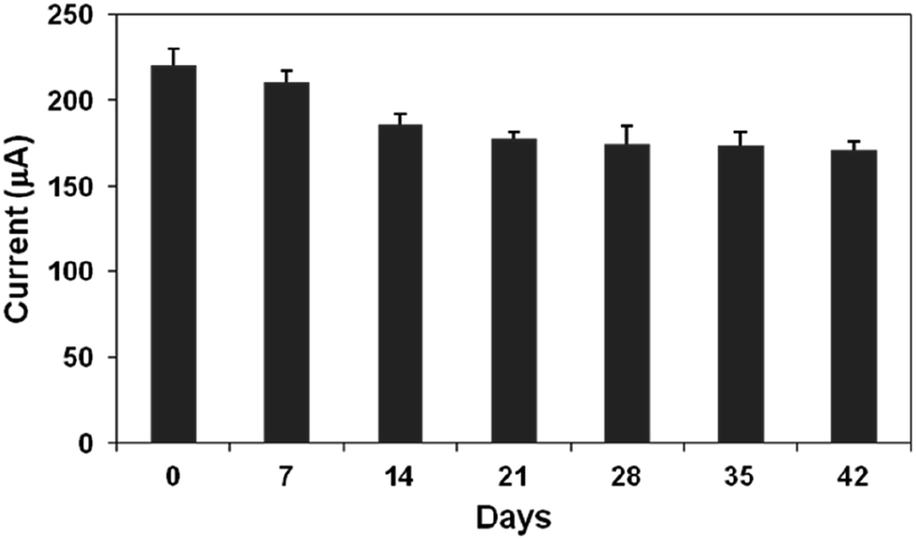 | ||
| Fig. 8 Storage stability of the modified-SPCE strips. The modified-SPCE strips were stored at 4 °C for the test of storage stability. The results of amperometric test showed that the NH4OH/AuNPs/FeDC SPCE stored at 4 °C for 42 days were still stable and active. Values derived from five independent detections and error bars indicated SD (n = 5). | ||
The tyrosinase SPCE strips were studied by storage at 4 °C condition for the test of storage stability. As seen from Fig. 8, a slow decrease of response might be attributed to the gradual deactivation of the immobilized tyrosinase. However, the prepared tyrosinase SPCE strips were stored at 4 °C; it retained 80.3% of its initial response at 6th week. It means that the developed tyrosinase strips were stable for several weeks if they are stored at 4 °C.
For the recovery test, the concentration of 31.25, 62.5, 125, and 250 μM of GSH were added to the mouse plasma from the same individual and then detected by SPCE strips. The results of GSH recovery and RSD were calculated and summarized in Table 2.
| GSH added (μM) | GSH detected (μM) | GSH foundb (μM) | RSD (%) | GSH recovery (%) |
|---|---|---|---|---|
| a The conditions for detection of GSH were 250 μM catechol, tyrosinase concentration of 2 U per strip and 50 mM PB, pH 6.5. Each group were from three independent measurements (n = 3).b The GSH detected – back group GSH (i.e., in the sample without GSH addition). | ||||
| 0 (blank) | 4.5 ± 0.4 | |||
| 31.25 | 36.8 ± 3.7 | 32.3 | 12 | 105 |
| 62.5 | 64.6 ± 6.0 | 60.1 | 9 | 96 |
| 125 | 118.7 ± 10.2 | 114.2 | 8 | 91 |
| 250 | 231.8 ± 18.9 | 227.3 | 8 | 91 |
3.7 Detection of GSH in real sample of plasma and tissue homogenates
GSH is reduced by suppressing the substrate recycling process between tyrosinase and the electrode. The response current for catechol was significantly diminished in the presence of GSH. GSH reacts with o-quinone to produce the GSH–quinone complex.45 The production of the GSH–quinone complex reduces the quantity of o-quinone and decreases the reduction current. Notably, the analytical range of GSH was dependent on the concentration of the substrate. The concentration of tyrosinase-produced o-quinone was directly related to the applied catechol concentration. The proportion of GSH-blocked o-quinones decreases with increasing o-quinone concentrations.46 In this study, the conditions for detection of GSH were 250 μM catechol and tyrosinase concentration of 2 U per strip, and the concentration of GSH was evaluated by the inhibition percentage. The inhibition percentage versus the concentration of GSH for the GSH calibration plot is shown in Fig. 9.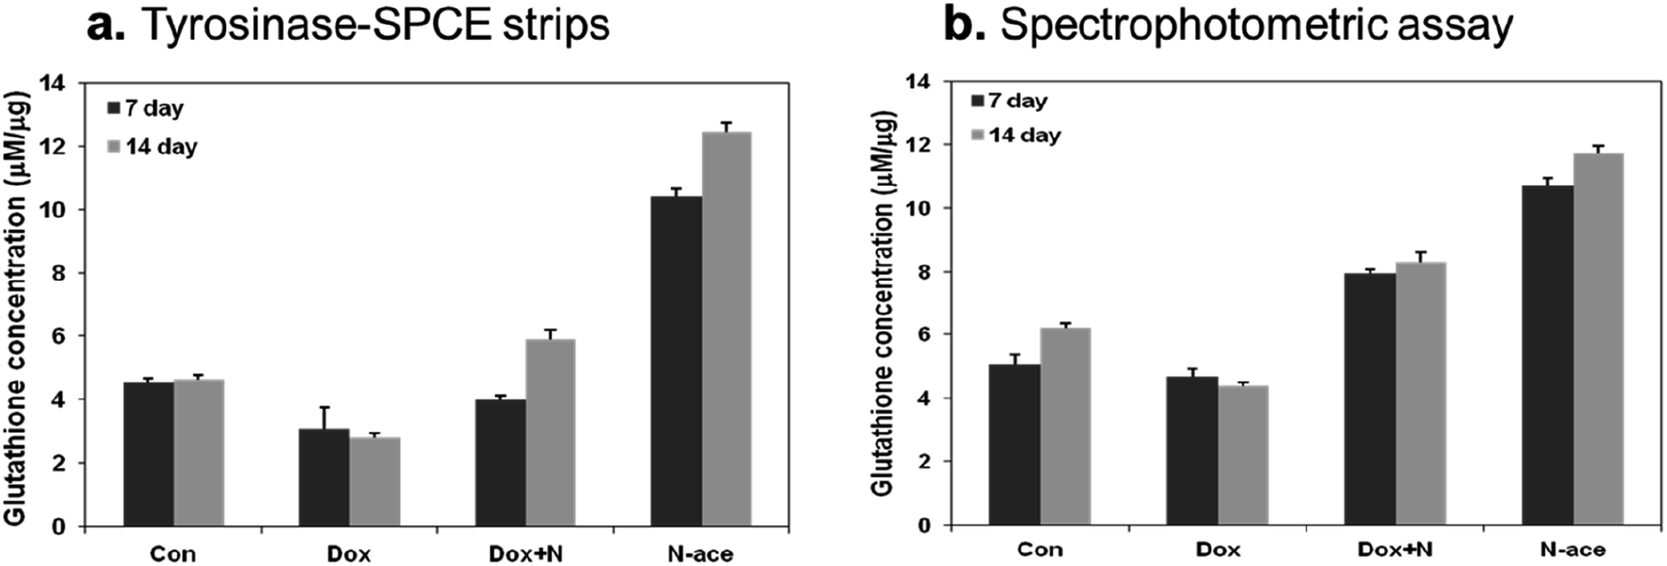 | ||
| Fig. 9 Detection of in vivo GSH level in plasma using the tyrosinase–SPCE strips and spectrophotometric assay. (a) Detection of GSH in the plasma of C57BL/6JNarl mice using the tyrosinase–SPCE strips. The detective condition is 125 μM catechol, 4 U per strip tyrosinase, 50 mM phosphate buffer, pH 6.5. (b) Detection of GSH in the plasma of mice using spectrophotometric assay. Mice in the group “Con” severed as control and were administered normal saline. Animals in the group “Dox” were i.p. injection of doxorubicin 14 mg kg−1. Animals in group “Dox + N” were treated orally with N-acetylcysteine 100 mg kg−1 body weight and i.p. injection of doxorubicin 14 mg kg−1. Animals in group “N-ace” were orally treated with N-acetylcysteine 100 mg kg−1 body weight. GSH levels in the plasma of C57BL/6JNarl mice were measured at 7 or 14 days. Each bar indicates mean ± SD (n = 5). | ||
In animal experiments, NAC was used to increase GSH levels47,48 and doxorubicin was used to decrease GSH levels.49,50 Twenty C57BL/6JNarl male mice were randomly assigned to four groups with five animals per group. Mice in the control group served as controls and were administered with normal saline. Animals in the doxorubicin-treated (Dox) group were i.p. injection with doxorubicin 14 mg kg−1. Animals in the Dox + N group were treated with NAC 100 mg kg−1 body weight and i.p. injected with doxorubicin (14 mg kg−1). Animals in the N-ace group were orally administered NAC (100 mg kg−1 body weight). Fig. 9(a) shows the results of GSH concentration obtained from whole blood samples of C57BL/6JNar mice in the four groups using the amperometric method, and the results were compared with those obtained using the spectrophotometric method, which is usually used for GSH detection. After 7 or 14 day treatment, we found that GSH levels decreased when the mice were treated with doxorubicin. In C57BL/6JNar mice treated with 100 mg kg−1 NAC, GSH levels were significantly increased by approximately 2.8 folds as compared with saline-treated mice. These data indicate that high-dose NAC resulted in a significant increase in blood GSH level, and NAC could alleviate the adverse effects of GSH reduction induced by doxorubicin. Plasma GSH can be detected rapidly and precisely measured using our amperometric tyrosinase–SPCE strip.
GSH levels in the mice were also detected using a spectrophotometric assay. The results showed that the effects of doxorubicin and NAC administration were similar to those of the tyrosinase–SPCE strips (Fig. 9(b)). The GSH levels in the homogenates of the mouse heart, lung, and liver were also detected using tyrosinase–SPCE strips. In C57BL/6JNarl mice fed 100 mg kg−1 NAC for 7 days, GSH levels were significantly increased by 1.14-, 2.17 and 1.54 folds in the heart, lung, and liver, respectively, compared with saline-treated mice. These data indicate that high-dose NAC resulted in a significant increase in organ GSH levels, and NAC supplementation could decrease the adverse effects induced by doxorubicin.
4 Conclusions
In this work, we introduced a method for the fabrication of tyrosinase–SPCE strips based on drop-coating tyrosinase on SPCE strips modified with AuNPs. The AuNPs in the biosensing interface not only offer a friendly environment to immobilize tyrosinase but also efficiently improve the electron transfer between the analyte and electrode surface.We investigated the application of tyrosinase–SPCE strips in vivo diagnosis. According to the results, we proved that the tyrosinase–SPCE strips modified with AuNPs have potential for forward applications in the detection of clinical samples as well as in the detection of plasma and organ GSH as a parameter of body health and disease diagnosis in humans. The linear range of GSH detection by the tyrosinase–SPCE trip was 31.25 to 500 μM, with a detection limit of 35 μM. We demonstrated the use of AuNPs as signal enhancers on tyrosinase–SPCE strips. In this system, the modification of AuNPs in tyrosinase-immobilized SPCE was successfully applied in an amperometric system with real-time monitoring of the current response.
In conclusion, disposable amperometric biosensors, tyrosinase- and AuNP-modified SPCE strips, were fabricated. The strips were successfully utilized to detect GSH levels in biological samples in real time, indicating that the strips have potential for use in the detection of GSH for clinical diagnosis.
Author contributions
Yu-Ling Sun: conceptualization, writing – original draft, writing – review and editing. Hui-Fang Chang: writing – original draft, investigation. Ping-Hsuan Chiang: conceptualization, writing – original draft, investigation. Meng-Wei Lin: writing – original draft, writing – review and editing, investigation. Cheng-Han Lin: investigation. Chiu-Mei Kuo: Tzu-Ching Lin: review and editing. Chih-Sheng Lin: conceptualization, writing – review and editing, supervision.Conflicts of interest
There are no conflicts to declare.Acknowledgements
This work was supported by the grants of NSTC 110-2312-B-A49-001-MY3, NSTC 112-2811-B-A49-501, NSTC 112-2811-B-A49-503, NSTC 112-2321-B-A49-018, NSTC 112-2321-B-A49-005, and NSTC 112-2221-E-033-013-MY3 from the National Science and Technology Council (NSTC), Taiwan. This work was also financially supported by the “Centre for Intelligent Drug Systems and Smart Bio-devices (IDS2B)” from The Featured Areas Research Centre Program within the framework of the Higher Education Sprout Project of the National Yang Ming Chiao Tung University and Ministry of Education (MOE), Taiwan.References
- M. Hanko, Ľ. Švorc, A. Planková and P. Mikuš, Anal. Chim. Acta, 2019, 1062, 1–27, DOI:10.1016/j.aca.2019.02.052.
- X. Sun, F. Guo, Q. Ye, J. Zhou, J. Han and R. Guo, Biosensor, 2023, 13, 16, DOI:10.3390/bios13010016.
- F. Nuhu, A. Gordon, R. Sturmey, A. M. Seymour and S. Bhandari, Molecules, 2020, 25, 4196, DOI:10.3390/molecules25184196.
- A. Thiel, A. K. Weishaupt, M. M. Nicolai, K. Lossow, A. P. Kipp, T. Schwerdtle and J. Bornhorst, J. Chromatogr. B: Anal. Technol. Biomed. Life Sci., 2023, 1225, 123742, DOI:10.1016/j.jchromb.2023.123742.
- G. L. Ellman, K. D. Courtney, V. Andres Jr and R. M. Feather-Stone, Biochem. Pharmacol., 1961, 7, 88–95, DOI:10.1016/0006-2952(61)90145-9.
- G. Sinko, M. Calić, A. Bosak and Z. Kovarik, Anal. Biochem., 2007, 370, 223–227, DOI:10.1016/j.ab.2007.07.023.
- Y. Shi, H. Zhang, Z. Yue, Z. Zhang, K. S. Teng, M. J. Li, C. Yi and M. Yang, Nanotechnology, 2013, 24, 375501, DOI:10.1088/0957-4484/24/37/375501.
- T. Wang, Z. Wang, J. Hao, J. Zhao, J. Guo, A. Gao and Y. Y. Song, Anal. Biochem., 2023, 95, 13242–13249, DOI:10.1021/acs.analchem.3c02340.
- S. W. Moon, J. Y. Kim, S. H. Lee, S. Y. Im, G. Lee and K. H. Park, ACS Omega, 2023, 8, 31870–31879, DOI:10.1021/acsomega.3c03396.
- M. Tudorache and C. Bala, Anal. Bioanal. Chem., 2007, 388, 565–578, DOI:10.1007/s00216-007-1293-0.
- M. Saleem, H. Yu, L. Wang, Zain-ul-Abdin, H. Khalid, M. Akram, N. M. Abbasi and J. Huang, Anal. Chim. Acta, 2015, 876, 9–25, DOI:10.1016/j.aca.2015.01.012.
- A. Reda, S. A. El-Safty, M. M. Selim and M. A. Shenashen, Biosens. Bioelectron., 2021, 185, 113237, DOI:10.1016/j.bios.2021.113237.
- S. J. Park, T. A. Taton and C. A. Mirkin, Science, 2002, 295, 1503–1506, DOI:10.1126/science.1067003.
- S. Guo and E. Wang, Anal. Chim. Acta, 2007, 598, 181–192, DOI:10.1016/j.aca.2007.07.054.
- M. Turino, N. Pazos-Perez, L. Guerrini and R. A. Alvarez-Puebla, RSC Adv., 2022, 12, 845, 10.1039/d1ra07959j.
- Y. R. Mejıa and N. K. R. Bogireddy, RSC Adv., 2022, 12, 18661, 10.1039/d2ra02663e.
- Y. Xiao, F. Patolsky, E. Katz, J. F. Hainfeld and I. Willner, Science, 2003, 299, 1877–1881, DOI:10.1126/science.1080664.
- A. Persoons and T. Verbiest, PhD thesis, Katholieke Universiteit Leuven, Belgium, 2006.
- H. F. Chang, Y. L. Sun, F. Y. Yeh, I. H. Tseng, C. C. Chang and C. S. Lin, RSC Adv., 2018, 8, 29013–29021, 10.1039/c8ra04322a.
- I. A. Quintel, B. G. de los Reyes, C. S. Lin and V. C. H. Wu, Front. Microbiol., 2019, 10, 1138, DOI:10.3389/fmicb.2019.01138.
- Y. H. Lin, S. H. Chen, Y. C. Chuang, Y. C. Lu, T. Y. Shen, C. A. Chang and C. S. Lin, Biosens. Bioelectron., 2008, 23, 1832–1837, DOI:10.1016/j.bios.2008.02.030.
- F. Y. Yeh, T. Y. Liu, I. H. Tseng, C. W. Yang, L. C. Lu and C. S. Lin, Biosens. Bioelectron., 2014, 61, 336–343, DOI:10.1016/j.bios.2014.05.007.
- P. H. Chiang, MSc thesis, National Chiao Tung University, Taiwan, 2012.
- M. Anderson, Methods Enzymol., 1985, 13, 548–555, DOI:10.1016/s0076-6879(85)13073-9.
- G. Frens, Nat. Phys. Sci., 1973, 241, 20–22, DOI:10.1038/physci241020a0.
- M. Lisicki, B. Cichocki, J. K. Dhont and P. R. Lang, J. Chem. Phys., 2012, 136, 204704, DOI:10.1063/1.4720069.
- A. Bonanni, M. Pumerab and Y. Miyahara, Phys. Chem. Chem. Phys., 2011, 13, 4980–4986, 10.1039/c0cp01209b.
- D. K. Kim, Y. J. Hwang, C. Yoon, H. O. Yoon, K. S. Chang, G. Lee, S. Lee and G. R. Yi, Phys. Chem. Chem. Phys., 2015, 17, 20786–20794, 10.1039/c5cp02968f.
- S. H. Chen, Y. C. Chuang, Y. C. Lu, H. C. Lin, Y. L. Yang and C. S. Lin, Nanotechnology, 2009, 20, 215501, DOI:10.1088/0957-4484/20/21/215501.
- Y. C. Chuang, J. C. Li, S. H. Chen, Y. U. Liu, C. H. Kuo, W. T. Huang and C. S. Lin, Biomaterials, 2010, 31, 6087–6095, DOI:10.1016/j.biomaterials.2010.04.026.
- S. Liu, D. Leech and H. Ju, Anal. Lett., 2003, 36, 1–19, DOI:10.1081/al-120017740.
- S. Timur, D. Odaci, A. Dincer, F. Zihnioglu and A. Telefoncu, Talanta, 2008, 74, 1492–1497, DOI:10.1016/j.talanta.2007.09.026.
- F. M. Fartas, J. Abdullah, N. A. Yusof, Y. Sulaiman and M. I. Saiman, Sensors, 2017, 17, 1132, DOI:10.3390/s17051132.
- A. V. Bounegru and C. Apetrei, Nanomaterials, 2023, 13, 760, DOI:10.3390/nano13040760.
- Z. Pengcheng and Z. Yuyuan, RSC Adv., 2017, 7, 26392–26400, 10.1039/c7ra04204c.
- Y. İ. Doğaç and M. Teke, Prep. Biochem. Biotechnol., 2013, 43, 750–765, DOI:10.1080/10826068.2013.773340.
- D. Shan, C. Mousty, S. Cosnier and S. Mu, Electroanalysis, 2003, 15, 1506–1512, DOI:10.1002/elan.200302740.
- Y. F. Fan, S. X. Zhu, F. B. Hou, D. F. Zhao, Q. S. Pan, Y. W. Xiang, X. K. Qian, G. B. Ge and P. Wang, Biosensors, 2021, 11, 290, DOI:10.3390/bios11080290.
- Y. D. de Albuquerque and L. F. Ferreira, Anal. Chim. Acta, 2007, 596, 210–221, DOI:10.1016/j.aca.2007.06.013.
- T. H. Huang, T. Kuwana and A. Warsinke, Biosens. Bioelectron., 2002, 17, 1107–1113, DOI:10.1016/s0956-5663(02)00105-7.
- E. Kuusk and T. Rinken, Enzyme Microb. Technol., 2004, 234, 657–661, DOI:10.1016/j.enzmictec.2004.03.004.
- A. Amine, H. Mohammadi, I. Bourais and G. Palleschi, Biosens. Bioelectron., 2006, 21, 1405–1423, DOI:10.1016/j.bios.2005.07.012.
- M. N. Abbas, A. A. Saeed, M. B. Ali, A. Errachid, N. Zine, A. Baraket and B. Singh, J. Solid State Electrochem., 2019, 23, 1129–1144, DOI:10.1007/s10008-018-04191-4.
- M. N. Abbas, A. A. Saeed, B. Singh, A. A. Radowan and E. Dempsey, Anal. Methods, 2015, 7, 2529–2536, 10.1039/c4ay02944e.
- J. L. Bolton, T. L. Dunlap and B. M. Dietz, Food Chem. Toxicol., 2018, 120, 700–707, DOI:10.1016/j.fct.2018.07.050.
- Y. Teng, X. Jia, J. Li and E. Wang, Anal. Chem., 2015, 87, 4897–4902, DOI:10.1021/acs.analchem.5b00468.
- I. Medved, M. J. Brown, A. R. Bjorksten, K. T. Murphy, A. C. Petersen, S. Sostaric, X. Gong and M. J. McKenna, J. Appl. Physiol., 2004, 97, 1477–1485, DOI:10.1152/japplphysiol.00371.2004.
- B. Schmitt, M. Vicenzi, C. Garrel and F. M. Denis, Redox Biol., 2015, 6, 198–205, DOI:10.1016/j.redox.2015.07.012.
- J. H. Doroshow, R. S. Esworthy and F. F. Chu, Biochem. Biophys. Rep., 2019, 21, 100709, DOI:10.1016/j.bbrep.2019.100709.
- B. Y. Shen, C. Chen, Y. F. Xu, J. J. Shen, H. M. Guo, H. F. Li, X. N. Li, D. Kang, Y. H. Shao, Z. P. Zhu, X. X. Yin, L. Xie, G. J. Wang and Y. Liang, Acta Pharmacol. Sin., 2019, 40, 699–709, DOI:10.1038/s41401-018-0158-8.
Footnote |
| † These authors contributed equally. |
| This journal is © The Royal Society of Chemistry 2024 |