DOI:
10.1039/D3RA08225C
(Paper)
RSC Adv., 2024,
14, 4861-4870
Bimetal doped Cu–Fe-ZIF-8/g-C3N4 nanocomposites for the adsorption of tetracycline hydrochloride from water
Received
1st December 2023
, Accepted 16th January 2024
First published on 6th February 2024
Abstract
Bimetal doped Cu–Fe-zeolitic imidazole framework-8 (ZIF-8)/graphitic carbon nitride (GCN) (Cu–Fe-ZIF-8/GCN) nanocomposites were prepared via one-pot and ion-exchange methods. The main influencing factors, such as adsorbent concentration, TC concentration, initial pH, and coexisting ions, were evaluated in detail. Due to the suitable pore structures and the presence of multiple interactions on the surface, the nanocomposite showed a high adsorption capacity up to 932 mg g−1 for tetracycline hydrochloride (TC), outperforming ZIF-8 by 4.8 times. The adsorption kinetics and adsorption isotherm were depicted in good detail using pseudo-second-order kinetic and Langmuir models, respectively. Thermodynamic calculation revealed that the adsorption of the nanocomposite under experimental conditions was a spontaneous heat absorption process, and was primarily driven by chemisorption. After four cycles of use, the nanocomposite retained 87.2% of its initial adsorption capacity, confirming its high reusability and broad application prospects in removing tetracycline-type pollutants from wastewater.
Introduction
Antibiotics can effectively inhibit and kill bacteria and are widely used in medicine and animal husbandry. Tetracycline hydrochloride (TC) is a common antibiotic that has strong hydrophilicity and structural stability, and it cannot be easily degraded or removed by conventional sewage treatment plants. Therefore, TC is difficult to biodegrade in natural environments.1,2 The accumulation of antibiotics in the ecosystem over a long period of time has led to significant negative impacts on the ecological environment as well as on human health.3 A variety of approaches for TC removal from water have been widely investigated, such as biological degradation,4 membrane-based treatment,5 photocatalytic degradation,6 chemical oxidation,7 and adsorption.8 In particular, adsorption is believed to be a prospective approach for tetracycline hydrochloride (TC) removal due to its great efficiency, cost-effectiveness, simplicity, and green features.9 Hence, developing adsorbents with good performance and low cost for treating TC pollution has significant application prospects.
Graphitic carbon nitride (g-C3N4 or GCN) is nitrogen-containing carbon material with a planar structure and excellent stability. The functional groups (–NH2/–NH–/![[double bond, length as m-dash]](https://www.rsc.org/images/entities/char_e001.gif) N–) and π-conjugated planar layered structure10 of GCN are capable of providing abundant active sites for adsorbing organic pollutants. For example, GCN has been found to effectively adsorb methylene blue,11 and it also shows good potential in removing heavy metal ions.12 In practical applications, however, pure GCN has not been widely used for adsorption due to its low specific surface area (SSA).13
N–) and π-conjugated planar layered structure10 of GCN are capable of providing abundant active sites for adsorbing organic pollutants. For example, GCN has been found to effectively adsorb methylene blue,11 and it also shows good potential in removing heavy metal ions.12 In practical applications, however, pure GCN has not been widely used for adsorption due to its low specific surface area (SSA).13
Metal–organic frameworks (MOFs), typically made up of self-assembled metal ions and organic ligands, are a highly representative crystalline porous material.14 Zeolite imidazole framework-8 (ZIF-8), which has a three-dimensional zeolite structure, is typically synthesized with Zn2+ and 2-methylimidazole.15
ZIF-8 provides the advantages of simple synthesis, remarkable stability, abundant pore structure, and certain adsorption capacity.16,17 Choi et al. investigated the thermal stability of ZIF-8 and found that the material can be structurally stabilized at 300 °C in an inert atmosphere.18 Li et al. prepared ZIF-8 with a large specific surface area of 1158.2 m2 g−1, but the adsorption capacities of tetracycline and oxytetracycline were only 122 mg g−1 and 149.3 mg g−1, respectively.19 Obviously, such low adsorption performance greatly limits the application of ZIF-8.
Recently, several studies have demonstrated that doping transition metals into MOFs can enhance their adsorption capacity. Han et al. showed that UiO-66 could significantly enhanced the adsorption capacity of organic dyes after Ti-doping.20 Yang et al. showed that doping Cu, Co, Ni, and other elements into ZIF-8 can effectively enhance its adsorption performance toward dibenzothiophene.21 The pore structure of MOFs can be improved by transition metal doping modification. Moreover, the doped metal can provide valence electrons that allow the material to better combine the target contaminant, thereby providing more adsorption active sites.22 The ease of transition metal doping modification and the ability to significantly improve the performance of doped materials make MOFs more promising for environmental remediation applications.
In this work, a bimetal doped adsorbent, namely, Cu–Fe-ZIF-8/GCN nanocomposite, was prepared using the one-pot and ion-exchange methods for the adsorption performance study of TC. This nanocomposite is designed to improve the adsorption properties by utilizing the abundant adsorbing sites of GCN and the synergistic effect of bimetal doping. The main influencing factors evaluated were adsorbent concentration, TC concentration, initial pH of the solution, and coexisting ions. An understanding of the adsorption mechanism of the nanocomposite was also discussed.
Experimental
Materials
Cyanuric acid was purchased from Meryer (Shanghai, China). Zinc acetate dihydrate was purchased from Xilong Scientific (Guangdong, China). Copper nitrate trihydrate was purchased from 3AChem (Shanghai, China). Ferric nitrate nonahydrate was purchased from Fuchen (Tianjin, China). Ethanol was purchased from Keao (Tianjin, China). TC was purchased from Aladdin (Shanghai, China). 2-Methylimidazole was purchased from Kemiou (Tianjin, China). The above reagents were analytically pure and were not subjected to secondary treatment.
Synthesis of GCN
The synthesis of GCN was a thermal polycondensation process, which is a common technique to produce this type of material. Typically, melamine powder was put in a quartz boat (with a lid) and loaded into a muffle furnace. The powder was heated at a speed of 4 °C min−1 until it reached 550 °C, and it was then maintained at that temperature for 4 h.
Synthesis of ZIF-8
In 25 mL deionized (DI) water, ZnAc2·2H2O (1.1 g) and 2-methylimidazole (3.28 g) were separately dissolved to form two solutions. After that, the solutions were mixed using a magnetic stirrer for 2 h, followed by leaving the mixture to settle for 1 day. Finally, the as-prepared white precipitate was washed with water by centrifugation and dried thoroughly at 70 °C.
Synthesis of ZIF-8/GCN
ZnAc2·2H2O (1.1 g) was dissolved with DI water (25 mL), while GCN (0.1 g) was dispersed in the solution to form a milky white suspension by ultrasonication for 1 h. Thereafter, 2-methylimidazole (3.28 g) and DI water (25 mL) was mixed thoroughly to give a crystal-clear solution. The organic solution was mixed with the sonicated suspension. The mixture was then agitated with a magnetic stirrer for 2 h and allowed to rest for 1 day. In the end, the resulting powder was centrifuged and dried thoroughly at 70 °C.
Synthesis of Fe-ZIF-8/GCN
GCN (0.1 g), ZnAc2·2H2O (1.04 g), and Fe(NO3)3·9H2O (0.1 g) were mixed with DI water (25 mL). The mixture was then treated with sonic waves for 1 h to make it well dispersed. Subsequently, 2-methylimidazole (3.28 g) was mixed with another DI water (25 mL). After finishing the above work, the two solutions were stirred together for 2 h, and then left to settle for 1 d. To obtain the product, the fully reacted suspension was subjected to centrifugation, followed by washing and drying at 70 °C.
Synthesis of Cu–Fe-ZIF-8/GCN
Cu(NO3)2·3H2O (0.24 g) and Fe-ZIF-8/GCN (0.5 g) were mixed with 40 mL of ethanol and stirred for 1 h. The mixture was then subjected to centrifugation, washing, and drying (70 °C, 8 h) to yield the Cu–Fe-ZIF-8/GCN.
Evaluation of coexisting ions
In order to evaluate the effect of coexisting ions on the adsorption of TC by Cu–Fe-ZIF-8/GCN, NaCl, NaNO3, and Na2SO4 were selected as additives. Specifically, the additive (0.01 mol) was added to 100 mL of TC solution (100 mg L−1). After fully dissolved, the solution was poured into a conical flask containing 10 mg of adsorbent, and the adsorption capacity was measured after stirring for 7 h.
Characterization
The samples were characterized using various techniques. Scanning electron microscope (SEM, Regulus 8100, Hitachi, Japan) was used to investigate the micromorphology, and energy dispersive X-ray spectrometry (EDS) elemental mapping was conducted simultaneously. Wide-angle XRD (X'pert pro MPD, Panalytical, UK) was employed to determine the material structure. The N2 adsorption/desorption studies were carried out by a fully automated ultra-microporous specific surface area and pore size detector (BSD-PM1, BSD Instrument, China) following the Brunauer–Emmett–Teller (BET) method. FT-IR spectroscopy (Nicolet iS-10, Thermo Fisher Scientific, USA) was recorded to analyze the molecular structure. X-ray photoelectron spectroscopy (XPS) was utilized to obtain the elemental composition of the adsorbent surface. The XPS analysis was conducted using equipment from Thermo Fisher Scientific (USA). The surface potential of the adsorbent at various pH was investigated by NanoZS90 (Malvern Instruments, UK). The TC calibration curve obtained with an ultraviolet-visible (UV-vis) spectrophotometer (L8, INESA Analytical Instrument, China) was referred to obtain the concentrations of the TC solutions.
Adsorption experiment
To prevent the photodegradation of TC, the adsorption experiment was performed in the dark. Typically, the adsorbent and TC solution were mixed in a sealed conical flask and stirred at 100 rpm for 7 h. TC samples (3 mL) were taken at several set time points during the adsorption process and filtered with a disposable needle filter. Afterwards, the clear solution obtained by filtration was tested at 357 nm by a UV-vis spectrophotometer. Finally, the TC concentrations were calculated according to the TC calibration curve. According to the eqn (1), the amount of the absorbed TC can be obtained:| |
 | (1) |
where qt is the adsorption capacity (mg g−1) at a time t (min); C0 is the initial concentration of TC (mg L−1); Ct is the concentration of TC (mg L−1) at a given time t (min); V is the volume of the TC solution (L); and m is the mass of the adsorbent (mg). The initial pH of the adsorption system was adjusted to 4 with 0.1 mol per L NaOH solution or HCl solution.
Results and discussion
Characterizations of adsorbents
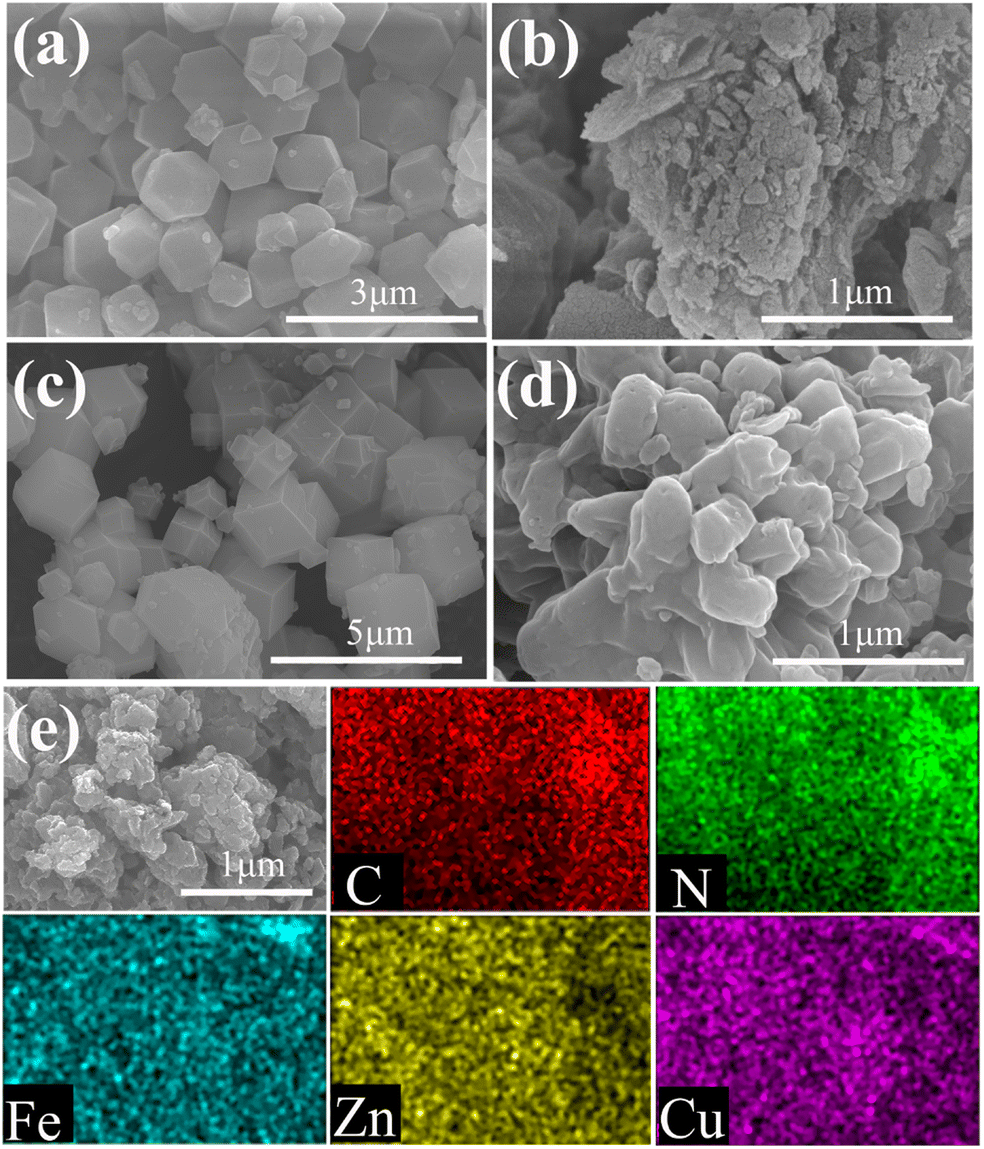
SEM studies were performed to determine the morphology and elemental distribution of the samples. It is evident from Fig. 1a that ZIF-8 presents a regular morphology of diamond-shaped dodecahedron and its average diameter is about 1 μm. Fig. 1b shows the typical layered and closely stacked morphology of GCN. In Fig. 1c, the ZIF-8 and GCN composite exhibits an enlarged particle size and surface wrinkles. In Fig. 1d, Fe-ZIF-8/GCN appears as a smooth block-like agglomerate owing to the agglomeration of GCN. This was caused by the incomplete growth of the crystal due to the Fe doping, resulting in the substitution of several Zn ions during the synthesis.23 The morphology of Cu–Fe-ZIF-8/GCN, shown in Fig. 1e, shows a relatively rougher surface than that of Fe-ZIF-8/GCN. Moreover, a large number of small Cu–Fe-ZIF-8/GCN particles were formed, which might be owing to the substitution of several Fe and Zn ions by Cu.24 The EDS element mapping shown in Fig. 1e indicates that the element mapping of Cu, Fe, Zn, N is evenly distributed, which means that Cu and F elements are indeed doped into the ZIF-8 crystals.
 |
| | Fig. 1 SEM images of (a) ZIF-8, (b) GCN, (c) ZIF-8/GCN, (d) Fe-ZIF-8/GCN, and (e) Cu–Fe-ZIF-8/GCN, and their corresponding elemental mapping images (C, N, Fe, Zn, Cu). | |
Fig. 2a shows that the peaks of ZIF-8 and GCN are well in accordance with the previous reports, thereby validating the successful preparation of ZIF-8 and GCN.25,26 The GCN exhibits two peaks located at 2θ = 13° and 27.4°, representing its (100) and (002) crystal planes, respectively.27 The ZIF-8 pattern shows peaks at 7.3°, 10.4°, 12.7°, 14.7°, 16.4°, 18°, 22.1°, 24.5°, 26.6°, and 29.7°, representing (011), (002), (112), (022), (013), (222), (114), (233), (134), and (044) crystal faces, respectively.28 ZIF-8/GCN possesses the main characteristic peaks of both GCN and ZIF-8. However, owing to the low GCN content, the intensities of its characteristic peaks are weak.29 In the XRD peaks of Fe-ZIF-8/GCN, the intensity of the characteristic peaks belonging to ZIF-8 was significantly reduced, which may be owing to the crystal-structure defects caused by the coordination of Fe ions with 2-methylimidazole.30 For Cu–Fe-ZIF-8/GCN, it has an increase in the intensities of XRD characteristic peaks belonging to ZIF-8. This is because Cu ions have ion sizes and coordination properties that are similar to those of Zn ions in tetrahedral coordination, and the doped material has a crystal structure that is quite similar with ZIF-8.31
 |
| | Fig. 2 (a) XRD patterns and (b) FT-IR spectra of different adsorbents. | |
In Fig. 2b, a broad peak is observed near 3400 cm−1 for ZIF-8, which can be attributed to the stretching vibration of –OH groups. The peak at 2930 cm−1 corresponds the stretching vibration of C–H bonds in the imidazole rings, whereas the peak at 1580 cm−1 indicates the stretching vibration of CN in GCN and ZIF-8. In addition, the peaks around 1150 and 993 cm−1 are associated with stretching vibrations of C–N in imidazole rings and N–H-related peaks, respectively. The peak positions mentioned above agree with those reported in the literature.32 In GCN, the bending vibration of triazine rings is represented by the peak at 808 cm−1, while the C–N heterocycles can be confirmed by the peaks at 1640 and 1240 cm−1.33 All nanocomposites exhibit the characteristic peaks of ZIF-8 and GCN, indicating that ZIF-8 and GCN are present in these composites. Moreover, the spectra of the three nanocomposites are very similar, indicating that doping of small amounts of Cu and Fe ions has little effect on the molecular structure of the ZIF-8.
In Fig. 3a, all the products display type IV isotherms and H3 hysteresis loops, implying their mesoporosity.17 In Fig. 3b, it is demonstrated that metal doping can significantly increase the proportion of mesoporous structure. The data in Table 1 indicate that compounding ZIF-8 with GCN results in a slight reduction of the parameters. As for ZIF-8/GCN, although the SSA was slightly reduced by the Fe ion doping, the increase in pore size is advantageous for the improvement of the adsorption performance.34 After Cu ion doping, the parameters of Fe-ZIF-8/GCN are significantly increased. This phenomenon has been reported in several studies.17,35,36 It can be concluded that the doping of ZIF-8 with metal ions may result in the formation of structural defects due to the changes of the chemical coordination environment, which are beneficial for increasing the adsorption active sites and enlarging the pores of the material. Overall, Cu–Fe-ZIF-8/GCN not only has the largest pore size, but also exhibits relatively higher SSA and pore volume indicating that this material has good potential for the application of TC adsorption.
 |
| | Fig. 3 (a) N2 adsorption–desorption isotherms and the (b) pore size distribution curves of different adsorbents. | |
Table 1 The structural parameters of different samples
| Samples |
SSA (m2 g−1) |
Pore size (nm) |
Pore volume (cm3 g−1) |
| ZIF-8 |
975 |
2.38 |
0.58 |
| ZIF-8/GCN |
937 |
2.32 |
0.54 |
| Fe-ZIF-8/GCN |
327 |
3.12 |
0.26 |
| Cu–Fe-ZIF-8/GCN |
519 |
3.39 |
0.44 |
The XPS survey scan presented in Fig. 4a provide evidence that Fe-ZIF-8/GCN and Cu–Fe-ZIF-8/GCN have achieved successful doping of Fe and bimetal doping of Cu and Fe, respectively. Fig. 4b shows the C 1s XPS spectrum of the nanocomposite which has three peaks at 284.7, 286.0, 288.1 eV for CC/C–C, CN, and N–CN, respectively.17,37 It is noted that the N–CN here belongs to the sp2 hybridized carbon in the aromatic ring of GCN. In Fig. 4c, all three samples have peaks of pyrrole nitrogen (Py-N) and pyridine nitrogen (Pyr-N). In particular, the Py-N and Pyr-N peaks of the Cu–Fe-ZIF-8/GCN sample are located at 398.7 eV and 401.0 eV, respectively. In comparison with ZIF-8, Fe-ZIF-8/GCN shows a Fe–N peak at 399.2 eV and Cu–Fe-ZIF-8/GCN exhibits a Fe/Cu–N peak at 399.5 eV.38 Fig. 4d shows the peaks of Zn 2p3/2 and Zn 2p1/2 at 1021.7 and 1044.9 eV, respectively, indicating that there is Zn2+ in Cu–Fe-ZIF-8/GCN, Fe-ZIF-8/GCN and ZIF-8.39 Fig. 4e illustrates the Fe 2p XPS spectrum of Cu–Fe-ZIF-8/GCN. The LMM Auger peak of Cu (located near 719.5 eV) overlaps with the Fe 2p peak, which cause an abnormal increase of the Fe 2p peak near that position.40 The characteristic peaks of Fe2+ 2p3/2, Fe2+ 2p1/2, Fe3+ 2p3/2 and Fe3+ 2p1/2 are centered at 711.7, 722.6, 714.3 and 726.2 eV, respectively. In addition, two satellite peaks can be observed at 718.6 and 733.0 eV. The results reveal the existence of Fe2+ and Fe3+ in Cu–Fe-ZIF-8/GCN.41 In Fig. 4f, two separate peaks observed at 934.5 and 954.5 eV correspond to the Cu2+ 2p3/2 and Cu2+ 2p1/2 peaks, respectively. The broad satellite peaks at 941.5–943.6 eV and 962.3 eV are other typical features of Cu2+. These results indicate that copper primarily exists in the form of Cu2+ in Cu–Fe-ZIF-8/GCN.42
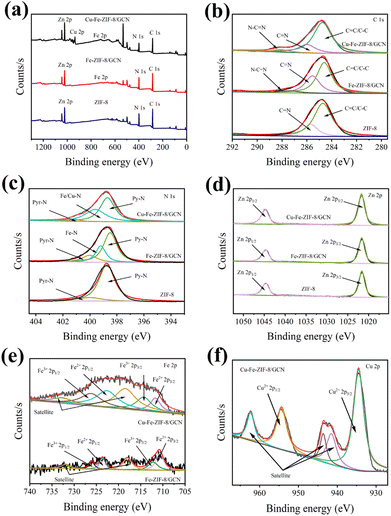 |
| | Fig. 4 (a) XPS survey scan, XPS spectra of (b) C 1s, (c) N 1s, (d) Zn 2p, (e) Fe 2p, and (f) Cu 2p in ZIF-8, Fe-ZIF-8/GCN and Cu–Fe-ZIF-8/GCN. | |
Effect of the adsorbent concentration
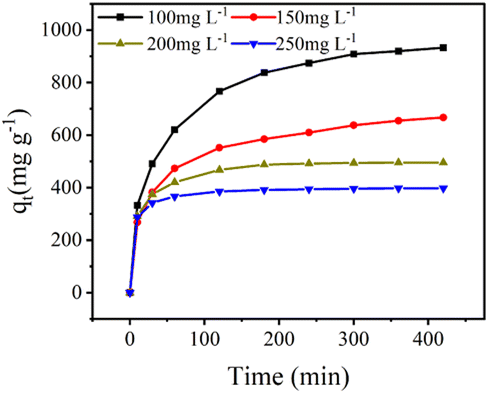
It is well-known that the study of the effect of adsorbent concentration is important for understanding and optimizing the adsorption process. Fig. 5 presents experiment results of the single-factor experiment for Cu–Fe-ZIF-8/GCN adsorbent concentration. As the concentration of Cu–Fe-ZIF-8/GCN goes from 100 to 250 mg L−1, the adsorption capacity drops sharply from 932 to 397 mg g−1. This is because at lower adsorbent concentration, the adsorption sites can be used more effectively, thus improving the adsorption efficiency.43 Furthermore, increasing the adsorbent concentration can significantly reduce the time to equilibrium.
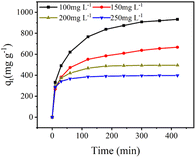 |
| | Fig. 5 Adsorption capacities of Cu–Fe-ZIF-8/GCN at different adsorbent concentrations (initial TC concentration = 100 mg L−1; pH = 4; T = 298.15 K). | |
Effect of the TC concentration
TC concentration is one of the crucial factors that directly affect the amount of active adsorption sites on Cu–Fe-ZIF-8/GCN, thereby influencing the adsorption rate and capacity. In Fig. 6, the adsorption capacity of the nanocomposites increases gradually with the TC concentration. This is due to the enhanced mass transfer driving force at higher TC concentrations.44 In addition, the adsorption rates of the nanocomposite are at their highest in the first 10 min, and gradually decrease afterwards. This is mainly caused by the decline of diffusion driving force and the reduction of active sites on the adsorbent.
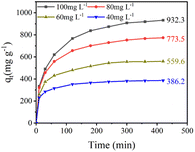 |
| | Fig. 6 Adsorption capacities of Cu–Fe-ZIF-8/GCN at different TC concentrations (adsorbent concentration = 100 mg L−1; pH = 4; T = 298.15 K). | |
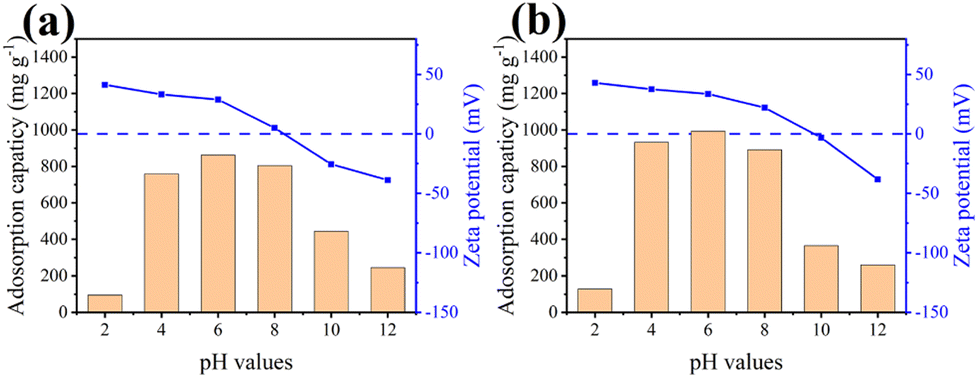
Effect of initial pH value
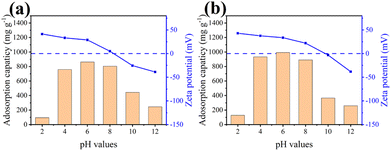
In general, the initial pH value can have a significant impact on the adsorption capacity since it can affect the surface charge of both adsorbents and adsorbates.45 Fig. 7 shows the adsorption capacities and zeta potentials of Fe-ZIF-8/GCN and Cu–Fe-ZIF-8/GCN at different initial pH values. The zeta potentials of the two samples possess the same trend, but it is obvious that Cu–Fe-ZIF-8/GCN has a higher zeta potential. The introduction of Cu ions could be the reason for the changes in the material's adsorption properties. This is because Cu ions can alter the overall charge distribution of the material, which affects its surface charge characteristics.46
 |
| | Fig. 7 Adsorption capacities and zeta potentials of (a) Fe-ZIF-8/GCN and (b) Cu–Fe-ZIF-8/GCN at different initial pH values (initial TC concentration = 100 mg L−1; adsorbent concentration = 100 mg L−1; T = 298.15 K). | |
According to the literature, TC molecules at pH < 3.3, 3.3 < pH < 7.7 and pH > 7.7 are positively charged, electrically neutral and negatively charged, respectively.35,47,48 Considering this fact, most TC molecules possess positive charges at a pH of 2. Simultaneously, the surface of Cu–Fe-ZIF-8/GCN also carries positive charges. As a result, the adsorption capacity becomes significantly lower because of the repulsive electrostatic forces between Cu–Fe-ZIF-8/GCN and TC molecules. At a pH of 4, most TC molecules are uncharged, which eliminates the additional electrostatic repulsion and significantly enhances the adsorption capacity of adsorbent. When the pH increases to 6, a significant portion of TC cations become neutral or even negatively charged, while the adsorbent surface remains positively charged, resulting in the maximum adsorption capacity. As the pH increases to 8, more TC molecules are negatively charged. Therefore, although the potential of Cu–Fe-ZIF-8/GCN decreases, it can maintain a relatively high adsorption capacity. When the pH is 10, the Cu–Fe-ZIF-8/GCN with negative charges pushes away the TC molecules that are also negatively charged, resulting in a much lower adsorption capacity. At a pH of 12, the potential of Cu–Fe-ZIF-8/GCN is much lower and all TC ions are negatively charged, which causes the adsorption capacity to drop even more.
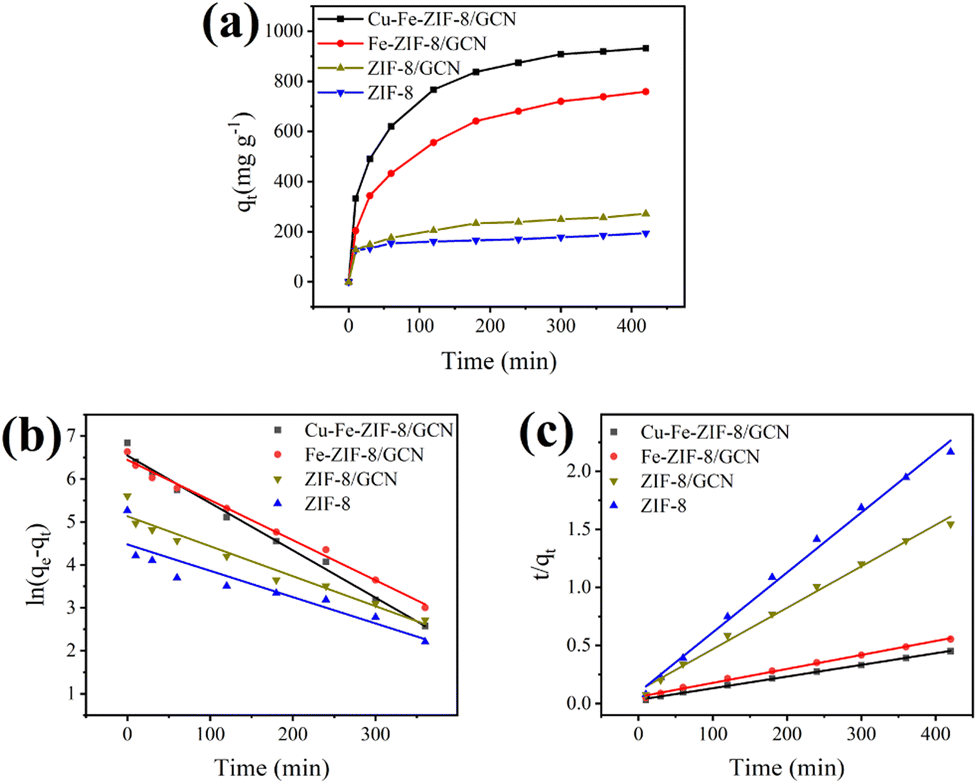
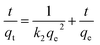
Adsorption kinetics
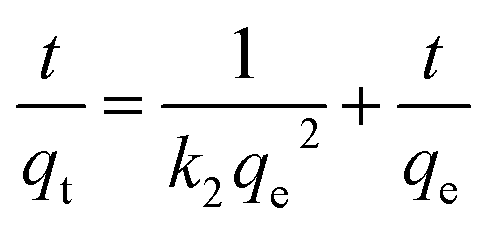
In order to gain insights into the adsorption mechanism, the adsorption kinetics of different adsorbents were investigated. Fig. 8a shows the adsorption equilibrium curves of several adsorbents. The equilibrium adsorption capacities of ZIF-8, ZIF-8/GCN, Fe-ZIF-8/GCN, and Cu–Fe-ZIF-8/GCN are 193, 272, 759, and 932 mg g−1, respectively. This study employed two widely known models, i.e., the pseudo-first-order kinetic model and the pseudo-second-order kinetic model, to explore the relationship between adsorption capacity and time. The following equations are used for these two models:| |
ln(qe − qt) = ln![[thin space (1/6-em)]](https://www.rsc.org/images/entities/char_2009.gif) qe − k1t qe − k1t
| (2) |
| |
 | (3) |
where t is the adsorption time; qe is the equilibrium adsorption capacity (mg g−1); and k1 and k2 represent the rate constants (min−1) of the pseudo-first-order kinetic and pseudo-second-order kinetic models, respectively.
 |
| | Fig. 8 (a) Adsorption equilibrium curves of TC on different adsorbents and the results fitted by (b) pseudo-first-order kinetic and (c) pseudo-second-order kinetic models (initial TC concentration = 100 mg L−1; adsorbent concentration = 100 mg L−1; pH = 4; T = 298.15 K). | |
The fitting results are presented in Fig. 8b and c, while Table 2 lists the corresponding fitting parameters that were calculated. There are two symbols in this table that need to be clarified: qe,exp is the experimentally measured adsorption equilibrium capacity (mg g−1), while qe,cal is the adsorption equilibrium capacity (mg g−1) calculated from the model. The higher accuracy of the pseudo-second-order kinetic model, as deduced from the regression coefficients (R2) obtained from the two models, is indicative of the occurrence of chemisorption during the adsorption process.49
Table 2 Kinetics model parameters for the adsorption of TC using ZIF-8, ZIF-8/GCN, Fe-ZIF-8/GCN and Cu–Fe-ZIF-8/GCN
| Sample |
qe,exp (mg g−1) |
Pseudo-first-order kinetic model |
Pseudo-second-order kinetic model |
| qe,cal (mg g−1) |
k1 (min−1) |
R2 |
qe,cal (mg g−1) |
k2 (g mg−1 min−1) |
R2 |
| ZIF-8 |
194 |
194 |
0.006 |
0.821 |
194 |
2.8 × 10⁻⁴ |
0.993 |
| ZIF-8/GCN |
272 |
170 |
0.007 |
0.945 |
280 |
1.1 × 10⁻⁴ |
0.993 |
| Fe-ZIF-8/GCN |
759 |
608 |
0.009 |
0.991 |
833 |
2.5 × 10⁻⁵ |
0.996 |
| Cu–Fe-ZIF-8/GCN |
932 |
693 |
0.011 |
0.989 |
1000 |
3.2 × 10⁻⁵ |
0.999 |
Adsorption isotherm
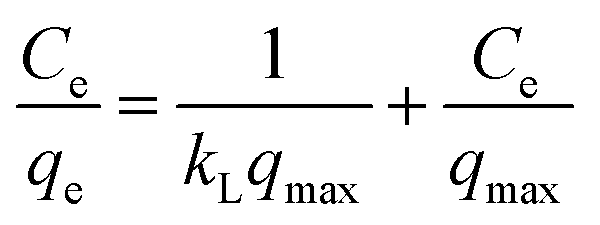
To interpret the adsorption mechanism of TC molecules on Cu–Fe-ZIF-8/GCN, their interactions need to be studied by the adsorption isotherm. For this purpose, we measured the equilibrium adsorption capacity and adsorption equilibrium concentration of TC on Cu–Fe-ZIF-8/GCN at different temperatures and different pollutant concentrations. The obtained data were subjected to Freundlich, Langmuir, and Temkin models, which correspond to eqn (4)–(6), respectively:50| |
 | (4) |
| |
 | (5) |
where Ce is the equilibrium concentration of TC (mg L−1); n is the constant related to the nonuniformity of the adsorbent surface; kF is the Freundlich constant; kL is the Langmuir constant related to the adsorption energy; qmax is the maximum adsorption capacity (mg g−1); kT is the Temkin constant; and f is the Temkin correlation constant (L mg−1).
In Fig. 9a, qe tends to rise with the elevated Ce, but the increasing trend diminishes gradually afterwards. Fig. 9b–d are the fitted results for the three models, while Table 3 presents the calculated parameters for the different models. The Langmuir model (R2 = 0.996,0.987,0.991) clearly provides a more accurate fit than the other two models. This finding suggests that TC primarily undergoes single-layer adsorption on Cu–Fe-ZIF-8/GCN.51
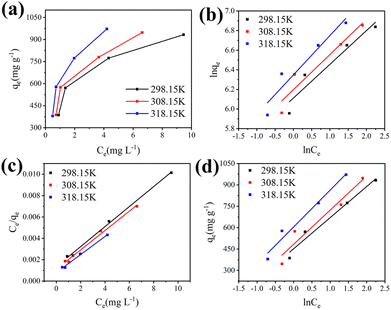 |
| | Fig. 9 (a) Adsorption isotherm of TC on Cu–Fe-ZIF-8/GCN at different temperature and the results fitted by (b) Freundlich, (c) Langmuir and (d) Temkin models. | |
Table 3 Isotherm parameters of TC adsorption on Cu–Fe-ZIF-8/GCN
| T (K) |
Freundlich |
Langmuir |
Temkin |
| kF |
n |
R2 |
qm (mg g−1) |
kL |
R2 |
f (L mg−1) |
kT |
R2 |
| 298.15 |
450.97 |
2.907 |
0.887 |
1070 |
0.685 |
0.996 |
7.949 |
218.18 |
0.961 |
| 308.15 |
491.26 |
2.789 |
0.880 |
1104 |
0.816 |
0.987 |
7.534 |
239.48 |
0.909 |
| 318.15 |
571.13 |
2.492 |
0.886 |
1181 |
1.000 |
0.991 |
10.369 |
258.71 |
0.963 |
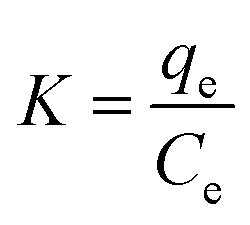
Thermodynamic analysis
Thermodynamic analysis provides another perspective to understand the process of TC adsorption on Cu–Fe-ZIF-8/GCN. The three thermodynamic parameters involved here are standard Gibbs free energy (ΔG0, kJ mol−1), standard enthalpy change (ΔH0, kJ mol−1), and standard entropy change (ΔS0, J mol−1 K−1), which can be determined by the following equations:| |
 | (7) |
| | |
ΔG0 = −RTlnK
| (8) |
| |
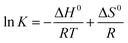 | (9) |
where T is the temperature (K), and R is the molar gas constant (8.314 J mol−1 K−1).
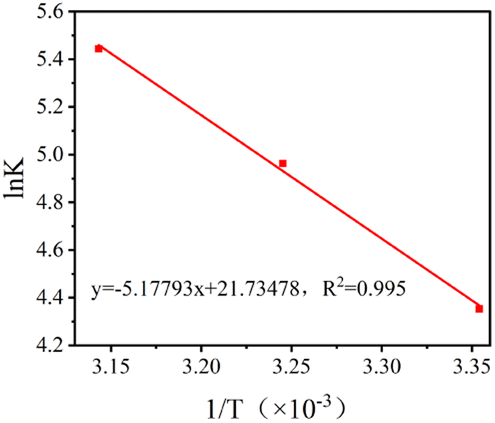
The value of K (i.e., adsorption isotherm constant) is obtained by substituting the adsorption equilibrium amount and adsorption equilibrium concentration of the material at different temperatures into eqn (7). The ΔG0 at different temperatures can then be calculated by using eqn (8). A Van't Hoff plot, as shown in Fig. 10, can be obtained by linearly fitting lnK to the data points of 1/T, and then ΔG0 and ΔH0 can be obtained by combining the intercepts and slopes of the plot with eqn (9).
 |
| | Fig. 10 The Van't Hoff's plot of Cu–Fe-ZIF-8/GCN. | |
Based on the data provided in Table 4, it can be concluded that the adsorption process is spontaneous since all the ΔG0 values are negative. Furthermore, the positive value of ΔH0 suggests that the adsorption of TC on Cu–Fe-ZIF-8/GCN is an endothermic reaction. Notably, the calculated ΔH0 is quite large (>40 kJ mol−1), which further confirms the dominant role of chemisorption.52 According to the Gibbs equation, the increase in temperature favors spontaneous adsorption since both ΔH0 and ΔS0 are positive. This means that the adsorption efficiency can be effectively enhanced by increasing the temperature.53
Table 4 The thermodynamic parameters of TC adsorption on Cu–Fe-ZIF-8/GCN
| ΔG0 (kJ mol−1) |
ΔH0 (kJ mol−1) |
ΔS0 (J mol−1K−1) |
R2 |
| 298.15 K |
308.15 K |
318.15 K |
| −10.84 |
−12.64 |
−14.45 |
43.05 |
180.70 |
0.996 |
Possible adsorption mechanisms
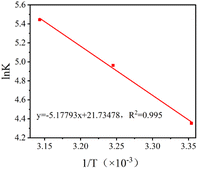
To further comprehend the adsorption mechanism, a molecular structure perspective was discussed to show the advantages of TC adsorption on Cu–Fe-ZIF-8/GCN. A graphical illustration of the adsorption mechanism is presented in Fig. 11. The imidazole rings belonging to ZIF-8 and aromatic structures of GCN can form π–π interactions with the benzene rings of TC.10,17,19 The abundant hydroxyl groups in TC molecules are able to form hydrogen bonds with the N-donor sites of Cu–Fe-ZIF-8/GCN.19,54 In addition, the doped Fe ions and Cu ions may form more coordination bonds with the N and O atoms in TC molecules.17,55 The discussion in Section 3.4 reveals that the surface charges of TC and Cu–Fe-ZIF-8/GCN vary with the pH. As a result, the adsorption capacity of the nanocomposites is affected, highlighting the significant role of electrostatic forces. Overall, the synergy effects of π–π interaction, hydrogen bond, coordination bonds and electrostatic force are the key factors that govern the adsorption process, and contribute significantly to the outstanding performance of the nanocomposites.
 |
| | Fig. 11 Possible mechanism for TC adsorption onto Cu–Fe-ZIF-8/GCN. | |
Effect of coexisting ions
A variety of ions are commonly present in wastewater along with TC, which highlights the importance of evaluating their influence on the adsorption performance of an adsorbent. Fig. 12 shows that Cu–Fe-ZIF-8/GCN can adsorb TC with capacities of 1004, 946, and 876 mg g−1 in the presence of Cl−, SO42−, and NO3−, respectively. For comparison purposes, the adsorption capacity of Cu–Fe-ZIF-8/GCN without any coexisting ions is 932 mg g−1. The findings reveal that Cl− and SO42− can slightly promote the adsorption, while NO3− weakly inhibits the adsorption. To summarize, the presence of the three ions only slightly impacts the adsorption capacity of the nanocomposite, resulting in a variation of less than 8% in the adsorption capacity. Therefore, the nanocomposite has a strong resistance to ion interference and good environmental adaptability.
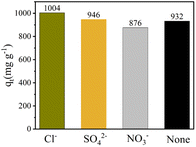 |
| | Fig. 12 Adsorption capacities of Cu–Fe-ZIF-8/GCN in the presence of different coexisting ions (initial TC concentration = 100 mg L−1; adsorbent concentration = 100 mg L−1; pH = 4; T = 298.15 K). | |
Reusability of Cu–Fe-ZIF-8/GCN
From a cost perspective, the reusability of Cu–Fe-ZIF-8/GCN is an important indicator of its feasibility for large-scale application. The desorption of the used Cu–Fe-ZIF-8/GCN is successively washed with NaOH solution (0.01 mol L−1) and DI water. The Fig. 13 shows that even after four cycles, the adsorption capacity of Cu–Fe-ZIF-8/GCN remains at 87.2% of its initial value, indicating its excellent reusability. The decreases of adsorption capacity may be due to the blockage of the pore structure and the reduction of adsorption sites.56,57 Therefore, Cu–Fe-ZIF-8/GCN has a great potential for TC adsorption.
 |
| | Fig. 13 Reusability of Cu–Fe-ZIF-8/GCN for TC adsorption (initial TC concentration = 100 mg L−1; adsorbent concentration = 100 mg L−1; pH = 6; T = 298.15 K). | |
Adsorption capacities of reported adsorbents for TC removal
Table 5 provides a summary of TC adsorption capacities on reported adsorbents. It is evident that Cu–Fe-ZIF-8/GCN exhibits the best adsorption capacity among the adsorbents, demonstrating its superior potential for TC removal.
Table 5 Adsorption capacities of reported adsorbents
| Adsorbent |
Adsorption capacity (mg g−1) |
Ref. |
| Ag/BN |
358 |
58 |
| SFZIF-8 |
433 |
59 |
| UiO-66/ZIF-8/PDA@CA beads |
291 |
60 |
| NHPC |
518 |
61 |
| ZIF-8/PDA/PAN fibers |
478 |
16 |
| Fe3O4@ZIF-8@ZIF-67 |
356 |
62 |
| ZIF-67/PANI/RCA |
410 |
63 |
| ZrO2 nanoparticles |
526 |
64 |
| Cu–Fe-ZIF-8/GCN |
932 |
This work |
Conclusions
In conclusion, bimetal doped Cu–Fe-ZIF-8/GCN was fabricated through a combination of one-pot and ion exchange methods. After doping with Fe ions, Cu ions and GCN, ZIF-8 showed no obvious changes in its crystal structure and its TC adsorption capacity was significantly improved. The adsorption kinetic analysis of Cu–Fe-ZIF-8/GCN proved that the adsorption of TC followed the pseudo-second-order kinetic model, implying the major role of chemisorption. In addition, Langmuir model provided a suitable fit for the adsorption isotherm of Cu–Fe-ZIF-8/GCN, which suggests that TC molecules is mainly adsorbed as a monolayer on the nanocomposite. According to the thermodynamic analysis, the TC adsorption on Cu–Fe-ZIF-8/GCN was an exothermic and spontaneous process, which further confirms the dominance of chemisorption. Cu–Fe-ZIF-8/GCN showed a remarkable adsorption capacity of 932 mg g−1, which was 4.8 times larger than that of ZIF-8. The excellent performance of the nanocomposite is highly related to two aspects. Firstly, the optimized pore structures of Cu–Fe-ZIF-8/GCN ensure effective diffusion of TC molecules. Secondly, multiple interactions between Cu–Fe-ZIF-8/GCN and TC molecules, such as coordination bonds, electrostatic interactions, hydrogen bonds and π–π interactions, enhance the TC adsorption capacity of the nanocomposite. In addition, Cu–Fe-ZIF-8/GCN exhibited good resistance to ionic interference (no more than 8% change) and reusability (87.2% adsorption capacity after four cycles). These excellent properties suggest that Cu–Fe-ZIF-8/GCN has good potential applications in wastewater treatment.
Author contributions
Yibo Zhao: conceptualization, supervision, funding acquisition, writing – review & editing. Yueyang Li: methodology, validation, formal analysis, data curation, visualization, writing – original draft. Lu Chang: methodology. Wenjing He: supervision, funding acquisition. Keling Liu: formal analysis. Minjie Cui: resources. Shengnan Wang: investigation. Yujia Zhao: investigation. Xinyu Tan: writing – review & editing.
Conflicts of interest
There are no conflicts to declare.
Acknowledgements
The authors would like to express their sincere gratitude to the financial support from the following institutions: the Open-end Funds of Jiangsu Key Laboratory of Function Control Technology for Advanced Materials, Jiangsu Ocean University [grant number jsklfctam202002], the Postgraduate Research & Practice Innovation Program of Jiangsu Ocean University [grant number KYCX2022-01], the Open Project of Jiangsu Institute of Marine Resources Development (grant number JSIMR202108), and Jiangsu Qing Lan Project.
Notes and references
- W. Chen, J. Huang, Z.-C. He, X. Ji, Y.-F. Zhang, H.-L. Sun, K. Wang and Z.-W. Su, Sep. Purif. Technol., 2021, 277, 119461 CrossRef CAS.
- T. Cheng, W. Gao, H. Gao, S. Wang, Z. Yi, X. Wang and H. Yang, Mater. Res. Bull., 2021, 141, 111350 CrossRef CAS.
- X.-W. Zhang, F. Wang, C.-C. Wang, P. Wang, H. Fu and C. Zhao, Chem. Eng. J., 2021, 426, 131927 CrossRef CAS.
- S. Shao and X. Wu, Crit. Rev. Biotechnol., 2020, 40, 1010–1018 CrossRef CAS PubMed.
- R. Abejón, M. De Cazes, M. Belleville and J. Sanchez-Marcano, Water Res., 2015, 73, 118–131 CrossRef PubMed.
- H.-L. Cao, F.-Y. Cai, K. Yu, Y.-Q. Zhang, J. Lü and R. Cao, ACS Sustainable Chem. Eng., 2019, 7, 10847–10854 CrossRef CAS.
- N. Zhang, J. Chen, Z. Fang and E. P. Tsang, Chem. Eng. J., 2019, 369, 588–599 CrossRef CAS.
- X. Zhang, Y. Li, M. Wu, Y. Pang, Z. Hao, M. Hu, R. Qiu and Z. Chen, Bioresour. Technol., 2021, 320, 124264 CrossRef CAS PubMed.
- J. Wei, Y. Liu, J. Li, Y. Zhu, H. Yu and Y. Peng, Chemosphere, 2019, 236, 124254 CrossRef CAS PubMed.
- L. Zhao, W. Lv, J. Hou, Y. Li, J. Duan and S. Ai, Microchem. J., 2020, 152, 104425 CrossRef CAS.
- X. Cai, J. He, L. Chen, K. Chen, Y. Li, K. Zhang, Z. Jin, J. Liu, C. Wang and X. Wang, Chemosphere, 2017, 171, 192–201 CrossRef CAS PubMed.
- C. Shen, C. Chen, T. Wen, Z. Zhao, X. Wang and A. Xu, J. Colloid Interface Sci., 2015, 456, 7–14 CrossRef CAS PubMed.
- X. Wan, M. A. Khan, F. Wang, M. Xia, W. Lei, S. Zhu, C. Fu and Y. Ding, Chem. Eng. Res. Des., 2019, 152, 95–105 CrossRef CAS.
- A. D. Katsenis, A. Puškarić, V. Štrukil, C. Mottillo, P. A. Julien, K. Užarević, M.-H. Pham, T.-O. Do, S. A. Kimber and P. Lazić, Nat. Commun., 2015, 6, 6662 CrossRef CAS PubMed.
- C. Liu, J. Wang, J. Wan and C. Yu, Coord. Chem. Rev., 2021, 432, 213743 CrossRef CAS.
- S. Chao, X. Li, Y. Li, Y. Wang and C. Wang, J. Colloid Interface Sci., 2019, 552, 506–516 CrossRef CAS PubMed.
- H. Yang, S. Hu, H. Zhao, X. Luo, Y. Liu, C. Deng, Y. Yu, T. Hu, S. Shan and Y. Zhi, J. Hazard. Mater., 2021, 416, 126046 CrossRef CAS PubMed.
- H. Yin, H. Kim, J. Choi and A. C. Yip, Chem. Eng. J., 2015, 278, 293–300 CrossRef CAS.
- N. Li, L. Zhou, X. Jin, G. Owens and Z. Chen, J. Hazard. Mater., 2019, 366, 563–572 CrossRef CAS PubMed.
- Y. Han, M. Liu, K. Li, Q. Sun, W. Zhang, C. Song, G. Zhang, Z. C. Zhang and X. Guo, Inorg. Chem. Front., 2017, 4, 1870–1880 RSC.
- R. Saeedirad, S. T. Ganjali, A. Rashidi and M. Bazmi, ChemistrySelect, 2020, 5, 231–243 CrossRef CAS.
- Z.-h. Yang, J. Cao, Y.-p. Chen, X. Li, W.-p. Xiong, Y.-y. Zhou, C.-y. Zhou, R. Xu and Y.-r. Zhang, Microporous Mesoporous Mater., 2019, 277, 277–285 CrossRef CAS.
- D. Roy, S. Neogi and S. De, J. Environ. Chem. Eng., 2021, 9, 106677 CrossRef CAS.
- S. Abednatanzi, P. G. Derakhshandeh, H. Depauw, F.-X. Coudert, H. Vrielinck, P. Van Der Voort and K. Leus, Chem. Soc. Rev., 2019, 48, 2535–2565 RSC.
- R. Li, W. Li, C. Jin, Q. He and Y. Wang, J. Alloys Compd., 2020, 825, 154008 CrossRef CAS.
- X. Yuan, S. Qu, X. Huang, X. Xue, C. Yuan, S. Wang, L. Wei and P. Cai, Chem. Eng. J., 2021, 416, 129148 CrossRef CAS.
- D. Zhou and C. Qiu, Chem. Phys. Lett., 2019, 728, 70–73 CrossRef CAS.
- H. Yang, J. Li, S. Hu, Y. Liu, C. Peng, C. Deng, Q. Chen, T. Hu, S. Shan and Y. Zhi, Appl. Surf. Sci., 2022, 586, 152687 CrossRef CAS.
- S. K. Sahoo, S. Padhiari, S. Biswal, B. Panda and G. Hota, Mater. Chem. Phys., 2020, 244, 122710 CrossRef CAS.
- X. Zhang, Y. Liu, Y. Jiao, Q. Gao, P. Wang and Y. Yang, Microporous Mesoporous Mater., 2019, 277, 52–59 CrossRef CAS.
- Y. Jin, J. Wu, J. Wang, Y. Fan, S. Zhang, N. Ma and W. Dai, Inorg. Chim. Acta, 2020, 503, 119412 CrossRef CAS.
- X. Liu, J. Zhang, Y. Dong, H. Li, Y. Xia and H. Wang, New J. Chem., 2018, 42, 12180–12187 RSC.
- X. Wang, J. Zhao, J. Yang, Z. Zhou, X. Du and X. Lu, J. Chromatogr. A, 2021, 1659, 462639 CrossRef CAS PubMed.
- M. I. Ostad, M. N. Shahrak and F. Galli, J. CO2 Util., 2021, 43, 101373 CrossRef.
- S. Sun, Z. Yang, J. Cao, Y. Wang and W. Xiong, J. Solid State Chem., 2020, 285, 121219 CrossRef CAS.
- M. Qin, Y. Shi, D. Lu, J. Deng, G. Shi and T. Zhou, Appl. Surf. Sci., 2022, 595, 153494 CrossRef CAS.
- D. Mohanta, A. Mahanta, S. R. Mishra, S. Jasimuddin and M. Ahmaruzzaman, Environ. Res., 2021, 197, 111077 CrossRef CAS PubMed.
- Z. Liu, S. Sun, F. Yang, H. Liu, Y. Sun, N. Ta, G. Zhang, S. Che and Y. Li, J. Colloid Interface Sci., 2023, 632, 237–248 CrossRef CAS PubMed.
- X. Guan, S. Lin, J. Lan, J. Shang, W. Li, Y. Zhan, H. Xiao and Q. Song, Cellulose, 2019, 26, 7437–7450 CrossRef CAS.
- J. Sun, P. Song, H. Zhou, L. Lang, X. Shen, Y. Liu, X. Cheng, X. Fu and G. Zhu, Appl. Surf. Sci., 2021, 567, 150757 CrossRef CAS.
- C. C. Hou, L. Zou and Q. Xu, Adv. Mater., 2019, 31, 1904689 CrossRef CAS PubMed.
- A. Fedorov, A. Saraev, A. Kremneva, A. Selivanova, M. Vorokhta, B. Šmíd, O. Bulavchenko, V. Yakovlev and V. Kaichev, ChemCatChem, 2020, 12, 4911–4921 CrossRef CAS.
- H. Alamgholiloo, B. Hashemzadeh, N. N. Pesyan, A. Sheikhmohammadi, E. Asgari, J. Yeganeh and H. Hashemzadeh, Process Saf. Environ. Prot., 2021, 147, 392–404 CrossRef CAS.
- M.-f. Li, Y.-g. Liu, S.-b. Liu, D. Shu, G.-m. Zeng, X.-j. Hu, X.-f. Tan, L.-h. Jiang, Z.-l. Yan and X.-x. Cai, Chem. Eng. J., 2017, 319, 219–228 CrossRef CAS.
- S. Fan, Y. Qu, L. Yao, J. Ren, R. Luque, Z. He and C. Bai, J. Colloid Interface Sci., 2021, 586, 433–444 CrossRef CAS PubMed.
- Y. Wei, L. Wang, H. Li, W. Yan and J. Feng, Front. Chem., 2022, 10, 900660 CrossRef CAS PubMed.
- J. Chang, Z. Shen, X. Hu, E. Schulman, C. Cui, Q. Guo and H. Tian, ACS Omega, 2020, 5, 3467–3477 CrossRef CAS PubMed.
- Y. Zhao, L. Chang, Y. Li, W. He, K. Liu, M. Cui, M. U. Hameed and J. Xie, J. Water Process Eng., 2023, 53, 103753 CrossRef.
- X. Hu, J. Wen, H. Zhang, Q. Wang, C. Yan and L. Xing, Chem. Eng. J., 2020, 391, 123501 CrossRef CAS.
- M. A. Al-Ghouti and D. A. Da'ana, J. Hazard. Mater., 2020, 393, 122383 CrossRef CAS PubMed.
- T. Van Tran, H. Nguyen, P. H. A. Le, D. T. C. Nguyen, T. T. Nguyen, C. Van Nguyen, D.-V. N. Vo and T. D. Nguyen, J. Environ. Chem. Eng., 2020, 8, 104189 CrossRef.
- P. Arabkhani, H. Javadian, A. Asfaram and M. Ateia, Chemosphere, 2021, 271, 129610 CrossRef CAS PubMed.
- Y. Chen, F. Wang, L. Duan, H. Yang and J. Gao, J. Mol. Liq., 2016, 222, 487–494 CrossRef CAS.
- M. Liu, Z. Zhao and W. Yu, Sci. Total Environ., 2021, 775, 145617 CrossRef CAS PubMed.
- Z. Zhang, Y. Chen, C. Hu, C. Zuo, P. Wang, W. Chen and T. Ao, Environ. Res., 2021, 198, 111254 CrossRef CAS PubMed.
- Y. Mei, J. Xu, Y. Zhang, B. Li, S. Fan and H. Xu, Bioresour. Technol., 2021, 325, 124732 CrossRef CAS PubMed.
- D. Sheng, X. Ying, R. Li, S. Cheng, C. Zhang, W. Dong and X. Pan, Chemosphere, 2022, 308, 136249 CrossRef CAS PubMed.
- J. Pang, Y. Chao, H. Chang, H. Li, J. Xiong, Q. Zhang, G. Chen, J. Qian, W. Zhu and H. Li, ACS Sustainable Chem. Eng., 2018, 6, 4948–4957 CrossRef CAS.
- G. Kim, Y. Yea, L. K. Njaramba, Y. Yoon, S. Kim and C. M. Park, Environ. Res., 2022, 212, 113419 CrossRef CAS PubMed.
- E. M. Abd El-Monaem, A. M. Omer, R. E. Khalifa and A. S. Eltaweil, J. Colloid Interface Sci., 2022, 620, 333–345 CrossRef CAS PubMed.
- C. Liang, Y. Tang, X. Zhang, H. Chai, Y. Huang and P. Feng, Environ. Res., 2020, 182, 109059 CrossRef CAS PubMed.
- X. Song, J. Mo, Y. Fang, S. Luo, J. Xu and X. Wang, Environ. Sci. Pollut. Res., 2022, 29, 35204–35216 CrossRef CAS PubMed.
- Q. Liu, H. Yu, F. Zeng, X. Li, J. Sun, X. Hu, Q. Pan, C. Li, H. Lin and Z. min Su, J. Colloid Interface Sci., 2020, 579, 119–127 CrossRef CAS PubMed.
- B. Debnath, M. Majumdar, M. Bhowmik, K. L. Bhowmik, A. Debnath and D. N. Roy, J. Environ. Manage., 2020, 261, 110235 CrossRef CAS PubMed.
|
| This journal is © The Royal Society of Chemistry 2024 |
Click here to see how this site uses Cookies. View our privacy policy here. 
 Open Access Article
 This Open Access Article is licensed under a Creative Commons Attribution-Non Commercial 3.0 Unported Licence
 abc,
Yueyang Lib,
Lu Changa,
Wenjing He
abc,
Yueyang Lib,
Lu Changa,
Wenjing He