 Open Access Article
Synthesis of hierarchical mordenite by solvent-free method for dimethyl ether carbonylation reaction†
Xiaosheng Wang‡
 *a,
Shaoduo Liu‡ab,
Hongjing Wanga,
Yinghui Liua,
Yangyang Zhanga,
Ranjia Lia,
Changchun Yua,
Kun Rena and
Pengcheng Yangc
aState Key Laboratory of Heavy Oil Processing, College of New Energy and Materials, China University of Petroleum-Beijing, Beijing 102249, PR China. E-mail: wxs880620@cup.edu.cn
bSynfuels China Co. Ltd, Beijing, 101407, PR China
cShandong Hi-tech Spring Material Technology Co. Ltd, Dongying, 257000, PR China
First published on 5th February 2024
Abstract
A series of hierarchical mordenite (MOR) catalysts were synthesized by adding soft templates via the solvent-free method. The influence of different kinds of soft templates on the structure, morphology and acid sites of mordenite were systematically characterized. The characterization results revealed that the addition of soft templates could successfully introduce hierarchical structure into the system while maintaining good crystallinity. The specific surface area and pore volume became larger. Surfactants could also affect the amount and distribution of acid sites, which in turn would affect the dimethyl ether carbonylation activity. Compared with cationic and nonionic surfactants, the addition of anionic surfactants such as sodium dodecyl benzene sulfonate could result in more Al species to preferentially enter into the 8 member ring, thus enhancing the amount of active sites for the carbonylation reaction while weakening the strength. Meanwhile, the addition of sodium dodecyl benzene sulfonate could also reduce the number of strong acid sites in the 12 member ring and obviously improve the carbonylation performance.
1 Introduction
MOR was widely used in toluene disproportionation, alkylation, m-xylene conversion, hydro-isomerization, and other fields due to its specific pore structure, excellent acidity and shape selectivity. Barrer1 successfully synthesized MOR for the first time by using raw materials such as sodium aluminate and silicic acid.2 In 2007, Iglesia et al.3 discovered that MOR exhibited excellent catalytic properties for carbonylation, thus initiating extensive research on the carbonylation process over MOR. Traditionally, MOR was synthesized by the hydrothermal method which referred to the process of synthesizing materials by mixing a specific proportion of silicon sources, aluminum sources, alkali sources, templates, etc. in an aqueous solution environment, and relying on the closed and narrow space of the hydrothermal crystallization autoclave to achieve critical conditions at relatively high temperature.4 Similar to the artificial synthesis of ZSM-5 and SAPO-34, MOR synthesized through the hydrothermal synthesis method also had the advantages of high crystallinity and uniform physical and chemical properties but low product yield.In order to further improve the yield of zeolites, reduce the use of solvents and the production cost, Xiao et al.5 proposed a solvent-free synthesis method and applied it for the synthesis of a variety of zeolites such as SSZ-13, ZSM-5 and Beta.6,7 The successful application of solvent-free synthesis method improved the utilization rate of autoclaves, thus increasing the spatial and temporal yield of product. What's more, it avoided the use of solvents compared with the hydrothermal method, so as to reduce the pressure and environmental pollution generated by their presence.8,9
MOR exhibited high performance for the dimethyl ether (DME) carbonylation reaction, but the current researches mainly focused on the preparation and modification of MOR by hydrothermal synthesis method. Studies on pore structure adjustment by solvent-free method of MOR was still rare. In order to enhance the mass transfer efficiency and delay the deactivation process during carbonylation reaction over MOR,10,11 one of the most direct and effective way was to introduce mesoporous structure into the zeolite.12–14 To determine a suitable soft template agent for the synthesis of hierarchical MOR by solvent-free method, three typical soft templates were picked out and used in the synthesis process. The influences of soft templates on the structure, distribution of acid sites, and carbonylation performance of MOR were investigated in detail.
2 Experimental
2.1 Synthesis of mordenite
A series of hierarchical MOR were prepared by solvent-free method. The detailed steps were as follows (all reagents were purchased from Sinopharm Chemical Reagent Co. Ltd): First, 7.5 grams of tetraethylammonium bromide, 3.2 grams of sodium meta-aluminate, 0.33 grams of soft template agent and 1.96 grams of sodium hydroxide were mixed and milled for 5 min in an agate mortar at ambient temperature to make them evenly distributed; then, 16.3 grams of silica gel was added and the mixture was continued to be milled for 15 min to make it homogeneous. The obtained mixture was put into an autoclave and crystallized at 240 °C for 8 h. After the crystallization, the solid product was filtered, washed, and calcinated at 550 °C. After calcination, the Na-MOR sample was mixed with 1.0 mol L−1 NH4Cl solution at 85 °C for 4 h to transfer Na-MOR to H-MOR. Then the samples were filtered, washed and calcinated again (at the same temperature mentioned above). The sample was then pressed and crushed to small particles of 20–30 mesh. The samples were denoted as MOR-x, where x represents the type of soft template agent. The soft template included the cationic surfactant cetyl trimethyl ammonium bromide (abbreviated as C), the anionic surfactant sodium dodecyl benzene sulfonate (abbreviated as S), and the nonionic surfactant P123 (abbreviated as P).2.2 Characterization of zeolites
The XRD patterns of the samples were determined by a Bruker D8 Advance diffractometer. The analysis was performed by Cu radiation at 40 kV and 30 mA. The peaks in the range of 5–40° were collected.Scanning electron microscopy (SEM) image was taken with a ZEISS Sigma 500 microscope operating at 5 kV accelerating voltage.
Specific surface area and pore structure of the samples were determined by Micromeritics ASAP 2460M multi-station surface and aperture analyzer. The samples were evacuated and degassed at 350 °C for 6 h before analyzing and testing. The pore width distribution was determined by non-local DFT method.
NH3 temperature-programmed desorption (NH3-TPD) was analyzed on a Micromeritics AutoChem II analyzer. For each test, 100 mg sample was put into the reactor and purged in pure Ar at 500 °C for 0.5 h. Then, the gas was switched to 10 mol% NH3/He for adsorption after cooling down. After the adsorption, the gas was converted to pure Ar (30 mL min−1), and then heated up to 700 °C with a heat ramp of 10 min−1. The tail gas was monitored by Pfeiffer QMG220 mass spectrometer.
The magnetic angle scanning nuclear magnetic resonance (MAS NMR) experiments were carried out on a Bruker advance III 600 spectrometer by using a 4 mm probe. Al(NO3)3 (1 mol L−1 aqueous solution) and tetra methyl silane (TMS) were used as reference for the 27Al, and 29Si MAS NMR chemical shifts respectively.
A Nicolet 6700 infrared spectrometer was used for pyridine IR analysis. The sample used was 20 mg every time. After pyridine adsorption in the in situ cell, pyridine desorption was carried out at 150 °C and 350 °C under vacuum conditions and IR tests were performed respectively.
2.3 Catalytic tests
The carbonylation performance of the catalysts were evaluated on a fixed-bed microreactor. For each test, 1.0 g catalyst of 20–30 mesh particles was loaded. The evaluation conditions were 200 °C, 0.5 MPa, GHSV = 2000 mL (g−1 h−1). The feed gas was 2.5 v% DME diluted in pure CO. The products were analyzed by an on-line Fuli GC-9790II chromatography system.3 Results and discussion
3.1 Catalyst characterization
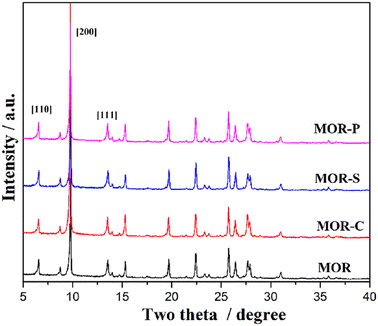
The XRD patterns of the samples with the addition of different soft templates were shown in Fig. 1. As could be seen from the figure, the characteristic diffraction peaks which were consistent with the mordenite standard sample (COD 9003354) also appeared in the patterns of the three hierarchical samples with the addition of soft templates, indicating that these three samples had typical structural characteristics of mordenite.15 By comparing the intensities of the characteristic diffraction peaks corresponding to the different crystallographic planes, it could be found that the intensities of the peaks were basically consistent with each other, indicating that the addition of surfactant had little effect to the relative crystallinity of the sample.16Fig. S1† showed the adsorption and desorption isotherms and pore size distributions of the MOR samples. Similar to the MOR sample, the three samples synthesized with different soft templates still exhibited the typical type I adsorption–desorption isotherms. It was well known that type I adsorption–desorption isotherms generally belong to microporous materials such as zeolites,17 indicating that the synthesized samples still largely maintained microporous pore system. It's also noteworthy that all three samples also exhibited typical H4-type hysteresis loops, indicating that certain amount of mesopores was introduced into the samples. This could be derived from the stack or the cleavage of crystals in the synthesized samples.18 According to Fig. S1(b),† the MOR sample possessed micropores concentrated at 0.5, 0.75 and 1.0 nm. This was typical micropores for MOR type materials. After adding soft templates in the synthesis process, the micropore at 0.75 and 1.0 nm increased by 0.1 nm. Besides, the addition of soft templates also introduced certain amount of mesopores in the range of 10–30 nm which was absent in the MOR sample. This indicated that the use of soft templates during the synthesis process could achieve relatively good pore expansion effect both for the micropores and mesopores. In addition, the H4-type hysteresis loop of the MOR-C sample was significantly wider than that of the other samples, as evidenced by its pore size distribution in the 10–70 nm region in the pore size distribution plot. It could be seen that the addition of CTAB produced more mesopores or increased the number of stacked pores in the samples, thus resulting in the highest non-micropore volume. The obtained specific surface area as well as pore volume of the samples were listed in Table 1. Combined with the data in Table 1, the specific surface area and pore volumes of the samples with the addition of soft templates were enhanced compared with the MOR sample. In conclusion, the addition of soft templates could successfully introduce mesopores into the samples without affecting the microporous structure of MOR.
| Sample | SBET (m2 g−1) | Vmicro (cm3 g−1) | Vmeso+macro (cm3 g−1) | Vtotal (cm3 g−1) |
|---|---|---|---|---|
| MOR | 493 | 0.185 | 0.015 | 0.200 |
| MOR-C | 501 | 0.186 | 0.024 | 0.210 |
| MOR-S | 506 | 0.184 | 0.020 | 0.204 |
| MOR-P | 509 | 0.187 | 0.021 | 0.208 |
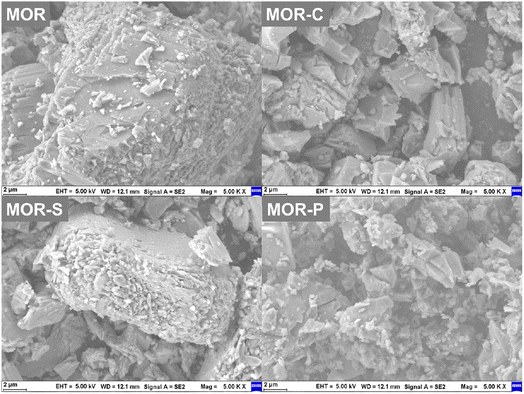
The morphology of the samples was given in Fig. 2. It was obvious that the MOR sample presented a morphology of large particles stacked by lamellae with overall particle size of more than 10 nm. After adding soft templates in the synthesis process, the morphology of the samples considerably changed. After the addition of CTAB, the MOR-C sample showed the morphology of particles stacked by the rod-like elongated bars, but the size of the particles was obviously smaller. The MOR-S sample prepared by the addition of SDBS still retained some of the lamellar stacking morphology, but the particle size became much smaller and the lamellar stacking became obviously loose, and some small particles appeared. After the addition of P123, the MOR-P sample exhibited morphology of disorderly stacking of small particles. The above changes in morphology well explained the increase of some mesopores and macropores in the N2 adsorption–desorption results as well as the increase of the specific surface area of the samples.
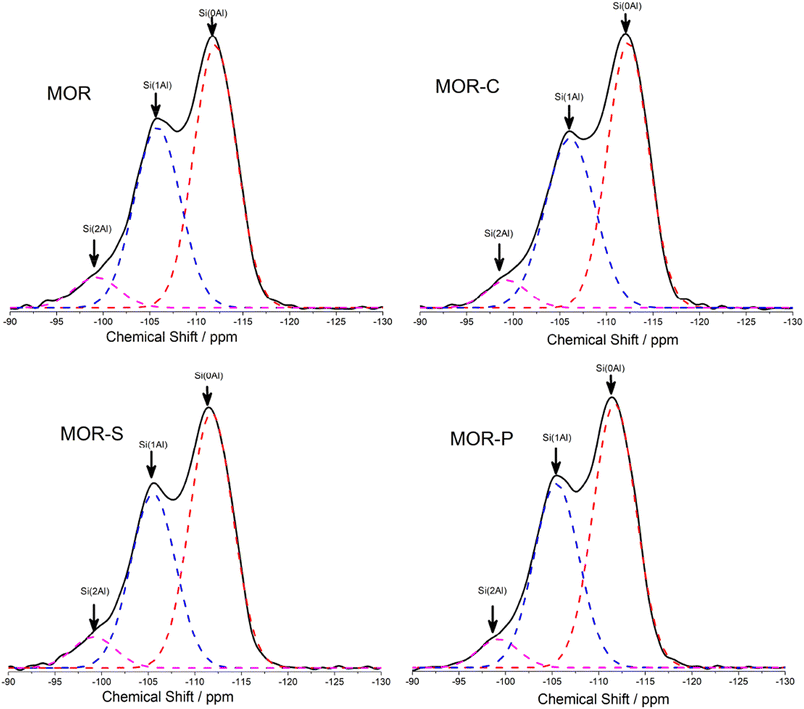
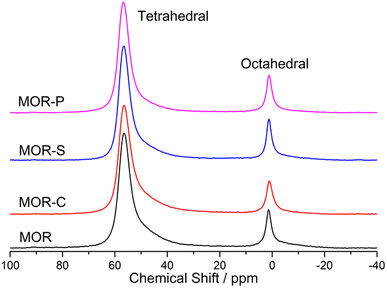
The atoms in the framework were also studied by 29Si and 27Al NMR and the obtained spectra were given in Fig. 3 and 4. To calculate the SiO2/Al2O3 ratio in framework, the 29Si NMR spectra were deconvoluted and the results were listed in Table 2. From Table 2 we could see the framework SiO2/Al2O3 ratio of all the samples were always higher than the theoretical value (13.8). This meant that not all the Al atoms were incorporated into the framework, which was also verified by the 27Al NMR results. Compared with MOR sample, the framework SiO2/Al2O3 ratio in MOR-C and MOR-S slightly decreased, which was consistent with the data of 27Al NMR. This indicated that the addition of CTAB and SDBS was beneficial for Al species to incorporated into the framework. However, the framework SiO2/Al2O3 ratio in MOR-P sample almost remained the same with MOR sample, suggesting that the addition of P123 had no significant effect on the incorporation of Al into the framework.
| Sample | SiO2/Al2O3 in frameworka | 29Si NMR/% | 27Al NMR/% | |||
|---|---|---|---|---|---|---|
| Si(2Al) | Si(1Al) | Si(0Al) | AlFb | AlEFc | ||
| a Calculated from the 29Si MAS NMR spectra, Si/Al = ΣISi(nAl)/Σ0.25ISi(nAl), n = 0–4.b Framework Al atoms.c Extra-framework Al atoms. | ||||||
| MOR | 15.4 | 6.7 | 38.5 | 54.8 | 82.9 | 17.1 |
| MOR-C | 15.1 | 5.9 | 41.0 | 53.4 | 84.3 | 15.7 |
| MOR-S | 15.1 | 6.3 | 40.1 | 53.6 | 84.8 | 15.2 |
| MOR-P | 15.6 | 5.7 | 40.1 | 54.2 | 82.2 | 17.8 |
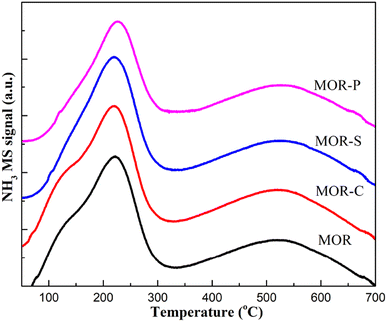
The NH3-TPD profiles of the MOR samples synthesized with the addition of different soft templates were shown in Fig. 5.19 The results of the integral areas of different acid sites were listed in the Table 3. It can be seen that, all samples had two distinct NH3 desorption peaks in the range of 50–700 °C, which correspond to the medium-strong acid site (120–320 °C) and strong acid site (320–700 °C) respectively.20 Combined with the data in Table 2, it could be concluded that the addition of soft templates had a great influence on the acid site distribution. Firstly, the total acid amount over the samples varied distinctly. The total acid amount of MOR-S sample significantly increased, and that of MOR-C sample slightly increased. However, the total acid amount of MOR-P sample decreased slightly. As for the amount of medium-strong acid sites, there was little difference between MOR-C and MOR-P sample, but the addition of SDBS dramatically enhanced the medium-strong acid sites over MOR-S sample. In terms of the number of strong acid sites, the MOR-C sample had the highest amount of strong acid sites. It remained almost unchanged over MOR-S sample and slightly decreased over MOR-P sample. The reason for the large difference in the amount and distribution of acid sites over the synthesized samples should be ascribed to the structure of the soft template, which might interact with the Al species during the synthesis process thus affecting the distribution of acid sites.21 MOR-S sample had the largest number of acid sites, indicating that SDBS would guide Al ions more preferentially incorporate into the medium-strong acid sites.
| Sample | Mid-strong acid area | Strong acid area | Total area (a.u.) | ||
|---|---|---|---|---|---|
| Temperature (°C) | Area (a.u.) | Temperature (°C) | Area (a.u.) | ||
| MOR | 121–320 | 2.99 | 321–700 | 2.77 | 5.76 |
| MOR-C | 121–320 | 2.89 | 321–700 | 2.97 | 5.86 |
| MOR-S | 121–320 | 3.59 | 321–700 | 2.75 | 6.27 |
| MOR-P | 121–320 | 2.95 | 321–700 | 2.49 | 5.44 |
Many researchers had proved that the Brønsted acid (B acid) sites at the T3 sites located in the 8 member ring of MOR was the active sites for the carbonylation reaction, and the B acid sites in the 12 member ring (including the B acid sites at the T4 sites) were more likely to form side products like hydrocarbons or even coke deposition.22 So it was necessary to analyze the amount of acid sites in 12 member ring in the samples. Unlike the NH3 molecule, pyridine was relatively large and only had access to the acid sites in the 12 member ring (including T4 sites). Therefore, the pyridine infrared spectra (Py-IR) mediated a direct and effective way for the analysis of inactive acid sites in the carbonylation reaction.23 The Py-IR spectra of the MOR samples were shown in Fig. S2,† and the area of the peak corresponding to the B acid (1540 cm−1)24 was integrated and listed in Table 4. No obvious signal peak at 1450 cm−1 was observed, indicating that the Lewis acid sites over the samples were all very weak.
| Sample | Py desorpted at 150 °C (a.u.) | Py desorpted at 300 °C (a.u.) |
|---|---|---|
| MOR | 3.75 | 3.54 |
| MOR-C | 3.79 | 3.56 |
| MOR-S | 3.34 | 2.17 |
| MOR-P | 3.67 | 3.26 |
According to the data in Table 4, the amount of B acid sites on the MOR samples was also affected by the addition of soft template. The amount of B acid sites measured in the Py-IR spectra after desorption at both 150 °C and 300 °C all decreased in the following order: MOR-C > MOR > MOR-P > MOR-S. The changing trend of B acid amount was consistent with that of strong acid amount in NH3-TPD characterization results. However, the difference in peak areas in the spectra measured at different desorption temperatures for the same sample differed greatly. The difference between the peak area of MOR and MOR-C samples at two temperatures was about 0.2, indicating that the strong B acid sites were dominant on these two samples. The difference reached 0.6 for MOR-P sample, indicating that the proportion of strong B acid sites reduced and the proportion of medium-strong acids increased. For MOR-S sample, the difference was close to 1.2, suggesting that the number of strong B acid sites was further reduced, and the addition of SDBS increased the proportion of medium-strong B acids. Combined the above analysis with the characterization results of NMR and NH3-TPD, it could be seen that the addition of anionic surfactant SDBS would induce Al species to preferentially enter into the 8 member ring to a certain extent, and the proportion of the strong acid sites in the 12 member ring was also significantly reduced. However, the addition of cationic surfactant CTAB during the synthesis process could induce Al atoms to preferentially enter into the 12 member ring, and the proportion of strong acid sites slightly increased. In conclusion, the addition of soft templates during the synthesis process could not only improve the mesopore and macropores volume in the samples, but also had an obvious effect on the distribution of acid sites.
3.2 DME carbonylation results
The results of the DME carbonylation reaction over MOR samples were shown in Fig. 6. As could be seen from the DME conversion graph, all samples exhibited an inverted “U” shape curve, indicating all samples went through the induction, peak and deactivation period of the reaction. It can be clearly seen that the DME conversions of MOR-S and MOR-P were significantly improved compared with MOR sample, and the MOR-S sample had the highest DME conversion. Combined with the previous characterization results, the reason why DME conversions were enhanced over samples with soft template was the improved mesopores and acid sites distribution. The increase of mesopores and macropores would largely enhance the mass transfer efficiency of carbonylation reaction and the decreased strong acid sites in 12 member ring would further restrain the side reactions. The DME conversion over MOR-C sample was only slightly increased. This should be ascribed to the significantly increased acid sites in 12 member ring, which was not conducive to the mass transfer process despite the introduction of mesopores.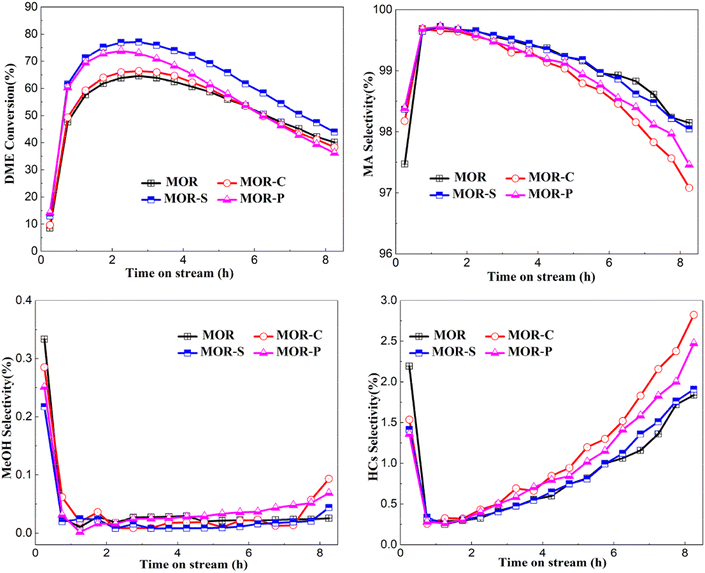 | ||
| Fig. 6 Evaluation results of DME carbonylation reaction of MOR synthesizedwith different soft template. | ||
As shown by the MA selectivity in the figure, all samples had high product selectivity due to the unique pore structure of 8 member ring in mordenite. The MA selectivity over the samples also showed an inverted “U” curve, which was due to the formation of some coke depositions during the reaction.24 Comparing the by-products selectivity of the samples the synthesized with different soft template with the reference sample, the methanol selectivity of these four samples first decreased and then stabilized at close to 0. The methanol selectivity was higher at the early stage of the reaction mainly because methanol would be generated by the carbonylation reaction of DME during the induction period.25 However, as the reaction proceeded, the carbonylation reaction became dominant and the methanol generated would continue to participate in the carbonylation reaction, so the methanol selectivity was close to 0. The selectivity of hydrocarbons (HCs) also showed a “U” shape trend, which was mainly related to the decomposition or dehydration of DME due to the relatively high density of B acid at the beginning of the reaction.26 Then the carbonylation reaction became dominant and the hydrocarbons selectivity began to decline. With the accumulation of coke deposition formed during the carbonylation process, the side reactions gradually increased and MA selectivity slowly decreased.
Many researchers had shown that the 12 member ring of MOR provided a diffusion channel for the reactants and products during the carbonylation reaction, and the B acid sites in the 12 member ring were not favored for the mass transfer process.27 The addition of CTAB would lead to higher acid amount in the mass transfer channel. Although the introduction of mesopores and macropores improved the mass transfer efficiency, the more B-acid sites in its 12 member ring increased the mass transfer resistance, which was unfavorable to the carbonylation reaction. These two factors counteracted each other, and the overall DME conversion of MOR-C sample was similar to that of MOR sample, but the selectivity of MA was poorer. Compared with MOR sample, the mesopore and macropore volume over MOR-P sample was improved, and the number of B-acid sites was reduced in its 12 member ring. This would reduce the mass transfer resistance and shorten the induction period. Besides, the highest DME conversion increased, while the number of active sites reduced so that MOR-P exhibited a faster deactivation trend. Although the total acid amount of the MOR-S sample increased, the increase of acid sites were mainly concentrated inside the 8 member ring while the total amount of strong acid (especially those in the 12 member ring) significantly reduced. This would synergize with the introduced mesopores and macropores to strengthen the mass transfer and improve the carbonylation reaction efficiency, and the macroscopic manifestation of which was the greatly increased DME conversion and the overall higher selectivity.
Combining the characterization results with the evaluation results, the catalytic performance of the samples was affected both by the pore structure as well as the amount and strength of the acid sites. Samples with larger specific surface area, higher mesopore and total pore volume would exhibit better carbonylation activity through enhanced mass transfer efficiency. MOR zeolite samples with a large number of medium-strong acid sites and fewer strong acid sites in 12 member ring would further increase the activity by enhancing their carbonylation active sites and lower the mass transfer resistance. Although the strong acid sites could enhance the adsorption of reactants, they could also delay the desorption of products, and the excessive amount of strong acid could also enhance the polymerization of coke deposition and thus accelerate the deactivation of the catalysts. The samples synthesized with the addition of SDBS had the highest total acid amount, the least strong acid sites in 12 member ring, and the highest DME conversion. Among the surfactants in this manuscript, the anionic surfactant SDBS was more suitable to be used as a soft template agent to improve the carbonylation performance of MOR.
4 Conclusions
In this paper, a series of hierarchical MOR were synthesized by adding different soft template via solvent-free synthesis method. These samples were characterized by XRD, N2 adsorption–desorption, SEM, NH3-TPD, and Py-IR. They were also tested by DME carbonylation reaction to determine the optimal soft templates. The characterization results showed that the addition of surfactant could successfully introduce meso-structure into the catalysts while maintaining good crystallinity, large specific surface area, and large pore volume. Surfactants could also affect the amount and distribution of acid sites, which would affect the carbonylation activity. Compared with cationic and nonionic surfactants, the addition of anionic surfactants such as SDBS could result in more medium-strong B acid sites inside the 8 member ring. Meanwhile, the addition of SDBS could also reduce the number of strong acid sites in the 12 member ring, thus obviously improving the carbonylation performance.Conflicts of interest
There are no conflicts to declare.Acknowledgements
This work was supported by China National Natural Science Foundation (No. 22008260 and 21908123) and Science Foundation of China University of Petroleum-Beijing (No. 2462021YJRC011).References
- R. M. Barrer, J. Chem. Soc., 1948, 24, 2158–2163 RSC.
- Y. Kalvachev, T. Todorova and C. Popov, Catalysts, 2021, 11, 308 CrossRef CAS.
- P. Cheung, A. Bhan, G. Sunley, D. Law and E. Iglesia, J. Catal., 2007, 245, 110–123 CrossRef CAS.
- C. S. Cundy and P. A. Cox, Microporous Mesoporous Mater., 2005, 82, 1–78 CrossRef CAS.
- Y. Jin, Q. Sun, G. Qi, C. Yang, J. Xu, F. Chen, X. Meng, F. Deng and F.-S. Xiao, Angew. Chem., Int. Ed., 2013, 52, 9172–9175 CrossRef CAS PubMed.
- Q. Zhu, Y. Wang, L. Wang, Z. Yang, L. Wang, X. Meng and F.-S. Xiao, Chin. J. Catal., 2020, 41, 1118–1124 CrossRef CAS.
- J. Yao, Q. Wu, J. Fan, S. Komiyama, X. Yong, W. Zhang, T. Zhao, Z. Guo, G. Yang and N. Tsubaki, ACS Nano, 2021, 15, 13568–13578 CrossRef CAS PubMed.
- Q. Wu, X. Liu, L. Zhu, X. Meng, F. Deng, F. Fan, Z. Feng, C. Li, S. Maurer, M. Feyen, U. Müller and F.-S. Xiao, Chin. J. Chem., 2017, 35, 572–576 CrossRef CAS.
- Q. Wu, X. Wang, G. Qi, Q. Guo, S. Pan, X. Meng, J. Xu, F. Deng, F. Fan, Z. Feng, C. Li, S. Maurer, U. Müller and F.-S. Xiao, J. Am. Chem. Soc., 2014, 136, 4019–4025 CrossRef CAS PubMed.
- R. Prajapati, M. Pandey, N. Tsunoji, R. Bandyopadhyay and M. Bandyopadhyay, Mol. Catal., 2023, 547, 113357 CrossRef.
- K. Wang, H. Yang, Z. Cao, H. Ma, Z.-H. He, J.-G. Chen, H. Wang, W. Wang, J. Lu and Z.-T. Liu, Mol. Catal., 2023, 542, 113145 CrossRef CAS.
- X. Wang, R. Li, C. Yu, L. Zhang, C. Xu and H. Zhou, Microporous Mesoporous Mater., 2019, 274, 227–235 CrossRef CAS.
- Y. Wu, L. Ma, Z. Song, S. Dong, Z. Guo, J. Wang and Y. Zhou, Carbon Neutrality, 2023, 2, 1 CrossRef.
- Y. Wu, S. Xi, C. Chen, Q. Hu, Z. Xiong, J. Wang, Y. Dai, Y. Han, S. Jiang, J. Wang and Y. Zhou, Sci. China: Chem., 2023, 66, 2690–2699 CrossRef CAS.
- P. Sharma, P. Rajaram and R. Tomar, J. Colloid Interface Sci., 2008, 325, 547–557 CrossRef CAS PubMed.
- H. Sheng, W. Qian, H. Zhang, P. Zhao, H. Ma and W. Ying, Microporous Mesoporous Mater., 2020, 295, 109950 CrossRef CAS.
- K. S. W. Sing, Pure Appl. Chem., 1985, 57, 603–619 CrossRef CAS.
- M. Thommes, K. Kaneko, A. V. Neimark, J. P. Olivier, F. Rodriguez-Reinoso, J. Rouquerol and K. S. W. Sing, Pure Appl. Chem., 2015, 87, 1051–1069 CrossRef CAS.
- F. Lónyi and J. Valyon, Microporous Mesoporous Mater., 2001, 47, 293–301 CrossRef.
- F. Chen, X.-B. Feng, J.-P. Zhao, Z.-M. He, L.-Y. Zhang, Y.-H. Wang, P. Deng, X.-H. Gao, X.-Y. Zhao and J.-P. Cao, Chem. Eng. Sci., 2023, 282, 119250 CrossRef CAS.
- B. P. S. Santos, N. C. Almeida, I. S. Santos, M. d. F. V. Marques and L. D. Fernandes, Catal. Lett., 2018, 148, 1870–1878 CrossRef CAS.
- D. B. Rasmussen, J. M. Christensen, B. Temel, F. Studt, P. G. Moses, J. Rossmeisl, A. Riisager and A. D. Jensen, Catal. Sci. Technol., 2017, 7, 1141–1152 RSC.
- X. Huang, M. Ma, M. Li and W. Shen, Catal. Sci. Technol., 2020, 10, 7280–7290 RSC.
- X.-s. Wang, R.-j. Li, C.-c. Yu, Y.-x. Liu, C.-m. Xu and C.-x. Lu, J. Fuel Chem. Technol., 2020, 48, 960–969 CrossRef CAS.
- P. Cheung, A. Bhan, G. J. Sunley and E. Iglesia, Angew Chem. Int. Ed. Engl., 2006, 45, 1617–1620 CrossRef CAS PubMed.
- X. Wang, R. Li, C. Yu, Y. Liu, C. Xu and C. Lu, Fuel, 2021, 286, 119480 CrossRef CAS.
- Z. Cheng, S. Huang, Y. Li, J. Lv, K. Cai and X. Ma, Ind. Eng. Chem. Res., 2017, 56, 13618–13627 CrossRef CAS.
Footnotes |
| † Electronic supplementary information (ESI) available. See DOI: https://doi.org/10.1039/d3ra08141a |
| ‡ These two authors contributed to this work equally. |
| This journal is © The Royal Society of Chemistry 2024 |

