 Open Access Article
Enhanced particle separation through ultrasonically-induced microbubble streaming for automated size-selective particle depletion†
Amirabas Bakhtiari * and
Christian J. Kähler
Institute for Fluid Mechanics and Aerodynamics, Bundeswehr University Munich, 85577 Neubiberg, Germany. E-mail: amirabas.Bakhtiari@unibw.de
First published on 10th January 2024
Abstract
In this study, we present an automated method for achieving Size-Selective Particle Depletion in microchannels. This technique is notable for its label-free, sheath-free, and cost-effective attributes. It combines continuous Poiseuille flow with microbubble streaming to enable the manipulation of particles in an automatic or semi-automatic manner at periodic intervals. Larger particles are retained in proximity to the microbubble, with the option for subsequent eviction through a designated waste exit or their accumulation within a collection chamber for future analysis or manipulation. Unlike many conventional methods, our approach keeps the target particles in the vortices near the microbubble while the primary fluid flows continuously through the microchannel. Subsequently, these particles are ejected in just a few milliseconds, preserving the primary fluid and significantly reducing fluid wastage. We conducted an analysis covering multiple critical facets of the study. This included a rigorous statistical examination, flow characterization using volumetric micro PTV, high-frequency micro PTV for observing flow field transitions, evaluating the system's particle trapping capabilities across different sizes with a proprietary algorithm, and investigating the z-axis distribution of both incoming and escaped particles using volumetric micro PTV. The invaluable insights gleaned from this data played a pivotal role in refining the system and optimizing its operational parameters to achieve peak efficiency across various conditions, encompassing varying particle sizes, flow rates, and seeding densities.
1 Introduction
1.1 Overview
Continuous and precise manipulation of particles and cells in microfluidic systems holds immense significance across a wide spectrum of scientific, medical, and industrial domains. This capability not only opens up new avenues for cutting-edge research but also addresses critical challenges in various practical applications. In this context, size-selective particle removal has emerged as a pivotal technique, enabling the separation of particles based on their size and contributing significantly to fields such as biology and medicine, and industry. Its applications extend to recycling, where it facilitates the recovery of valuable metals from electronic waste, thereby contributing to sustainable resource management.1–3 In the mining sector, the technique is employed for the enrichment of desired minerals, improving the efficiency of mineral extraction.4,5 Furthermore, in wastewater treatment, the separation of particles based on size is a key component of the purification process, helping to ensure the quality of treated water.5Beyond the industrial arena, particle separation is fundamental to the progress of various biomedical applications. Researchers have recognized the importance of size-selective particle removal in the isolation and analysis of rare cells, which has profound implications in the diagnosis and treatment of diseases. For instance, the isolation of rare circulating tumor cells (CTCs) from blood samples has been instrumental in cancer research, providing insights into disease progression and treatment response. This technology has become a powerful tool for early cancer detection and monitoring, as evidenced by studies in the literature.6,7
Moreover, in the realm of medical diagnostics, size-selective particle removal has been applied in the development of microfluidic devices for blood analysis. These devices offer rapid and accurate blood cell counting and differentiation, contributing to advancements in point-of-care testing.7,8 Additionally, in the context of microbiology, the isolation of bacteria and other microorganisms based on size is critical for various applications, such as pathogen detection and environmental monitoring.9
Microfluidic systems have emerged as highly sensitive and precise tools for particle and cell separation at the microscale, leveraging external fields such as acoustics, electricity, magnetism, and optics to achieve superior accuracy compared to their macroscopic counterparts.10–14 However, when dealing with cells and tissues, specific circumstances may arise, such as the application of high-power lasers in optical techniques or intense electric fields in electrokinetic processes, which can result in severe damage to cell membranes or disrupt natural experimental conditions. This underscores the critical need for employing non-invasive and non-destructive force fields when aiming for non-contact particle separation at the cellular level.15
As a non-invasive and biocompatible technique, acoustically actuated microbubbles can be used as a tool to selectively capture microparticles, vesicles, and biomedical cells while maintaining cell viability.16 When microbubbles are subjected to acoustic excitation at or near their resonant frequency within microchannels, they induce a primary oscillatory flow. This primary flow, in turn, initiates a secondary flow characterized by the formation of counter-rotating vortices. Precise control over these vortices can be achieved by adjusting the frequency and amplitude of the excitation signal.17–20 In recent years, this streaming has been successfully used in many advanced microfluidics applications for various purposes, such as sorting, mixing, focusing, positioning, and aggregating biological cells or microparticles.15,21–24 Microstreaming trapping of very large particles has also demonstrated the advantage of hydrodynamic manipulation over competing micro trapping techniques such as optical or dielectrophoretic trapping.16,25,26
In a recent study, the size-dependent migration of microparticles in three-dimensional microbubble flows was experimentally demonstrated. It was shown that microparticles of finite size migrate with high reproducibility in a size-dependent manner and are trapped at specific spatial positions. Three regimes with qualitatively different migration behavior were observed for different particle sizes, promising applications for particle separation, trapping, or sorting using microbubble streaming.16
In this study, we present a label-free, sheath-free, and inexpensive automated method for size-dependent particle removal via ultrasound-driven microbubble streaming. This method is designed to selectively capture and remove microparticles from the main fluid with minimal loss of the main fluid in microchannels. By utilizing a combination of continuous Poiseuille flow and microbubble streaming, microparticles and biological cells of various sizes can be automatically separated in a two-step process. Initially, larger particles are captured in proximity to the microbubble and subsequently ejected at a predetermined time, or gathered in a collection chamber for subsequent analysis. Our design maximizes the capacity of microbubble flow by orienting the cavity (i.e., the microbubble) perpendicular to the microchannel wall. This configuration enables the flow to achieve the largest transverse distance from the bubble, thereby drawing larger particles into the core of the counter-rotating vortices. As a result, our technique does not require flow preconditioning such as flow focusing, sheath flow, or the addition of buffer flows. Furthermore, this method can be performed at higher flow rates. In contrast to many other techniques that rely on a continuous underflow of either the main fluid or buffer to remove target particles from the system, resulting in wastage of the main fluid (such as blood), our approach holds the target particles as the flow passes through the stream and ejects them in an instant, resulting in significantly reduced waste of the main fluid. Our proposed approach uses a controllable microstreaming of microbubbles, enabling the separation of particles of different sizes within a single channel, unlike other techniques that require different channel sizes for different pairs of particles.9 Since there are no moving parts and the system relies solely on the microstreaming principle, the microchip system does not require any special cleaning or maintenance procedures, which increases its longevity and robustness for extended periods of operation.
Toward the study's conclusion, the study involved quantifying the statistical parameters concerning the maximum particle retention within microbubble streaming during successive activation cycles of a piezoelectric device. The purpose of these statistical analyses is to optimize the operational timeframe in a periodic mode under various conditions, encompassing distinct particle sizes, flow rates, and seeding densities. By determining the maximum number of particles of varying sizes that the microbubbles can trap, the system can be fine-tuned to accommodate specific operational scenarios effectively. This approach ensures enhanced efficiency and adaptability for diverse particle characteristics and hydrodynamic conditions.
2 Experimental setup
In this section, the procedure for preparing the solution and the experimental setup will be explained. The experimental setup comprises three essential components, namely a microfluidic system, an optical setup, and a control system. To minimize the likelihood of experimental errors, these components are mounted on a vibration-damped table.2.1 Sample preparation
In this research, different sizes of polystyrene microspheres (2, 5, 10, and 15 μm) were utilized. These microspheres were obtained from Microparticles GmbH (Germany) and were suspended in an aqueous solution with 23.8 w–w% glycerol. The purpose was to achieve neutral buoyancy for the particles by adjusting their density to match that of the surrounding medium. To ensure uniform distribution, the microspheres were thoroughly mixed. This step was crucial to ensure random and consistent entry of the particles into the channel.2.2 Microfluidic system
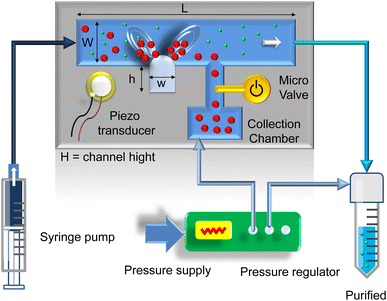
Fig. 1 depicts a schematic illustration of the experimental arrangements comprising microchannels and flow control systems. The experimental investigations were conducted within a polydimethylsiloxane (PDMS) microchannel possessing dimensions of height (H) equal to 100 μm, width (W) of 500 μm, and length (L) extending to 20 mm. This microchannel is additionally characterized by adjacent side pits having dimensions of width (w) measuring 80 μm and length (h) measuring 200 μm, situated at a distance of 300 μm from the discharge channel. The discharge channel itself possesses a width of 60 μm and is controlled with a microvalve. According to previous studies,20,22,27–29 the width of the microbubble cavity was chosen to be not too wide to avoid bubble detachment from the cavity and not too narrow to form a very small bubble, resulting in relatively weak streaming with minimal impact on the flow field.The microchannels were made through the utilization of the conventional soft lithography technique, following a methodology similar to that detailed by Wang et al.30 for efficient fabrication. However, in this particular investigation, we implemented the projection photolithography method suggested by Ostmann et al.31 The inclusion of this innovative photolithography technique within the soft lithography process has not only optimized fabrication but has also led to cost savings. Specifically, we accomplished this by creating a larger-scaled photomask (e.g., 10 times larger) using a standard printer on transparent paper. Subsequently, the pattern on the mask is reduced to the actual size through the optical path, eliminating the requirement for a costly quartz or film photomask. Finally, the microchannel was bonded to a glass slide previously covered with a 1 mm-thick PDMS film by functionalizing the surfaces with a corona plasma treater (Elveflow, France) so that all channel walls were composed of PDMS. In order to uphold experimental reproducibility, the consistent size of microbubbles is maintained by controlling the pressure differential between the interior of the channel and the surrounding ambient pressure, as suggested by Volk et al.32 This control is accomplished by managing the flow of the aqueous sample solution into the channel using a syringe pump and a pressure regulator, as depicted in Fig. 1 (for further details, refer to Bakhtiari et al.15,33).
2.3 Optical setup
The microfluidic chip was placed on a motorized stage with three-dimensional movement capabilities, which is integrated into an upright Zeiss AxioImager.Z22 microscope (Germany). The microscope is equipped with a dichroic filter and a 10× objective lens (EC Plan Neouar 10×/0.3 M27, Zeiss, Germany) that is connected to an sCMOS camera (pco.edge 5.5, USA). Fluorescent particles from Microparticles GmbH, Germany, specifically polystyrene particles labeled with red-fluorescent dye (PS-FluoRed), were utilized in this study. The excitation and emission wavelengths for these particles were 530 nm and 607 nm, respectively. Epifluorescence microscopy was chosen over bright-field microscopy due to its superior signal-to-noise ratio (SNR). Epifluorescence microscopy involves illuminating fluorescent particles using a continuous-wave laser or high-power LED along the optical path, while the camera captures the emitted fluorescent light from the particles. Subsequently, particle detection is achieved through straightforward filtering and thresholding techniques.2.4 Control system setup
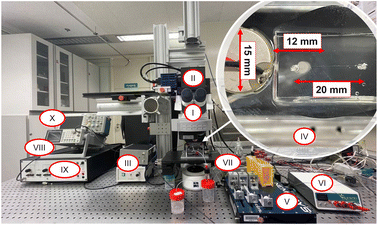
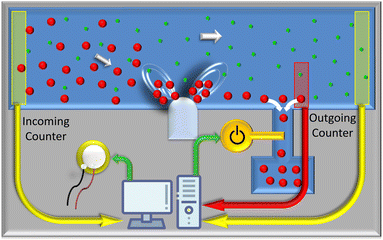
Lab-VIEW (National Instrument, USA) is used to simultaneously control the entire process of image acquisition, particle detection, particle counting, and switching the output channel to discharge the desired particles in live mode by a specially developed routine. The control system consists of a function generator (GW INSTEK AFG-2225, Good Will Instrument Co., Ltd, Taiwan), an amplifier (Krohn Hite 7500, USA), and an oscilloscope (Teledyne LeCroy HDO6104, Germany) to send the predefined electrical signal to the piezoelectric transducer. A National Instruments data acquisition device (DAQmx USB-6002, USA) controls the output channel by switching an electrical microvalve (see Fig. 2).3 Results and discussion
3.1 Flow characterization
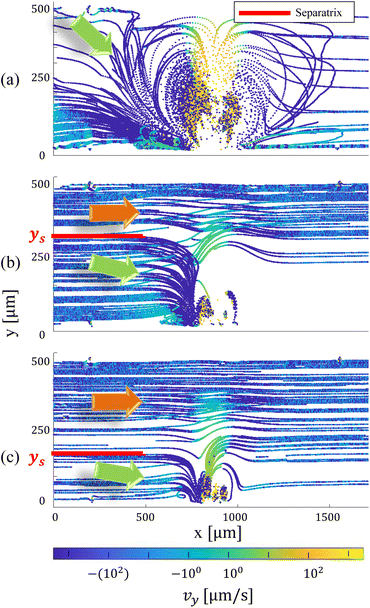
Characterizing fluid flow under various conditions is imperative for precise system programming, ensuring optimal operational efficiency. In the initial phase, we conducted a General Defocusing Particle Tracking (GDPT)34 analysis to characterize the combination of microbubble streaming and Poiseuille flow. To this end, we tracked 15 micrometer particles within a combined flow involving Poiseuille flow (left to right) and microbubble streaming generated by the continuous oscillation of a piezoelectric transducer, with varied voltage amplitudes of 70, 35, and 20 Vpp at a frequency of 33 kHz. The selection of 15 micrometer particles was deliberate, aligning with their critical size and higher Stokes number compared to their 2, 5, and 10 micrometer counterparts. This choice ensures that successful manipulation of the larger particles towards the microbubble logically extends to the smaller particles (2, 5, and 10 micrometers) with lower Stokes numbers, implying similar or faster dragging toward the bubble. As depicted in Fig. 5, the flow field is partitioned into distinct flow topologies by the combination of microbubble streaming and Poiseuille flow, resulting in two primary regions separated by a dividing line or separatrix. The streamlines and particles located above this separatrix line bypass the counter-rotating vortices and exit downstream of the bubble at nearly the same level as upstream of the bubble. On the contrary, particles located beneath the separatrix ingress into the perigee, a confined region characterized by a minimal separation between the bubble's exterior surface and the separatrix. For a given geometry, protrusion depth of the bubble, and resonant frequency, an increase in mean Poiseuille velocity causes the separatrix to move downward towards the bubble, while an increase in the amplitude of the bubble excitation enlarges the size of the vortices, which in turn levels the separatrix towards the wall opposite the bubble. On the other hand, when the relative strengths of Poiseuille flow and microbubble streaming are increased, it leads to an augmentation in the perigee, which is the closest point to the bubble interface.21 This perigee value plays a decisive role in the migration of particles toward the inner torii of the counter-rotating vortices. In essence, particles that exceed the perigee size are subsequently guided and confined within the inner torus.16In order to enhance particle entrapment efficacy, it is imperative to achieve an optimal proportion between the Poiseuille flow rate and the magnitude of microstreaming. This equilibrium ensures that the resultant vortices adequately cover the complete width of the microchannel and makes the perigee sufficiently minimized to facilitate the effective capture of focused particles. Since particles larger than 2 μm encounter greater inertial forces, the research endeavors were replicated for particle dimensions measuring 5, 10, and 15 μm. This was undertaken to validate the notion that particles situated near the far wall of the microbubble could still be effectively drawn towards the perigee. The results of these experimental iterations vividly illustrate that, with an average Poiseuille flow rate of 200 μm s−1, the microstreaming induced by the excited piezo transducer—operating at an amplitude of 66 Vpp and a frequency of 33 kHz within the microchannel—exhibits the ability to aggregate particles of all sizes towards the perigee. Notably, it succeeds in ensnaring particles measuring 5, 10, and 15 μm within the inner torii.
In cases where it is challenging to enhance amplification due to bubble detachment or when the influence is insufficient to overcome the dominance of Poiseuille flow, alternative strategies may be explored. These alternatives include employing deeper microchannels at constant flow velocities through the use of higher flow rates or introducing multiple microbubbles on opposing channel walls. These approaches enable the system to effectively function in wider microchannels, offering potential solutions to overcome operational limitations.
3.2 High-frequency mPTV
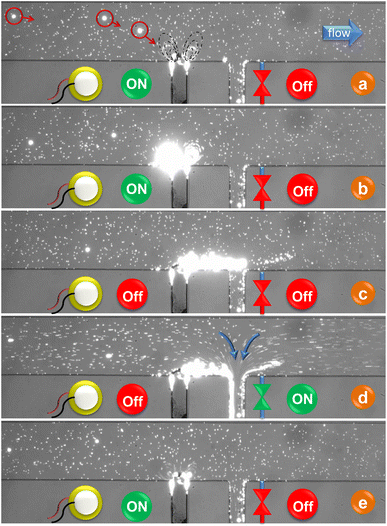
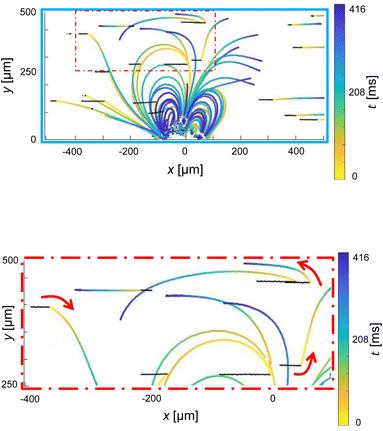
Under specific conditions, especially when target particles are rare, continuous system activation may not be necessary. Instead, the system can be designed to initiate its operation automatically upon detecting a single particle within the first Region of Interest (ROI). To ensure the effective detection of particles and minimize the risk of missing them, precise placement of the ROI within the camera's field of view, along with a thorough understanding of the response time between activating the piezoelectric element and redirecting the particle, becomes crucial. In this investigation, we employ high-frequency microparticle tracking velocimetry (μPTV) to scrutinize the dynamic shift in the flow field, transitioning from pure Poiseuille flow to the combination of Poiseuille flow (left to right) along with the introduction of microbubble streaming upon activation and deactivation of a piezoelectric element. High-Frequency Micro-Particle Tracking Velocimetry (μPTV) at 24![[thin space (1/6-em)]](https://www.rsc.org/images/entities/char_2009.gif) 000 frames per second was conducted to track 2 micrometer particles in this combined flow field. The experimental setup, as described in 2.3, was utilized for high-frequency (μPTV), with the exception of employing a Phantom v2640 ONYX high-speed camera operated by Davis 10 (LaVision, Germany). Subsequently, the GDPT method was applied for post-processing the images. Fig. 6 offers a visual representation of our high-frequency μPTV analysis, spanning 3000 frames (lasting 125 ms, depicted in black) before and 10
000 frames per second was conducted to track 2 micrometer particles in this combined flow field. The experimental setup, as described in 2.3, was utilized for high-frequency (μPTV), with the exception of employing a Phantom v2640 ONYX high-speed camera operated by Davis 10 (LaVision, Germany). Subsequently, the GDPT method was applied for post-processing the images. Fig. 6 offers a visual representation of our high-frequency μPTV analysis, spanning 3000 frames (lasting 125 ms, depicted in black) before and 10![[thin space (1/6-em)]](https://www.rsc.org/images/entities/char_2009.gif) 000 frames (416 ms, illustrated in color) after initiating bubble excitation via the piezoelectric element.
000 frames (416 ms, illustrated in color) after initiating bubble excitation via the piezoelectric element.
As illustrated in Fig. 6a, the immediate alteration in particle displacements becomes evident after the initial cycle of bubble activation. Although the magnitude of these changes is smaller for particles located farther from the bubble's center (e.g., particles with xp < −400 and xp > +400 μm), they all initiate promptly, irrespective of their proximity to the vortex core. A closer look in Fig. 6b reveals that the newly adopted trajectories, categorized by their initial positions, exhibit perfect synchronization, devoid of any temporal delay. This tracking behavior remains consistent over an extended period, confirming the absence of any transition delay and the instantaneous establishment of the superposition pattern. Similarly, when transitioning from the superposition flow to pure Poiseuille flow, we observe an immediate cessation of lateral particle movement without delay. The particles maintain their respective lateral positions until they reach the end of the microchannel.
3.3 Particle trapping capacity
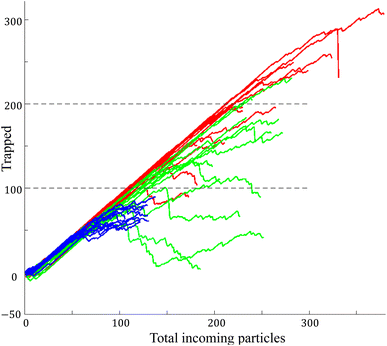
Fig. 7 illustrates the outcomes of particle trapping efficiency across varying particle sizes (5, 10, and 15 μm), using a consistent microbubble excitation frequency (33 kHz, 66 Vpp) and main flow velocity (200 μm s−1). The quantification of entrapped particles was accomplished by tracking inflow and outflow. This involved counting particles entering upstream of the microchannel and subtracting those exiting downstream of the bubble. The best trapping performance was observed for 10 micrometer particles with a success rate of 100 particles and negligible leakage. However, as the number of particles entering increased, the leakage rate gradually rose. This continued until an equilibrium was reached between entering and exiting particles. In some instances, higher particle concentrations led to notable particle–particle interactions within the trapping vortex, causing sudden leakage. Fig. 7 presents the highest capacity achievable for clean trapping, devoid of particle leakage. This capacity decreased to 70 particles for 5 micrometer particles and 60 particles for 15 micrometer particles. We identified two primary factors contributing to this reduction in efficiency for particles larger or smaller than 10 micrometers. Firstly, larger particles occupied space within the torus (vortex) at a faster pace, promoting quicker particle–particle interactions. Secondly, the proximity of 5 micrometer particles to the critical perigee size resulted in an increased likelihood of leakage as trapped particle concentration intensified within the vortices.3.4 Leaked particles: Z-directional distribution analysis
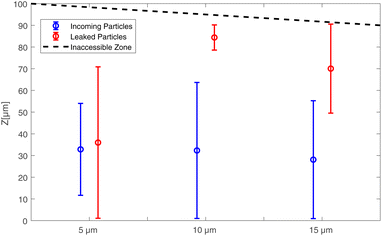
To gain deeper insight into the particle leakage phenomenon, we performed comprehensive volumetric microparticle tracking velocimetry (PTV) using defocus imaging.35 This allowed us to accurately track the precise positions of particles in the z-axis as they exited the vortices and traversed the microchannel. In earlier stages of our research, both numerical simulations and experimental observations led to intriguing results: during the trapping phase, characterized by the absence of Poiseuille flow and particle leakage, larger particles consistently exhibited a distinct migration pattern along the z-axis. This rapid migration occurred on the order of milliseconds and was strongly influenced by both particle size and flow velocity. The results of the migration of particles with diameters of 5, 10, and 15 μm in the microbubble flow show that 15 micrometer particles are focused closer to the wall, similar to 10 micrometer particles, and closer than 5 micrometer particles.16 Fig. 8 illustrates volumetric micro-Particle Tracking Velocimetry (micro-PTV) results pertaining to the z-axis spatial distribution of particles with diameters of 5, 10, and 15 micrometers. These measurements were obtained while subjecting the system to uniform microbubble excitation at a frequency of 33 kHz, with an amplitude of 66 Vpp, and maintaining a consistent main flow velocity of 200 μm s−1. While incoming particles are initially uniformly distributed in both the y and z directions, we observe a distinct behavior. The 10 and 15 micrometer leaked particles exhibit a focused clustering near the channel wall, with a standard deviation of approximately 10–20 μm. In contrast, 5 micrometer particles do not display this wall-focused behavior; instead, they disperse throughout the channel depth. These observations suggest that during the particle trapping phase, the larger diameter particles, 15 and 10 μm, experience a more significant shear-induced lift force compared to wall-induced lift force. Consequently, they have a greater propensity to position themselves closer to the nearest channel wall, resulting in a common exit point along the z-axis. Furthermore, this exit process is faster for 15 micrometer particles than for 10 micrometer particles due to the quicker filling of the available space, which promotes faster particle–particle interactions.4 Conclusions
In conclusion, this study has presented and validated an automated method for achieving Size-Selective Particle Depletion in continuous microchannel flow. This method stands out for its label-free, sheath-free, and cost-effective nature. Particle separation and removal are accomplished using a PDMS microchannel and piezoelectric technology, offering a simple yet effective alternative to expensive devices like flow cytometers. The cost-effectiveness of microchip fabrication is further improved through the use of negative magnification during soft lithography. Moreover, the technique relies on actuated microbubbles without involving moving parts, resulting in a key advantage of minimal maintenance procedures. Notably, it effectively retains larger particles near microbubbles without necessitating the use of buffer flow, offering the option for subsequent removal or collection. Unlike conventional techniques, our approach keeps target particles within vortices near microbubbles while the primary fluid continues to flow through the microchannel. Consequently, particle ejection occurs rapidly, minimizing fluid wastage and preserving the primary fluid. Our analysis encompassed various critical aspects, including rigorous statistical examination, volumetric micro PTV flow characterization, high-frequency micro PTV for flow field observations, evaluation of particle trapping capabilities across different sizes with a proprietary algorithm, and exploration of z-axis particle distribution using volumetric micro PTV. The insights gained from this data have been instrumental in refining the system and optimizing its operational parameters to achieve peak efficiency under diverse conditions, accommodating varying particle sizes, flow rates, and seeding densities. Notably, our system's flexibility allows for customization to meet practical needs, accommodating different flow conditions, particle sizes, and particle distribution rates. This adaptability ensures its applicability in a wide range of scenarios, underscoring its potential for widespread utility and innovation in the field of microfluidics and particle manipulation.Author contributions
Amirabas Bakhtiari: conceptualization, methodology, data acquisition and analysis, original draft writing. Christian J. Kähler: conceptualization, methodology, supervision, review and editing, funding acquisition.Conflicts of interest
There are no conflicts to declare.Acknowledgements
We acknowledge financial support by Universität der Bundeswehr München.Notes and references
- S. Louhadj, N. Hammadi, S. Touhami, H. Louati, A. Hadjali, I.-E. Kimi and A. Tilmatine, J. Electrost., 2020, 105, 103448 CrossRef CAS.
- F. Wang, Y. Zhao, T. Zhang, G. Zhang, X. Yang, Y. He, L. Wang and C. Duan, J. Cleaner Prod., 2017, 165, 452–457 CrossRef CAS.
- T. Spengler, M. Ploog and M. Schröter, OR Spectrum, 2003, 25, 413–442 CrossRef.
- L. Hansen, A. Wollmann, M. Weers, B. Benker and A. P. Weber, Chem. Eng. Technol., 2020, 43, 933–941 CrossRef CAS.
- E. N. Peleka, G. P. Gallios and K. A. Matis, J. Chem. Technol. Biotechnol., 2018, 93, 615–623 CrossRef CAS.
- R. T. Krivacic, A. Ladanyi, D. N. Curry, H. Hsieh, P. Kuhn, D. E. Bergsrud, J. F. Kepros, T. Barbera, M. Y. Ho and L. B. Chen, et al., Proc. Natl. Acad. Sci. U. S. A., 2004, 101, 10501–10504 CrossRef CAS.
- M. Toner and D. Irimia, Annu. Rev. Biomed. Eng., 2005, 7, 77–103 CrossRef CAS PubMed.
- M. E. Vincent, W. Liu, E. B. Haney and R. F. Ismagilov, Chem. Soc. Rev., 2010, 39, 974–984 RSC.
- C. Liu, C. Xue, X. Chen, L. Shan, Y. Tian and G. Hu, Anal. Chem., 2015, 87, 6041–6048 CrossRef CAS PubMed.
- M. J. Kim, D. J. Lee, J. R. Youn and Y. S. Song, RSC Adv., 2016, 6, 32090–32097 RSC.
- P. Deng, C.-J. Fu and Z. Wu, RSC Adv., 2018, 8, 35512–35520 RSC.
- C. Devendran, N. R. Gunasekara, D. J. Collins and A. Neild, RSC Adv., 2016, 6, 5856–5864 RSC.
- D. Yuan, S. H. Tan, Q. Zhao, S. Yan, R. Sluyter, N.-T. Nguyen, J. Zhang and W. Li, RSC Adv., 2017, 7, 3461–3469 RSC.
- C. W. Shields IV, C. D. Reyes and G. P. López, Lab Chip, 2015, 15, 1230–1249 RSC.
- A. Bakhtiari and C. J. Kähler, Microfluid. Nanofluid., 2022, 26, 1–11 CrossRef.
- A. Volk, M. Rossi, B. Rallabandi, C. J. Kähler, S. Hilgenfeldt and A. Marin, Physical Review Fluids, 2020, 5, 114201 CrossRef.
- N. Riley, Annu. Rev. Fluid. Mech., 2001, 33, 43–65 CrossRef.
- P. Marmottant and S. Hilgenfeldt, Nature, 2003, 423, 153–156 CrossRef CAS PubMed.
- M. Versluis, D. E. Goertz, P. Palanchon, I. L. Heitman, S. M. van der Meer, B. Dollet, N. de Jong and D. Lohse, Phys. Rev. E: Stat., Nonlinear, Soft Matter Phys., 2010, 82, 026321 CrossRef.
- B. Rallabandi, C. Wang and S. Hilgenfeldt, J. Fluid Mech., 2014, 739, 57 CrossRef.
- R. Thameem, B. Rallabandi and S. Hilgenfeldt, Biomicrofluidics, 2016, 10, 014124 CrossRef.
- C. Wang, B. Rallabandi and S. Hilgenfeldt, Phys. Fluids, 2013, 25, 022002 CrossRef.
- C. Wang, S. Jalikop and S. Hilgenfeldt, arXiv, 2010, preprint, arXiv:1010.3290, DOI:10.48550/arXiv.1010.3290.
- Y. Gao, M. Wu, Q. Luan, I. Papautsky and J. Xu, Lab Chip, 2022, 22, 805–813 RSC.
- B. R. Lutz, J. Chen and D. T. Schwartz, Anal. Chem., 2006, 78, 5429–5435 CrossRef CAS.
- X.-B. Wang, Y. Huang, P. R. Gascoyne and F. F. Becker, IEEE Trans. Ind. Appl., 1997, 33, 660–669 CrossRef.
- D. Ahmed, A. Ozcelik, N. Bojanala, N. Nama, A. Upadhyay, Y. Chen, W. Hanna-Rose and T. J. Huang, Nat. Commun., 2016, 7, 1–11 Search PubMed.
- A. R. Tovar and A. P. Lee, Lab Chip, 2009, 9, 41–43 RSC.
- D. Ahmed, X. Mao, B. K. Juluri and T. J. Huang, Microfluid. Nanofluid., 2009, 7, 727 CrossRef CAS.
- C. Wang, S. V. Jalikop and S. Hilgenfeldt, Biomicrofluidics, 2012, 6, 012801 CrossRef PubMed.
- S. Ostmann and C. J. Kähler, Microfluid. Nanofluid., 2022, 26, 24 CrossRef.
- A. Volk, M. Rossi, C. J. Kähler, S. Hilgenfeldt and A. Marin, Lab Chip, 2015, 15, 4607–4613 RSC.
- A. Bakhtiari and C. J. Kähler, Microfluid. Nanofluid., 2023, 27, 1–9 CrossRef.
- R. Barnkob, C. J. Kähler and M. Rossi, Lab Chip, 2015, 15, 3556–3560 RSC.
- M. Wu, J. W. Roberts and M. Buckley, Exp. Fluids, 2005, 38, 461–465 CrossRef.
Footnote |
| † Electronic supplementary information (ESI) available. See DOI: https://doi.org/10.1039/d3ra08038b |
| This journal is © The Royal Society of Chemistry 2024 |

