
 Open Access Article
 This Open Access Article is licensed under a Creative Commons Attribution-Non Commercial 3.0 Unported Licence
Synthesis of novel fluorescence probes and their application in the enantioselective recognition of arginine†
Jiawei Xua,
Fangling Caob,
Chenxiang Lua,
Zhe Song*c and
Zhenya Dai *a
*a
aDepartment of Medicinal Chemistry, School of Pharmacy, China Pharmaceutical University, 24 Tongjiaxiang, Nanjing, 210009, P. R. China
bDepartment of Pharmaceutical Analysis, School of Science, China Pharmaceutical University, 24 Tongjiaxiang, Nanjing, 210009, P. R. China
cChina Pharmaceutical University Center for Analysis and Testing, 24 Tongjiaxiang, Nanjing, 210009, P. R. China. E-mail: daizhenya@hotmail.com
First published on 9th January 2024
Abstract
Arginine (Arg) plays a crucial and multifaceted role in various biological processes, encompassing cell division, wound healing, immune system modulation, and plant signaling. This study introduced a pair of novel chiral fluorescent probes, (R)-5 and (S)-5, constructed upon the BINOL framework, which exhibited enantiomeric selectivity and sensitivity to D-Arg/L-Arg in fluorescence experiments. These probes offered a simple, rapid, low-cost, and highly selective method for detecting Arg enantiomers, thereby providing a highly sensitive approach for their qualitative and quantitative analysis. The enantioselective fluorescence enhancement ratios {ef = [(I1 − I0)/(I2 − I0) = ΔI1/ΔI2]} of (R)-5 and (S)-5 to Arg were 1694 and 5163, respectively. Moreover, the probes demonstrated the capability to detect the concentration of D-Arg and L-Arg with a limit of detection of 4.84 × 10⁻⁷ M and 3.35 × 10⁻⁷ M, respectively, as well as determine the enantiomeric excess. These probes exhibited high chemical selectivity and enantioselectivity, enabling the identification of different configurations of Arg, quantification of Arg concentrations, and determination of the enantiomeric composition of Arg. This study provides valuable insights for the development of sensitive and selective chiral molecular detection methods, significantly advancing our comprehension of the relationship between Arg concentration and probe fluorescence response.
1 Introduction
Arg plays multiple pivotal roles in nature, functioning as an amino acid and a fundamental constituent of numerous proteins. It plays a crucial part in cell division, wound healing, ammonia clearance, immune system function, vasodilation, and hormone release.1–5 Furthermore, Arg demonstrates antibacterial properties, exhibiting potent effects against specific bacterial strains. In plants, arginine operates as a signaling molecule, playing a critical role in plant growth and development.6–8 D-Arg and L-Arg are enantiomeric forms, with L-Arg being essential for the growth and development of infants due to their inability to synthesize it endogenously. Conversely, D-Arg has demonstrated potent antibacterial properties against certain strains.9–11 In tumor biology, L-Arg stimulates tumor cell growth, while D-Arg inhibits it. Arg deficiency leads to health problems, and Arg-derived biomolecules are associated with various disease-related phenomena.12–14The recognition of enantiomeric amino acid isomers typically relies on interactions such as hydrogen bonding, ion–dipole interactions, π–π interactions, and dipole–dipole interactions.15,16 Various methods have been developed, including electrochemical, azo nanomaterial biosensors, nanoparticle/CdS quantum dots, carbon nanodots, conductance biosensors, carbon fiber cylinders, and DNA aptamers.17–23 However, the complexity, cost, pre-processing requirements, and time consumption of these methods limit their practical applicability. Therefore, the development of a simple, rapid, low-cost, and highly selective method for detecting Arg enantiomers is crucial. Fluorescence spectroscopy has gained popularity in the field of chiral identification due to its accessibility, field analysis capabilities, high throughput determination, and remote sensing advantages.24–29 Our research group has previously developed numerous fluorescence analytical probes for the identification and analysis of chiral amino acids, carboxylic acids, amines, and alcohols (Table 1).30–32
| Methods | LOD | Range |
|---|---|---|
| Electrochemical | 1.6 × 10⁻¹² M | 0–8.6 × 10⁻⁷ M |
| Azo nano-materials biosensor | 8.0 × 10⁻⁷ M | 5.0 × 10⁻⁶ to 5.0 × 10⁻⁵ M |
| Nanoparticles/CdS quantum dots | 1.4 × 10⁻⁸ M | 4.0 × 10⁻⁸ to 1.2 × 10⁻⁶ M |
| Carbon nano-dots | 2.6 × 10⁻⁷ M | 0–1.0 × 10⁻⁴ M |
| Conductometric biosensor | 1.0 × 10⁻⁵ M | 1.0 × 10⁻⁵ to 1.0 × 10⁻³ M |
| Carbon fiber cylinder | 1.0 × 10⁻⁵M | 5.0 × 10⁻⁴ to 5.0 × 10⁻³ M |
| DNA aptamer | 1.8 × 10⁻⁹ M | 2.5 × 10⁻⁸ to 4.0 × 10⁻⁷ M |
In recent years, there has been significant progress in the development of chiral amino acid recognition fluorescent probes utilizing BINOL structures as fluorophores, as evidenced by a number of notable studies.33–36 Conventionally, chiral amino acid probes utilizing the BINOL structure rely on the aldehyde group within the naphthalene ring to engage in a Schiff base reaction with the amino acid, leading to the formation of a complex wherein the remaining substituents of the probe intricately interact with the amino acid, consequently inducing alterations in the fluorescence properties of the probe. It is imperative to acknowledge that the structural composition of the probe plays a critical role in dictating the specific binding mechanism between the probe and chiral amino acids, modulating the fluorescence characteristics across varying solvent environments, and potentially influencing the necessity of auxiliary ions in the interaction process.
Notably, the Pu group has emerged as a leading contributor in this field, with a series of significant contributions.37–39 In 2020, the Pu group successfully engineered a highly chemoselective and enantioselective fluorescent probe capable of recognizing acidic amino acids, including glutamate and aspartic acid, and elucidated its underlying recognition mechanism.40 Building on this foundation, our research sought to advance the field by focusing on the development of a probe specifically designed for the detection of basic amino acids.
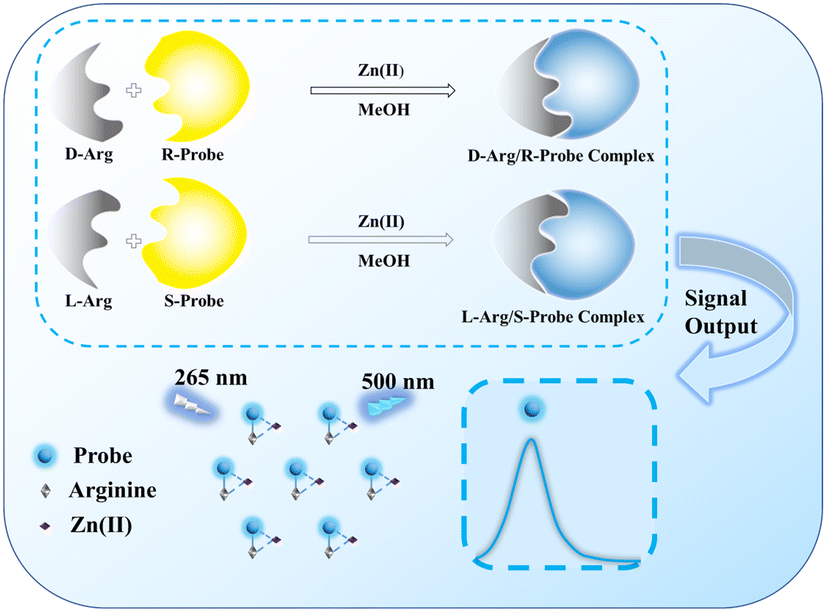
In this study, a pair of small molecule fluorescent probes, (R)-5 and (S)-5, based on the BINOL framework, were synthesized to demonstrate the enantioselectivity of Arg in methanol. The synthesized probes, 2-acetic acid and 3′-aldehyde substituted BINOL derivatives, offered a highly sensitive fluorescence detection method for Arg with a low detection limit using a fluorescence spectrophotometer. As illustrated in Scheme 1, D-Arg interacted with the R-probe, and L-Arg with the S-probe, resulting in a fluorescence “turn-on” phenomenon. Strong fluorescence emission at 500 nm was observed under 265 nm illumination. These probes can be used for identification and concentration determination of D-/L-Arg and determination of ee value of Arg. The development of these novel fluorescent probe provides a convenient, efficient and economical method for the qualitative and quantitative analysis of chiral Arg.
 | ||
| Scheme 1 The mechanism of chiral Arg recognition by the probe. | ||
2 Experimental
2.1 Materials and methods
1H and 13C NMR spectra of the compounds were acquired using a Bruker AV 300 NMR spectrometer with DMSO-d6 and CDCl3 as the solvents and tetramethylsilane (TMS; δ = 0 ppm) as the internal standard. Mass spectrometry analysis was conducted using a Waters Q-TOF mass spectrometer. Fluorescence spectra were recorded using a SpectraMax iD5 microplate detection system. Fluorescence lifetime was determined employing an Edinburgh FLS980 series of fluorescence spectrometers (PL).Unless otherwise specified, materials were sourced from commercial suppliers and were used without further purification.
2.2 Synthesis of fluorescence probes (R)-5 and (S)-5
Synthesis of fluorescent probes (R)-5 and (S)-5 involved a number of steps as described in Scheme 2. Starting from (R)-1 and (S)-1, after nucleophilic substitution reaction, Bouveault aldehyde synthesis reaction, substance (R)-3 and (S)-3. A further nucleophilic substitution reaction was performed, and the hydrolysis reaction yielded the formation of the final products (R)-5 and (S)-5, which were yellow solids with a total reaction yield of 37%. Detailed synthesis procedures and examples can be found in ESI.† | ||
| Scheme 2 Synthesis of fluorescence probes (R)-5 and (S)-5. | ||
2.3 Analytical procedure
To investigate the fluorescence response of (R)-5 and (S)-5 to free amino acids in the presence of Zn2+, the following experimental protocol was implemented: a stock solution of probe (R)-5 (or (S)-5) was prepared by dissolving it in methanol of spectroscopic grade to achieve a concentration of 1.0 mM. Stock solutions of Zn2+ (Zn(OAc)2) and amino acids were prepared by dissolving in ultrapure water to a concentration of 1.0 mM each. Subsequently, 10 μL of the probe solution, 10 μL of the Zn2+ solution, and 50 μL of the amino acid solution were added to a centrifuge tube. The resulting mixture was then diluted to a final volume of 1 mL with methanol, resulting in a final probe concentration of 10 μM in the solution. The reaction was allowed to proceed for 1.0 hours at room temperature to facilitate adequate interaction between the probe, Zn2+, and amino acids. Subsequently, fluorescence assays were conducted to analyze the fluorescence response of (R)-5 or (S)-5 at the conclusion of the reaction time.This experimental approach enabled the assessment of the fluorescence response of (R)-5 and (S)-5 to various free amino acids in the presence of Zn2+. The fluorescence measurements provided valuable insights into the interaction and selectivity of the probe toward specific amino acids.
3 Results and discussion
3.1 Recognition of amino acids
The experimental findings depicted in Fig. 1a revealed that (R)-5 alone did not exhibit a significant fluorescence signal. However, upon interaction with 5.0 eq. D-Arg and 1.0 eq. Zn2+, a remarkable enhancement in fluorescence intensity was observed at an excitation wavelength of 265 nm and an emission wavelength of 500 nm. Conversely, when (R)-5 interacted with L-Arg, the fluorescence intensity was notably lower compared to its interaction with the D-enantiomer (Fig. 1a). Notably, the fluorescence intensity of (R)-5 was found to be the highest upon interaction with D-Arg. The maximum enantioselective fluorescence enhancement ratios (ef) value of probe R-5 for D-/L-Arg was measured at 51.2 at an emission wavelength of 470 nm. Intriguingly, (R)-5 also demonstrated strong recognition of His, with observable fluorescence upon interaction with D-His. Furthermore, no similar fluorescence enhancement was observed when (R)-5 interacted with the enantiomers of the other 13 amino acid pairs. This pronounced fluorescence disparity affords D-Arg with robust enantioselectivity relative to its L-enantiomers.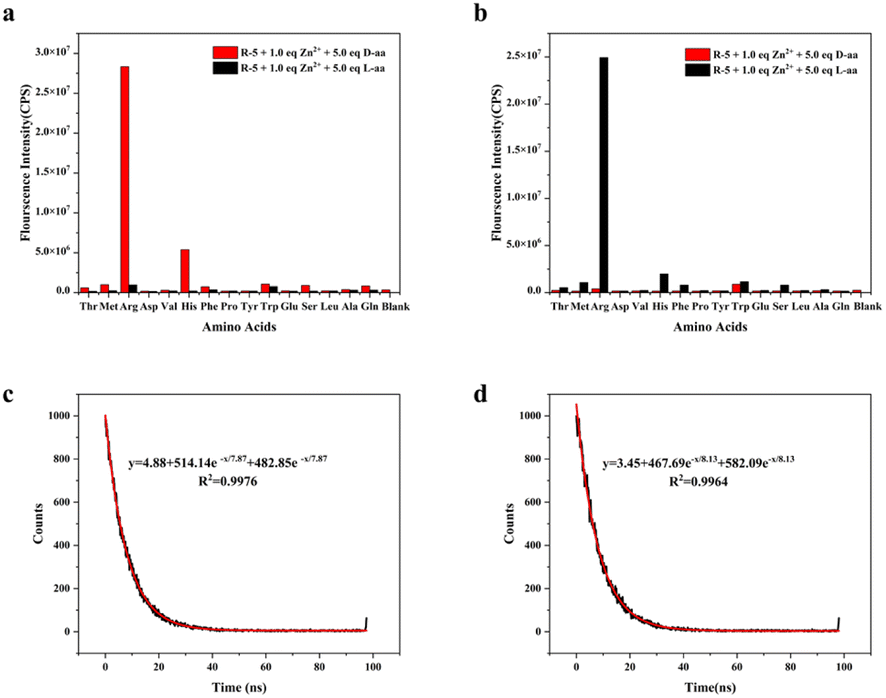 | ||
Fig. 1 (a) Fluorescence peak intensity of (R)-5 (10 μM) with the addition of 1.0 eq. Zn2+ and 5.0 eq. D-/L-amino acids, MeOH![[thin space (1/6-em)]](https://www.rsc.org/images/entities/char_2009.gif) :H2O = 94:6 (λex = 265 nm, λem = 470 nm, slit width = 5.0/5.0 nm, t = 1.0 h). (b) Fluorescence peak intensity of (S)-5 (10 μM) with the addition of 1.0 eq. Zn2+ and 5.0 eq. D-/L-amino acids, MeOH:H2O = 94:6 (λex = 265 nm, λem = 470 nm, slit width = 5.0/5.0 nm, t = 1.0 h). (c) Fluorescence lifetime curves and its fitting curve of (R)-5 (10 μM) with the addition of 1.0 eq. Zn2+ and 5.0 eq. D-Arg, MeOH:H2O = 94:6 (λex = 265 nm, λem = 470 nm, slit width = 5.0/5.0 nm, t = 1.0 h). (d) Fluorescence lifetime curves and its fitting curve of (S)-5 (10 μM) with the addition of 1.0 eq. Zn2+ and 5.0 eq. L-Arg, MeOH:H2O = 94:6 (λex = 265 nm, λem = 470 nm, slit width = 5.0/5.0 nm, t = 1.0 h). :H2O = 94:6 (λex = 265 nm, λem = 470 nm, slit width = 5.0/5.0 nm, t = 1.0 h). (b) Fluorescence peak intensity of (S)-5 (10 μM) with the addition of 1.0 eq. Zn2+ and 5.0 eq. D-/L-amino acids, MeOH:H2O = 94:6 (λex = 265 nm, λem = 470 nm, slit width = 5.0/5.0 nm, t = 1.0 h). (c) Fluorescence lifetime curves and its fitting curve of (R)-5 (10 μM) with the addition of 1.0 eq. Zn2+ and 5.0 eq. D-Arg, MeOH:H2O = 94:6 (λex = 265 nm, λem = 470 nm, slit width = 5.0/5.0 nm, t = 1.0 h). (d) Fluorescence lifetime curves and its fitting curve of (S)-5 (10 μM) with the addition of 1.0 eq. Zn2+ and 5.0 eq. L-Arg, MeOH:H2O = 94:6 (λex = 265 nm, λem = 470 nm, slit width = 5.0/5.0 nm, t = 1.0 h). | ||
To further validate the chiral recognition of Arg, we utilized the enantiomer (S)-5 of (R)-5 as a fluorescent probe. Under analogous experimental conditions, we observed the fluorescence “turn-on” phenomenon induced by L-Arg (as depicted in Fig. 1b). A close mirror relationship between the enantiomeric forms of the probe is evident. The maximum ef of probe (S)-5 for D-/L-Arg was determined to be 60.4 at an emission wavelength of 470 nm.
The fluorescence lifetime of the fluorescent probe for Arg recognition was assessed using a steady-state/transient fluorescence spectrometer (PL). We observed a fluorescence lifetime of 7.87 ns for probe (R)-5 upon activation with D-Arg and 8.13 ns for probe (S)-5 upon activation with L-Arg, as shown in Fig. 1c and d. The short fluorescence lifetime of the fluorescent probe suggested that it possesses the advantages of rapid response, high sensitivity, reduced background interference, and suitability for kinetic studies on short time scales.
The results demonstrated that in the presence of Zn2+, both probe (R)-5 and probe (S)-5 exhibited remarkably strong recognition of specific configurations of Arg, with probe (S)-5 displaying a higher enantioselective fluorescence enhancement ratio for Arg than probe (R)-5. The fluorescence response offered a highly selective and sensitive method for the detection of chiral Arg molecules.
3.2 Effect of reaction time and equivalent of Arg on fluorescence intensity
In addition to investigating the fluorescence response, we explored the impact of reaction time on the fluorescence intensity following the interaction of the fluorescent probe with Arg. Changes in the ef of D-/L-Arg for different reaction times of (R)-5 and (S)-5 were calculated (depicted in Fig. 2a). The results demonstrated that, as the reaction time increased, the ef exhibited a significant increment within the initial 20 minutes, followed by a deceleration after 30 minutes, ultimately reaching the maximum value at 60 minutes. These findings indicated that the reaction kinetics of chiral recognition were influenced by the appropriate reaction time, facilitating more effective identification and complex formation between the probe and Arg. Consequently, these observations offered valuable insights into the optimal reaction conditions and requisite reaction times to achieve maximal chiral recognition utilizing fluorescent probes (R)-5 and (S)-5. | ||
| Fig. 2 (a) ef of (R)-5/(S)-5 (10 μM) with the addition of 1.0 eq. Zn2+ and 5.0 eq. D-/L-Arg, MeOH:H2O = 94:6 (λex = 265 nm, λem = 470 nm, slit width = 5.0/5.0 nm). (b) Fluorescence intensity ratio of (R)-5/(S)-5 (10 μM) with the addition of 1.0 eq. Zn2+ and varying equivalents of D-/L-Arg, MeOH:H2O = 94:6 (λex = 265 nm, λem = 470 nm, slit width = 5.0/5.0 nm, t = 1.0 h). (c) Fluorescence intensity of (R)-5 (10 μM) with the addition of 1.0 eq. Zn2+ and 30.0 eq. D-/L-Arg, MeOH:H2O = 94:6 (λex = 265 nm, λem = 450–700 nm, slit width = 5.0/5.0 nm, t = 1.0 h). (d) Fluorescence intensity of (S)-5 (10 μM) with the addition of 1.0 eq. Zn2+ and 30.0 eq. D-/L-Arg, MeOH:H2O = 94:6 (λex = 265 nm, λem = 450–700 nm, slit width = 5.0/5.0 nm, t = 1.0 h). | ||
Furthermore, we investigated the relationship between the equivalent of Arg and the ef. The ef of the probes under varying equivalent of D-/L-Arg conditions were determined, revealing intriguing patterns, as shown in Fig. 2b. Initially, under low-equivalent of D-/L-Arg conditions, the fluorescence intensity exhibited a notable increase with rising equivalent of Arg, suggesting that the interaction between the fluorescent probe and Arg led to fluorescence enhancement. Moreover, this indicated that the fluorescence signal became stronger with higher concentrations of Arg. However, when the equivalent of Arg exceeded 30.0 eq., the ef started to decrease, suggesting the presence of a saturation point or an optimal equivalent range for achieving maximum fluorescence enhancement. In essence, there existed an upper limit to the extent of fluorescence enhancement achievable solely by increasing Arg concentration. These findings underscored the significance of striking a balance between Arg equivalents and the ensuing fluorescence reactions to ensure precise and dependable measurements.
Fig. 2c and d showed the fluorescence emission spectra of the (R)-5 and (S)-5 pairs of Arg enantiomers at efmax, respectively. These spectra visually represented the variations in fluorescence response at different emission wavelengths. The efmax of (R)-5 and (S)-5 for Arg were determined to be 1694 and 5163, respectively, in the presence of 1.0 eq. Zn2+ and 30.0 eq. D-/L-Arg for 1.0 hours. The observed maxima signified that Arg at the optimal concentration exhibited the highest selectivity of the probe, highlighting the potential of using these fluorescent probes to detect and discriminate between different concentrations of Arg enantiomers.
3.3 A standard curve for fluorescence intensity as a function of the equivalent of D- Arg or L-Arg
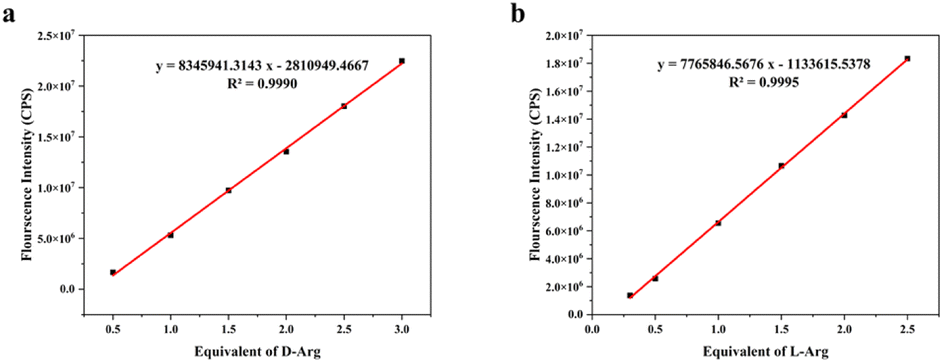
As depicted in Fig. 3a and b, the fluorescence intensities of D-Arg and probe (R)-5, as well as L-Arg and probe (S)-5, exhibited strong linear correlations with the equivalent of Arg in the low range. This linear association enabled accurate determination of unknown solution concentration of Arg based on fluorescence intensity responses. For D-Arg, the fluorescence intensity gradually increased with rising amounts of D-Arg within the linear range of 0.5 to 3.0 eq., corresponding to concentrations of 5 to 30 μM. The linear fitting equation for D-Arg was y = 8345941.3143x − 2810949.4667 (x represents the concentration of D-Arg), with a coefficient of determination (R2) of 0.9990, a limit of detection (LOD, LOD = 3.3SD/k) of 4.84 × 10⁻⁷ M, and a binding constant (Kd) of 1.75 × 10⁻⁵ M. Similarly, for L-Arg, the fluorescence intensity also increased with the amount of L-Arg within the linear range of 0.3 to 2.5 eq., corresponding to concentrations of 3 to 25 μM. The linear fitting equation for L-Arg was y = 7765846.5676x − 1133615.5378, with an R2 value of 0.9995, an LOD of 3.35 × 10⁻⁷ M, and a binding constant Kd of 1.94 × 10⁻⁵ M. The detection range and binding constant demonstrated a high level of performance for the fluorescent probes. The detection range encompassed a wide range of concentrations, from low to high, of the target molecule. Additionally, the binding constant reflected the probe's affinity for the target molecule, indicating the high sensitivity and selectivity of the probe.
 | ||
| Fig. 3 (a) Fluorescence intensity curve of (R)-5 (10 μM) with the addition of 1.0 eq. Zn2+ and varying equivalents of D-Arg, MeOH:H2O = 94:6 (λex = 265 nm, λem = 470 nm, slit width = 5.0/5.0 nm, t = 1.0 h). (b) Fluorescence intensity curve of (S)-5 (10 μM) with the addition of 1.0 eq. Zn2+ and varying equivalents of L-Arg, MeOH:H2O = 94:6 (λex = 265 nm, λem = 470 nm, slit width = 5.0/5.0 nm, t = 1.0 h). | ||
The concentration of D-Arg demonstrated a highly linear correlation with the fluorescence intensity of (R)-5, while the concentration of L-Arg exhibited a highly linear correlation with the fluorescence intensity of (S)-5, both of which featured remarkably low detection limits. These fitted curves offered a reliable method for determining unknown solution concentrations based on the respective fluorescence intensity responses of D-Arg and L-Arg. These findings underscored the potential utility of fluorescent probes (R)-5 and (S)-5 as dependable tools for the quantitative analysis of D-Arg and L-Arg, respectively.
3.4 A standard curve for fluorescence intensity as a function of enantiomeric excess (ee) value of Arg
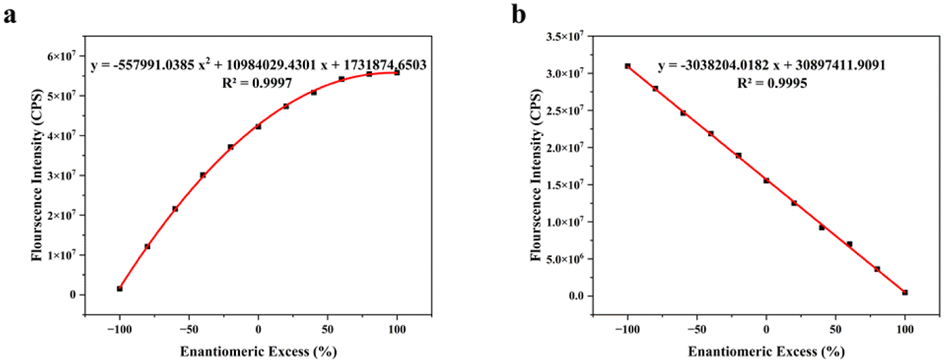
In this investigation, we examined the variations in fluorescence intensity of the probe (R)-5/(S)-5 in Arg with differing ee value. The results revealed a discernible association between the ee value of Arg and the fluorescence intensity. As shown in the Fig. 4, in the presence of probe (R)-5, the fluorescence intensity exhibited a quadratic correlation with the ee value of Arg. This correlation was accurately modeled by the equation y = −557991.0385x2 + 10984029.4301x + 1731874.6503 (y represents the fluorescence intensity and x represents the ee value of Arg), the R2 value for the quadratic fit was 0.9997, indicating a robust quadratic relationship between the ee value of Arg and the fluorescence intensity of (R)-5, as shown in Fig. 4a.
 | ||
| Fig. 4 (a) Fluorescence intensity of (R)-5 (10 μM) in the presence of 1.0 eq. Zn2+ and 5.0 eq. Arg, MeOH:H2O = 94:6 (λex = 265 nm, λem = 470 nm, slit = 5.0/5.0 nm, t = 1.0 h). (b) Fluorescence intensity of (S)-5 (10 μM) in the presence of 1.0 eq. Zn2+ and 5.0 eq. Arg, MeOH:H2O = 94:6 (λex = 265 nm, λem = 470 nm, slit = 5.0/5.0 nm, t = 1.0 h). | ||
Conversely, with the probe (S)-5, a linear relationship was observed between the fluorescence intensity and the Arg ee value. The equation for this linear fit was y = −3038204.0182x + 30897411.9091, the R2 value of 0.9995 for this linear fit indicated a strong linear correlation between the ee value of Arg and the fluorescence intensity of (S)-5, as shown in Fig. 4b.
The fluorescence response of the actual data obtained from the fitting curve aligns closely with the research findings. These calibration curves enabled accurate determination of the ee value of Arg. Notably, the fluorescence intensity of unknown samples can be compared with these fitted curves to precisely quantify the Arg ee value. These results underscore the potential for precise determination of ee value of Arg utilizing fluorescent probes (R)-5 and (S)-5. This represented a valuable tool for chiral analysis and determination of enantiomer purity, particularly within the realms of pharmaceutical and chemical synthesis.
3.5 The binding mechanism between fluorescence probes (R)-5 with D-Arg and (S)-5 with L-Arg
In this study, we explored the recognition of Arg by probes (R)-5 and (S)-5 using UV-vis spectroscopy. Upon the addition of D-Arg or L-Arg, significant changes in UV absorption at 230 nm and 258 nm were observed, as depicted in Fig. 5a and b. The probe displayed a prominent absorption peak at 230 nm, while no substantial absorption peak was detected for Arg within the 200 to 500 nm range. However, a new absorption peak emerged at 275 nm, indicating the formation of imine products between the probe and Arg. These alterations in UV peaks suggested the occurrence of Schiff base synthesis during recognition.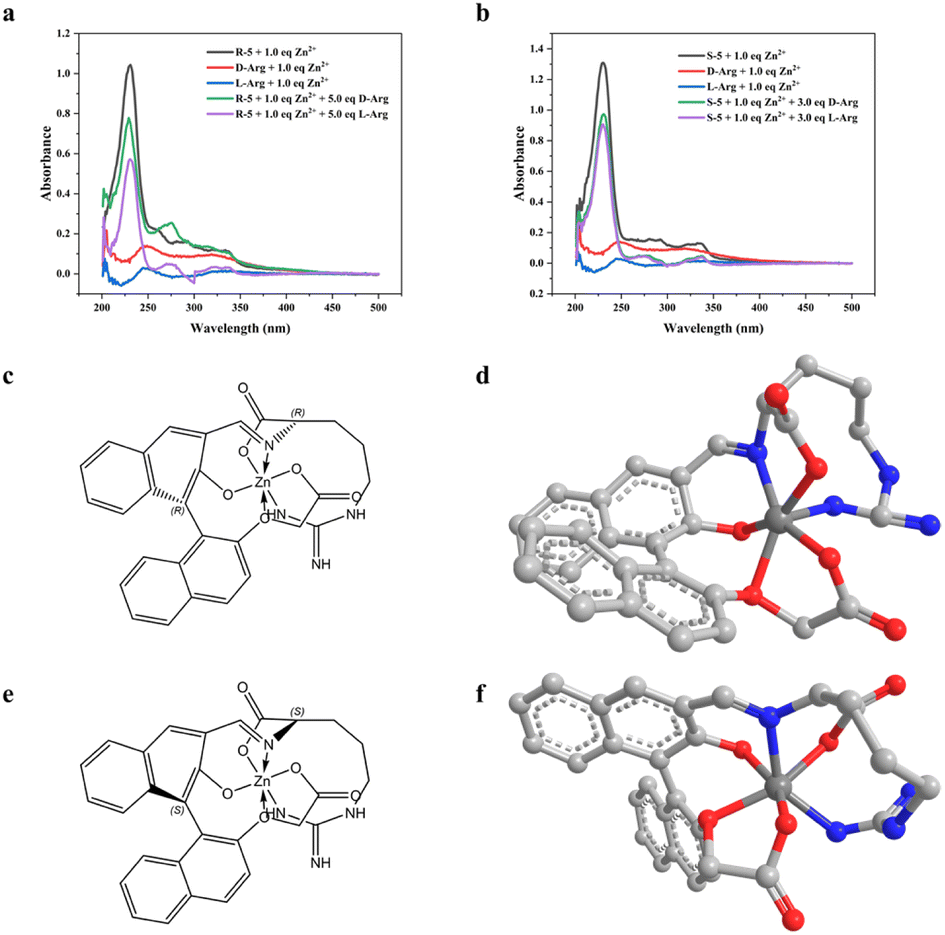 | ||
| Fig. 5 (a) UV-vis absorption (R)-5 (10 μM) with the addition of 1.0 eq. Zn2+, 5.0 eq. D-/L-Arg, and control group, MeOH:H2O = 94:6. (λex = 265 nm, λem = 470 nm, slit width = 5.0/5.0 nm, t = 1.0 h). (b) Fluorescence intensity of (S)-5 (10 μM) with the addition of 1.0 eq. Zn2+, 5.0 eq. D-/L-Arg, and control group, MeOH:H2O = 94:6. (λex = 265 nm, λem = 470 nm, slit width = 5.0/5.0 nm, t = 1.0 h). (c) The complex structure of probe (R)-5 binding with D-Arg and Zn2+. (d) 3D structure of the complex of (R)-5 binding with D-Arg and Zn2+. (e) The complex structure of probe (S)-5 binding with L-Arg and Zn2+. (f) 3D structure of the complex of (S)-5 binding with L-Arg and Zn2+. | ||
Furthermore, we delved into the binding of probe (R)-5 to D-/L-Arg and probe (S)-5 to D-/L-Arg in the presence of Zn2+ in methanol solution. Analysis via mass spectrometry revealed the formation of [M + Na]+ ions at 611.09873 for (R)-5 and D-Arg, and at 611.07646 for (S)-5 and L-Arg. These observations suggested that the α-NH2 group of Arg underwent a Schiff base reaction with the aldehyde group of the probe, forming a compound coordinated with the Zn2+. Zn2+ interacted with various atoms, including the carboxy O atom of Arg, the carboxy O atom of the probe, the phenolic hydroxyl O atom of the probe, the N atom of the Schiff base, the ether O atom, and the guanidine NH2 group of Arg, resulting in the formation of an octahedral structure. It's akin to the classical recognition mechanism based on BINOL structure for chiral amino acids. The structures of probes when them recognized Arg and complexated with Zn2+ was thus obtained, and the structure of the complex was shown in Fig. 5c–f.
Our results led us to propose that the chiral recognition exhibited by the probe towards basic amino acids such as Arg and His, but not Gln, stems from the presence of a N atom at a specific distance from the α-C atom. This N atom played a pivotal role in facilitating the formation of a complex between the Zn2+ and the Schiff base, which was generated through the reaction between the probe and Arg. Specifically, only the complexation induced by a certain chirality activated the fluorescence emission.
Both Arg and His shared a common feature: the presence of a N atom positioned six bonds away from the α-C atom. This unique arrangement enabled the probe to exhibit chiral recognition for these amino acids. Moreover, interactions between (R)-5/(S)-5, Zn2+, and these amino acids enhanced the rigidity of the naphthyl structure. This constrained rotational flexibility promoted fluorescence emission by preventing nonradiative pathways such as ring rotation.
In conclusion, our findings suggested that the specific position of the N atom relative to the α-NH2 group in basic amino acids was pivotal for the chiral recognition capability of the probe. This insight not only elucidated the mechanism behind the fluorescence response but also laid the groundwork for further applications in chiral analysis and other related fields.
4 Conclusion
In conclusion, we successfully developed a pair of chiral fluorescent probes composed of 2-acetate and 3′-aldehyde substituted BINOL derivatives. These probes exhibited enantiomeric selectivity and sensitivity to D-Arg/L-Arg in fluorescence experiments. They effectively recognized Arg in methanol solution, demonstrating high chemical selectivity and enantioselectivity. Notably, the fluorescent probes exhibited very short fluorescence lifetimes. Our comprehensive studies utilizing UV-vis, NMR, and mass spectrometry lend strong support to the idea that the high chemical selectivity of the fluorescent probe for recognizing Arg can be attributed to the presence of an N atom six bonds apart from the amino acid α-C atom. This unique structural arrangement enables the probe to achieve chiral recognition of specific configurations of Arg. The complex formed through the mutual interaction between (R)-5/(S)-5, Zn2+, and Arg exhibits exceptional rigidity, thereby promoting fluorescence emission by constraining non-radiative pathways such as ring rotation. The outcomes of our study offer a highly sensitive method with a low-detection limit for fluorescence detection of Arg, enabling the identification of different configurations of Arg, quantification of Arg concentrations, and determination of the enantiomeric composition of Arg. These findings significantly contribute to our understanding of the relationship between Arg concentration and probe fluorescence response, providing valuable insights for the development of sensitive and selective chiral molecular detection methods.Author contributions
Jiawei Xu: experimental operation, writing, conceptualization, software. Fangling Cao: experimental operation, visualization, software. Chenxiang Lu: experimental operation. Zhe Song: testing and analysis. Zhenya Dai: funding acquisition, project administration, supervision.Conflicts of interest
The authors disclaim that they have no known competing financial interests or personal relationships that might influence the work reported herein.Acknowledgements
We were thankful to the National Natural Science Foundation of China for their financial support (no. 21102180).Notes and references
- H. Heli, N. Sattarahmady and M. Hajjizadeh, Anal. Methods, 2014, 6, 6981–6989 RSC.
- H. Tapiero, G. Mathé, P. Couvreur and K. D. Tew, Biomed. Pharmacother., 2002, 56, 439–445 CrossRef CAS PubMed.
- J. Gambardella, W. Khondkar, M. B. Morelli, X. Wang, G. Santulli and V. Trimarco, Biomedicines, 2020, 8, 277–302 CrossRef CAS PubMed.
- B. Szende, E. Tyihák and L. Trézl, Cancer Cell Int., 2001, 1, 3 CrossRef PubMed.
- M. D. Shmueli, L. Levy-Kanfo, E. Haj, A. R. Schoenfeld, E. Gazit and D. Segal, Oncogene, 2019, 38, 1038–1049 CrossRef CAS PubMed.
- M. A. Vermeulen, M. C. van de Poll, G. C. Ligthart-Melis, C. H. Dejong, M. P. van den Tol, P. G. Boelens and P. A. van Leeuwen, Crit. Care Med., 2007, 35, S568–S576 CrossRef CAS PubMed.
- J. K. Stechmiller, B. Childress and L. Cowan, Nutr. Clin. Pract., 2005, 20, 52–61 CrossRef PubMed.
- M. B. Witte and A. Barbul, Wound Repair Regen., 2003, 11, 419–423 CrossRef.
- C.-L. Chen, S.-C. Hsu, T.-Y. Chung, C.-Y. Chu, H.-J. Wang, P.-W. Hsiao, S.-D. Yeh, D. K. Ann, Y. Yen and H.-J. Kung, Nat. Commun., 2021, 12, 2398 CrossRef CAS.
- B. Kelly and E. L. Pearce, Cell Metab., 2020, 32, 154–175 CrossRef CAS.
- A. D'Aniello, Brain Res. Rev., 2007, 53, 215–234 CrossRef.
- W. Pu, H. Zhao, C. Huang, L. Wu and D. Xu, Anal. Chim. Acta, 2013, 764, 78–83 CrossRef CAS.
- S. Sivanand and M. G. Vander Heiden, Cancer Cell, 2020, 37, 147–156 CrossRef CAS PubMed.
- S. Martínez-Rodríguez, A. I. Martínez-Gómez, F. Rodríguez-Vico, J. M. Clemente-Jiménez and F. J. Las Heras-Vázquez, Chem. Biodiversity, 2010, 7, 1531–1548 CrossRef.
- G. Jágerszki, Á. Takács, I. Bitter and R. E. Gyurcsányi, Angew. Chem., Int. Ed., 2011, 50, 1656–1659 CrossRef.
- J. Zhang, M. T. Albelda, Y. Liu and J. W. Canary, Chirality, 2005, 17, 404–420 CrossRef CAS.
- Z. A. Carter and R. Kataky, Sens. Actuators, B, 2017, 243, 904–909 CrossRef CAS.
- X. Shang, L. Luo, K. Ren, X. Wei, Y. Feng, X. Li and X. Xu, Mater. Sci. Eng., C, 2015, 51, 279–286 CrossRef CAS PubMed.
- S. Chen, J. Tian, Y. Jiang, Y. Zhao, J. Zhang and S. Zhao, Anal. Chim. Acta, 2013, 787, 181–188 CrossRef CAS.
- Q. Wang, Z. Pu, Y. Wang and M. Li, Opt. Mater., 2023, 136, 113415 CrossRef CAS.
- K. Berketa, O. Saiapina, L. Fayura, A. Sibirny, S. Dzyadevych and O. Soldatkin, Sens. Actuators, B, 2022, 367, 132023 CrossRef CAS.
- J.-J. Xu, Y. Peng, N. Bao, X.-H. Xia and H.-Y. Chen, J. Chromatogr. A, 2005, 1095, 193–196 CrossRef CAS PubMed.
- H. Yuan, Y. Huang, J. Yang, Y. Guo, X. Zeng, S. Zhou, J. Cheng and Y. Zhang, Spectrochim. Acta, Part A, 2018, 200, 330–338 CrossRef CAS PubMed.
- L. Pu, Angew Chem. Int. Ed. Engl., 2020, 59, 21814–21828 CrossRef CAS PubMed.
- J. Formen and C. Wolf, Angew Chem. Int. Ed. Engl., 2021, 60, 27031–27038 CrossRef CAS PubMed.
- H.-L. Liu, Q. Peng, Y.-D. Wu, D. Chen, X.-L. Hou, M. Sabat and L. Pu, Angew. Chem., Int. Ed., 2010, 49, 602–606 CrossRef CAS PubMed.
- B. T. Herrera, S. L. Pilicer, E. V. Anslyn, L. A. Joyce and C. Wolf, J. Am. Chem. Soc., 2018, 140, 10385–10401 CrossRef CAS PubMed.
- Y. Y. Zhu, X. D. Wu, S. X. Gu and L. Pu, J. Am. Chem. Soc., 2019, 141, 175–181 CrossRef CAS PubMed.
- J. N. Martins, J. C. Lima and N. Basílio, Molecules, 2021, 26, 106–145 CrossRef CAS PubMed.
- X. Zhang, Q. Yu, W. Lu, S. Chen and Z. Dai, Tetrahedron Lett., 2017, 58, 3924–3927 CrossRef CAS.
- X. Zhang, Q. Yu, S. Chen and Z. Dai, New J. Chem., 2018, 42, 4045–4051 RSC.
- Q. Yu, W. Lu, Z. Ding, M. Wei and Z. Dai, J. Chem. Res., 2019, 43, 340–346 CrossRef CAS.
- X. Yu, B. Zhang, P. Liao, J. Huang, C. Fan, H. Hu, Q. Dong, G. Du, Y. Gao and C. Zeng, Dyes Pigm., 2022, 203, 110339 CrossRef CAS.
- B. Huo, K. Lu, J. Tian, F. Zhao, Y. Wang, S. Yu, X. Yu and L. Pu, J. Org. Chem., 2021, 86, 6780–6786 CrossRef CAS PubMed.
- M. E. Shirbhate, Y. Jeong, G. Ko, G. Baek, G. Kim, Y.-U. Kwon, K. M. Kim and J. Yoon, Dyes Pigm., 2019, 167, 29–35 CrossRef CAS.
- G. Du and L. Pu, Org. Lett., 2019, 21, 4777–4781 CrossRef CAS PubMed.
- X. Chen, Z. Huang, S.-Y. Chen, K. Li, X.-Q. Yu and L. Pu, J. Am. Chem. Soc., 2010, 132, 7297–7299 CrossRef CAS PubMed.
- G. Du, Y. Mao, M. A. Abed and L. Pu, Mater. Chem. Front., 2020, 4, 2384–2388 RSC.
- Z. Huang, S. Yu, K. Wen, X. Yu and L. Pu, Chem. Sci., 2014, 5, 3457–3462 RSC.
- J. Tian, Y. Wang, Y. Chen, F. Zhao, Y. Jiang, S. Yu, X. Yu and L. Pu, Chem. Commun., 2020, 56, 15012–15015 RSC.
Footnote |
| † Electronic supplementary information (ESI) available. See DOI: https://doi.org/10.1039/d3ra07890f |
| This journal is © The Royal Society of Chemistry 2024 |