DOI:
10.1039/D3RA07642C
(Paper)
RSC Adv., 2024,
14, 4221-4229
Synthesis, characterization and NLO properties of 1,4-phenylenediamine-based Schiff bases: a combined theoretical and experimental approach†
Received
8th November 2023
, Accepted 1st January 2024
First published on 30th January 2024
Abstract
In the current study, three novel 1,4-phenylenediamine-based chromophores (3a–3c) were synthesized and characterized and then their nonlinear optical (NLO) characteristics were explored theoretically. The characterization was done by spectroscopic analysis, i.e. FT-IR, UV-Visible, and NMR spectroscopy, and elemental analysis. Notably, these chromophores exhibited UV-Visible absorption within the range of 378.635–384.757 nm in acetonitrile solvent. Additionally, the FMO findings for 3a–3c revealed the narrowest band gap (4.129 eV) for 3c. The GRPs for these chromophores were derived from HOMO–LUMO energy values, which showed correspondence with FMO results by depicting a minimum hardness (2.065 eV) for 3c. Among these compounds, 3c displayed the highest nonlinear behavior with maximum μtot, βtot and γtot values of 4.79 D, 8.00 × 10⁻³⁰ and 8.13 × 10⁻³⁴ a.u., respectively. Our findings disclosed that the synthesized 1,4-phenylenediamine chromophores may be considered promising candidates for nonlinear optical materials, showing potential applications in the realm of optoelectronic devices.
1. Introduction
Schiff bases are vital chemical compounds in the fields of organic, nonliving, analytical and therapeutic chemistry due to their flexibility1 and structural diversity. Schiff bases can be produced by the reaction of a carbonyl group of either ketone or aldehyde with primary amines.2 Schiff bases are also called azomethines or imines owing to the presence of a C![[double bond, length as m-dash]](https://www.rsc.org/images/entities/char_e001.gif) N chromophore.3 Different analogues of Schiff bases have been used in normal life sciences due to their anticancer,4 antimicrobial,5,6 antimalarial,7 antifungal,8 antibacterial9 and antioxidant10 potential. Moreover, they serve as a catalyst for different reactions like the reduction of thionyl chloride,11 an aldol condensation reaction,12 the hydrogenation of olefins,13 the ability to bind oxygen in epoxidation reactions,14 and photochromic properties,15 as well as acting as corrosion inhibitors for various metals like steel, aluminum and copper.16 Additionally, they can be employed as chelating agents in foodstuffs.17 Schiff bases play an important role as an NLO active material due to their property of solvatochromicity.18,19 The innovations of solid-phase extraction techniques20 and ion-selective electrodes for identifying anions in analytical experiments could both benefit from these ligands.21
N chromophore.3 Different analogues of Schiff bases have been used in normal life sciences due to their anticancer,4 antimicrobial,5,6 antimalarial,7 antifungal,8 antibacterial9 and antioxidant10 potential. Moreover, they serve as a catalyst for different reactions like the reduction of thionyl chloride,11 an aldol condensation reaction,12 the hydrogenation of olefins,13 the ability to bind oxygen in epoxidation reactions,14 and photochromic properties,15 as well as acting as corrosion inhibitors for various metals like steel, aluminum and copper.16 Additionally, they can be employed as chelating agents in foodstuffs.17 Schiff bases play an important role as an NLO active material due to their property of solvatochromicity.18,19 The innovations of solid-phase extraction techniques20 and ion-selective electrodes for identifying anions in analytical experiments could both benefit from these ligands.21
The aim of NLO is to describe the reaction to an applied electric field.22,23 Electro-optics for signal processing and frequency variations,24 particularly in telecommunications,25 information technology and fiber optics, benefit greatly from the use of NLO compounds.21,26 They tend to allow structural alterations to enable a range of NLO behaviors due to their simple chemistry and inexpensive cost of production.24 Recent research has focused on NLO materials established from organic networks.27 Intramolecular charge transfer (ICT) from donating (D) to accepting (A) moieties of electrons via conjugation is a valuable property of NLO organic materials.28–30 Computational and experimental data indicate that a broad second-order NLO response can be managed by introducing strong D and A groups on the spacer's paradoxical sides, i.e., A–D–A, D–D–A and D–A.31 Charge transfer can be improved by compounds with delocalized electrons in a D–A configuration.32 When subjected to intense laser light, NLO materials are responsible for a broad range of applicability due to their exciting photo-physical behavior.33 There is a lot of interest in improving synthetic organic compounds to have a quick response rate, a better laser impairment approach, a higher photo-electrical quantum yield,34 a small dielectric constant,35 construction flexibility, and low improvement cost.36,37 This report focuses on creating various new 1,4-phenylenebis(azaneylylidene)bis(methaneylylidene)-based compounds. The characterization of these compounds was accomplished by employing a variety of spectroscopic techniques. The DFT method was utilized to thoroughly investigate their optoelectronic properties.
2. Experimental section
2.1 Chemistry
All manipulations were carried out with chemicals from Sigma-Aldrich in pure form. Elemental analyses were performed on a PerkinElmer 2400 Combustion CHN Analyzer. IR spectra on solid samples were obtained using an FT-IR IFS48 spectrophotometer. The NMR spectra were obtained in DMSO-d6 solvent using a Bruker AVANCE III HD 400 MHz instrument. The NMR spectra are given in terms of tetramethyl silane (=0 ppm). The progress and completion of the reaction were monitored by TLC.
2.2 General procedure for the synthesis of ρ-phenylenediamine derivatives
Schiff bases 3a–3c were prepared by the condensation reaction of ρ-phenylenediamine with corresponding aromatic aldehydes and ketones in a molar ratio of 1![[thin space (1/6-em)]](https://www.rsc.org/images/entities/char_2009.gif) :2. This synthesis was performed by adding ρ-phenylenediamine (1) (0.2 g, 0.002 mmol) to the respective ketone or aldehyde (2a–c) (0.004 mmol), refluxed in 15 ml of hot ethanol with a catalytic amount of acetic acid (CH3COOH) for 5 to 15 hours at 70 to 80 °C. The solid precipitates were separated through filtration, rinsed with both warm and cold ethanol and ultimately air-dried at room temperature. The resulting colored products 3a–3c were obtained in good yield. These compounds have also been reported elsewhere38–40 for other applications.
:2. This synthesis was performed by adding ρ-phenylenediamine (1) (0.2 g, 0.002 mmol) to the respective ketone or aldehyde (2a–c) (0.004 mmol), refluxed in 15 ml of hot ethanol with a catalytic amount of acetic acid (CH3COOH) for 5 to 15 hours at 70 to 80 °C. The solid precipitates were separated through filtration, rinsed with both warm and cold ethanol and ultimately air-dried at room temperature. The resulting colored products 3a–3c were obtained in good yield. These compounds have also been reported elsewhere38–40 for other applications.
The targeted compounds were characterized as follows.
2.2.1 2,2′-((1E,1′E)-(1,4-phenylenebis(azanylylidene))bis(methanylylidene))diphenol (3a). Yield 85%, m.p. 219–220 °C; (UV-Vis): λmax = 366 nm (acetonitrile), 364 nm (methanol); FT-IR (cm−1): 1568 cm−1 (CN), 3050 cm−1 (OH); 1H NMR (400 MHz, DMSO) δ 13.07 (s, 1H), 9.04 (s, 1H), 7.68 (dd, J = 7.7, 1.6 Hz, 1H), 7.55 (s, 2H), 7.43 (ddd, J = 8.3, 7.4, 1.7 Hz, 1H), 7.00 (ddd, J = 10.9, 6.0, 2.2 Hz, 2H). 13C NMR (101 MHz, DMSO) δ 163.64, 160.77, 147.16, 133.83, 133.05, 123.04, 119.85, 119.69, 117.10: Anal. calcd for C20H16N2O2 (316.35); C, 75.93; H, 5.10; N, 8.86; found; C, 75.89; H, 5.14; N, 8.96.
2.2.2 6,6′-((1E,1′E)-(1,4-phenylenebis(azanylylidene))bis(methanylylidene))bis(2-ethoxyphenol) (3b). Yield 73%, m.p. 189–190 °C; UV-Vis: λmax = 416 (acetonitrile), 414 (methanol); FT-IR (cm−1): 1604 cm−1 (CN), (OH); 1H NMR (400 MHz, DMSO) δ 13.27 (s, 1H), 9.03 (s, 1H), 7.55 (s, 2H), 7.25 (dd, J = 7.9, 1.4 Hz, 1H), 7.13 (dd, J = 8.0, 1.3 Hz, 1H), 6.91 (t, J = 7.9 Hz, 1H), 4.09 (q, J = 7.0 Hz, 2H), 1.36 (t, J = 7.0 Hz, 3H);13 NMR (101 MHz, DMSO) δ 163.85, 151.36, 147.52, 146.91, 124.60, 123.03, 119.84, 119.14, 117.54, 64.61, 15.27; Anal. calcd for C24H24N2O4 (404.46); C, 71.27; H, 5.98; N, 6.93; found; C, 71.23; H, 5.94; N, 6.99.
2.2.3 4,4′-((1E,1′E)-(1,4-phenylenebis(azanylylidene))bis(methanylylidene))bis(benzene-1,3-diol) (3c). Yield 80%: m.p. 259–260 °C; UV-Vis: λmax = 374 nm (acetonitrile), 380 nm (methanol); FT-IR (cm−1): 1596 cm−1 (CN), 3223 cm−1 (OH); 1H NMR (500 MHz, DMSO-d6) 13.53 (1H, s), 10.24 (1H, s), 8.83 (1H, s), 7.42 (3H, d, J 8.4), 6.40 (1H, dd, J 8.5, 2.3), 6.30 (1H, d, J 2.3); 13C NMR (126 MHz, DMSO) δ 163.20, 162.64, 162.15, 146.28, 134.56, 122.24, 112.31, 108.08, 102.56. Anal. calcd for C20H16N2O4 (348.35); C, 68.96; H, 4.63; N, 8.04; found; C, 68.92; H, 4.66; N, 8.09.
2.3 Computational procedure
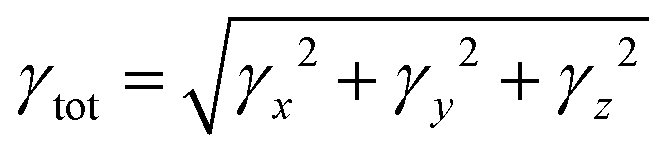
The 1,4-phenylenediamine-based compounds (3a–3c) with A–π–A configuration were optimized with the M06/6-311G(d,p)41 functional. Then in all other investigations, NBO and NLO were carried out at the above-mentioned level. All calculations were conducted utilizing the Gaussian 09 (ref. 42) software, and the results were examined through Gauss view 5.0.43 The absorption spectra, FMOs and global reactivity descriptors were determined by the TD-DFT method with the aforesaid functional in acetonitrile. The findings from the output files were analyzed using PyMOlyze,44 Chemcraft,45 Avogadro,46 GaussSum,47 Origin 8.0 (ref. 48) and Multiwfn 3.7 (ref. 49) software. Moreover, μtot,50 〈α〉,51 βtot52 and γtot53 were calculated through eqn (1)–(4).| | |
μ = (μx2 + μy2 + μz2)1/2
| (1) |
| | |
〈α〉 = 1/3(αxx + αyy + αzz)
| (2) |
| | |
βtot = [βx2 + βy2 + βz2]1/2
| (3) |
where, βx = βxxx + βxyy + βxzz, βy = βyyy + βxxy + βyzz and βz = βzzz + βxxz + βyyz.| |
 | (4) |
where, 
Global reactivity descriptors, such as global softness (σ), ionization potential (IP),32 global hardness (η),31 global electrophilicity index (ω),33 electronegativity (X),35 charge transfer rate (ΔNmax), chemical potential (μ)34 and electron affinity (EA) were determined using eqn (5)–(12).
| |
 | (7) |
| |
 | (9) |
| |
 | (10) |
| |
 | (11) |
| |
 | (12) |
2.4 Results and discussion
All synthesized Schiff bases were characterized by employing elemental and spectral analyses i.e., UV-Vis, FT-IR, 1H-NMR, and 13C-NMR spectroscopies (Fig. S1–S9†). Elemental analysis shows that the synthesized Schiff bases have (C, H, N) elements. UV-Vis absorption values were recorded in various solvents of different polarity, i.e., MeCN and methanol, providing information about the nature of the transitions and charge transfer capabilities of the synthesized compounds.54 The characteristic π–π* transition in –CN– was recorded. The value of the absorption is shifted bathochromically when the solvent polarity increases. The observed differences can be ascribed to an interaction involving hydrogen bonding between the molecules of the solute and the solvent. The FT-IR spectra provide information about the nature of the functional groups.55,56 The IR spectra of the synthesized compounds (3a–3c) show bands related to aromatic and aliphatic C–H stretching vibrations in the range 2835–3150 cm−1, while C–N and C–O stretching vibrations were detected in the range 1150–1630 cm−1. A sharp peak at 1568 cm−1 is due to (CC) stretching vibration. A medium band corresponding to the phenolic oxygen (C–O) appears within the range 1275–1298 cm−1. The IR spectra of 3a–3c show a band in the region 2987–3300 cm−1 due to –OH stretching vibration. A band in the range 1568–1605 cm−1 is observed due to (CN). 1H-NMR provides information about the resonance of protons based on their integration and multiplicity pattern. NMR spectroscopic measurements were made for 3a–c using TMS as the internal standard. In 1H-NMR, the –CHN signal appeared as a singlet around δ 8.96–9.05 ppm, another singlet appeared due to the OH group at δ 12.75–13.25 ppm. It is important to highlight that phenolic protons consistently exhibit a singular peak at elevated δ values, indicating their interaction with an adjacent nitrogen atom. In the range 7.00–8.50 ppm, a multiplet appeared due to the protons of the benzene ring. The free NH2 protons usually exhibit a wide singlet peak within the 4–6 ppm range. However, in the Schiff base spectrum under consideration, this signal is notably absent, suggesting the creation of a Schiff base. In the 13C-NMR spectra of 3a–3c in DMSO, the signal peak of the carbon atom is found at 155.7 ppm, indicating a double-bond character, whereas in the corresponding spectra of the synthesized Schiff bases the signal peak appears at 163.19 ppm, indicating CN character. After the structural confirmation of 3a–3c, quantum chemical calculations were accomplished with the M06/6-311G(d,p) functional of the DFT approach. The IUPAC names of the studied chromophores with A–π–A framework are: 2,2′-((1,4-phenylenebis(azaneylylidene))bis(methaneylylidene))diphenol (3a), 6,6′-((1E,1′E)-(1,4-phenylenebis(azaneylylidene))bis(methaneylylidene))bis(2-ethoxyphenol) (3b) and 4,4′-((1E,1′E)-(1,4-phenylenebis(azaneylylidene))bis(methaneylylidene))bis(benzene-1,3-diol) (3c). The end-capped acceptor moieties played a substantial part in achieving effective NLO-based chromophores.57 The structures of the titled compounds (3a–3c) are displayed in Fig. S10† and Scheme 1. Accompanying this, their Cartesian coordinates are presented in Tables S11–S13.† TD-DFT/DFT calculations were conducted in order to evaluate the influence of different acceptor variants on intra-molecular charge transfer, band gap, nonlinear response and absorption spectra (Scheme 2).
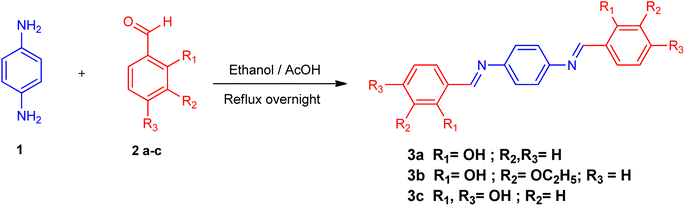 |
| | Scheme 1 Synthesis of ρ-phenylenediamine derivatives. | |
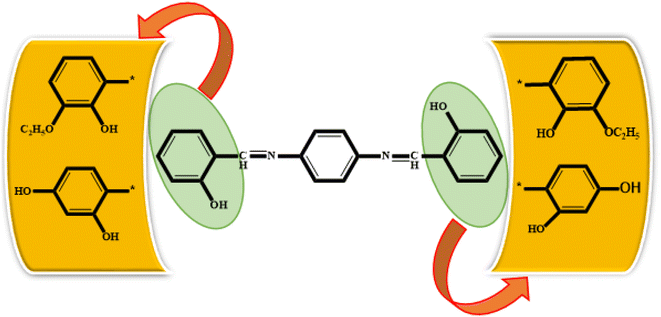 |
| | Scheme 2 Schematic representation of 3a, 3b and 3c molecules. | |
2.5 Frontier molecular orbital (FMO) analysis
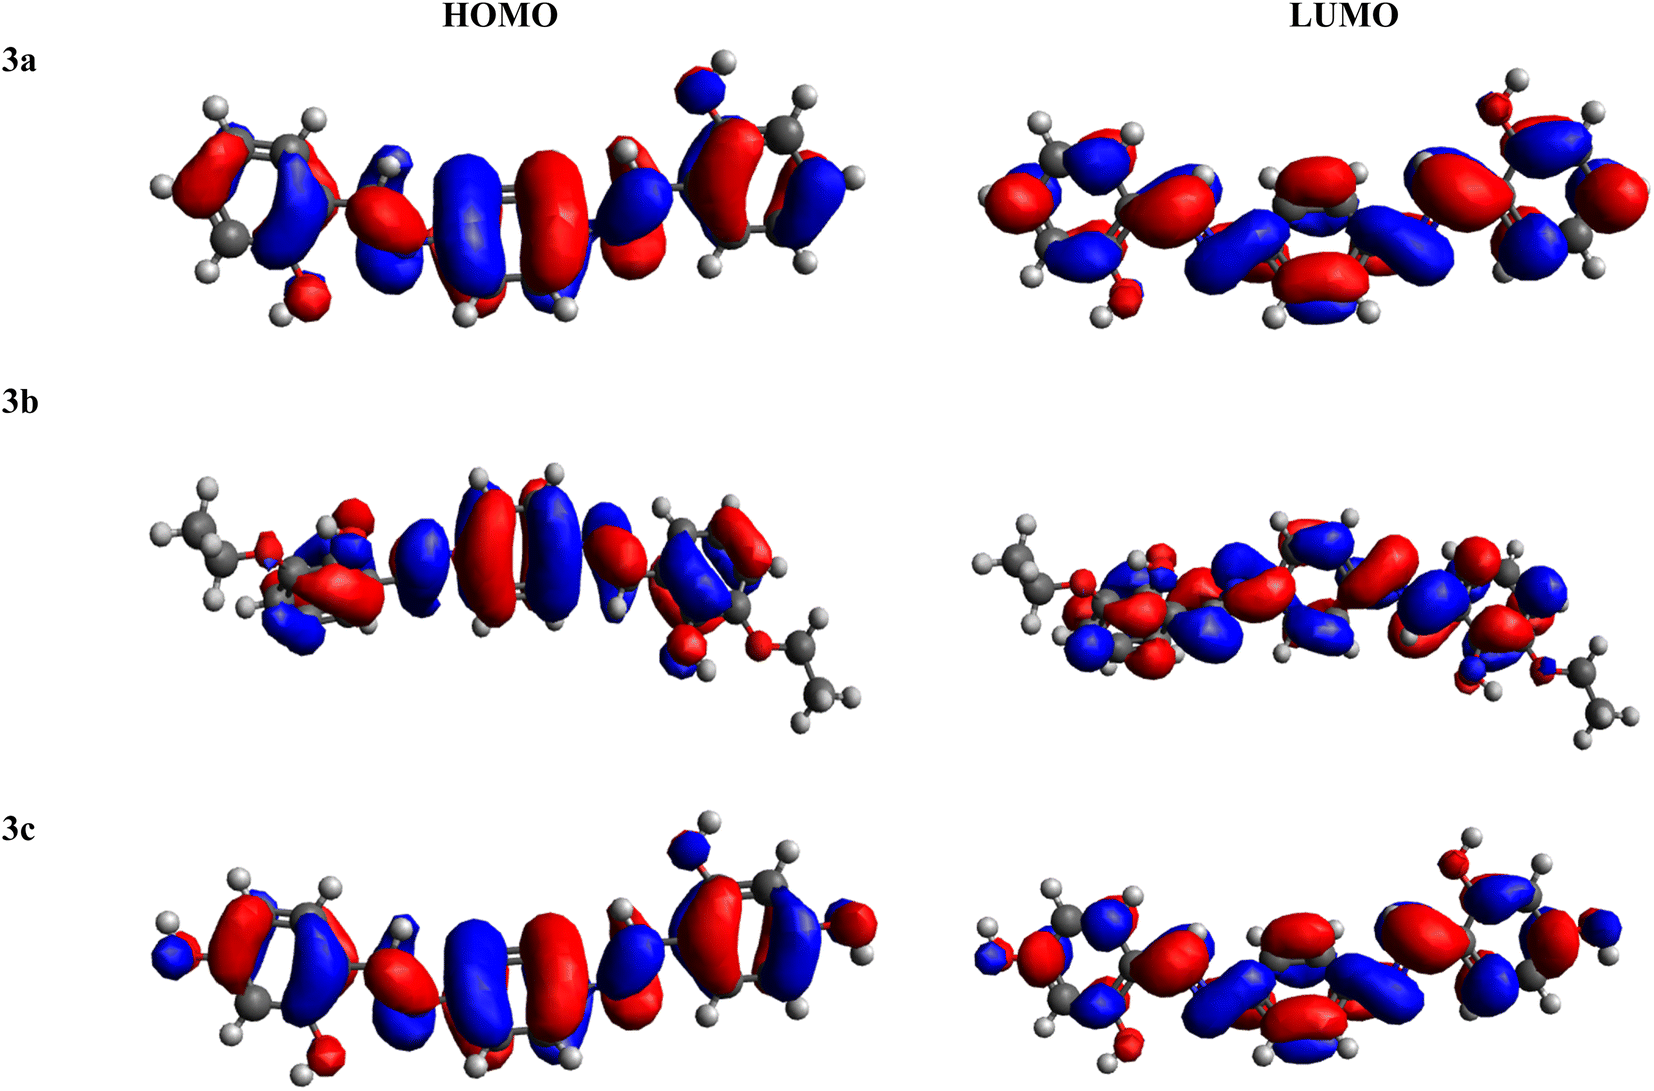
FMOs serve as crucial descriptors, collectively characterizing a molecule's optical and electronic properties, as well as its chemical reactivity.58–60 The HOMO and LUMO offer insights into the energy difference between the lowest energy state and the next higher energy state.33,61–63 Table 1 provides the HOMO and LUMO energy values, along with their respective energy differences. Further outcomes are illustrated in Table S1.†
Table 1 Energies (eV) of frontier molecular orbitals for 3a–3c
| Compound |
EHOMO |
ELUMO |
ΔE |
| 3a |
−6.098 |
−1.965 |
4.133 |
| 3b |
−6.090 |
−1.907 |
4.183 |
| 3c |
−5.892 |
−1.763 |
4.129 |
Amongst all of the examined chromophores (3a–3c), compound 3c exhibited the smallest HOMO–LUMO energy difference, measured at 4.129 eV, along with the smallest HOMO and LUMO energy levels at −5.892 and −1.763 eV, respectively. This phenomenon highlights a proficient charge transfer characteristic within this compound. The minimal band gap observed could be ascribed to the existence of two strongly electronegative –OH units over the acceptor portion, generating a powerful push–pull effect. In contrast, the greatest band gap is identified in compound 3b, measuring 4.183 eV, featuring the greatest energy LUMO/LUMO at −1.907/−6.090 eV, respectively. This maximum ΔE resulted from the presence of an ethoxy group at both ends of the acceptor moiety. The HOMO energy value for 3a is −6.098 eV, while for LUMO, the energy value is −1.965 eV. The decreasing order of ΔE for all the chromophores is 3b > 3a > 3c. In addition to analyzing energy levels, the study of charge transfer between orbitals is another essential aspect of FMO study. Analysis of the MO surfaces of the investigated chromophores (Fig. 1 and S11†) indicates whole transfer of the charge throughout the entire molecular structure. This observation illustrates the efficient intra-molecular CT that takes place throughout the entire molecule, both in the HOMO and LUMO orbitals of all the studied chromophores. In summary, all the compounds under investigation exhibited a comparable bandgap. Nevertheless, 3c exhibited a relatively lower band gap (4.129 eV), indicating greater charge transfer, higher polarizability and red shift spectra within this chromophore, which as a result made it effective as an NLO material.
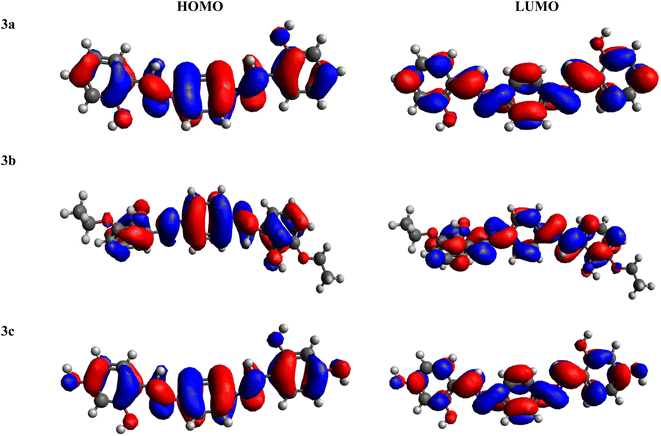 |
| | Fig. 1 HOMO–LUMO pictographic representation of 3a–3c. | |
2.6 Global reactivity parameters (GRPs)
The global reactivity descriptors represent insights into the chemical reactivity and stability of chromophores.64,65
IP signifies the energy needed to remove an electron from a molecular orbital. From Table 2, it is evident that the OH groups at both ends of the acceptor unit of 3c reduced the IP. The decreasing direction of IP values for 3a–3c is noted as 3a > 3b > 3c at 6.098, 6.090 and 5.892 eV, respectively. Conversely, electron affinity (EA) pertains to the energy released when an electron is added into a valence shell to form an anion. Consequently, these descriptors find utility in gaining insights into molecular stability. 3c represented the smallest EA at 1.763 eV, while 3a at 1.965 eV showed the highest EA. Information about electronic cloud polarization can be effectively obtained with σ and η. Hard compounds demonstrate a higher level of stability due to their weak electron polarization density, while reactive soft molecules display increased electronic cloud polarization. Among them all, 3b emerged as the hardest with an η value of 2.092 eV, while 3a is identified as the σ molecule, featuring a value of 0.243 eV−1. Consequently, 3a demonstrated amplified electronic cloud polarization, indicative of a strong NLO response. It should be noted that the parameters μ and X exhibit an inverse relationship with each other.41 In the case of 3a, it possesses the highest X and the lowest μ values, recorded at 4.032 and −4.032 eV, respectively (as shown in Table 2). These results signified the greater charge transference and in turn, improved the NLO response in these chromophores.
Table 2 Global reactivity descriptors of studied compounds (3a–3c)a
| Compound |
IP |
EA |
X |
η |
H |
ω |
σ |
ΔNmax |
| Unit = eV, σ is in eV−1. |
| 3a |
6.098 |
1.965 |
4.032 |
2.067 |
−4.032 |
3.932 |
0.243 |
1.951 |
| 3b |
6.090 |
1.907 |
3.999 |
2.092 |
−3.999 |
3.822 |
0.239 |
1.912 |
| 3c |
5.892 |
1.763 |
3.828 |
2.065 |
−3.828 |
3.548 |
0.242 |
1.853 |
2.7 Natural bond orbital (NBO) investigation
NBO investigation offers insights into the structural aspects of chromophores, elucidating the characteristics of valence orbitals, localized bonds, and anti-bonds. Furthermore, this examination reveals the stabilizing interactions present in both filled and vacant orbitals.66,67 The ΔE between interacting orbitals governs the extent of stabilization in these orbital interactions. Consequently, effective D and A groups typically exhibit the highest stabilizing interactions. Table 3 displays the most significant energy transitions, including σ → σ*, π → π*, LP → σ* and LP → π, with the highest and lowest energy values. The remaining data is presented in Tables S2–S4.†
Table 3 Interpretation of Fock matrix results using second-order perturbation theory for 3a–3c
| Compound |
Donor (i) |
Type |
Acceptor (j) |
Type |
E(2) [kcal mol−1] |
E(j) − E(i) [a.u.] |
F(i, j) [a.u.] |
| 3a |
C29–C32 |
π |
C26–C27 |
π* |
26.25 |
0.29 |
0.081 |
| C26–C27 |
π |
C26–C27 |
π* |
1.95 |
0.29 |
0.021 |
| C19–C22 |
σ |
C17–C19 |
σ* |
5.29 |
1.29 |
0.074 |
| C19–C22 |
σ |
O35–H36 |
σ* |
0.52 |
1.14 |
0.022 |
| O37 |
LP(2) |
C26–C27 |
π* |
33.73 |
0.37 |
0.107 |
| N12 |
LP(1) |
C13–H14 |
σ* |
13.09 |
0.72 |
0.088 |
| 3b |
C2–C3 |
π |
C4–C51 |
π* |
9.85 |
0.3 |
0.07 |
| C1–C6 |
π |
C4–C52 |
π* |
0.02 |
0.3 |
0.071 |
| C26–C28 |
σ |
C28–C31 |
σ* |
5.1 |
1.3 |
0.073 |
| C26–C28 |
σ |
C26–O35 |
σ* |
0.5 |
1.09 |
0.021 |
| O40 |
LP(2) |
C22–C23 |
π* |
9.82 |
0.37 |
0.1 |
| O40 |
LP(1) |
C22–C23 |
σ* |
7.19 |
1.16 |
0.082 |
| 3c |
C1–C6 |
π |
C2–C3 |
π* |
22.34 |
0.3 |
0.073 |
| C28–C30 |
π |
C28–C30 |
π* |
2.18 |
0.29 |
0.023 |
| O41–H42 |
σ |
C27–C30 |
σ* |
4.81 |
1.33 |
0.072 |
| C28–H36 |
σ |
C28–C30 |
σ* |
0.62 |
1.09 |
0.023 |
| O33 |
LP(2) |
C25–C27 |
π* |
35.86 |
0.37 |
0.109 |
| N11 |
LP(1) |
C1–C6 |
σ* |
6.99 |
0.93 |
0.073 |
The interactions (Table 3) are primarily centered on the overlap of π(C–C) → π*(C–C) orbitals within the aromatic rings, facilitating ICT and ultimately leading to stabilization, which in turn, leads to the weakening of bonds because of increased electron density within the C–C anti-bonding orbitals.
In 3a, the most substantial stabilization energy arising from π to π* transitions among all the compounds is identified as 26.25 kcal mol−1, specifically for the orbitals π(C29–C32) to π*(C26–C27). The lowest stabilizing energy is observed in the interaction between π orbitals of carbon atoms C26 and C27, specifically the transition from π to π* with a value of 1.95 kcal mol−1. In the context of transitions from σ to σ* orbitals, the maximum stabilization energy of 5.29 kcal mol−1 occurs in compound 3a. This transition involves the orbitals σ(C19–C22) to σ*(C17–C19). On the other hand, the minimum energy value, 0.52 kcal mol−1, is found in the transition from σ(C19–C22) to σ*(O35–H36). The lone pair undergoes transitions with the highest and lowest energy values at 33.73 and 13.09 kcal mol−1 for the LP(2)(O37) to π*(C26–C27) and LP(1)(N12) to σ*(C13–H14) transitions, respectively.
In the case of 3b, the π to π* transitions exhibit a high stabilization energy of 9.85 kcal mol−1, observed in the transition from π(C2–C3) to π*(C4–C51). Conversely, the interaction involving orbitals of π(C1–C6) to π*(C4–C52) shows the minimum value of 0.02 kcal mol−1. For σ to σ* interaction, the highest and lowest values are 5.1 and 0.5 kcal mol−1, respectively. These values are associated with transitions from σ(C26–C28) to σ*(C28–C31) and σ(C26–C28) to σ*(C26–O35). Regarding lone-pair transitions, 3b exhibits the highest energy transition of 9.82 kcal mol−1 from LP(2)(O40) to π*(C22–C23) and the lowest energy transition of 7.19 kcal mol−1 from LP(1)(O40) to σ*(C22–C23).
Similarly, in the case of 3c, the highest value of stabilization energy is 22.34 kcal mol−1 for the transition from π(C1–C6) to π*(C2–C3). On the other hand, the lowest value, 2.18 kcal mol−1, is found in transitions linking orbitals of π(C28–C30) to π*(C28–C30). Regarding σ to σ* transitions, there are greater and smaller values of 4.81 and 0.62 kcal mol−1 in σ(O41–H42) to σ*(C27–C30) and σ(C28–H36) to σ*(C28–C30), respectively. Lone-pair transitions in 3c, such as LP(2)(O33) to π*(C25–C27) and LP(1)(N11) to σ*(C1–C6), exhibit values of 35.86 and 6.99 kcal mol−1, respectively. These elevated stable energy values indicate significant hyper-conjugation, leading to improved CT and ultimately contributing to the nonlinearity of the studied chromophores.
2.8 UV-Visible analysis
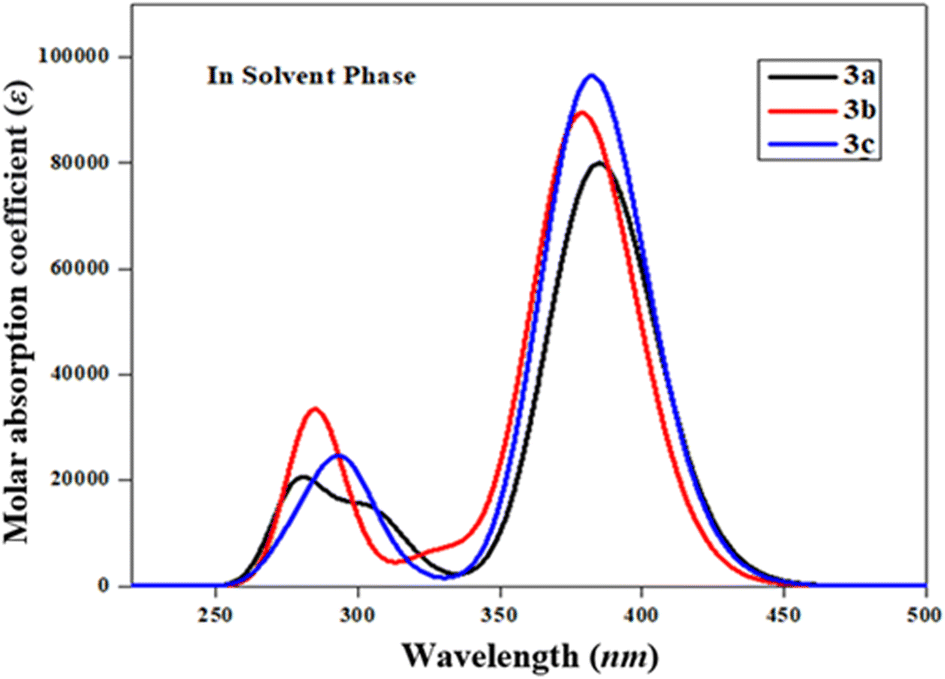
The UV-Vis spectral analysis of 3a–3c was conducted in acetonitrile solvent to elucidate significant electronic transitions, including excitation energy and oscillator strength.67,68 Tables 4 and S5–S7† provide essential data, such as absorption maxima (λmax), excitation energy (E), oscillator strength (fos), and details regarding the contributions of molecular orbitals. Electronic absorption is chiefly determined by the transition from the ground to the excited state, which is predominantly characterized by the electronic excitations from the HOMO to the LUMO.69 The absorption bands of these studied chromophores (3a–3c) are visually represented in Fig. 2.
Table 4 Wavelength (λmax), excitation energy (E), oscillator strength (fos) and nature of molecular orbital contributions of compounds 3a–3c in the solvent phasea
| Compounds |
λ (nm) |
E (eV) |
fos |
MO contributions |
| Solvent = acetonitrile, MO = molecular orbital, H = HOMO, L = LUMO, fos = oscillator strength, wavelength = λ (nm). |
| 3a |
384.757 |
3.222 |
1.104 |
H → L (94%) |
| 3b |
378.635 |
3.275 |
1.234 |
H → L (93%) |
| 3c |
382.172 |
3.244 |
1.332 |
H → L (94%) |
 |
| | Fig. 2 The computed UV-Vis spectra of 3a–3c in acetonitrile. | |
Table 4 shows that amongst all the studied compounds (3a–3c), 3a displayed the highest absorption peak at 384.757 nm, accompanied by a maximum oscillator strength (fos) of 1.104 and excitation energy (E) of 3.222 eV. Remarkably, this electronic transition from the HOMO to the LUMO accounted for a substantial 94% contribution. It is noteworthy that this absorption wavelength (λmax) aligned with the lower band gap observed in 3a, as evident from the FMO results. This might be due to the presence of an alcoholic group (–OH) in the end-capped acceptor moiety. The maximum wavelength values of 3c and 3b compounds are observed at 382.172 and 378.635 nm accompanied by 1.332 and 1.234 fos, respectively, while their E values are observed to be 3.244 and 3.275 eV, respectively (Table S5†). These λmax for the abovementioned compounds involved transitions with 94 and 93% contributions from HOMO to LUMO, respectively. These values correspond to the presence of two –OH groups in the acceptor of 3c and the 2-ethoxy-6-methylphenol group in 3b. The decreasing order of maximum absorption wavelength of the studied chromophores based on highest fos in the solvent phase is found to be: 3a > 3c > 3b. Recalling the NBO results (Table 3), it becomes apparent that the molecular orbitals primarily contributed to π → π* and n → π* interactions in the 3a–3c. It is worth noting that the absorption maxima (λmax) can be significantly influenced by the polarity and characteristics of the solvent, a phenomenon well demonstrated in previous literature.70
2.9 Non-linear optical (NLO) analysis
NLO effects result from the interaction of electromagnetic (EM) forces with different materials. This interaction gives rise to the production of novel EM waves that exhibit changes in frequency, phase, or amplitude, and display unique propagation characteristics when compared to the original incident wave.71 The link between geometry and non-linear optical effects is characterized by properties like charge transfer and hyper-polarizability.72 Materials exhibiting a strong NLO response tend to possess large dipole moments, linear polarization and substantial hyper-polarizability values. The linear polarizability (α) parameter characterizes the ability of an electric field to distort the electronic distribution within a molecule. Conversely, hyper-polarizabilities (β, γ etc.) represent the NLO response originating from molecules and atoms, encompassing the comprehensive phenomena of nonlinear optics. The calculation of β is accomplished using the finite field method. In the presence of an applied electric field, the system's energy becomes a function of that electric field. The computed values of μtot, 〈α〉, βtot, γtot and their respective tensors for 3a–3c are presented in Tables S8–S11,† with the key findings summarized in Table 5.
Table 5 Computed linear and nonlinear characteristics of 3a–3ca
| Compound |
μtot |
〈α〉 × 10−23 |
βtot × 10−30 |
γtot × 10−34 |
| μtot = Debye while other properties are in a.u. |
| 3a |
4.47 |
5.83 |
1.40 |
7.28 |
| 3b |
4.26 |
6.99 |
1.23 |
7.42 |
| 3c |
4.79 |
6.16 |
8.00 |
8.13 |
The maximum value of the dipole moment (4.79 D) is displayed by 3c, which might be due to its lowest HOMO/LUMO band gap, whereas the minimum value (4.26 D) is shown by 3b. The trend for μtot values in 3a–3c is as follows: 3b < 3a < 3c. This is compared to the μtot value of standard para-nitroaniline (p-NA), which is 4.9662 D.41 3a–3c exhibited comparable results to that of p-NA. The presence of highly electronegative atoms tends to attract charge density towards themselves, thereby contributing to enhanced linear polarizability. The observed average polarizability trend for 3a–3c is: 3a < 3c < 3b. In the case of 3b, the major contributing tensor is along the x-axis for 〈α〉, making it the primary contributor to the overall value. When comparing 〈α〉 with that of p-NA (1.17 × 10⁻²³ a.u.), it is found to be 4.98 times higher in 3a, 5.97 times higher in 3b and 5.26 times higher in 3c, depicting their significantly elevated linear polarizabilities.
The hyper-polarizability of molecules typically relies on the potency of substituents attached to the acceptor group, such as hydroxyl, ethyl, or methyl groups. These substituents play a role in enhancing molecular nonlinearity. Additionally, extended conjugation within molecules also plays a significant role in hyper-polarizability, and this can be altered by substituents. Among all the compounds, 3c exhibited the highest βtot value i.e., 8.00 × 10⁻³⁰ a.u. On the other hand, the presence of hydroxyl as well as ethoxy groups in 3b resulted in the minimum intra-molecular charge transfer and consequently, the lowest βtot value (1.23 × 10⁻³⁰ a.u.). The arrangement of βtot values in ascending order for 3a–3c is determined as follows: 3b has a lower value than 3a, and 3a has a lower value than 3c. Furthermore, when comparing the βtot results of p-NA (3.61 × 10⁻³¹ a.u.)41 with our studied compounds, significantly higher values are observed in 3a–3c. These findings highlight the enhanced βtot of our investigated compounds, rendering them suitable candidates for innovative NLO materials. Moreover, amongst all the compounds, 3c also depicted the highest value for γtot, which is found at 8.13 × 10⁻³⁴ a.u. Whereas the lowest value of γtot, i.e., 7.28 × 10⁻³⁴ a.u., is observed in 3a. The γtot value of standard p-NA corresponds to 2.71 × 10−36 a.u., which is smaller than the values for 3a–3c. Notably, the order of γtot of all the titled molecules can be written as follows: 3a < 3b < 3c. In conclusion, it is evident that all the aforementioned compounds hold potential as NLO materials. Amongst them all, 3c emerged as an exceptional candidate for nonlinear optics due to its outstanding optical properties.
3. Conclusion
In the current study, 1,4-phenylenediamine-based chromophores were synthesized and then their structural confirmation was accomplished through different spectroscopic techniques. Accompanying this, DFT calculations were also performed to determine the optoelectronic properties of 3a–3c chromophores. FMO analysis demonstrated the significant charge transfer in 3c with a narrowed bandgap (4.129 eV) and lower hardness (η = 2.065 eV) among 3a–3c. Furthermore, NBO investigation also supported the significant CT in all the studied compounds, attributed to hyper-conjugative interactions within the bonds, which contribute to molecular stability and the dispersion of electrons throughout the entire system. Among all the derivatives, 3a notably exhibited the most significant bathochromic shift (λmax = 384.575 nm) accompanied by an oscillator strength (fos) of 1.104 with a transition energy of 3.222 eV in acetonitrile media. All the synthesized Schiff bases exhibited a significant NLO response compared with p-NA. Among 3a–3c chromophores, 3c exhibited notably first-order and second-order hyper-polarizabilities: 8.00 × 10⁻³⁰ and 8.13 × 10⁻³⁴ a.u., respectively. The above findings disclosed that all the synthesized Schiff bases, particularly 3c, exhibited an efficient NLO response and could be utilized as an efficient photonic material.
Conflicts of interest
There are no conflicts to declare.
Acknowledgements
The authors express their appreciation to the Deanship of Scientific Research at King Khalid University for funding this work under grant number RGP 1/428/44. Dr Muhammad Khalid gratefully acknowledges the financial support of HEC Pakistan (project no. 20-14703/NRPU/R&D/HEC/2021).
References
- T. A. Alorini, A. N. Al-Hakimi, S. E.-S. Saeed, E. H. L. Alhamzi and A. E. Albadri, Arabian J. Chem., 2022, 15, 103559 CrossRef CAS.
- A. Rauf, A. Shah, K. S. Munawar, A. A. Khan, R. Abbasi, M. A. Yameen, A. M. Khan, A. R. Khan, I. Z. Qureshi and H.-B. Kraatz, J. Mol. Struct., 2017, 1145, 132–140 CrossRef CAS.
- J. L. Segura, M. J. Mancheño and F. Zamora, Chem. Soc. Rev., 2016, 45, 5635–5671 RSC.
- A. A. Noser, A. H. Abdelmonsef, M. El-Naggar and M. M. Salem, Molecules, 2021, 26, 5332 CrossRef CAS PubMed.
- L. Shi, H.-M. Ge, S.-H. Tan, H.-Q. Li, Y.-C. Song, H.-L. Zhu and R.-X. Tan, Eur. J. Med. Chem., 2007, 42, 558–564 CrossRef CAS PubMed.
- S. A. Matar, W. H. Talib, M. S. Mustafa, M. S. Mubarak and M. A. AlDamen, Arabian J. Chem., 2015, 8, 850–857 CrossRef CAS.
- M. S. Tople, N. B. Patel, P. P. Patel, A. C. Purohit, I. Ahmad and H. Patel, J. Mol. Struct., 2023, 1271, 134016 CrossRef CAS.
- Y. Mi, Y. Chen, W. Tan, J. Zhang, Q. Li and Z. Guo, Carbohydr. Polym., 2022, 278, 118970 CrossRef CAS PubMed.
- R. Muthukumar, M. Karnan, N. Elangovan, M. Karunanidhi and R. Thomas, J. Indian Chem. Soc., 2022, 99, 100405 CrossRef CAS.
- M. A. Ali, S. A. Musthafa, G. Munuswamy-Ramanujam and V. Jaisankar, Carbohydr. Polym., 2022, 290, 119501 CrossRef CAS PubMed.
- M. Zhan, H. Jia, J. Fan, H. Yu, E. Amador and W. Chen, Anal. Chem., 2019, 91, 6103–6110 CrossRef CAS PubMed.
- S. Vera, A. Vázquez, R. Rodriguez, S. Del Pozo, I. a. Urruzuno, A. de Cózar, A. Mielgo and C. Palomo, J. Org. Chem., 2021, 86, 7757–7772 CrossRef CAS PubMed.
- J. Collman, L. Hegedus, J. Norton and R. Finke, Priciples and Applications of Organotransition Metal Chemistry, University Science Books, Mill Valley, CA, 1987, p. 324 Search PubMed.
- T. Maharana, N. Nath, H. C. Pradhan, S. Mantri, A. Routaray and A. K. Sutar, Reactive and Functional Polymers, 2021, p. 105142 Search PubMed.
- M. Luo, Y. Liu, J. Zhao, L. Jiang, X. Chen, W. Li, Z. Yang, Q. Yan, S. Wang and Z. Chi, Dyes Pigm., 2022, 202, 110222 CrossRef CAS.
- C. M. Fernandes, V. G. Pina, C. G. Alfaro, M. T. de Sampaio, F. F. Massante, L. X. Alvarez, A. M. Barrios, J. C. M. Silva, O. C. Alves and M. Briganti, Colloids Surf., A, 2022, 641, 128540 CrossRef CAS.
- F. Marahel, M. Ghaedi, M. Montazerozohori, M. N. Biyareh, S. N. Kokhdan and M. Soylak, Food Chem. Toxicol., 2011, 49, 208–214 CrossRef CAS PubMed.
- A. Benmohammed, D. Hadji, A. Guendouzi, Y. Mouchaal, A. Djafri and A. Khelil, J. Electron. Mater., 2021, 50, 5282–5293 CrossRef CAS.
- H. Sun and J. Autschbach, ChemPhysChem, 2013, 14, 2450–2461 CrossRef CAS PubMed.
- M. H. Mashhadizadeh, M. Pesteh, M. Talakesh, I. Sheikhshoaie, M. M. Ardakani and M. A. Karimi, Spectrochim. Acta, Part B, 2008, 63, 885–888 CrossRef.
- M. Khalid, M. U. Khan, I. Shafiq, R. Hussain, A. Ali, M. Imran, A. A. Braga, M. Fayyaz ur Rehman and M. S. Akram, R. Soc. Open Sci., 2021, 8, 210570 CrossRef CAS PubMed.
- S. Aslam, M. Haroon, T. Akhtar, M. Arshad, M. Khalid, Z. Shafiq, M. Imran and A. Ullah, ACS Omega, 2022, 7, 31036–31046 CrossRef CAS PubMed.
- F. Castet, V. Rodriguez, J.-L. Pozzo, L. Ducasse, A. Plaquet and B. Champagne, Acc. Chem. Res., 2013, 46, 2656–2665 CrossRef CAS PubMed.
- M. U. Khan, M. Khalid, R. A. Khera, M. N. Akhtar, A. Abbas, M. F. ur Rehman, A. A. C. Braga, M. M. Alam, M. Imran and Y. Wang, Arab. J. Chem., 2022, 15, 103673 CrossRef CAS.
- L. Zhang, Y. Cai, B. Champagne and M. Zhao, IET Commun., 2017, 11, 930–935 CrossRef.
- B. Champagne and D. M. Bishop, Adv. Chem. Phys., 2003, 126, 41–92 CrossRef CAS.
- M. Ashfaq, A. Ali, M. N. Tahir, M. Khalid, M. A. Assiri, M. Imran, K. S. Munawar and U. Habiba, Chem. Phys. Lett., 2022, 803, 139843 CrossRef CAS.
- J. Jia, X. Wu, X. Zhang, Y. Wang, J. Yang, Y. Fang and Y. Song, Phys. Chem. Chem. Phys., 2022, 24, 955–965 RSC.
- M. Klikar, P. Le Poul, A. Ruzicka, O. Pytela, A. Barsella, K. D. Dorkenoo, F. Robin-le Guen, F. Bureš and S. Achelle, J. Org. Chem., 2017, 82, 9435–9451 CrossRef CAS PubMed.
- J. Autschbach, ChemPhysChem, 2009, 10, 1757–1760 CrossRef CAS PubMed.
- A. Ali, M. Khalid, M. F. U. Rehman, S. Haq, A. Ali, M. N. Tahir, M. Ashfaq, F. Rasool and A. A. C. Braga, ACS Omega, 2020, 5, 15115–15128 CrossRef CAS PubMed.
- D. Pant, N. Darla and S. Sitha, Comput. Theor. Chem., 2022, 1207, 113522 CrossRef CAS.
- M. Khalid, I. Shafiq, K. Mahmood, R. Hussain, M. F. ur Rehman, M. A. Assiri, M. Imran and M. S. Akram, Sci. Rep., 2023, 13, 1395 CrossRef CAS PubMed.
- C. Vidyasagar, B. M. Flores, V. Jiménez-Pérez and P. Gurubasavaraj, Mater. Today Chem., 2019, 11, 133–155 CrossRef CAS.
- H. Hassib and A. A. Razik, Solid State Commun., 2008, 147, 345–349 CrossRef CAS.
- J. Autschbach, Coord. Chem. Rev., 2007, 251, 1796–1821 CrossRef CAS.
- X. Lu and B. Champagne, Pitch analysis-based acoustic echo cancellation over a nonlinear channel, 2002 11th European Signal Processing Conference, IEEE, 2002, pp. 1–4 Search PubMed.
- M. Biswas, G. Pilet, J. Tercero, M. S. El Fallah and S. Mitra, Inorg. Chim. Acta, 2009, 362, 2915–2920 CrossRef CAS.
- I. Rajaei and S. N. Mirsattari, J. Mol. Struct., 2018, 1163, 236–251 CrossRef CAS.
- A. Gharaati, Y. Abed and F. Mostaghni, Bull. Chem. Soc. Ethiop., 2022, 36, 465–477 CrossRef CAS.
- M. N. Arshad, M. Khalid, U. Hani and A. M. Asiri, J. Phys. Org. Chem., 2023, e4577 Search PubMed.
- G. Loukova, A. Milov, V. Vasiliev and V. Minkin, Russ. Chem. Bull., 2020, 69, 218–228 CrossRef CAS.
- R. Dennington, T. Keith and J. Millam, Shawnee Mission KS, GaussView, Version, 2009, vol. 5 Search PubMed.
- A. L. Tenderholt, PyMOlyze, Version 1.1, Stanford University, 2006, vol. 4, pp. 580–592 Search PubMed.
- S. Sakthivel, T. Alagesan, S. Muthu, C. S. Abraham and E. Geetha, J. Mol. Struct., 2018, 1156, 645–656 CrossRef CAS.
- M. D. Hanwell, D. E. Curtis, D. C. Lonie, T. Vandermeersch, E. Zurek and G. R. Hutchison, J. Cheminf., 2012, 4, 1–17 Search PubMed.
- N. M. O'boyle, A. L. Tenderholt and K. M. Langner, J. Comput. Chem., 2008, 29, 839–845 CrossRef PubMed.
- V. OriginPro, Northamp, MA, USA, 2016.
- T. Lu and F. Chen, J. Comput. Chem., 2012, 33, 580–592 CrossRef CAS PubMed.
- J. C. Kromann, C. Steinmann and J. H. Jensen, J. Chem. Phys., 2018, 149, 104102 CrossRef PubMed.
- A. Alparone, Chem. Phys., 2013, 410, 90–98 CrossRef CAS.
- P. K. Chattaraj and D. R. Roy, Chem. Rev., 2007, 107, PR46–PR74 CrossRef CAS.
- M. Khalid, M. U. Khan, N. Azhar, M. N. Arshad, A. M. Asiri, A. A. C. Braga and M. N. Akhtar, Opt. Quantum Electron., 2022, 54, 395 CrossRef CAS.
- M. Barwiolek, D. Jankowska, M. Chorobinski, A. Kaczmarek-Kędziera, I. Łakomska, S. Wojtulewski and T. M. Muzioł, RSC Adv., 2021, 11, 24515–24525 RSC.
- T. S. Ganesan, N. Elangovan, V. Vanmathi, S. Sowrirajan, S. Chandrasekar, K. S. Murthy and R. Thomas, J. Indian Chem. Soc., 2022, 99, 100713 CrossRef CAS.
- R. Farooq, Z. Batool, M. Khalid, M. U. Khan, A. A. C. Braga, A. H. Ragab, S. R. Al-Mhyawi, G. Muhammad and Z. Shafiq, RSC Adv., 2022, 12, 32185–32196 RSC.
- K. D. Singer, J. E. Sohn, L. King, H. Gordon, H. Katz and C. Dirk, J. Opt. Soc. Am. B, 1989, 6, 1339–1350 CrossRef CAS.
- M. N. Tahir, M. Khalid, A. Islam, S. M. A. Mashhadi and A. A. Braga, J. Mol. Struct., 2017, 1127, 766–776 CrossRef CAS.
- M. N. Arshad, A.-A. M. Al-Dies, A. M. Asiri, M. Khalid, A. S. Birinji, K. A. Al-Amry and A. A. Braga, J. Mol. Struct., 2017, 1141, 142–156 CrossRef CAS.
- A. Mahmood, S. U. D. Khan, U. A. Rana, M. R. S. A. Janjua, M. H. Tahir, M. F. Nazar and Y. Song, J. Phys. Org. Chem., 2015, 28, 418–422 CrossRef CAS.
- C. S. Qiu, C. Flinn and Y. Zhao, J. Phys. Org. Chem., 2019, 32, e3970 CrossRef.
- N. Alwadai, Z. M. Elqahtani, S. U. D. Khan, A. M. Pembere, A. Badshah, M. Y. Mehboob and M. F. Nazar, J. Phys. Org. Chem., 2022, 35, e4388 CrossRef CAS.
- M. U. Khan, M. Y. Mehboob, R. Hussain, R. Fatima, M. S. Tahir, M. Khalid and A. A. C. Braga, J. Phys. Org. Chem., 2021, 34, e4119 CrossRef CAS.
- D. Luise, M. C. d'Alterio, G. Talarico, I. Ciofini and F. Labat, J. Comput. Chem., 2022, 43, 2001–2008 CrossRef CAS PubMed.
- O. E. Oyeneyin, N. D. Ojo, N. Ipinloju, A. C. James and E. B. Agbaffa, Chem. Afr., 2022, 5, 319–332 CrossRef CAS.
- A. E. Reed, L. A. Curtiss and F. Weinhold, Chem. Rev., 1988, 88, 899–926 CrossRef CAS.
- a. J. Foster and F. Weinhold, J. Am. Chem. Soc., 1980, 102, 7211–7218 CrossRef.
- A. Mahmood, A. Irfan, F. Ahmad and M. R. S. A. Janjua, Comput. Theor. Chem., 2021, 1204, 113387 CrossRef CAS.
- A. Mahmood, S. U.-D. Khan, U. A. Rana and M. H. Tahir, Arab. J. Chem., 2019, 12, 1447–1453 CrossRef CAS.
- E. M. Kosower, J. Am. Chem. Soc., 1958, 80, 3261–3267 CrossRef CAS.
- Y.-X. Sun, Q.-L. Hao, W.-X. Wei, Z.-X. Yu, L.-D. Lu, X. Wang and Y.-S. Wang, J. Mol. Struct.: THEOCHEM, 2009, 904, 74–82 CrossRef CAS.
- M. Y. Mehboob, R. Hussain, S. Jamil, M. Ahmed, M. U. Khan, M. Haroon and M. R. S. A. Janjua, J. Phys. Org. Chem., 2022, 35, e4313 CrossRef CAS.
|
| This journal is © The Royal Society of Chemistry 2024 |
Click here to see how this site uses Cookies. View our privacy policy here. 
 Open Access Article
 This Open Access Article is licensed under a
  *a
*a