DOI:
10.1039/D3RA07564H
(Paper)
RSC Adv., 2024,
14, 1697-1709
Insight into molecular structures and dynamical properties of niosome bilayers containing melatonin molecules: a molecular dynamics simulation approach
Received
6th November 2023
, Accepted 26th December 2023
First published on 5th January 2024
Abstract
Niosomes represent vesicular carriers capable of encapsulating both hydrophobic and hydrophilic drugs within their inner core or bilayer shell. They are typically composed of non-ionic synthetic surfactants such as sorbitan monostearate (Span60) with the addition of cholesterol (Chol). The physical properties and stability of niosomal vesicles strongly depend on the composition of their bilayers, which plays a significant role in determining the efficiency of drug encapsulation and release in drug delivery systems. In this study, we have explored the interactions between melatonin (Mel) molecules and the niosome bilayer, as well as their resulting physical properties. Molecular dynamics simulations were employed to investigate melatonin-inserted niosome bilayers, both with and without the inclusion of cholesterol. The simulation results revealed that cholesterol notably influences the location of melatonin molecules within the niosome bilayers. In the absence of cholesterol, melatonin tends to occupy the region around the Span60 tail groups. However, in the presence of cholesterol, melatonin is found in the vicinity of the Span60 head groups. Melatonin molecules in niosome bilayers without cholesterol exhibit a more ordered orientation when compared to those in bilayers containing 50 mol% cholesterol. The bilayer structure of the Span60/Mel and Span60/Chol/Mel systems exhibited a liquid-disordered phase (Ld). In contrast, the Span60/Chol bilayer system displays a liquid-ordered phase (Lo) with less fluidity. This study reveals that melatonin induces a disorderly bilayer structure and greater lateral expansion, whereas cholesterol induces an orderly bilayer structure and a more condensed effect. Cholesterol plays a crucial role in condensing the bilayer structure with stronger interactions between Span60 and cholesterol. The addition of 50 mol% cholesterol in the Span60 bilayers not only enhances the stability and rigidity of niosomes but also facilitates the easier release of melatonin from the bilayer membranes. This finding is particularly valuable in the context of preparing niosomes for drug delivery systems.
1. Introduction
Niosomes represent a promising innovation in drug delivery, offering several advantages over liposomes, including improved stability, cost-effectiveness, ease of formulation, and scalability. Consequently, they have gained widespread use for encapsulating both lipophilic and hydrophilic drugs. Nowadays, sorbitan monostearate (Span60) is widely used in the formulation of vesicular drug carriers for drug delivery systems.1 Span60, owing to its long saturated alkyl chain, possesses a high phase transition temperature, resulting in enhanced entrapment efficiency.2,3 In aqueous environments, Span60 yields niosomal vesicles with enclosed bilayer structures, often supplemented with cholesterol in appropriate ratios.4 However, these characteristics of niosome particles are strongly dependent on the preparation method and cholesterol concentration.5 Notably, niosomal formulations containing Span60 (surfactant-to-cholesterol ratio 1![[thin space (1/6-em)]](https://www.rsc.org/images/entities/char_2009.gif) :1) exhibited the highest entrapment efficiency.6 A study by Nasseri7 identified that Span60 with 50 mol% cholesterol was notably stable and elastic at both room and body temperatures. Our previous simulations8,9 have indicated that, in the absence of a modest cholesterol concentration, bilayers exhibited reduced fluidity, existing in a gel phase. Conversely, simulations demonstrated that higher cholesterol concentrations (40–50 mol% Chol) induced greater bilayer fluidity and elasticity, resulting in a liquid-order phase. With increasing cholesterol concentration, the area per molecule increased while bilayer thickness decreased – a characteristic opposite to the effect observed in saturated hydrocarbon chains of lipid bilayers.10
:1) exhibited the highest entrapment efficiency.6 A study by Nasseri7 identified that Span60 with 50 mol% cholesterol was notably stable and elastic at both room and body temperatures. Our previous simulations8,9 have indicated that, in the absence of a modest cholesterol concentration, bilayers exhibited reduced fluidity, existing in a gel phase. Conversely, simulations demonstrated that higher cholesterol concentrations (40–50 mol% Chol) induced greater bilayer fluidity and elasticity, resulting in a liquid-order phase. With increasing cholesterol concentration, the area per molecule increased while bilayer thickness decreased – a characteristic opposite to the effect observed in saturated hydrocarbon chains of lipid bilayers.10
Melatonin (N-acetyl-5-methoxytryptamine), a highly lipophilic molecule with hydrophilic attributes, is found in humans, animals, plants, and microbes.11–13 In humans and animals, it is synthesized by the pineal gland, serving as a natural hormone extensively studied for its free-radical scavenging activity and therapeutic potential in sleep disorders.11,14 Furthermore, melatonin is implicated in disease prevention, including Alzheimer's, certain cancers, and cardiovascular conditions.15–17 Its protective effects in viral and bacterial infections stem from its anti-inflammatory and antioxidant properties.18 Notably, melatonin supplementation has been shown to alleviate the severity of influenza and the COVID-19 pandemic,19 making it a reasonable treatment option for COVID-19 infection.20 Various studies have characterized melatonin-loaded nanocarriers such as niosomes, ethosomes, and liposomes.21–23
Hence, the modeling of bilayer membranes hydrated by water molecules is crucial for understanding the detailed mechanisms of melatonin behavior within niosomal bilayers, which are closely tied to lipid membrane properties.24–31 In a previous study involving molecular dynamics (MD) simulations, niosome bilayers were examined in the presence of three representative flavone compounds: unsubstituted flavone, chrysin, and luteolin.32 These niosome bilayer models were constructed with an equal ratio of Span60 and cholesterol (1:1 composition) and various flavone concentrations (3%, 25%, and 50%). The study shed light on the preferred localization of flavones within bilayer membranes and their physical characteristics. The results of this study indicated that as the concentration of flavone increased due to its pronounced hydrophobic nature, it exhibited deep penetration into the hydrophobic core of the bilayer. In contrast, chrysin and luteolin were observed to transition from the hydrophobic region to the hydrophilic region of the bilayer, where they became solvated either by lipid head groups or water. Additionally, the bilayer thickness and surface area per lipid were found to vary with flavone concentration, with chrysin and luteolin causing a decrease in bilayer thickness and an increase in surface area per lipid. In a recent experimental study involving melatonin-loaded niosomes, it was observed that niosomes with a 1:1 ratio of Span60 and cholesterol exhibited high stability and efficient melatonin entrapment, ranging from 85.09% to 86.69%.33 Corresponding MD simulations34 revealed that niosome bilayers with an equal ratio of Span60 and cholesterol displayed high physical stability and greater efficiency in melatonin entrapment over a wide temperature range (298 K–310 K). The simulations also identified two possible orientations for melatonin within the bilayer: one where melatonin aligns parallel to the bilayer surface and another where it tilts to the bilayer normal vector. Furthermore, the study demonstrated that bilayer structures and the dynamic behavior of melatonin within the bilayer are sensitive to both cholesterol concentrations and temperature variations. Drolle et al.26 utilized neutron diffraction and small-angle scattering in conjunction with computer modeling to investigate the interaction between melatonin and bilayers made of DPPC and DOPC. The location of melatonin molecules was determined at concentrations of ∼10 mol% and ∼30 mol%. Melatonin was found to reside in the head group region of the bilayers, resulting in a decrease in bilayer thickness indicative of increased bilayer fluidity. Dies et al.27 subsequently provided experimental evidence that melatonin inhibits the insertion of amyloid-β25–35 peptides into anionic lipid membranes composed of DMPC and DMPS at a high melatonin concentration of 30 mol%. Furthermore, Dies et al.28 investigated the interaction between melatonin and DMPC lipid membranes across melatonin concentrations ranging from 0.5 mol% to 30 mol%, utilizing 2-dimensional X-ray diffraction measurements. They observed a concentration-dependent re-ordering of the lipid membrane. At low melatonin concentrations, distinct melatonin-enriched patches emerged within the membrane, with a notable reduction in thickness compared to the lipid bilayer. Within these patches, melatonin molecules aligned parallel to the lipid tails. Conversely, at high melatonin concentrations (30 mol%), a highly ordered and uniform melatonin structure manifested throughout the membrane, with melatonin molecules aligning parallel to the bilayers.
However, it should be noted that the molecular dynamics (MD) simulations of niosome bilayers containing melatonin molecules in the previous study were carried out at a relatively low melatonin concentration, specifically 5 mol%. When melatonin is added to niosome bilayers at a high concentration (30 mol%), it can significantly impact not only structural properties such as bilayer thickness and area per lipid but also the dynamic behavior of melatonin within the niosome bilayers. This information is relevant to understanding phase transitions and the stability of niosome formation. Previous experiments28 explored melatonin concentrations from 0.5 mol% to 30 mol% in the DMPC lipid membranes, revealing significant impacts on the physical properties and phase formation of these lipids. These experiments are typically conducted at higher melatonin concentrations, often in the order of millimolar concentrations. The 30 mol% melatonin concentration in this study corresponds to an elevated concentration of 10 mM. Therefore, the choice of a high melatonin concentration in our simulations is based on exploratory investigations aimed at understanding the potential effects and behavior of the system under extreme conditions. While we acknowledge that such concentrations might not be physiologically relevant in all contexts, our study seeks to provide insights into the system's response to varying melatonin concentrations, including those that may be encountered in experimental or therapeutic scenarios. In practical terms, higher concentrations can be relevant in certain experimental setups, drug delivery systems, or therapeutic applications where elevated melatonin levels are intentionally introduced to achieve specific outcomes.
To the best of our knowledge, there has been no prior molecular dynamics (MD) simulation study that has explored melatonin-loaded niosome bilayers at a high melatonin concentration (30 mol%) in aqueous solution, both with and without 50 mol% cholesterol inclusion. Therefore, the investigation of how melatonin and cholesterol influence the structure and phase formation of niosomal bilayers under these conditions is of significant interest. This study is focused on comparing the bilayer structure and dynamic properties impacted by melatonin and cholesterol, utilizing atomistic MD simulation techniques. We have computed various physical properties, including area per molecule, bilayer thickness, molecular orientation, order parameters, diffusion coefficients, and hydrogen bonding. Our findings provide a comprehensive understanding of the molecular-level dynamics governing bilayer formation with and without melatonin inclusion. This knowledge is crucial for optimizing the formulation and design of niosomes for drug delivery applications.
2. Materials and methods
2.1. Niosome bilayer models
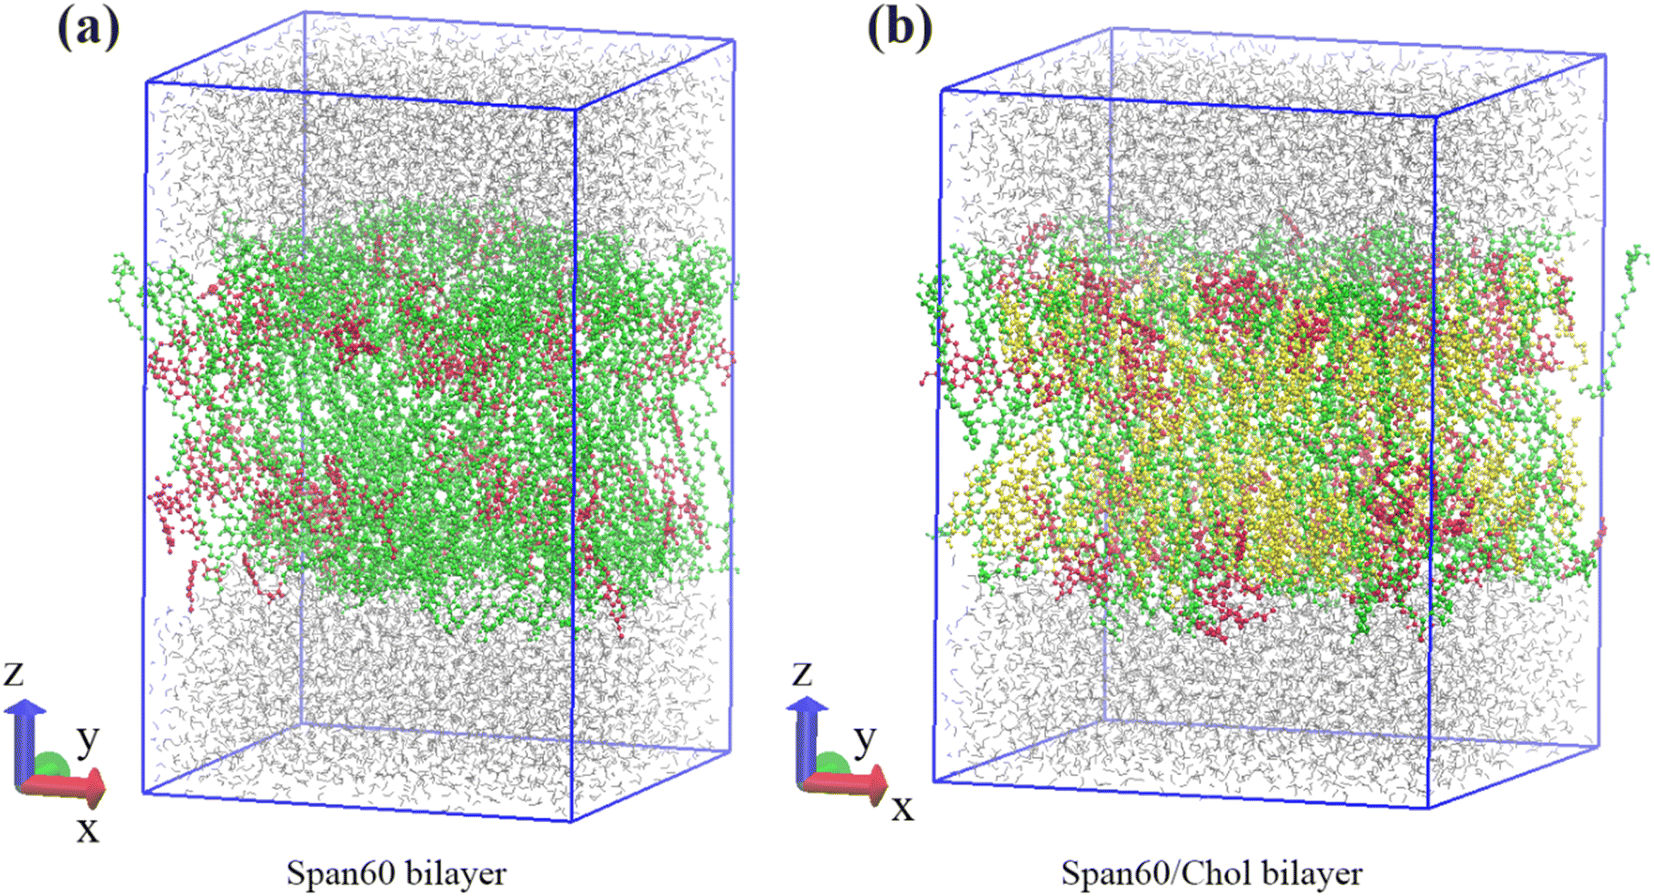
Our previous research indicated that the niosome bilayer composed of an equal ratio of Span60 and cholesterol (Span60:Chol = 1:1) exhibited optimal physical stability.7 Thus, in this study, we adopted this composition to create niosome bilayer systems encapsulating melatonin. Moreover, for comparison, we generated a melatonin-incorporated pure Span60 bilayer. The CELL microcosmos 2.2 software35 was employed to construct both niosome bilayer systems. The molecular structures of Span60, cholesterol (Chol), and melatonin (Mel) are depicted in Fig. 1. The initial arrangements of niosome bilayers, both with and without cholesterol, were randomly distributed within a 7.20 nm × 7.20 nm surface area, based on the Span60:cholesterol ratios of 1:0 and 1:1, respectively. The first system consisted of 256 Span60 molecules (Span60 bilayer), while the second system comprised 128 Span60 and 128 cholesterol molecules (Span60/Chol bilayer). Following that, 110 melatonin molecules were randomly inserted into these bilayers, constituting 30 mol% of the total number of molecules in the system. To establish these niosome bilayers in an aqueous environment, an equilibrated bulk water containing 3840 water molecules within a rectangular box measuring 7.20 nm × 7.20 nm × 2.30 nm (x, y, and z dimensions) was generated using Gromacs v. 2016 program.36 Subsequently, this bulk water was incorporated into both sides of the niosome bilayer, one end cap attached to the lower portion of the Span60 layer and the other to the upper part of the Span60 layer, resulting in a total of 7680 water molecules. This process yielded melatonin-loaded niosome bilayer systems contained within a simulation box measuring 7.20 × 7.20 × 10.90 in the x, y, and z directions, as illustrated in Fig. 2a and b. Within these bilayer structures, hydrocarbon tails are oriented towards the bilayer center, while the hydrophilic head groups are exposed to the aqueous phase.
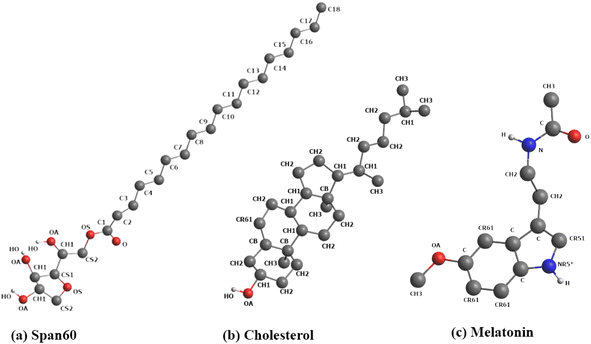 |
| | Fig. 1 Molecular structures of (a) Span60, (b) cholesterol, and (c) melatonin. Color code for Fig. 1: carbon atoms and hydrocarbon groups (e.g., C, CH1, CH2, CH3) in gray; oxygen (O) in red; nitrogen (N) in blue; hydrogen (H) in white. In Fig. 1a, the Span60 head group is composed of polar groups, including ether, ester, and hydroxyl groups, while the Span60 tail consists of a hydrocarbon chain (C1–C18). | |
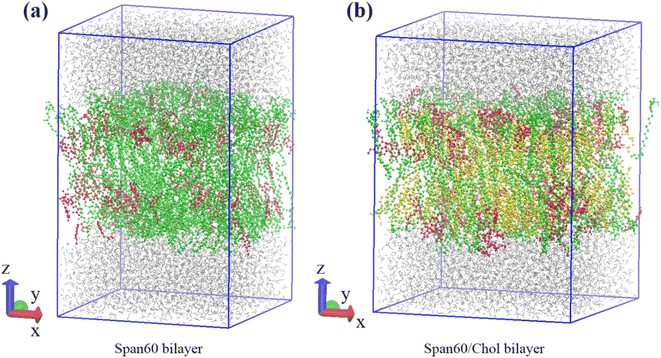 |
| | Fig. 2 Schematic depiction of initial configurations of the Span60 bilayer and Span60/Chol bilayer systems, respectively. Color code for Fig. 2a and b: water in gray; Span60 in green; melatonin in red; cholesterol in yellow. | |
2.2. Simulation details
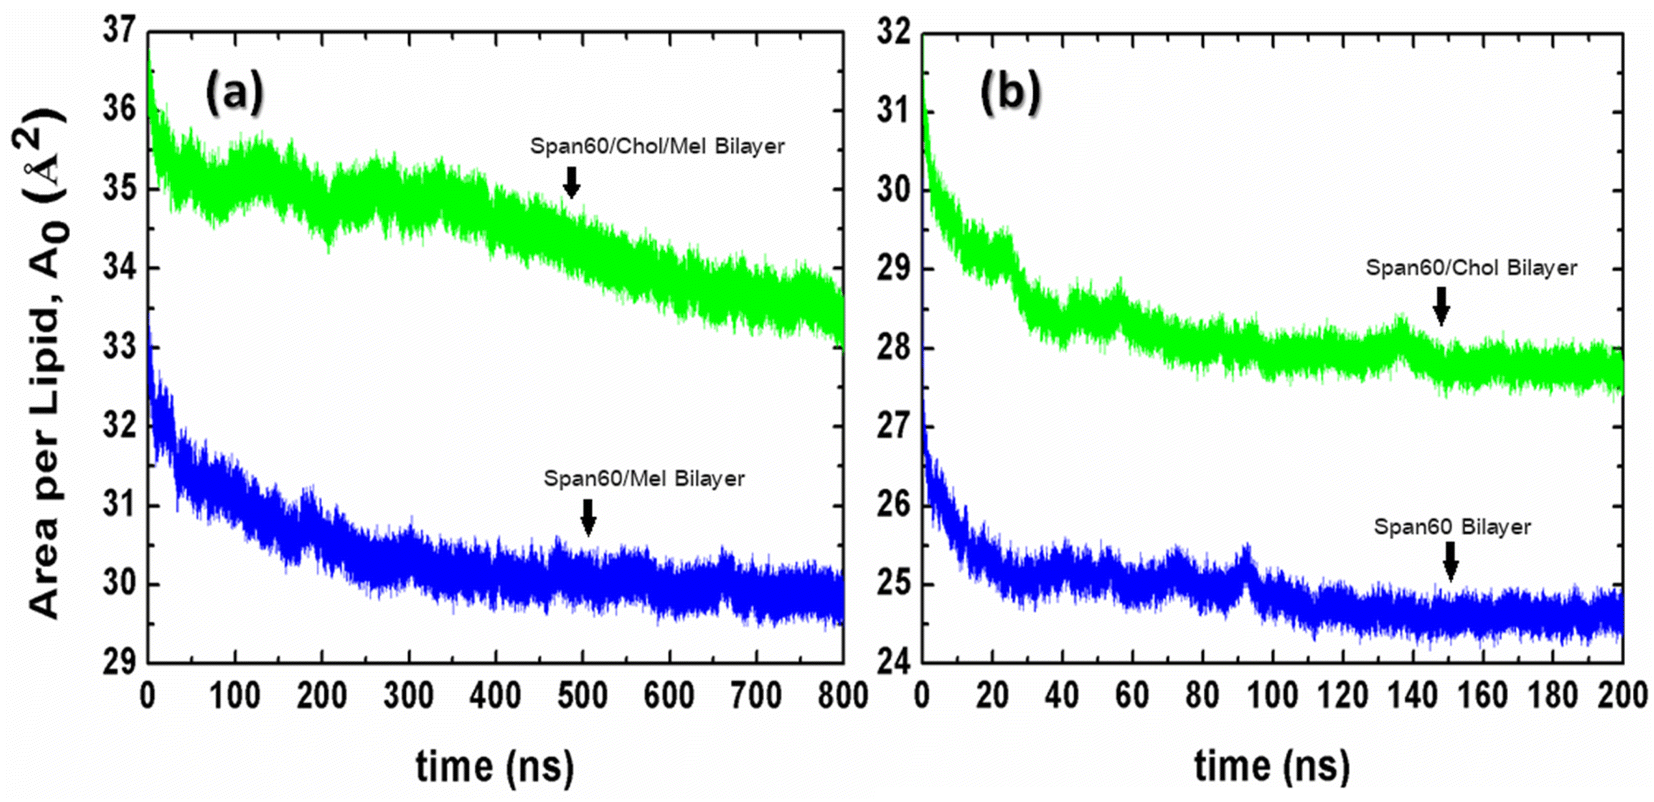
The force field parameters for Span60, cholesterol, and melatonin were adopted from prior investigations,37,38 utilizing the Gromos87 force field.39 Explicit atoms and hydrogens were employed for polar groups, while united atoms were used to represent hydrocarbons like CH1, CH2, and CH3. The SPC/E water model was applied. Initially, the energy minimization of the Span60 and Span60/Chol bilayer systems was executed using the steepest descent method to mitigate atomic overlap. Subsequently, the systems were simulated at a constant pressure of 1 bar and a temperature of 298 K for a total simulation time of 800 ns (750 ns for equilibration and 50 ns for production). Trajectories were stored every 10 ps for further analysis. To keep constant pressure, Berendsen barostat40 and semi-isotropic coupling with the compressibility of 4.5 × 10⁻⁵ bar−1 and a time constant (τP) of 0.5 were employed in the z-direction and the xy-plane. Temperature control relied on the v-rescale thermostat method,41 with a time coupling (τT) of 0.1 ps. Bonds and angles within water molecules were constrained by the SETTLE algorithm,42 while bond lengths of Span60, cholesterol, and melatonin were constrained using the LINCS algorithm43 with fourth-order expansion. Long-range electrostatic interactions were calculated via the particle mesh Ewald (PME) algorithm44 using fourth-order interpolation and a grid spacing of 0.15 nm. Short-range van der Waals and electrostatic interactions had a cutoff at 1.5 nm. The neighbor list was updated every ten steps using the Verlet cutoff scheme.45 Equations of motion were solved using the leap-frog algorithm with a time step (Δt) of 2 fs. Periodic boundary conditions were applied in all spatial dimensions. Furthermore, simulations were conducted for niosome bilayers containing 0 mol% and 50 mol% cholesterol without melatonin to serve as comparative cases. To initialize these systems, melatonin molecules were removed from the equilibrated configurations of melatonin-loaded niosome bilayers. Simulations for Span60 and Span60/Chol bilayer systems ran for 200 ns (150 ns for equilibration and 50 ns for production). To monitor the equilibrium process, we calculated the time evolution of the area per lipid (A0) for all niosome systems using eqn (1), as shown in Fig. 3. It is evident that the niosome bilayer with melatonin inclusion exhibits greater fluctuations in the area per lipid compared to the bilayer without melatonin, resulting in slower attainment of equilibrium for the former. The area per lipid in the Span60/Chol/Mel and the Span60/Mel bilayers remains relatively stable after 600 ns of simulation, whereas niosome bilayers without melatonin show almost constant values after 150 ns of simulation. All simulations were executed using the Gromacs v. 2016 package,36 with molecular visualization conducted using the VMD program.46
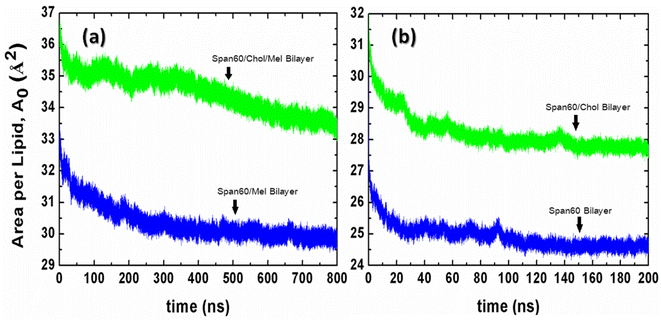 |
| | Fig. 3 The time evolution of the area per lipid (A0) for (a) the niosome bilayers with melatonin inclusion and (b) the niosome bilayers without melatonin inclusion. | |
3. Results and discussion
3.1. Structural properties of niosome bilayers
3.1.1 Density profiles, area per lipid, and bilayer thickness. The overall structures of the niosome bilayers containing melatonin molecules at 0 mol% and 50 mol% cholesterol concentrations can be elucidated through mass density profiles for individual molecular species, including water, melatonin, the head and tail groups of Span60, as illustrated in Fig. 4a and b, respectively. All density profiles were computed as a function of the z-coordinates, with the bilayer center at z = 0 nm. The head and tail groups of the Span60 molecules were plotted separately for clarity. The density profiles of the Span60 head groups displayed two distinct peaks positioned close to the water bulk phase for all the bilayer systems under consideration. In contrast, the density profile of the Span60 tail groups exhibited a prominent peak at the bilayer center when cholesterol molecules were introduced. Additionally, the density profile of cholesterol fell between that of the head and tail groups. It is a well-established fact that the incorporation of cholesterol into the Span60 bilayer disrupts the alignment of the hydrocarbon chains and the hydrophilic groups.8
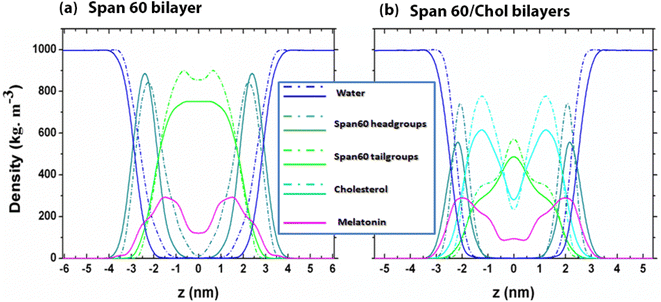 |
| | Fig. 4 Mass density distributions of the Span60 head and tail groups, cholesterol, melatonin, and water molecules as a function of z-coordinates for (a) the Span60 bilayers (0 mol% Chol) with melatonin (solid line) and without melatonin (short dash-dot line) inclusion and (b) the Span60/Chol bilayers (50 mol% Chol) with melatonin (solid line) and without melatonin (short dash-dot line) inclusion. Coloring schemes are defined as follows: water, blue; Span60 head, dark cyan; Span60 tail, green; cholesterol, cyan; melatonin, magenta. | |
As shown in Fig. 4a and b, the density peaks of melatonin are situated at approximately |z| ≈ 1.5 nm and ≈2.0 nm for the Span60 and Span60/Chol bilayer systems, respectively. This suggests that the presence of cholesterol in the Span60 bilayers induces the migration of melatonin molecules toward the region of Span60 head groups, which are absorbed in the water surface. Furthermore, the density distributions of the Span60 head groups exhibit a distinctive shape, with a peak located at |z| ≈ 2.5 nm and ≈2.0 nm for the Span60 and Span60/Chol bilayer systems, respectively. In this context, the distance between the two peaks of the Span60 head group is defined as the bilayer thickness (DHH) as given in Table 1. Certainly, the thickness of the Span60 bilayer decreased clearly when cholesterol was added. The decreasing thickness of the Span60 bilayers was observed with increasing concentrations of cholesterol in our previous study.9 This finding aligns with observations from the study conducted by Han and co-workers32 on Span60/Chol bilayers containing chrysin molecules and the study conducted by Drolle et al.26 on DPPC and DOPC bilayers with melatonin concentrations at 10 mol% and 30 mol%. Moreover, the introduction of cholesterol to Span60 bilayers notably influences the distribution of melatonin. This is evident from the two peaks in the melatonin density coinciding with the density peaks of Span60 head groups in the Span60/Chol bilayer system, as depicted in Fig. 4b. This indicates that melatonin molecules preferentially reside in the hydrophilic regions, possibly due to interactions with Span60 head groups and cholesterol. These characteristics align with observations regarding cholesterol's ability to displace melatonin from the internal regions of the lipid membrane towards the interface, with this effect becoming more pronounced as cholesterol concentration increases.30,31
Table 1 Comparison of some physical properties of the pure Span60 and the Span60/Chol bilayers which were added with melatonin, flavone, chrysin, and luteolin molecules, respectively
| Structure properties |
Span60 bilayer |
| |
Additives |
0 mol% cholesterol |
50 mol% cholesterol |
| Ref. 32. |
| Area per lipid, A0 (Å2) |
— |
24.6 ± 0.1 |
27.8 ± 0.1 |
| 29.9a |
| This work |
30 mol% melatonin |
29.9 ± 0.1 |
33.5 ± 0.1 |
| 25 mol% flavonea |
— |
35.8 |
| 25 mol% chrysina |
— |
37.6 |
| 25 mol% luteolina |
— |
31.0 |
| Thickness, DHH (Å) |
— |
41.6 ± 0.2 |
40.0 ± 0.2 |
| 37.4a |
| This work |
30 mol% melatonin |
42.8 ± 0.2 |
38.7 ± 0.2 |
| 25 mol% flavonea |
— |
36.1 |
| 25 mol% chrysina |
— |
32.9 |
| 25 mol% luteolina |
— |
37.9 |
The area per lipid (A0) is an important property of the lipid bilayer which can be related to various other properties such as membrane elasticity, lateral diffusion, etc.,.47 In the present work, the area per lipid was calculated by the following equation9
| |
 | (1) |
The product of cell size in the x- (Lx) and y- (Ly) directions is the surface area in the xy-plane of A. The sum of the numbers of Span60 (NSpan60) and cholesterol (NChol) molecules in one layer is the total number (N) of lipid molecules. Area per lipid of Span60 and Span60/Chol bilayers with and without melatonin inclusion were given in Table 1. When the 30 mol% of melatonin was added into the Span60 and Span60/Chol bilayers, the area per lipid of both systems increased by about 21.5% and 20.5%, respectively. This indicated that these bilayers were expanded to form a liquid phase. This pure Span60 bilayer has a smaller area per lipid revealing that the Span60 molecules were closely packed with their orderly tilted tail groups (Fig. 5a). This characteristic is referred to as the gel phase or liquid-crystalline phase (Lα).8,9
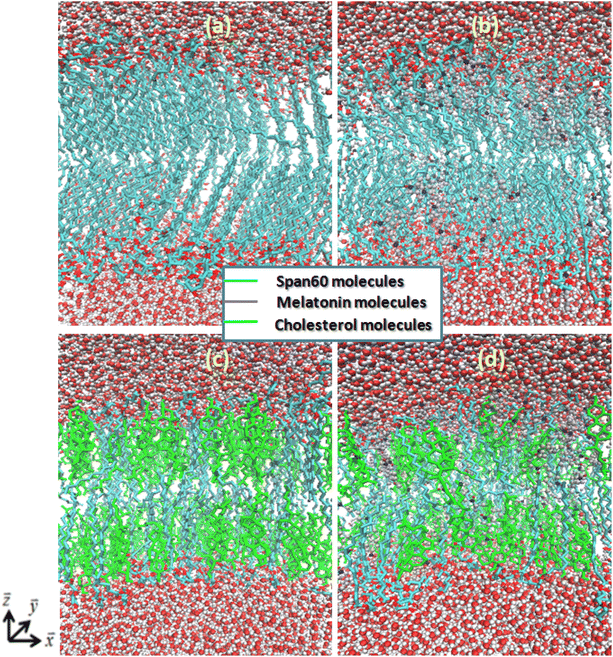 |
| | Fig. 5 Molecular configurations of Span60 bilayers for (a) pure Span60, (b) Span60 with melatonin, (c) Span60/Chol, and (d) Span60/Chol with melatonin, respectively. Color scheme: cholesterol, green; Span60 tails, cyan; melatonin, gray; oxygen, red; nitrogen, blue; hydrogen, gray. | |
The Span60 bilayer with the addition of melatonin reveals a more expanded area per lipid due to melatonin insertion among the Span60 molecules, leading to a looser packing between the Span60 and melatonin domains. Melatonin serves as a spacer between lipid head groups, leading to an expansion of the free volume within the bilayer's hydrocarbon region.25 Consequently, this increased free volume is quickly occupied by the disordered hydrocarbon chains as depicted in Fig. 5b. This characteristic of the bilayer is referred to as the liquid-disordered phase (Ld). Clearly, the Span60 bilayer with melatonin inclusion showed a less ordered structure than the pure Span60 and the Span60/Chol bilayers. The addition of cholesterol in the Span60 bilayer resulted in increased lipid area, primarily due to cholesterol inserting itself among the Span60 molecules, leading to a more loosely packed arrangement between the Span60 and cholesterol domains. The tail groups of Span60 molecules in this configuration exhibited an orderly alignment parallel to the bilayer normal direction, as shown in Fig. 5c, which is referred to as the liquid-ordered phase (Lo). However, when melatonin was added to the Span60/Chol bilayer, it caused a greater expansion in the area per lipid (20.5%) compared to the Span60/Chol bilayer without melatonin. This result suggests that cholesterol molecules induce closer proximity among the Span60 molecules than melatonin does when inserted into the Span60 bilayers. The insertion of melatonin among the Span60 and cholesterol molecules resulted in a phase change from the liquid-ordered phase (Lo) to the liquid-disordered phase (Ld), as illustrated in Fig. 5c and d. Certainly, Fig. 5b and d provide clear evidence of the influence of melatonin on the orientation of the Span60 tail groups, resulting in a phase transition from the gel and liquid-ordered phase to the liquid-disordered phase for both the Span60 and Span60/Chol bilayers, respectively. Additionally, our study suggests that melatonin induces a disorderly bilayer structure and greater lateral expansion, whereas cholesterol induces an orderly bilayer structure and a more condensed effect.
3.1.2 Radial distribution functions and molecular orientation. The probability of finding cholesterol (or melatonin) molecules around Span60 molecules at a specific distance can be analyzed using the radial distribution function (RDF). To investigate the lateral structure of the niosome bilayer, the two-dimensional radial distribution function (2D-RDF) was applied to these calculations. The positions of the center of mass of the Span60 head group, cholesterol, and melatonin were projected onto the bilayer plane (xy-plane). The overall shape of the RDF describes the molecular arrangement in the liquid phase, while the positions of the peaks provide information about the characteristic distances in the packing structure. The 2D-RDF is calculated using the following equation:48| |
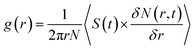 | (2) |
Here, N represents the total number of considered molecules. S(t) is the xy cross-sectional area of the simulation box at time t, and δN(r,t) is the number of cholesterol (or melatonin) molecules located within a circular shell with a radius from r to r + δr. The angle brackets denote averaging over the total simulation time and the total number of molecules. Fig. 6 displays the 2D-RDF plots for the Span60-Cholesterol (SC) and the Span60-Melatonin (SM) pair interactions in niosome bilayers with and without melatonin. Fig. 6a shows the comparison of the SC-RDF and SM-RDF for the Span60/Chol and Span60/Mel bilayers, respectively. The SC-RDF exhibits several pronounced peaks over a long distance, indicating a more structured arrangement in the Span60/Chol bilayer, affirming the presence of a liquid-ordered phase. The SM-RDF displays small three pronounced peaks at distances ranging from 0.3 to 1.0 nm, suggesting that the interaction between Span60 and melatonin is weaker than that between Span60 and cholesterol. Consequently, melatonin can easily disrupt the Span60 arrangement, leading to the formation of the liquid-disordered phase in the Span60/Mel bilayer. Fig. 6b presents the SC-RDF and SM-RDF for the Span60/Chol/Mel bilayer. In both RDFs, there are pronounced peaks within the range of 0 to 1 nm, while at distances larger than 1.0 nm, both RDFs exhibit small fluctuations and approach the normal value of 1. Notably, the SC-RDF displays the first pronounced peak at a shorter distance than the SM-RDF, indicating that cholesterol strongly interacts with Span60 molecules through hydrogen bond interactions. The presence of melatonin in the Span60/Chol bilayer significantly alters the structural arrangement, with the SC-RDF showing less structural order at larger distances (>1 nm), signifying the formation of a liquid-disordered phase in the Span60/Chol/Mel bilayer.
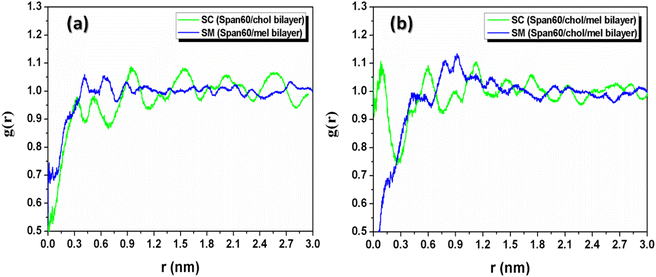 |
| | Fig. 6 The calculated two-dimensional radial distribution functions (RDFs) of the Span60-melatonin (SM) and the Span60-cholesterol (SC) for (a) the Span60/Chol and Span60/Mel bilayers, and (b) for the Span60/Chol/Mel bilayer. | |
The probability distribution of the tilt angle of Span60 tails in both the upper and lower layers for all bilayer systems has been analyzed, as depicted in Fig. 7. The tilt angle, denoted as θ, is defined as the angle between the vector formed by the acyl chains, spanning from the first (C1) to the last hydrocarbon (C18), and the bilayer normal vector (the z-axis), as illustrated in the inset figure. The tilt angle distribution ranges from 0 to 90°, representing the orientation of the Span60 tail group in the lower layer. Conversely, the tilt angle distribution ranges from 90 to 180°, signifying the orientation of the Span60 tail group in the upper layer. It is seen that the tilt angle distributions of the Span60 hydrocarbon chains for the pure Span60 and the Span60/Chol bilayers exhibited narrow sharp peaks for both the lower at ∼14.2° and ∼11.6° and that of the upper layer at ∼154.4° and ∼162.9°, respectively.
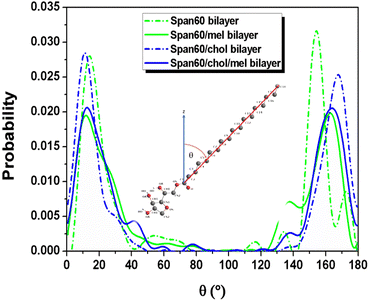 |
| | Fig. 7 The tilt angle distribution of the Span60 tail for the pure Span60 (green short dashed line), Span60/Mel (green solid line), the Span60/Chol (blue short dashed line), and the Span60/Chol/Mel bilayers (blue solid line), respectively. | |
The Span60 tails in the pure Span60 bilayer exhibit a greater degree of tilt compared to those in the Span60/Chol bilayer. This observation suggests that the addition of cholesterol into the Span60 bilayer led to the re-alignment of the Span60 tails in an upright position.8,9 Conversely, the tilt angles of the Span60 hydrocarbon chains were more widely distributed when melatonin molecules were added into the Span60 and Span60/Chol bilayers. Nonetheless, the presence of cholesterol in the Span60/Chol/Mel system can promote a more organized alignment of the Span60 tail groups. Fig. 8a and b show the tilt angle distributions of melatonin molecules contained in the Span60 and Span60/Chol bilayers, respectively. The tilt angle, denoted as θ, is defined as the angle between a vector pointing from the hydrocarbon (CR61) unit to the carbon atom of the carbonyl group and the bilayer's normal vector (the z-axis), as illustrated in the inset of the figure.
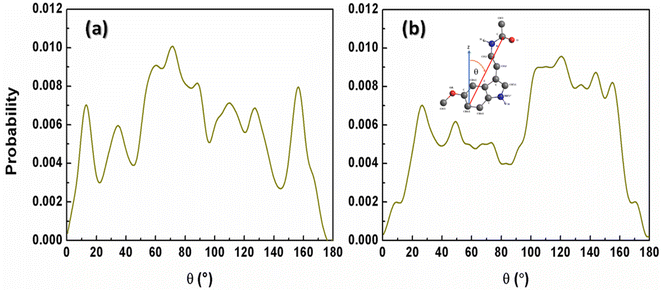 |
| | Fig. 8 Tilt angle distributions of melatonin molecules contained in (a) the Span60 bilayer (Span60/Mel) and (b) the Span60 with 50 mol% cholesterol (Span60/Chol/Mel). | |
The tilt angle distribution of melatonin showed several broad peaks for both systems. This suggests that melatonin molecules have a wide range of possible orientations in the niosome bilayers. This finding contradicts the study of Dies and colleagues who reported on the alignment of melatonin within DMPC lipid bilayers at both low (0.5 mol%) and high (30 mol%) melatonin concentrations.27 Specifically, at low melatonin concentrations, melatonin molecules were observed to align parallel to the lipid tails, whereas, at high melatonin concentrations, melatonin molecules aligned parallel to the bilayers.
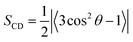
3.1.3. Order parameters. The order parameter is a measure of the structural orientation or flexibility of lipids in a bilayer. It has been widely calculated theoretically for the deuterium order parameters (SCD) to characterize the structure of the hydrocarbon chains inside a lipid membrane and can be compared to 2H NMR measurements.49 Description of the orientational mobility of the C–D bond for such a property and the simulation can be extracted using the following equation| |
 | (3) |
Here, θ is the angle between the membrane normal (the z-axis) and the C–D bond vector. A time and ensemble average is represented by the angular bracket. Note that SCD value of 0.5 corresponds to the perfect alignment of the lipid tail to the normal of the bilayer surface. In this study, a united atom model was employed to describe the hydrocarbon groups (CH2 or CH3). Thus, the definition of the C–D bond vector is a vector from Cn−1 to Cn+1 site. The C1 site is the carbonyl carbon and the C18 site is the CH3 group. The CH2 groups are numbered consecutively from C2 to C17 site (see Fig. 1a). The order parameters of the Span60 molecule obtained from all bilayer systems are presented in Fig. 9. This result revealed that the Span60 tails for the pure Span60 bilayer showed less ordering due to the strong interaction between Span60 themselves.8 This behavior is closely related to chain–chain interactions of Span60 molecules which formed more stable monolayers when compared to other sorbitan surfactant monolayers.38,50 For the other bilayers, the Span60 tails exhibited more orientational mobility which strongly depends on the Span60 and cholesterol composition ratios. Furthermore, the addition of 50 mol% of cholesterol into the Span60 bilayer led to an increase in the orientational mobility of the Span60 chain significantly. Excluding the pure Span60 bilayer, the SCD exhibits an increasing trend with carbon positions until reaching the C7 site, after which it decreases to its lowest point at C17. This observation suggests that the Span60 tail groups exhibit higher orientational mobility within the C7–C17 region. Specifically, carbon segments from C5 to C8 display high-order parameters for both the Span60/Chol and Span60/Chol/Mel bilayers, indicating reduced mobility compared to other carbon segments of the Span60 tail. This reduced mobility can be attributed to their close to the sterol rings of cholesterol, leading to a strong interaction between Span60 and cholesterol. However, the addition of melatonin to the Span60/Chol bilayer causes a decrease in SCD. This decrease is attributed to melatonin inducing greater orientational mobility and local disorder within the Span60 tail groups. These simulations highlight that cholesterol molecules not only significantly contribute to the condensation, fluidity, and stability of the bilayer structure but also influence the order parameters of the Span60 tails.
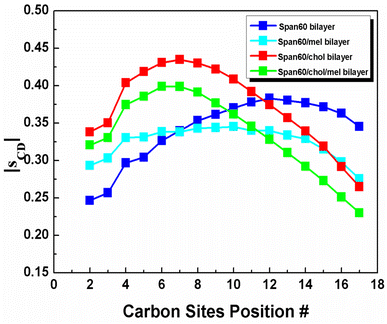 |
| | Fig. 9 Order parameter, SCD, on hydrocarbon chains of the Span60 molecules, depends on the carbon site position for the pure Span60, the Span60/Mel, the Span60/Chol, and the Span60/Chol/Mel bilayers, respectively. | |
3.1.4. Hydrogen bond analysis. The number of hydrogen bonds between molecules can be defined in various ways, whether based on geometric considerations of interaction energy and distance or utilizing donor–acceptor (DA) or hydrogen–acceptor (HA) distances along with the donor–hydrogen–acceptor (DHA) angle.51 In this study, the geometric criterion was employed, incorporating a maximum DHA angle of 30° and a DA distance of 0.35 nm. By using this specific definition, we can effectively describe the behavior of melatonin when inserted into the Span60 bilayers with and without cholesterol inclusion. The average numbers of hydrogen bonds per molecule were calculated for all bilayer systems and given in Table 2. It was found that the average number of hydrogen bonds between the Span60/Span60 of the Span60/Mel and Span60/Chol/Mel systems decreased by about 12% and 19% in comparison to the Span60 and Span60/Chol bilayers, respectively. However, these decreases were compensated by hydrogen bonds formed between Span60 and melatonin. Furthermore, it was found that the average number of hydrogen bonds of the Span60/water (SW) pair increased upon the addition of melatonin to the Span60 bilayer. Conversely, when melatonin was introduced to the Span60/Chol bilayer, this average hydrogen bond number decreased. This reveals that cholesterol can expel melatonin out of the internal regions of the bilayer structure to the lipid headgroup regions causing to tussle hydrogen bonds formed between Span60, cholesterol, and melatonin towards the water molecules at the interface.
Table 2 The calculated average hydrogen bond number per molecule (<nHB>) for the Span60, the Span60/Mel, the Sapn60/Chol, and the Span60/Chol/Mel bilayers, respectively. The pair of hydrogen bond formation was represented as the Span60/water (SW), the Span60/Span60 (SS), the Span60/cholesterol (SC), the Span60/melatonin (SM), the cholesterol/water (CW), the cholesterol/melatonin (CM), the melatonin/water (MW), and the melatonin/melatonin (MM), respectively
| Bilayer systems |
<nHB> |
| SW |
SS |
SC |
SM |
CW |
CM |
MW |
MM |
| Ref. 9. |
| Pure Span60 |
2.35 ± 0.05 |
1.87 ± 0.03 |
— |
— |
— |
— |
— |
— |
| (2.17 ± 0.05)a |
(1.89 ± 0.03)a |
| Span60/Mel |
2.55 ± 0.06 |
1.64 ± 0.03 |
— |
0.40 ± 0.02 |
— |
— |
0.40 ± 0.04 |
0.55 ± 0.03 |
| Span60/Chol |
3.83 ± 0.10 |
0.97 ± 0.04 |
0.73 ± 0.04 |
— |
1.09 ± 0.05 |
— |
— |
— |
| (3.97 ± 0.10)a |
(0.89 ± 0.05)a |
(0.85 ± 0.04)a |
(0.88 ± 0.05)a |
| Span60/Chol/Mel |
3.76 ± 0.09 |
0.79 ± 0.04 |
0.69 ± 0.03 |
0.56 ± 0.03 |
0.82 ± 0.04 |
0.30 ± 0.02 |
0.80 ± 0.06 |
0.46 ± 0.03 |
3.2. Dynamical properties
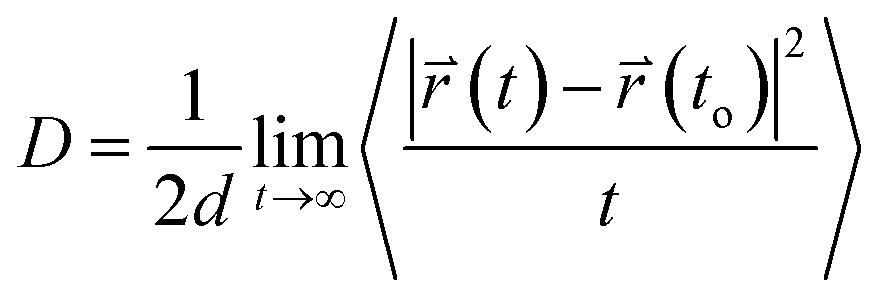
The translational motion of Span60, cholesterol, and melatonin in niosome bilayers can be examined from the mean square displacements (MSD) in terms of the self-diffusion coefficient, D, which was calculated using Einstein's equation52 as follows| |
 | (4) |
Here,  and
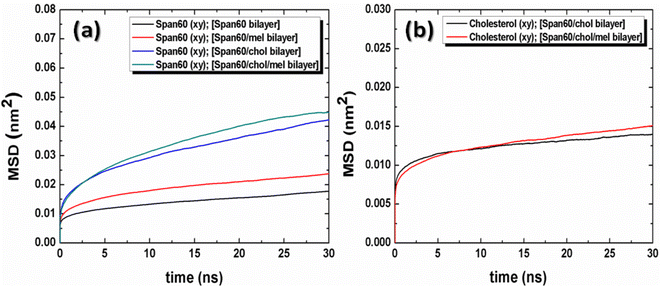
and  are the center of mass of a molecule position at time t and at the original time to, respectively. d is the dimensionality of the system (i.e., d = 1, 2, 3 for one, two, or three dimensions, respectively). The numerator of eqn (3) is the MSD. The brackets <…> denote an ensemble average which is an average of all molecules in the simulation and all origins. The MSD plots with movements in the lateral direction (the xy-plane) of Span60 and cholesterol molecules for all niosome bilayers were displayed in Fig. 10a and b, respectively.
 |
| | Fig. 10 Mean squared displacement (MSD) with lateral diffusion of (a) Span60 and (b) cholesterol for the pure Span60, the Span60/Mel, the Span60/Chol, and the Span60/Chol/Mel bilayer systems, respectively. | |
The lateral diffusion coefficients (Dxy) were obtained from the slopes of the linear fitting of the time evolutions of these MSD plots and were summarized in Table 3. It is seen from these plots that the movement of the Span60 molecule along the lateral membrane increased when melatonin was added in both the Span60 and the Span60/Chol bilayers. The movement of Span60 molecules in the lateral direction is facilitated by the presence of cholesterol and melatonin in the Span60 bilayers. According to the average number of hydrogen bonds obtained from each system, the hydrogen bonds of the Span60/Span60 group decreased when melatonin was added to the pure Span60 bilayer and Span60 bilayer with 50 mol% cholesterol inclusion. The presence of cholesterol and melatonin in the bilayer membranes caused the Span60 to lose molecular packing. Additionally, it can be observed that the cholesterol showed slightly higher lateral mobility for the Span60/Chol/Mel bilayer than that of the Span60/Chol bilayer.
Table 3 The diffusion coefficients of Span60, cholesterol, and melatonin molecules, obtained from MD simulations of the Span60 bilayers with and without cholesterol and melatonin incorporation
| Bilayer systems |
Diffusion coefficient, [μm2 s−1] |
| Span60 |
Cholesterol |
Melatonin |
| Ref. 9. Ref. 8. Ref. 31. |
| Pure Span60 |
0.22 ± 0.02 (Dxy) |
— |
— |
| (0.33 ± 0.03)b |
| Span60/Mel |
0.30 ± 0.03 (Dxy) |
— |
0.42 ± 0.03 (Dxy) |
| 0.16 ± 0.02 (Dz) |
| Span60/Chol |
0.68 ± 0.05 (Dxy) |
0.10 ± 0.01 (Dxy) |
— |
| (1.04 ± 0.04)b |
(0.11 ± 0.05)a |
| Span60/Chol/Mel |
0.78 ± 0.12 (Dxy) |
0.14 ± 0.01 (Dxy) |
1.12 ± 0.03 (Dxy) |
| 0.40 ± 0.02 (Dz) |
| DMPC/Chol/Melc (50 mol% Chol) |
— |
— |
41 ± 9 (Dxy) |
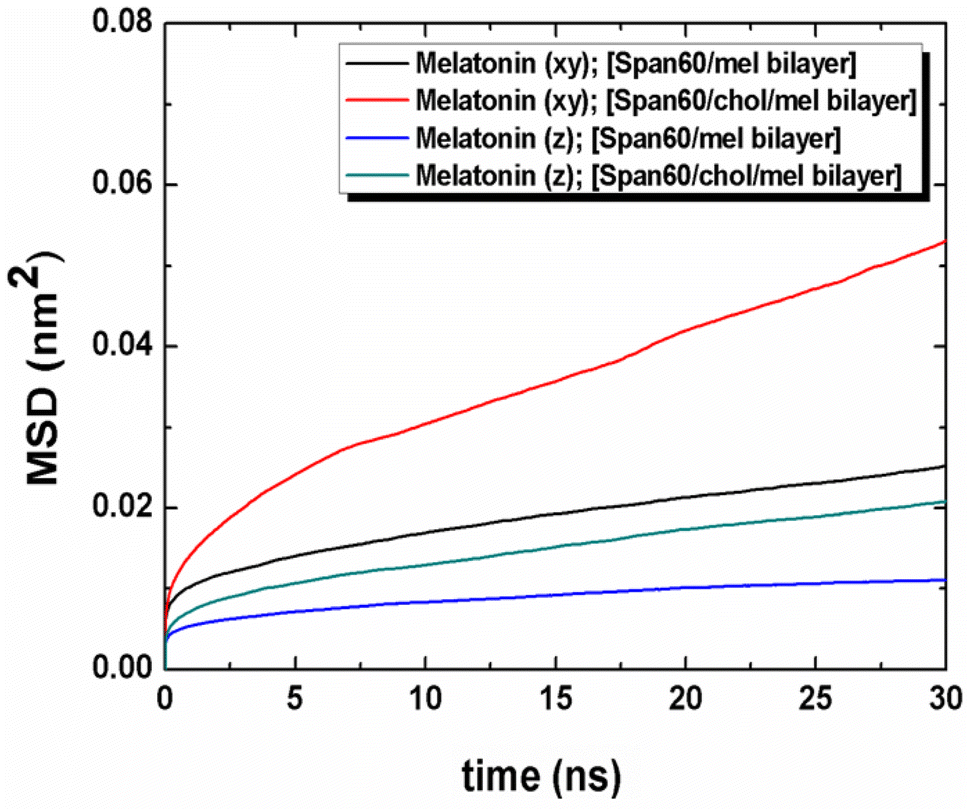
The movement of melatonin in both lateral and transversal directions was calculated, as depicted in Fig. 11. The transversal diffusion coefficient (Dz) for melatonin movement is presented in Table 3. Notably, the lateral diffusion coefficient for melatonin exhibited a dramatic increase, from 0.42 ± 0.03 to 1.12 ± 0.03 μm2 s−1. This is in line with the order of self-diffusion coefficients of melatonin molecules, which are typically on the order of 10−7 cm2 s−1 in lipid membranes.31 This significant increase in lateral mobility is observed when cholesterol is introduced to the bilayer structures, as reported in previous studies.31 Conversely, the transversal diffusion coefficient experienced a less pronounced increase, going from 0.16 ± 0.02 to 0.40 ± 0.02 μm2 s−1, as indicated in Table 3. Furthermore, it was observed that melatonin exhibited greater mobility in the lateral direction compared to the transverse direction. This suggests that cholesterol induces a looser molecular packing within the Span60 bilayer, leading to an increase in the mobility of melatonin molecules within the bilayer structure. In conclusion, the influence of cholesterol on the bilayer structure not only enhances fluidity, as evidenced by the increased lateral diffusion but also promotes the stability of melatonin by facilitating hydrogen bonding interactions via the head group of Span60 and cholesterol. These interactions contribute to improved melatonin entrapment efficiency when utilizing niosomal drug carriers.
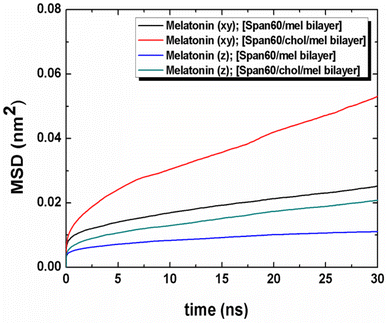 |
| | Fig. 11 Mean squared displacement (MSD) of the lateral and the transversal diffusions of melatonin molecule for the Span60/Mel and the Span60/Chol/Mel bilayer systems, respectively. | |
4. Conclusions
Niosomes are a novel trend in drug delivery that have more advantages than liposomes such as good stability, low cost, ease to be formulation, and scaling-up. Therefore, they have been widely used to encapsulate both lipophilic and hydrophilic drugs. In this study, we have focused on investigating how melatonin and cholesterol influence niosome bilayers using molecular dynamics simulations. Our study has yielded insights into the structural characteristics and dynamic behaviors of niosome bilayers, both in the presence and absence of melatonin inclusion. The simulation results revealed that the bilayer structure of the Span60/Mel system formed in the liquid-disordered phase (Ld) with a less ordered structure and more area per lipid (A0) when compared to the pure Span60 and Span60/Chol bilayer systems. The Span60 tail groups are in less orientational order with tilt and parallel along the bilayer normal direction. In the Span60/Chol bilayer system, the bilayer structure was in the liquid-ordered phase (Lo) and exhibited greater fluidity compared to the pure Span60 system but less fluidity than the Span60/Mel system. The tail groups of the Span60 molecules have an ordered structure. However, the bilayer structure of the Span60/Chol/Mel system formed in the liquid-disordered phase (Ld) with the lowest ordered structure and the most area per lipid (A0), resulting in increased fluidity. Cholesterol plays a crucial role in condensing the bilayer structure with stronger interactions between Span60 and cholesterol. The effect of cholesterol provided condensation and was orderly on the bilayer structure, while the influence of melatonin provided the expansion and local disorder on the bilayer structure. In conclusion, our study suggests that the addition of 50 mol% cholesterol into the niosome bilayer increases the mobility of melatonin molecules in both lateral and transverse directions. Such insights are essential for understanding the mechanisms of drug release from niosome vesicles, which are vital for targeted drug delivery to specific cells or tissues. Our findings offer a comprehensive understanding of the molecular-level dynamics governing bilayer formation, both with and without melatonin inclusion. Additionally, they serve as a guide and encouragement for future experimental investigations in the field. This knowledge is crucial for optimizing the formulation and design of niosomes for drug delivery applications.
Conflicts of interest
There are no conflicts to declare.
Acknowledgements
This work was financially supported by the Fundamental Fund of Khon Kaen University and the National Science, Research, and Innovation Fund (NSRF). A. R. would like to thank the SUT Center of Excellence on Advanced Functional Materials, Suranaree University of Technology, Nakhon Ratchasima, Thailand for financial support. The authors would like to acknowledge the Bureau of Information Technology, Khon Kaen University for high-performance computing support.
References
- S. Taymouri and J. Varshosaz, Effect of different types of surfactants on the physical properties and stability of carvedilol nano-niosomes, Adv. Biomed. Res., 2016, 5(48), 1–6 Search PubMed.
- Y. Hao, F. Zhao, N. Li and Y. Yang, Studies on a high encapsulation of colchicine by a niosome system, Int. J. Pharm., 2002, 244, 73–80 CrossRef CAS PubMed.
- N. Kasliwal, Development, characterization, and evaluation of liposomes and niosomes of bacitracin zinc, J. Dispersion Sci. Technol., 2012, 33, 1267–1273 CrossRef CAS.
- E. H. Elsaied, H. M. Dawaba, E. A. Ibrahim and M. I. Afouna, Investigation of proniosomes gel as a promising carrier for transdermal delivery of Glimepiride, Univers. J. Pharm. Res., 2016, 1, 1–18 CrossRef.
- X. Ge, M. Wei, S. He and W.-E. Yuan, Advances of non-ionic surfactant vesicles (niosomes) and their application in drug delivery, Pharmaceutics, 2019, 11, 55 CrossRef CAS PubMed.
- G. Shilakari Asthana, P. K. Sharma and A. Asthana, In vitro and in vivo evaluation of niosomal formulation for controlled delivery of clarithromycin, Scientifica, 2016, 2016, 1–10 CrossRef PubMed.
- B. Nasseri, Effect of cholesterol and temperature on the elastic properties of niosomal membranes, Int. J. Pharm., 2005, 300, 95–101 CrossRef CAS PubMed.
- A. Ritwiset, S. Krongsuk and J. R. Johns, Molecular structure and dynamical properties of niosome bilayers with and without cholesterol incorporation: a molecular dynamics simulation study, Appl. Surf. Sci., 2016, 380, 23–31 CrossRef CAS.
- S. Somjid, S. Krongsuk and J. R. Johns, Cholesterol concentration effect on the bilayer properties and phase formation of niosome bilayers: a molecular dynamics simulation study, J. Mol. Liq., 2018, 256, 591–598 CrossRef CAS.
- H. Saito and W. Shinoda, Cholesterol effect on water permeability through DPPC and PSM lipid bilayers: a molecular dynamics study, J. Phys. Chem. B, 2011, 115, 15241–15250 CrossRef CAS PubMed.
- Y. B. Kandemir and L. Sarikcioglu, Melatonin and its therapeutic actions on peripheral nerve regeneration, Folia Morphol., 2015, 74, 283–289 CrossRef PubMed.
- A. Ritwiset, J. Khajonrit, S. Krongsuk and S. Maensiri, Molecular insight on the formation structure and dynamics of melatonin in an aqueous solution and at the Water–Air interface: a molecular dynamics study, J. Mol. Graphics Modell., 2021, 108, 107983 CrossRef CAS PubMed.
- C.-Q. Chen, J. Fichna, M. Bashashati, Y.-Y. Li and M. Storr, Distribution, function and physiological role of melatonin in the lower gut, World J. Gastroenterol., 2011, 17, 3888 CrossRef CAS PubMed.
- S. A. Pshenichnyuk, A. Modelli, D. Jones, E. F. Lazneva and A. S. Komolov, Low-energy electron interaction with melatonin and related compounds, J. Phys. Chem. B, 2017, 121, 3965–3974 CrossRef CAS PubMed.
- S. Tengattini, R. J. Reiter, D. X. Tan, M. P. Terron, L. F. Rodella and R. Rezzani, Cardiovascular diseases: protective effects of melatonin, J. Pineal Res., 2008, 44, 16–25 CrossRef CAS PubMed.
- S. A. Rosales-Corral, D. Acuña-Castroviejo, A. Coto-Montes, J. A. Boga, L. C. Manchester, L. Fuentes-Broto, A. Korkmaz, S. Ma, D. X. Tan and R. J. Reiter, Alzheimer's disease: pathological mechanisms and the beneficial role of melatonin, J. Pineal Res., 2012, 52, 167–202 CrossRef CAS PubMed.
- Vijayalaxmi, C. R. Thomas Jr., R. J. Reiter and T. S. Herman, Melatonin: from basic research to cancer treatment clinics, J. Clin. Oncol., 2002, 20, 2575–2601 CrossRef CAS PubMed.
- I. G. García, M. Rodriguez-Rubio, A. R. Mariblanca, L. M. de Soto, L. D. García, J. M. Villatoro, J. Q. Parada, E. S. Meseguer, M. J. Rosales and J. González, A randomized multicenter clinical trial to evaluate the efficacy of melatonin in the prophylaxis of SARS-CoV-2 infection in high-risk contacts (MeCOVID Trial): a structured summary of a study protocol for a randomised controlled trial, Trials, 2020, 21, 1–4 CrossRef PubMed.
- A. Shneider, A. Kudriavtsev and A. Vakhrusheva, Can melatonin reduce the severity of COVID-19 pandemic?, Int. Rev. Immunol., 2020, 1–10 Search PubMed.
- R. J. Reiter, R. Sharma, Q. Ma, A. Dominquez-Rodriguez, P. E. Marik and P. Abreu-Gonzalez, Melatonin Inhibits COVID-19-induced Cytokine Storm by Reversing Aerobic Glycolysis in Immune Cells: A Mechanistic Analysis, Med. Drug Discovery, 2020, 6, 100044 CrossRef PubMed.
- R. Khan and R. Irchhaiya, Niosomes: a potential tool for novel drug delivery, J. Pharm. Invest., 2016, 46, 195–204 CrossRef CAS.
- A. Priprem, C. Nukulkit, N. P. Johns, S. Laohasiriwong, K. Yimtae and C. Soontornpas, Transmucosal delivery of melatonin-encapsulated niosomes in a mucoadhesive gel, Ther, Delivery, 2018, 9, 343–357 CrossRef CAS PubMed.
- V. Dubey, D. Mishra and N. Jain, Melatonin loaded ethanolic liposomes: physicochemical characterization and enhanced transdermal delivery, Eur. J. Pharm. Biopharm., 2007, 67, 398–405 CrossRef CAS PubMed.
- D. Bongiorno, L. Ceraulo, M. Ferrugia, F. Filizzola, C. Giordano, A. Ruggirello and V. T. Liveri, H-NMR and FT-IR study of the state of melatonin confined in membrane models: location and interactions of melatonin in water free lecithin and AOT reversed micelles, Arkivoc, 2004, 251, 262 Search PubMed.
- S. B. Akkas, S. Inci, F. Zorlu and F. Severcan, Melatonin affects the order, dynamics and hydration of brain membrane lipids, J. Mol. Struct., 2007, 834, 207–215 CrossRef.
- E. Drolle, N. Kučerka, M. Hoopes, Y. Choi, J. Katsaras, M. Karttunen and Z. Leonenko, Effect of melatonin and cholesterol on the structure of DOPC and DPPC membranes, Biochim. Biophys. Acta, Biomembr., 2013, 1828, 2247–2254 CrossRef CAS PubMed.
- H. Dies, L. Toppozini and M. C. Rheinstädter, The interaction between amyloid-β peptides and anionic lipid membranes containing cholesterol and melatonin, PLoS One, 2014, 9, e99124 CrossRef PubMed.
- H. Dies, B. Cheung, J. Tang and M. C. Rheinstädter, The organization of melatonin in lipid membranes, Biochim. Biophys. Acta, Biomembr., 2015, 1848, 1032–1040 CrossRef CAS PubMed.
- F. Severcan, I. Sahin and N. Kazancı, Melatonin strongly interacts with zwitterionic model membranes—evidence from Fourier transform infrared spectroscopy and differential scanning calorimetry, Biochim. Biophys. Acta, Biomembr., 2005, 1668, 215–222 CrossRef CAS PubMed.
- V. R. De Lima, M. S. Caro, M. L. Munford, B. Desbat, E. Dufourc, A. A. Pasa and T. B. Creczynski-Pasa, Influence of melatonin on the order of phosphatidylcholine-based membranes, J. Pineal Res., 2010, 49, 169–175 CAS.
- H. Lu and J. Martí, Binding and dynamics of melatonin at the interface of phosphatidylcholine-cholesterol membranes, PLoS One, 2019, 14, e0224624 CrossRef CAS PubMed.
- Y. Myung, S. Yeom and S. Han, A niosomal bilayer of sorbitan monostearate in complex with flavones: a molecular dynamics simulation study, J. Liposome Res., 2016, 26, 336–344 CrossRef CAS PubMed.
- L. Temprom, S. Krongsuk, S. Thapphasaraphong, A. Priperm and S. Namuangruk, A novel preparation and characterization of melatonin loaded niosomes based on using a ball milling method, Mater. Today Commun., 2022, 31, 103340 CrossRef CAS.
- S. Somjid, N. Shinsuphan, L. Temprom and S. Krongsuk, Effects of cholesterol and temperature on structural properties and dynamic behavior of niosome bilayers with melatonin Inclusion: a Coarse-Grained simulation study, J. Mol. Liq., 2022, 368, 120686 CrossRef CAS.
- B. R. Sommer, T. Dingersen, C. Gamroth, S. E. Schneider, S. Rubert, J. Krüger and K.-J. Dietz, CELLmicrocosmos 2.2 MembraneEditor: a modular interactive shape-based software approach to solve heterogeneous membrane packing problems, J. Chem. Inf. Model., 2011, 51, 1165–1182 CrossRef CAS PubMed.
- M. J. Abraham, T. Murtola, R. Schulz, S. Páll, J. C. Smith, B. Hess and E. Lindahl, GROMACS: high performance molecular simulations through multi-level parallelism from laptops to supercomputers, SoftwareX, 2015, 1–2, 19–25 CrossRef.
- M. Höltje, T. Förster, B. Brandt, T. Engels, W. von Rybinski and H.-D. Höltje, Molecular dynamics simulations of stratum corneum lipid models: fatty acids and cholesterol, Biochim. Biophys. Acta, Biomembr., 2001, 1511, 156–167 CrossRef PubMed.
- A. Ritwiset, S. Krongsuk and J. Johns, Molecular structure and stability of the sorbitan monostearate (Span60) monolayers film at the water–air interface: a molecular dynamics simulation study, J. Mol. Liq., 2014, 195, 157–164 CrossRef CAS.
- W. V. Gunsteren and H. Berendsen, Groningen Molecular Simulation (GROMOS) Library Manual, Biomos, Netherlands, 1987 Search PubMed.
- H. J. Berendsen, J. V. Postma, W. F. van Gunsteren, A. DiNola and J. R. Haak, Molecular dynamics with coupling to an external bath, J. Chem. Phys., 1984, 81, 3684–3690 CrossRef CAS.
- G. Bussi, D. Donadio and M. Parrinello, Canonical sampling through velocity rescaling, J. Chem. Phys., 2007, 126, 014101 CrossRef PubMed.
- S. Miyamoto and P. A. Kollman, Settle: an analytical version of the SHAKE and RATTLE algorithm for rigid water models, J. Comput. Chem., 1992, 13, 952–962 CrossRef CAS.
- B. Hess, H. Bekker, H. J. Berendsen and J. G. Fraaije, LINCS: a linear constraint solver for molecular simulations, J. Comput. Chem., 1997, 18, 1463–1472 CrossRef CAS.
- H. G. Petersen, Accuracy and efficiency of the particle mesh Ewald method, J. Chem. Phys., 1995, 103, 3668–3679 CrossRef CAS.
- S. Páll and B. Hess, A flexible algorithm for calculating pair interactions on SIMD architectures, Comput. Phys. Commun., 2013, 184, 2641–2650 CrossRef.
- W. Humphrey, A. Dalke and K. Schulten, VMD: visual molecular dynamics, J. Mol. Graphics, 1996, 14, 33–38 CrossRef CAS PubMed.
- P. R. Pandey and S. Roy, Headgroup mediated water insertion into the DPPC bilayer: a molecular dynamics study, J. Phys. Chem. B, 2011, 115, 3155–3163 CrossRef CAS PubMed.
- X.-J. Chen, Q. Liang, Z. Chen, M. Yu, H. Luo, V. Krasnikov, A. Mayer, S. N. Karozis, J. Bingi and V. Matham, Studying the lateral chain packing in a ceramide bilayer with molecular dynamics simulations, J. Phys.: Conf. Ser., 2015, 012014 Search PubMed.
- H. I. Petrache, K. Tu and J. F. Nagle, Analysis of simulated NMR order parameters for lipid bilayer structure determination, Biophys. J., 1999, 76, 2479–2487 CrossRef CAS PubMed.
- L. Peltonen, J. Hirvonen and J. Yliruusi, The effect of temperature on sorbitan surfactant monolayers, J. Colloid Interface Sci., 2001, 239, 134–138 CrossRef CAS PubMed.
- A. Luzar and D. Chandler, Effect of environment on hydrogen bond dynamics in liquid water, Phys. Rev. Lett., 1996, 76, 928 CrossRef CAS PubMed.
- H. L. Friedman, A Course in Statistical Mechanics, Prentice-Hall, Englewood Cliffs, NJ, 1985 Search PubMed.
|
| This journal is © The Royal Society of Chemistry 2024 |
Click here to see how this site uses Cookies. View our privacy policy here. 
 Open Access Article
 This Open Access Article is licensed under a Creative Commons Attribution-Non Commercial 3.0 Unported Licence
 *cd
*cd


 and
and  are the center of mass of a molecule position at time t and at the original time to, respectively. d is the dimensionality of the system (i.e., d = 1, 2, 3 for one, two, or three dimensions, respectively). The numerator of eqn (3) is the MSD. The brackets <…> denote an ensemble average which is an average of all molecules in the simulation and all origins. The MSD plots with movements in the lateral direction (the xy-plane) of Span60 and cholesterol molecules for all niosome bilayers were displayed in Fig. 10a and b, respectively.