DOI:
10.1039/D3RA07545A
(Paper)
RSC Adv., 2024,
14, 3473-3479
Facile synthesis of sulphur-doped carbon dots (S-CDs) using a hydrothermal method for the selective sensing of Cr6+ and Fe3+ ions: application to environmental water sample analysis
Received
5th November 2023
, Accepted 23rd December 2023
First published on 22nd January 2024
Abstract
In this work, we used a one-step hydrothermal method to synthesize blue-emission sulfur-doped carbon dots (S-CDs) using jaggery as a carbon precursor. The synthesized carbon quantum dots showed low toxicity, good water solubility, anti-interference properties, and stable fluorescence. When excited at 310 nm, the S-CDs produced bright emission with a quantum yield of 7.15% at 397 nm. The S-CDs exhibited selective and sensitive quenching responses with limits of detection (LODs) of 4.25 μg mL−1 and 3.15 μg mL−1 for variable concentrations of Cr6+ and Fe3+, respectively, accompanied by a consistent linear relationship between fluorescence intensity and these concentrations. Fluorescence lifetime measurements were used to investigate the fluorescence quenching mechanism, which supports the static type of quenching. Outstanding benefits of the developed S-CD based fluorescence probe include its low cost, excellent sensitivity and selectivity, and ease of use for the detection of Cr6+ and Fe3+ ions. The developed carbon dot based fluorescent probe was successfully used to detect Cr6+ and Fe3+ ions in real water samples with an excellent recovery ratio.
Introduction
Pollution of heavy metals is a critical concern owing to its harmful effects on the environment and human beings. Heavy metals such as cobalt, iron, mercury, chromium, and lead have a high chemical toxicity toward biological organisms.1,2 Among them, iron (Fe3+) and chromium (Cr6+) are the most common metal pollutants detected in environmental water bodies.3,4 Chromium exists in two oxidation states: Cr3+ and Cr6+.5 Cr3+ is an essential nutrient for organisms as it exhibits little toxicity and no harm; however, owing to its high oxidation potential, high levels of Cr6+ have mutagenic and carcinogenic effects on the human body.6,7 The United States Environmental Protection Agency recommends that the concentration of Cr6+ in potable water should be lower than 100 μg L−1.8 Therefore, it is necessary to monitor the concentration of Cr6+ in real water samples. Fe3+ is one of the heavy metals and a main source of water pollution. Therefore, it causes big problems for human health. In cell functioning and biological metabolism, a trace amount of iron (Fe3+) plays an important role in the human body but an excessive amount can put pressure on the liver and subsequently lead to a series of liver diseases.9 Additionally, the accumulation of Fe3+ ions in the environment will cause a great threat to living organisms.
Several approaches have been developed for the accurate and precise detection of Cr6+ and Fe3+, including colorimetry,10,11 electrochemical methods,12,13 atomic absorption spectrometry, inductively coupled plasma-mass spectrometry,14–16 chromatography,17,18 and organic molecular probes.19,20 However, most of these methods require special instrumentation, hazardous chemicals, and complicated synthesis as well as exhibit water dispersibility of organic molecular probes, low selectivity, and high detection limits. On the contrary, the fluorescence based detection method has many advantages, such as high selectivity, wide linear dynamic range, small interference, low detection limit, and simple sample pretreatment.20–22
Carbon dots (CDs) are environment friendly fluorescent nanomaterials exhibiting low toxicity, good water solubility, and excellent optical properties compared to traditional quantum dots, which are the best alternative to fluorescent probes in biosensors and biological imaging.23,24 Various raw materials can be used for CD synthesis; these usually include inorganic materials,25,26 biological materials,27–29 and waste materials,30,31 and CDs are mainly synthesized via hydrothermal or microwave treatments. However, there are few reports on the use of cheap, easily available, environment friendly Chinese herbal medicine and monomers or extracts of Chinese herbal medicine as a source material for CD synthesis. Currently, there are many studies on using CDs as sensors for metal ion detection, whose main detection principle is the quenching effect caused by the varying affinity between the surface functional groups of the CD and the target. Sun et al. synthesized fluorescent carbon quantum dots with Fructus lycii as the raw material.32 Abundant hydroxyl groups on the surface formed a complex with Fe3+ through coordination, exhibiting an internal filtering effect, which could quench the fluorescence of CDs. Wu et al. synthesized low-cost and environment-friendly photoluminescence carbon quantum dots with giant knotweed rhizome as the carbon source and utilized the interaction between carboxyl and Hg2+ on the surface of CDs to form chelates, which were detected through electron or energy transfer.33
In this study, sulphur-doped carbon dots (S-CDs) were synthesized by a one-step hydrothermal method using jaggery as a carbon precursor. The S-CDs have bright emission at 397 nm when excited at 310 nm and have good quantum yield. The sulphur-doped CDs were then used for indirect determination of Cr6+ and Fe3+ in aqueous solution by fluorescence measurement (Scheme 1). The S-CDs exhibit selective and sensitive quenching responses to Cr6+ and Fe3+ ions with a reliable linear relationship between fluorescence intensity and Cr6+ and Fe3+ concentrations. Moreover, the developed S-CDs-based fluorescence probe was successfully applied to real water samples with satisfactory results and showed high potential for selective recognition and accurate estimation of Cr6+ and Fe3+ in a complex matrix.
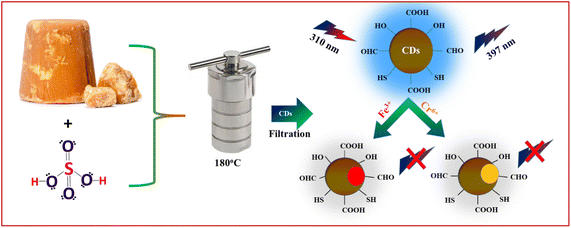 |
| | Scheme 1 Schematic representation of the synthesis of S-CDs and their sensing application for the detection Cr6+ and Fe3+ ions. | |
Experimental
Chemicals and reagents
A jaggery sample was purchased from a local market in Kolhapur, India. All necessary chemicals of analytical reagent grade were procured from SD Fine-Chem, Mumbai, and used as received. All the solutions for measurements were prepared in double distilled water.
Synthesis of fluorescent S-CDs
Sulphur-doped carbon dots (S-CDs) were synthesized by a single-step hydrothermal method using jaggery as a carbon source. Briefly, an appropriate quantity of jaggery and sulphuric acids (H2SO4) was taken in a Teflon-lined autoclave having a 50 mL capacity and heated at 180 °C for 8 hours. After completion of the reaction the autoclave was allowed to cool to room temperature and a dark brown solution was obtained. After that, the resultant solution was centrifuged at 10![[thin space (1/6-em)]](https://www.rsc.org/images/entities/char_2009.gif) 000 rpm for 15 minutes and filtered by using a 0.22 μm syringe filter to remove large particles and impurities. The resultant solution was subjected to dialysis (molecular weight cut-off was 1000 Da) for 24 hours at room temperature. The synthesized S-CDs solution has an acidic pH (pH = 3) while after the dialysis treatment the obtained S-CDs had a near-neutral pH (pH = 6.0). Finally, the S-CDs were stored in the refrigerator for further use.
000 rpm for 15 minutes and filtered by using a 0.22 μm syringe filter to remove large particles and impurities. The resultant solution was subjected to dialysis (molecular weight cut-off was 1000 Da) for 24 hours at room temperature. The synthesized S-CDs solution has an acidic pH (pH = 3) while after the dialysis treatment the obtained S-CDs had a near-neutral pH (pH = 6.0). Finally, the S-CDs were stored in the refrigerator for further use.
Quantum yield measurements (QY)
Quinine sulfate in 0.1 M H2SO4 (QY is 0.54 at 360 nm, η = 1.33) was used as the standard substance to determine the fluorescence QY of synthetic S-CDs,34 which was determined according to the following formula:| |
 | (1) |
The quantum yields of S-CDs and quinine sulfate are expressed by QY and QYR, respectively. ‘I’ represents the integrated fluorescence intensity at the same excitation wavelength. ‘A’ is the absorbance measured with a UV-vis spectrophotometer. The symbols ηS and ηR represent the solvent refractive index of S-CDs and quinine sulfate, respectively.
Characterization
The morphology and microstructure of the sample were investigated using a JEOL, JEM-2100 Plus transmission electron microscope (TEM). Fluorescence and ultraviolet-visible (UV-vis) absorption studies on the synthesized S-CDs were performed using a JASCO Spectrofluorometer FP-8300 and SPECORD 210 Plus Analytic Jena Spectrometer, respectively. Time-correlated single photon counting (TCSPC) spectrophotometer HORIBA Jobin Yvon IBH employing a nanosecond diode laser (IBH, nano LED-07) was used to measure fluorescence emission decay curves. The crystallinity of S-CDs was characterized using a powder X-ray diffractometer (XRD) (Bruker D8 advance, X-ray diffractometer) with CuKα (λ = 1.5406 Å) radiation with a voltage of 45 kV and current of 40 mÅ. X-ray photoelectron spectroscopy (XPS) was performed to estimate the elemental composition of S-CDs. A Fourier transform infrared (FT-IR) spectroscopic study was performed using a Fourier transform infrared spectrophotometer (Bruker alpha).
Fluorescence behavior of S-CDs at different pH
For the study of fluorescence behavior at different pH values, the as-synthesized S-CDs solution was used. In a typical procedure, the fixed volume of the probe solution and buffers of different pH were diluted to 10 mL and the fluorescence of all the solutions having pH 1 to 11 were obtained at the excitation wavelength 310 nm.
Metal ion detection
The metal ion sensing ability of S-CDs was investigated for different metal ions under identical conditions. One mL of 100 ppm solution of each metal ion and one mL of the synthesized S-CDs solution was diluted to 10 mL and allowed to react for 5 minutes at room temperature. The fluorescence measurements of all these solutions were obtained at an excitation wavelength of 310 nm. To study the Cr6+ and Fe3+ sensing capacity of S-CDs, different concentrations of Cr6+ and Fe3+ were diluted to a fixed volume and analyzed similarly.
Real sample analysis
To employ the developed S-CDs-based fluorescent probe for real water analysis, different water samples were collected from the University Campus, Rajaram Lake, and Panchganga River. The collected samples were boiled and filtered to remove the impurities. Filtered samples were spiked with various known concentrations of Cr6+ and Fe3+ and then mixed with S-CDs solution. The fluorescence study of each sample was recorded after 5 minutes of incubation time at room temperature.
Results and discussion
Characterization of S-CDs
TEM measurements were performed to investigate the morphology and size distribution of the S-CDs (Fig. 1). For the TEM measurement, the sample was prepared by placing the S-CDs solution on a copper grid. The histogram shows that the particle size distribution of S-CDs ranged between 5 nm and 9 nm and the average diameter was 7 nm. The SAED pattern shows circular faded rings, indicating the amorphous nature of S-CDs. The XRD pattern of S-CDs, as shown in Fig. 2, shows a broad peak at 2θ ≈ 26.3°, which can be assigned to highly disordered carbon supporting the amorphous nature.35 Additionally, the peak around 2θ ≈ 26.4° indicates that there may be doping of sulphur in carbon dots (JCPDS card number 00-001-0478).36
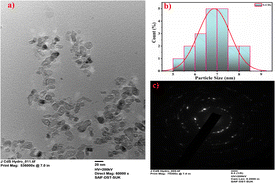 |
| | Fig. 1 (a) High resolution TEM image, (b) particle size distribution, and (c) SAED pattern of the synthesized S-CDs. | |
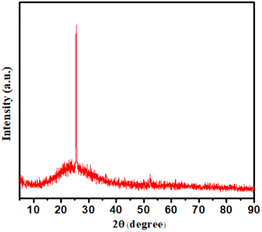 |
| | Fig. 2 XRD pattern of the synthesized S-CDs. | |
Elemental composition and speciation within the S-CDs were determined by XPS. The XPS survey spectrum (Fig. 3) indicates that the S-CDs are mainly composed of carbon, oxygen, and sulphur elements, suggestive of the incorporation of all reagents into the particles. The XPS spectrum show that the prominent peaks around 284 eV and 531 eV are due to carbon and oxygen. Moreover, the peak around 164 eV confirms the presence of sulphur dopant in the carbon core.37,38 The high-resolution XPS spectra of C 1s deconvoluted into three peaks correspond to C–C/C![[double bond, length as m-dash]](https://www.rsc.org/images/entities/char_e001.gif) C, C–S, and C
C, C–S, and C![[double bond, length as m-dash]](https://www.rsc.org/images/entities/char_e001.gif) O groups at binding energies of 284.86 eV, 285.97 eV, and 288.94 eV, respectively (Fig. 3b). Fig. 3c depicts the deconvoluted spectra of O 1s containing two peaks at 532.82 eV and 534.03 eV belonging to C–O/O–H and C
O groups at binding energies of 284.86 eV, 285.97 eV, and 288.94 eV, respectively (Fig. 3b). Fig. 3c depicts the deconvoluted spectra of O 1s containing two peaks at 532.82 eV and 534.03 eV belonging to C–O/O–H and C![[double bond, length as m-dash]](https://www.rsc.org/images/entities/char_e001.gif) O groups, respectively. The S 2p spectra contain two deconvoluted peaks of R–(O
O groups, respectively. The S 2p spectra contain two deconvoluted peaks of R–(O![[double bond, length as m-dash]](https://www.rsc.org/images/entities/char_e001.gif) ) S(
) S(![[double bond, length as m-dash]](https://www.rsc.org/images/entities/char_e001.gif) O)–R and C–SO2− at 169.51 eV and 170.35 eV, respectively (Fig. 3d).39 The presence of C-, O-, and S-containing surface functionalities makes S-CDs more interactive with metal ions.
O)–R and C–SO2− at 169.51 eV and 170.35 eV, respectively (Fig. 3d).39 The presence of C-, O-, and S-containing surface functionalities makes S-CDs more interactive with metal ions.
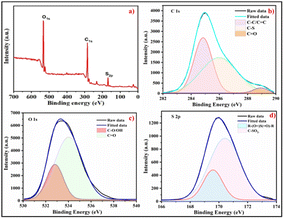 |
| | Fig. 3 (a) XPS survey spectrum of the synthesized S-CDs and high-resolution deconvoluted spectra of (b) C 1s, (c) O 1s, and (d) S 2p. | |
The FT-IR spectrum (Fig. 4) showed different characteristic peaks of S-CDs for different functional groups. In the spectrum, a broad peak around 3300 cm−1 is of O–H stretching vibrations since S-CDs are well dispersed in water. The peaks at 1680 cm−1 are due to C![[double bond, length as m-dash]](https://www.rsc.org/images/entities/char_e001.gif) O. In addition to the carbonyl group, the peak at 1198 cm−1 can be assigned to the C–S bond, whereas the peak at 1059 cm−1 can be consigned to the C–O bond. FT-IR study concluded that there could be a number of hydrophilic functional groups on the surface of S-CDs, which caused excellent water solubility and helped in complex formation.35–40
O. In addition to the carbonyl group, the peak at 1198 cm−1 can be assigned to the C–S bond, whereas the peak at 1059 cm−1 can be consigned to the C–O bond. FT-IR study concluded that there could be a number of hydrophilic functional groups on the surface of S-CDs, which caused excellent water solubility and helped in complex formation.35–40
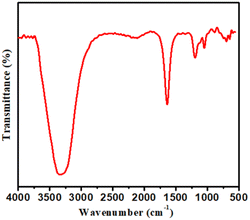 |
| | Fig. 4 FT-IR spectrum of the synthesized S-CDs. | |
Optical properties
The optical properties of synthesized S-CDs were studied by UV-vis and fluorescence spectroscopy (Fig. 5). Absorption at 287 nm was observed in UV-vis, which is assigned to π → π* transition due to the sp2 domains of C![[double bond, length as m-dash]](https://www.rsc.org/images/entities/char_e001.gif) C from the carbon core. Similarly, emission behavior of S–C-dots at different excitation wavelengths were also studied. The excitation wavelength of 310 nm resulted in maximum emission intensity. Therefore, using an excitation wavelength of 310 nm, the emission behavior of S-CDs was studied at different pH. The result showed that there was not much change in the fluorescence intensity of S-CDs as the pH of the solution increased (Fig. 6). Also, the quantum yield of the as-synthesized S-CDs was determined to be 7.15%.
C from the carbon core. Similarly, emission behavior of S–C-dots at different excitation wavelengths were also studied. The excitation wavelength of 310 nm resulted in maximum emission intensity. Therefore, using an excitation wavelength of 310 nm, the emission behavior of S-CDs was studied at different pH. The result showed that there was not much change in the fluorescence intensity of S-CDs as the pH of the solution increased (Fig. 6). Also, the quantum yield of the as-synthesized S-CDs was determined to be 7.15%.
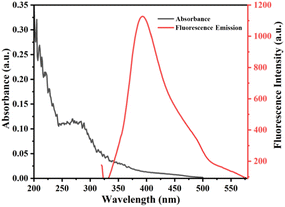 |
| | Fig. 5 UV-vis absorption and fluorescence emission spectra of the synthesized S-CDs. | |
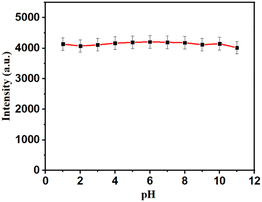 |
| | Fig. 6 Effect of pH on the fluorescence intensity of S-CDs. | |
Effect of pH on fluorescence properties
The effect of pH on the fluorescence properties of S-CDs was investigated at different pH values from 2 to 12. Fig. 6 shows the fluorescence behavior of S-CDs at different pH values. Almost no change in the emission intensity of CDs with pH was observed, which indicated a pH-independent emission nature of S-CDs. The results revealed that the synthesized S-CDs are highly stable with changes in pH.
Selectivity study
To explore the selectivity of the sensor system and the influence of different ions on the fluorescence intensity of S-CDs, each metal ion of 10 μg mL−1 was added to the S-CDs solution under optimal experimental conditions. As shown in Fig. 7, S-CDs showed a significant fluorescence reduction in Cr6+ and Fe3+ in the presence of various metal ions, indicating that S-CDs have good selectivity and a unique effect on Cr6+ and Fe3+.
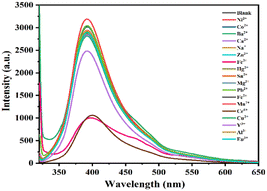 |
| | Fig. 7 Fluorescence spectra of S-CDs in the presence of various metal ions. | |
To further study the sensitivity of Cr6+ and Fe3, the fluorescence spectra of S-CDs after adding different concentrations of Cr6+ and Fe3+ were recorded+, as shown in Fig. 8 and 9. When the concentration of Cr6+ and Fe3+ was increased, the fluorescence intensity of S-CDs decreased continuously, confirming the applicability of Cr6+ and Fe3+ as a “turn-off” fluorescent probe. Fig. 10 and 11 suggest a good linear relationship between Cr6+ and Fe3+ concentration and the fluorescence intensity of S-CDs in the range of 5 μg mL−1 to 30 μg mL−1, and 5 μg mL−1 to 70 μg mL−1, respectively. The coefficient of determination (R2) values were 0.995 and 0.988, respectively. The detection limits of Cr6+ and Fe3+ were 4.25 μg mL−1 and 3.15 μg mL−1, respectively, calculated using the formula 3σ/k (σ is the standard deviation and k is the slope of the calibration curve).
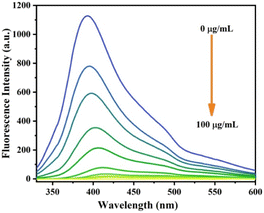 |
| | Fig. 8 Fluorescence spectra of S-CDs in the presence of different concentrations of Cr6+ (5 μg mL−1 to 100 μg mL−1). | |
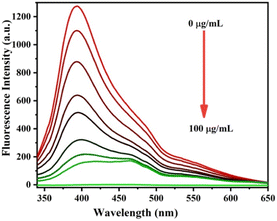 |
| | Fig. 9 Fluorescence spectra of S-CDs in the presence of different concentrations of Fe3+ (5 μg mL−1 to 100 μg mL−1). | |
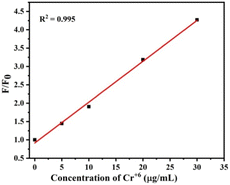 |
| | Fig. 10 Linear plots of F/F0 versus the concentration of Cr6+ in the range 5 μg mL−1 to 30 μg mL−1 (F0 and F represent the fluorescence intensity of the initial and added Cr6+, respectively). | |
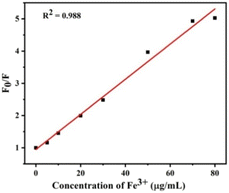 |
| | Fig. 11 Linear plots of F/F0 versus the concentration of Fe3+ in the range 5 μg mL−1 to 70 μg mL−1 (F0 and F represent the fluorescence intensity of the initial and added Fe6+, respectively). | |
Fig. 10 and 11 suggest a good linear relationship between Cr6+ and Fe3+ concentrations and the fluorescence intensity of S-CDs in the range of 5 μg mL−1 to 30 μg mL−1 and 5 μg mL−1 to 70 μg mL−1, respectively. The coefficients of determination (R2) were 0.995 and 0.988, respectively. The detection limits of Cr6+ and Fe3+ were 4.25 μg mL−1 and 3.15 μg mL−1, respectively, calculated using the formula 3σ/k (σ is the standard deviation and k is the slope of the calibration curve).
Mechanism for detecting Cr6+ and Fe3+ by S-CDs
To explore the fluorescence quenching mechanism of S-CDs by Cr6+ and Fe3+, a fluorescence lifetime study was performed. As shown in Fig. 12 and 13, no obvious changes in the lifetime indicated that the fluorescence quenching of CDs by Cr6+ and Fe3+ is attributed to the static type of quenching effect, i.e., the ground state complex formation takes place between the surface groups of S-CDs and Cr6+ and Fe3+ ions. The fluorescence quenching of S-CDs by Cr6+ and Fe3+ could be due to the electrostatic interaction as well as ionic interactions between the negative surface groups of S-CDs and Cr6+ and Fe3+ ions, which lead to the complexation between them.35,40
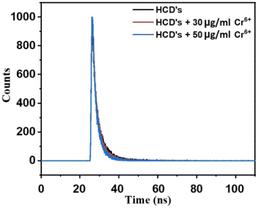 |
| | Fig. 12 Plot of the fluorescence decay of S-CDs in the presence of different concentrations of Cr6+ (T0 μg mL−1 = 2.80 ns, T30 μg mL−1 = 2.40 ns and T50 μg mL−1 = 2.03 ns). | |
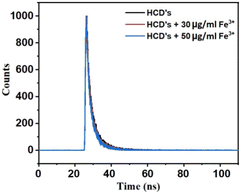 |
| | Fig. 13 Plot of the fluorescence decay of S-CDs in the presence of different concentrations of Fe3+ (T0 μg mL−1 = 2.99 ns, T30 μg mL−1 = 2.94 ns and T50 μg mL−1 = 2.90 ns). | |
Cr6+ and Fe3+ detection in real samples
Standard recovery experiments were performed using tap water, lake water, and river water samples to determine whether the S-CD fluorescence method could be used to determine Cr6+ and Fe3+ concentrations in real samples, and the results are summarized in Tables 1 and 2, respectively. Each water sample was filtered and then centrifuged at 10![[thin space (1/6-em)]](https://www.rsc.org/images/entities/char_2009.gif) 000 rpm for 10 min before analysis. As shown in Tables 1 and 2, the experimental results showed that recoveries of Cr6+ and Fe3+ reached 97.20–99.25% and 99.87–101.48%, respectively, with the relative standard deviation (RSD) values of 1.17–1.62% and 0.26–0.97%, respectively, all of which were less than 2%.
000 rpm for 10 min before analysis. As shown in Tables 1 and 2, the experimental results showed that recoveries of Cr6+ and Fe3+ reached 97.20–99.25% and 99.87–101.48%, respectively, with the relative standard deviation (RSD) values of 1.17–1.62% and 0.26–0.97%, respectively, all of which were less than 2%.
Table 1 Determination of Cr6+ in real water samples
| Samples |
Spiked (μg mL−1) |
Founda (μg mL−1) |
Recovery (%) |
RSD (%) (n = 3) |
| Mean of three measurements. |
| Tap water |
5 |
4.94 |
98.80 |
1.17 |
| 10 |
9.78 |
97.80 |
1.21 |
| 20 |
19.7 |
98.50 |
1.30 |
| Lake water |
5 |
4.86 |
97.20 |
1.57 |
| 10 |
9.82 |
98.20 |
1.62 |
| 20 |
19.76 |
98.80 |
1.43 |
| River water |
5 |
4.9 |
98.00 |
1.33 |
| 10 |
9.87 |
98.70 |
1.26 |
| 20 |
19.85 |
99.25 |
1.35 |
Table 2 Determination of Fe3+ in real water samples
| Samples |
Spiked (μg mL−1) |
Founda (μg mL−1) |
Recovery (%) |
RSD (%) (n = 3) |
| Mean of three measurements. |
| Tap water |
20 |
20.12 |
100.60 |
0.97 |
| 30 |
29.96 |
99.87 |
0.56 |
| 40 |
40.59 |
101.48 |
0.82 |
| Lake water |
20 |
20.29 |
101.45 |
0.51 |
| 30 |
30.1 |
100.33 |
0.88 |
| 40 |
40.33 |
100.83 |
0.66 |
| River water |
20 |
20.2 |
101.00 |
0.36 |
| 30 |
30.28 |
100.93 |
0.55 |
| 40 |
40.44 |
101.10 |
0.26 |
Conclusions
In summary, a simple one-step hydrothermal method for the synthesis of carbon quantum dots, with jaggery as the precursor, showing blue fluorescence emission was established. The Cr6+ and Fe3+ ion quenches the fluorescence intensity of S-CDs due to electrostatic interaction between negatively charged surface groups of S-CDs and positive ions and it was supported by fluorescence life time study. Therefore, fluorescence analysis platform for the detection of Cr6+ and Fe3+ was established, which can be used for the sensitive and selective detection of Cr6+ and Fe3+ in real water samples with limit of detections (LOD) of 4.25 μg mL−1 and 3.15 μg mL−1, respectively, with satisfactory results and broad application prospects in environmentally and biologically related fields.
Author contributions
Conceptualization and methodology: AK, SP, and DG, characterization and data analysis: ON, PA, and SK, writing of the original draft: AK and SP, review and editing: GK, DS, and NN, supervision, conceptualization, writing, reviewing and editing: GG and VM.
Conflicts of interest
The authors declare that they have no competing financial interests.
Acknowledgements
The authors thank the Department of Chemistry, Shivaji University, Kolhapur, the Department of Chemistry, and The New College, Kolhapur for the laboratory facilities and characterizations. Daewon Sohn and Ngoc Quang Nguyene thanks to the National Research Foundation of Korea (NRF) 2020R1A6A1A06046728, 2022R1A2C1010580 and 2022R1A6C101A779-23.
Notes and references
- Y. Liu, Q. Xue, C. Chang, R. Wang, Z. Liu and L. He, Anal. Sci., 2022, 38, 55–70 CrossRef CAS PubMed.
- F. Yarur, J. R. Macairan and R. Naccache, Environ. Sci.: Nano, 2019, 6, 1121–1130 RSC.
- H. Zhang, Y. Huang, Z. Hu, C. Tong, Z. Zhang and S. Hu, Microchim. Acta, 2017, 184, 1547–1553 CrossRef CAS.
- Y. Li, J. Chen, Y. Wang, H. Li, J. Yin, M. Li and L. Chen, Appl. Surf. Sci., 2021, 538, 148151 CrossRef CAS.
- S. Zhang, L. Jin, J. Liu, Q. Wang and L. Jiao, Mater. Chem. Phys., 2020, 248, 122912 CrossRef CAS.
- N. N. Nghia, B. T. Huy and Y. I. Lee, Microchim. Acta, 2019, 186, 1–7 CrossRef CAS PubMed.
- Y. Shen, Y. Wei, C. Zhu and D. M. Han, Coord. Chem. Rev., 2022, 458, 214442 CrossRef CAS.
- F. Ming, J. Hou, C. Hou and Q. He, Spectrochim. Acta, Part A, 2019, 222, 117165 CrossRef CAS PubMed.
- L. Gu, J. Zhang and C. Kong, Food Chem., 2022, 376, 131898 CrossRef CAS PubMed.
- J. F. Guo, D. Q. Huo, M. Yang and P. Yang, Talanta, 2016, 161, 819–825 CrossRef CAS PubMed.
- S. Balasubramanian, A. Udayabhanu, P. S. Kumar, P. Muthamilselvi, C. Eswari, A. Vasantavada, S. Kanetkar and A. Kapoor, Int. J. Environ. Anal. Chem., 2023, 103, 2480–2497 CrossRef CAS.
- L. E. Korshoj, A. J. Zaitouna and R. Y. Lai, Anal. Chem., 2015, 87, 2560–2564 CrossRef CAS PubMed.
- M. Nosuhi and A. Nezamzadeh-Ejhieh, Electrochim. Acta, 2017, 223, 47–62 CrossRef CAS.
- E. Yilmaz and M. Soylak, Talanta, 2016, 160, 680–685 CrossRef CAS PubMed.
- Z. Li, Y. Zhang, R. Wang and D. Jiang, J. Appl. Spectrosc., 2022, 89, 371–380 CrossRef CAS.
- H. Hagendorfer and W. Goessler, Talanta, 2008, 76, 656–661 CrossRef CAS PubMed.
- F. Roig-Navarro, Y. Martinez-Bravo, F. J. Lopez and F. Hernandez, J. Chromatogr. A, 2001, 912, 319–327 CrossRef PubMed.
- L. Maknun, K. Kińska, I. González-Álvarez and R. Lobinski, Anal. Chem., 2023, 95, 9182–9190 CrossRef CAS PubMed.
- A. Jebnouni, K. Baatout and M. Majdoub, Opt. Mater., 2022, 134, 113091 CrossRef CAS.
- T. Liu, Q. Huang, W. Wu, T. Ren and J. Zhang, Opt. Mater., 2022, 130, 112568 CrossRef CAS.
- Y. Zhang, X. Fang, H. Zhao and Z. Li, Talanta, 2018, 181, 318–325 CrossRef CAS PubMed.
- S. Huang, H. Qiu, F. Zhu and Q. Xiao, Microchim. Acta, 2015, 182, 1723–1731 CrossRef CAS.
- S. Feng, Z. Gao, H. Liu, J. Huang, X. Li and Y. Yang, Spectrochim. Acta, Part A, 2019, 212, 286–292 CrossRef CAS PubMed.
- Y. Liu, W. Duan, W. Song and H. Chen, ACS Appl. Mater. Interfaces, 2017, 9, 12663–12672 CrossRef CAS PubMed.
- L. Li, L. Shi, J. Jia, D. Chang, C. Dong and S. Shuang, Analyst, 2020, 145, 5450–5457 RSC.
- M. Zheng, Y. Li, S. Liu, W. Wang, Z. Xie and X. Jing, ACS Appl. Mater. Interfaces, 2016, 8, 23533–23541 CrossRef CAS PubMed.
- M. Cao, C. Xia, J. Xia, D. Jiang, C. Yu and H. Li, J. Lumin., 2019, 206, 97–104 CrossRef CAS.
- Y. Zhang, Z. Gao, X. Yang, J. Chang, Z. Liu and K. Jiang, RSC Adv., 2019, 9, 940–949 RSC.
- R. Atchudan, T. Edison, S. Perumal, R. Vinodh and Y. R. Lee, J. Mol. Liq., 2019, 296, 111817 CrossRef CAS.
- Y. Yu, C. Li, C. Chen, H. Huang, C. Liang, Y. Lou and S. Feng, Talanta, 2019, 195, 117–126 CrossRef CAS PubMed.
- J. Ahn, Y. Song, J. E. Kwon, S. H. Lee, K. S. Park, S. Kim and H. Kim, Mater. Sci. Eng., C, 2019, 102, 106–112 CrossRef CAS PubMed.
- X. Sun, J. He, S. Yang, M. Zheng, Y. Wang, S. Ma and H. Zheng, J. Photochem. Photobiol., B, 2017, 175, 219–225 CrossRef CAS PubMed.
- D. Wu, X. Huang, X. Deng, K. Wang and Q. Liu, Anal. Methods, 2013, 5, 3023–3027 RSC.
- M. Azizi, H. Valizadeh, M. Shahgolzari, M. Talebi, E. Baybordi, M. R. Dadpour and M. Mehrmohammadi, ACS Omega, 2020, 5, 24628–24638 CrossRef CAS PubMed.
- D. B. Gunjal, Y. M. Gurav, A. H. Gore and G. B. Kolekar, Opt. Mater., 2019, 98, 109448 CrossRef.
- V. M. Naik, D. B. Gunjal, A. H. Gore and G. B. Kolekar, Diamond Relat. Mater., 2018, 88, 262–268 CrossRef CAS.
- H. Ding, Y. Ji, J. Wei, Q. Y. Gao, Z. Y. Zhou and H. M. Xiong, J. Mater. Chem. B, 2017, 5, 5272–5277 RSC.
- Z. Hu, X. Y. Jiao and L. Xu, Microchem. J., 2020, 154, 104588 CrossRef CAS.
- X. Chen and J. Che, Food Chem. Adv., 2022, 1, 100112 CrossRef.
- W. L. Ang, N. S. Sambudi, A. Mohammad and W. A. Benamor, Sci. Rep., 2020, 10, 21119 CrossRef PubMed.
|
| This journal is © The Royal Society of Chemistry 2024 |
Click here to see how this site uses Cookies. View our privacy policy here.  Open Access Article
 *ac,
Dattatray B. Gunjala,
Omkar S. Nillea,
Prashant V. Anbhule
 a,
Sneha V. Kopardeac,
Ngoc Quang Nguyen
 e,
Daewon Sohne,
Govind B. Kolekara,
Gavisiddappa S. Gokavid and
Vishalkumar R. More*b

![[thin space (1/6-em)]](https://www.rsc.org/images/entities/char_2009.gif) 000 rpm for 15 minutes and filtered by using a 0.22 μm syringe filter to remove large particles and impurities. The resultant solution was subjected to dialysis (molecular weight cut-off was 1000 Da) for 24 hours at room temperature. The synthesized S-CDs solution has an acidic pH (pH = 3) while after the dialysis treatment the obtained S-CDs had a near-neutral pH (pH = 6.0). Finally, the S-CDs were stored in the refrigerator for further use.
000 rpm for 15 minutes and filtered by using a 0.22 μm syringe filter to remove large particles and impurities. The resultant solution was subjected to dialysis (molecular weight cut-off was 1000 Da) for 24 hours at room temperature. The synthesized S-CDs solution has an acidic pH (pH = 3) while after the dialysis treatment the obtained S-CDs had a near-neutral pH (pH = 6.0). Finally, the S-CDs were stored in the refrigerator for further use.


![[double bond, length as m-dash]](https://www.rsc.org/images/entities/char_e001.gif) C, C–S, and C
C, C–S, and C![[double bond, length as m-dash]](https://www.rsc.org/images/entities/char_e001.gif) O groups at binding energies of 284.86 eV, 285.97 eV, and 288.94 eV, respectively (Fig. 3b). Fig. 3c depicts the deconvoluted spectra of O 1s containing two peaks at 532.82 eV and 534.03 eV belonging to C–O/O–H and C
O groups at binding energies of 284.86 eV, 285.97 eV, and 288.94 eV, respectively (Fig. 3b). Fig. 3c depicts the deconvoluted spectra of O 1s containing two peaks at 532.82 eV and 534.03 eV belonging to C–O/O–H and C![[double bond, length as m-dash]](https://www.rsc.org/images/entities/char_e001.gif) O groups, respectively. The S 2p spectra contain two deconvoluted peaks of R–(O
O groups, respectively. The S 2p spectra contain two deconvoluted peaks of R–(O![[double bond, length as m-dash]](https://www.rsc.org/images/entities/char_e001.gif) ) S(
) S(![[double bond, length as m-dash]](https://www.rsc.org/images/entities/char_e001.gif) O)–R and C–SO2− at 169.51 eV and 170.35 eV, respectively (Fig. 3d).39 The presence of C-, O-, and S-containing surface functionalities makes S-CDs more interactive with metal ions.
O)–R and C–SO2− at 169.51 eV and 170.35 eV, respectively (Fig. 3d).39 The presence of C-, O-, and S-containing surface functionalities makes S-CDs more interactive with metal ions.
![[double bond, length as m-dash]](https://www.rsc.org/images/entities/char_e001.gif) O. In addition to the carbonyl group, the peak at 1198 cm−1 can be assigned to the C–S bond, whereas the peak at 1059 cm−1 can be consigned to the C–O bond. FT-IR study concluded that there could be a number of hydrophilic functional groups on the surface of S-CDs, which caused excellent water solubility and helped in complex formation.35–40
O. In addition to the carbonyl group, the peak at 1198 cm−1 can be assigned to the C–S bond, whereas the peak at 1059 cm−1 can be consigned to the C–O bond. FT-IR study concluded that there could be a number of hydrophilic functional groups on the surface of S-CDs, which caused excellent water solubility and helped in complex formation.35–40![[double bond, length as m-dash]](https://www.rsc.org/images/entities/char_e001.gif) C from the carbon core. Similarly, emission behavior of S–C-dots at different excitation wavelengths were also studied. The excitation wavelength of 310 nm resulted in maximum emission intensity. Therefore, using an excitation wavelength of 310 nm, the emission behavior of S-CDs was studied at different pH. The result showed that there was not much change in the fluorescence intensity of S-CDs as the pH of the solution increased (Fig. 6). Also, the quantum yield of the as-synthesized S-CDs was determined to be 7.15%.
C from the carbon core. Similarly, emission behavior of S–C-dots at different excitation wavelengths were also studied. The excitation wavelength of 310 nm resulted in maximum emission intensity. Therefore, using an excitation wavelength of 310 nm, the emission behavior of S-CDs was studied at different pH. The result showed that there was not much change in the fluorescence intensity of S-CDs as the pH of the solution increased (Fig. 6). Also, the quantum yield of the as-synthesized S-CDs was determined to be 7.15%.


![[thin space (1/6-em)]](https://www.rsc.org/images/entities/char_2009.gif) 000 rpm for 10 min before analysis. As shown in Tables 1 and 2, the experimental results showed that recoveries of Cr6+ and Fe3+ reached 97.20–99.25% and 99.87–101.48%, respectively, with the relative standard deviation (RSD) values of 1.17–1.62% and 0.26–0.97%, respectively, all of which were less than 2%.
000 rpm for 10 min before analysis. As shown in Tables 1 and 2, the experimental results showed that recoveries of Cr6+ and Fe3+ reached 97.20–99.25% and 99.87–101.48%, respectively, with the relative standard deviation (RSD) values of 1.17–1.62% and 0.26–0.97%, respectively, all of which were less than 2%.


