 Open Access Article
Experimental study on CO2 capture by MEA/n-butanol/H2O phase change absorbent†
Yanlong Hua,
Qiang Wang *a,
Dingkai Hua,
Yingshuang Zhanga,
Muhammad Furqana and
Shijian Lub
aState Key Laboratory of Chemistry and Utilization of Carbon-Based Energy Resources, Xinjiang Key Laboratory of Coal Cleaning Conversion & Chemical Engineering, Xinjiang Uyghur Autonomous Region, School of Chemical Engineering and Technology, Xinjiang University, Urumqi, Xinjiang 830017, P. R. China. E-mail: wangqiang@xju.edu.cn; Fax: +869918582966
bInstitute of Carbon Neutralization, China University of Mining and Technology, School of Chemical Engineering, Xuzhou, Jiangsu 221116, China
First published on 19th January 2024
Abstract
Monoethanolamines (MEAs) are widely used for CO2 capture, but their regeneration energy consumption is very high. CO2 Phase change absorbents (CPCAs) can be converted into CO2-rich and CO2-lean phases after absorbing CO2, and the regeneration energy consumption can be reduced because only the CO2-rich phase is thermally desorbed. In this paper, a novel CPCA with the composition “MEA/n-butanol/H2O (MNBH)” is proposed. Compared with the reported MEA phase change absorbent, the MNBH absorbent has higher CO2 absorption capacity, smaller absorbent viscosity and CO2-rich phase volume. The MNBH absorbent has the highest CO2 absorption capacity of 2.5227 mol CO2 per mol amine at a mass ratio of 3![[thin space (1/6-em)]](https://www.rsc.org/images/entities/char_2009.gif) :
:![[thin space (1/6-em)]](https://www.rsc.org/images/entities/char_2009.gif) 4
4![[thin space (1/6-em)]](https://www.rsc.org/images/entities/char_2009.gif) :
:![[thin space (1/6-em)]](https://www.rsc.org/images/entities/char_2009.gif) 3. The CO2 desorption efficiency reaches 89.96% at 120 °C, and the CO2 regeneration energy consumption is 2.6 GJ tCO2−1, which is about 35% lower than that of the 30 wt% MEA absorbent. When the mass ratio of MNBH absorbent was 3
3. The CO2 desorption efficiency reaches 89.96% at 120 °C, and the CO2 regeneration energy consumption is 2.6 GJ tCO2−1, which is about 35% lower than that of the 30 wt% MEA absorbent. When the mass ratio of MNBH absorbent was 3![[thin space (1/6-em)]](https://www.rsc.org/images/entities/char_2009.gif) :
:![[thin space (1/6-em)]](https://www.rsc.org/images/entities/char_2009.gif) 6
6![[thin space (1/6-em)]](https://www.rsc.org/images/entities/char_2009.gif) :
:![[thin space (1/6-em)]](https://www.rsc.org/images/entities/char_2009.gif) 1, the CO2 recycling capacity was 4.1918 mol CO2 L−1, which is 76% higher than that of the conventional 30 wt% MEA absorbent. The phase change absorbent developed in this paper can reduce the desorbent volume by about 50% and has good absorption performance for CO2 in flue gas.
1, the CO2 recycling capacity was 4.1918 mol CO2 L−1, which is 76% higher than that of the conventional 30 wt% MEA absorbent. The phase change absorbent developed in this paper can reduce the desorbent volume by about 50% and has good absorption performance for CO2 in flue gas.
1. Introduction
CO2 occupies 64% of the total amount of greenhouse gases, and is the main culprit causing the greenhouse effect.1,2 A large amount of CO2 emissions will gradually increase the surface temperature of the earth, causing many environmental problems such as a catastrophic climate and sea level rise, which will restrict the healthy development of the national economy.3,4 According to the data released by the International Energy Agency (IEA) in 2022, CO2 emissions from power plants account for 50% of the total emissions.5 Therefore, CO2 capture in power plants has become very important. Among many CO2 capture technologies in power plants, the chemical absorption method is widely used because of its high CO2 recovery rate, mature process and strong adaptability to coal-fired power plants.6Monoethanolamine (MEA) is widely used in the CO2 capture field, but its regeneration energy consumption is very high.7 In order to further reduce the energy consumption of CO2 capture by chemical absorption, researchers have developed many new absorbents, such as mixed amine absorbents, anhydrous absorbents, ionic liquids (ILS) and deep eutectic solvents (DESs). Although these chemical absorbents improved CO2 absorption performance to some extent, there are still some defects such as high energy consumption for CO2 desorption and poor recycling performance of absorbents, which limited their further industrial popularization.
CO2 phase change absorbents (CPCAs) are a new type of CO2 absorbent. Different from organic amine aqueous solution, CPCAs are divided into two phases with different CO2 loading after absorbing CO2. Only the CO2-rich phase loaded with CO2 enters the desorption unit, thus reducing desorption energy consumption. In 2009, the concept of CPCAs was first proposed in the patent published by Liang Hu.8 Fresh CPCAs are homogeneous phases, but phase separation occurs after absorbing CO2 or changing absorption temperature. One phase where CO2 absorption products are mainly collected is called the CO2-rich phase, and the other phase is called the CO2-lean phase.9 According to the state of the CO2-rich phase, it can be divided into solid–liquid phase change absorbent and liquid–liquid phase change absorbent. Liquid–liquid phase change absorbent is suitable for conventional chemical absorption process if it is enlarged and put into industry, which has little improvement on traditional absorption devices.10 Therefore, nowadays, most of the research is mostly focused on the development and application of liquid–liquid phase change absorbents.
Ye11 explored triethylenetetramine (TETA)/N, N-diethylethanolamine (DEEA) phase change absorbent, and found that its CO2 absorption performance and regeneration energy consumption were affected by water content. When the water content was 46 wt%, the absorption capacity of the solution was 0.97 mol CO2 per mol amine, and the regeneration energy consumption was 2.98 GJ t−1 CO2. Svendsen12,13 developed phase change absorbents of DEEA and 3-(methylamine) propylamine (MAPA) with energy consumption as low as 2.1 GJ t−1 CO2. Huang14 dissolved amino-functionalized IL-triethylamine tetramine lysine (TETAH] [Lys]) in an ethanol–water solvent. The viscosity of this phase change adsorbent was relatively low, and the CO2 loading in the CO2-rich phase reached 93%. Only one-third of the desorption liquid was sent to the stripper.
MEA is a primary amine, which has many advantages such as low price, fast CO2 absorption rate, relatively high absorption capacity and stable chemical properties, so it is favoured by researchers. At present, MEA-based phase change absorbents have been reported in the literature, including MEA/n-propyl alcohol/H2O, MEA/isopropyl alcohol/H2O and MEA/tert-butanol/H2O, while the article on MEA/n-butanol/H2O phase change absorbent has not been reported. In this paper, MEA/n-butanol/H2O phase change absorbent (denoted as MNBH) was developed with MEA as the main absorbent, n-butanol as the phase separation accelerator, and water as the solvent, and compared with the CO2 absorption performance of existing MEA phase-change absorbents. Then, the CO2 absorption and regeneration properties of MNBH, cyclic regeneration capacity, two-phase material distribution and CO2 capture performance in simulated flue gas were further studied.
2. Experimental section
2.1 Reagents and instruments
2.2 Experimental process
The CO2 absorption experimental device is shown in Fig. 1, and the CO2 desorption experimental device is shown in Fig. 2. Except for the simulated flue gas experiments, all absorption experiments used high-purity CO2 gas. Firstly, the optimal MEA mass concentration is determined. Secondly, the mass concentration of MEA was fixed, the concentration of n-butanol was changed, and the MNBH absorbent with different mass ratio was prepared, and the optimal dosage of n-butanol was determined according to the phase separation behavior and CO2 absorption performance. Under the optimal ratio of MNBH absorbent, the absorption, desorption and recycling ability of MNBH to CO2 were further studied. Finally, FT-IR and 1H NMR techniques were used to analyze the two-phase material distribution of MNBH phase change absorbent, and the phase change mechanism was explained. Finally, the feasibility of MNBH capturing CO2 in flue gas was verified by simulated flue gas experiments.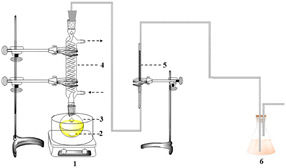 | ||
| Fig. 2 CO2 desorption device diagram. (1) Oil bath (2) magneton (3) single mouth flasks (4) snake condenser tube (5) soap bubble flow meter (6) tail gas treatment unit. | ||
CO2 absorption capacity and absorption rate were used to evaluate the CO2 absorption performance of MNBH. The calculation method of CO2 absorption rate is as shown in formula (1):16
 | (1) |
The CO2 absorption capacity is calculated as shown in formula (2).16
 | (2) |
The CO2 absorption loading is calculated as shown in formula (3).17
 | (3) |
The CO2 desorption performance and cycle capacity of MNBH were investigated by the formula given in formula (4) and (5). CO2 circulation capacity refers to the difference of CO2 capacity before and after desorption of unit volume absorbent (in which CO2 capacity in CO2-lean phase and CO2-rich phase can be measured by titration) formula (4) Shown in:18
| ΔR = Rbde − Rade | (4) |
The desorption efficiency is calculated as shown in formula (5):18
 | (5) |
 | ||
| Fig. 4 Depleted-CO2-rich phase CO2 loading measurement device. (1) magnetic stirrer (2) magnets (3) dilute hydrochloric acid (4) acid burette (5) U-tube. | ||
The calculation method of CO2 loading in CO2-rich and CO2-lean phase is shown in formula (6).19 The repetition error of CO2 loading test was ±5%.
 | (6) |
| Qreg = ΔHabs + Qsens + Qlatent | (7) |
The ΔHabs is measured in two ways, either by a calorimeter or by the Gibbs Helmholtz equation. In this paper, the gas–liquid equilibrium experimental device used by Xiao21 et al. and Zhang22 et al. was used to measure the CO2 equilibrium solubility of each amine solvent at different temperatures and different CO2 partial pressures, and the ΔHabs was calculated by Gibbs Helmholtz equation. The Gibbs Helmholtz equation is shown in formula (8):
 | (8) |
Qsens is the energy required to heat the CO2-rich phase from the absorption temperature to the desorption temperature. It can be calculated using formula (9):17
 | (9) |
Qlatent refers to the amount of energy to be absorbed by partial solvents such as water and n-propanol for generating steam at 393.15 K of rich phase. Which can be calculated by formula (10):17
| Qlatent = mwλ | (10) |
mw is calculated by formula (11):
 | (11) |
 is the CO2 partial pressure at the top temperature of the stripper.
3. Results and discussion
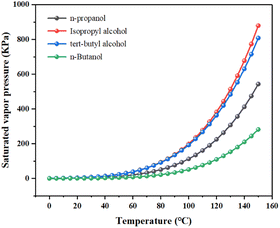
N-Butanol is an excellent alcohol organic solvent, which has the characteristics of low price and low viscosity. This makes it a very popular phase separator. Compared with n-propanol, isopropanol and tert-butanol, n-butanol has low saturated vapour pressure. The saturated vapour pressure values of n-propanol, isopropanol, tert-butanol and n-butanol at 1 atm, 0–150 °C (temperature range increment is 5 °C) were obtained by Aspenplus simulation. In the study of physical properties, the physical properties method was chosen as NRTL (Non-Random Two-Liquid). Fig. 6 shows our simulation results.It can be seen from Fig. 6 that n-butanol has the lowest saturated vapour pressure compared with other alcohols, Therefore, using n-butanol as a phase separation accelerator is more conducive to reducing the volatilization loss of phase change system.
The total mass of the phase change system was selected as 20 g, and the mass ratio of each component in the phase change system was 3![[thin space (1/6-em)]](https://www.rsc.org/images/entities/char_2009.gif) :
:![[thin space (1/6-em)]](https://www.rsc.org/images/entities/char_2009.gif) 4
4![[thin space (1/6-em)]](https://www.rsc.org/images/entities/char_2009.gif) :
:![[thin space (1/6-em)]](https://www.rsc.org/images/entities/char_2009.gif) 3. Under the experimental conditions of absorption temperature of 30 °C, 1 atm, and CO2 flow rate of 100 mL min−1, the experimental results of the absorption of pure CO2 by the four phase change absorbents are shown in Table 1.
3. Under the experimental conditions of absorption temperature of 30 °C, 1 atm, and CO2 flow rate of 100 mL min−1, the experimental results of the absorption of pure CO2 by the four phase change absorbents are shown in Table 1.
| Phase separation solvent | Whether phase is separated | Absorption capacity (mol CO2 L−1) | Equilibrium time (min) | Viscosity (mPa s) | Percentage of CO2-rich phase volume (%) | Ref. |
|---|---|---|---|---|---|---|
| n-Propanol | Yes | 2.1567 | 25 | 12.10 | 59 | 19 |
| Isopropanol | Yes | 1.9911 | 20 | 10.12 | 64 | 19 |
| Tert-butyl alcohol | Yes | 1.8902 | 20 | 11.68 | 55 | 23 |
| n-Butanol | Yes | 2.4081 | 35 | 8.86 | 50 | This work |
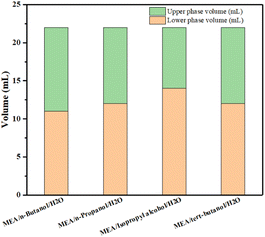
It can be seen from Table 1 that all the four absorption systems can be divided into phases after absorbing CO2 to saturation, with MNBH absorbent having the highest CO2 absorption capacity and the lowest viscosity of the absorbent. In addition, the CO2-rich phase volume of MNBH absorbent only accounts for 50% of the total absorbent volume, which will greatly reduce the energy consumption of the desorption unit.24 The distribution of rich and CO2-lean phase volume in the four-phase change systems is shown in Fig. 7.
The comparison of CO2 absorption capacity and absorption rate of the four-phase change system is shown in Fig. 8.
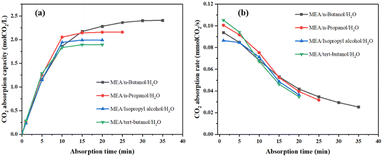 | ||
| Fig. 8 (a) The variation of CO2 absorption capacity with time; (b) CO2 absorption rate varies with time. | ||
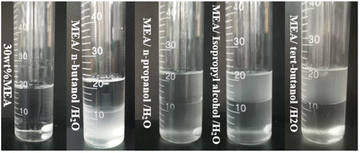
From Fig. 8a, the phase change system with n-butanol as the phase separation promoter has the highest CO2 absorption capacity, and the order of CO2 absorption capacity is MEA/n-butanol/H2O > MEA/n-propanol/H2O > MEA/isopropanol/H2O > MEA/tert-butanol/H2O. From Fig. 8b that the order of CO2 absorption rate is MEA/tert-butanol/H2O > MEA/n-propanol/H2O > MEA/n-butanol/H2O > MEA/isopropanol/H2O during the first 5 min of absorption, and the order of CO2 absorption rate after 15 min is as follows: MEA/n-butanol/H2O > MEA/n-propanol/H2O > MEA/isopropanol/H2O > MEA/tert-butanol/H2O. The phase separation phenomenon of the four-phase change systems after absorbing CO2 saturation is shown in Fig. 9.
In summary, compared with several other MEA phase change absorption systems, the MNBH absorbent has the highest CO2 absorption capacity, the lowest viscosity of the absorbent, and the volume of the CO2-rich phase at absorption equilibrium is only 50% of the total volume. Therefore, it is more advantageous to choose n-butanol as the phase separation promoter to develop MNBH in this paper.
3.1 Optimization of mass concentration of MEA
Before exploring the optimum mass ratio of the MNBH absorption system, the optimum mass concentration of MEA needs to be determined. Based on the literature reports and the actual industrial applications of MEA, the mass concentrations of MEA were selected as 20 wt%, 30 wt%, 40 wt%, and 50 wt%, in that order. Under the experimental conditions of 30 °C, 1 atm, and CO2 rate of 100 mL min−1, the results of CO2 absorption experiments are shown in Table 2.| MEA mass concentration | Absorption loading (mol CO2 per mol amine) | Absorption capacity (mol CO2 L−1) | Equalization time (min) | Absorbent viscosity (mPa s) |
|---|---|---|---|---|
| 20 wt% | 0.6132 | 2.0106 | 50 | 2.12 |
| 30 wt% | 0.5779 | 2.8382 | 60 | 3.44 |
| 40 wt% | 0.5438 | 3.5610 | 70 | 6.22 |
| 50 wt% | 0.5243 | 4.2918 | 90 | 13.65 |
The utilization of amine can be expressed in terms of mol CO2 per mol amine.17 As can be seen from Table 2, with the increase of MEA mass concentration, CO2 absorption capacity and absorbent viscosity increase, the time required for absorption to reach equilibrium becomes longer, and the utilization rate of MEA decreases. As 30 wt% MEA has a higher CO2 absorption capacity and MEA utilization, the viscosity of the absorbent is lower at 3.44 mpa s, and the time to equilibrium is shorter at 60 min. Therefore, 30 wt% MEA was chosen as a suitable mass concentration, which is also consistent with the recommended MEA mass concentration in the literature.19
Fig. 10 shows the CO2 absorption rate curves corresponding to different MEA mass concentrations. From the Fig. 10, the CO2 absorption rate increases with the increase of MEA concentration.
3.2 Optimization of mass ratio of MEA/n-butanol/H2O system
The mass concentration of MEA was fixed at 30 wt%, m(MEA)![[thin space (1/6-em)]](https://www.rsc.org/images/entities/char_2009.gif) :
:![[thin space (1/6-em)]](https://www.rsc.org/images/entities/char_2009.gif) m(n-butanol)
m(n-butanol)![[thin space (1/6-em)]](https://www.rsc.org/images/entities/char_2009.gif) :
:![[thin space (1/6-em)]](https://www.rsc.org/images/entities/char_2009.gif) m(H2O) were mixed in the mass ratios of 3
m(H2O) were mixed in the mass ratios of 3![[thin space (1/6-em)]](https://www.rsc.org/images/entities/char_2009.gif) :
:![[thin space (1/6-em)]](https://www.rsc.org/images/entities/char_2009.gif) 1
1![[thin space (1/6-em)]](https://www.rsc.org/images/entities/char_2009.gif) :
:![[thin space (1/6-em)]](https://www.rsc.org/images/entities/char_2009.gif) 6, 3
6, 3![[thin space (1/6-em)]](https://www.rsc.org/images/entities/char_2009.gif) :
:![[thin space (1/6-em)]](https://www.rsc.org/images/entities/char_2009.gif) 2
2![[thin space (1/6-em)]](https://www.rsc.org/images/entities/char_2009.gif) :
:![[thin space (1/6-em)]](https://www.rsc.org/images/entities/char_2009.gif) 5, 3
5, 3![[thin space (1/6-em)]](https://www.rsc.org/images/entities/char_2009.gif) :
:![[thin space (1/6-em)]](https://www.rsc.org/images/entities/char_2009.gif) 3
3![[thin space (1/6-em)]](https://www.rsc.org/images/entities/char_2009.gif) :
:![[thin space (1/6-em)]](https://www.rsc.org/images/entities/char_2009.gif) 4, 3
4, 3![[thin space (1/6-em)]](https://www.rsc.org/images/entities/char_2009.gif) :
:![[thin space (1/6-em)]](https://www.rsc.org/images/entities/char_2009.gif) 4
4![[thin space (1/6-em)]](https://www.rsc.org/images/entities/char_2009.gif) :
:![[thin space (1/6-em)]](https://www.rsc.org/images/entities/char_2009.gif) 3, 3
3, 3![[thin space (1/6-em)]](https://www.rsc.org/images/entities/char_2009.gif) :
:![[thin space (1/6-em)]](https://www.rsc.org/images/entities/char_2009.gif) 5
5![[thin space (1/6-em)]](https://www.rsc.org/images/entities/char_2009.gif) :
:![[thin space (1/6-em)]](https://www.rsc.org/images/entities/char_2009.gif) 2, 3
2, 3![[thin space (1/6-em)]](https://www.rsc.org/images/entities/char_2009.gif) :
:![[thin space (1/6-em)]](https://www.rsc.org/images/entities/char_2009.gif) 6
6![[thin space (1/6-em)]](https://www.rsc.org/images/entities/char_2009.gif) :
:![[thin space (1/6-em)]](https://www.rsc.org/images/entities/char_2009.gif) 1, and 3
1, and 3![[thin space (1/6-em)]](https://www.rsc.org/images/entities/char_2009.gif) :
:![[thin space (1/6-em)]](https://www.rsc.org/images/entities/char_2009.gif) 7
7![[thin space (1/6-em)]](https://www.rsc.org/images/entities/char_2009.gif) :
:![[thin space (1/6-em)]](https://www.rsc.org/images/entities/char_2009.gif) 0 to form an eight-group absorption system. The total mass of the phase change absorption system was taken as 20 g, at 25 °C, 1 atm, and the CO2 inlet flow rate of 100 mL min−1, the CO2 absorption results of the MNBH systems with different mass ratios are shown in Table 3.
0 to form an eight-group absorption system. The total mass of the phase change absorption system was taken as 20 g, at 25 °C, 1 atm, and the CO2 inlet flow rate of 100 mL min−1, the CO2 absorption results of the MNBH systems with different mass ratios are shown in Table 3.
| Mass ratios | Whether phase is separated | Percentage of CO2-rich phase volume (%) | CO2 absorption capacity (mol CO2 L−1) | Absorbent viscosity (mPa s) | Upper phase viscosity (mPa s) | Lower phase viscosity mPa s) |
|---|---|---|---|---|---|---|
3![[thin space (1/6-em)]](https://www.rsc.org/images/entities/char_2009.gif) : :![[thin space (1/6-em)]](https://www.rsc.org/images/entities/char_2009.gif) 1 1![[thin space (1/6-em)]](https://www.rsc.org/images/entities/char_2009.gif) : :![[thin space (1/6-em)]](https://www.rsc.org/images/entities/char_2009.gif) 6 6 |
Yes | 90 | 2.4184 | 4.29 | 2.63 | 7.29 |
3![[thin space (1/6-em)]](https://www.rsc.org/images/entities/char_2009.gif) : :![[thin space (1/6-em)]](https://www.rsc.org/images/entities/char_2009.gif) 2 2![[thin space (1/6-em)]](https://www.rsc.org/images/entities/char_2009.gif) : :![[thin space (1/6-em)]](https://www.rsc.org/images/entities/char_2009.gif) 5 5 |
Yes | 71 | 2.4370 | 4.80 | 2.59 | 8.79 |
3![[thin space (1/6-em)]](https://www.rsc.org/images/entities/char_2009.gif) : :![[thin space (1/6-em)]](https://www.rsc.org/images/entities/char_2009.gif) 3 3![[thin space (1/6-em)]](https://www.rsc.org/images/entities/char_2009.gif) : :![[thin space (1/6-em)]](https://www.rsc.org/images/entities/char_2009.gif) 4 4 |
Yes | 62 | 2.4476 | 6.26 | 2.61 | 10.17 |
3![[thin space (1/6-em)]](https://www.rsc.org/images/entities/char_2009.gif) : :![[thin space (1/6-em)]](https://www.rsc.org/images/entities/char_2009.gif) 4 4![[thin space (1/6-em)]](https://www.rsc.org/images/entities/char_2009.gif) : :![[thin space (1/6-em)]](https://www.rsc.org/images/entities/char_2009.gif) 3 3 |
Yes | 50 | 2.5227 | 8.18 | 2.67 | 13.46 |
3![[thin space (1/6-em)]](https://www.rsc.org/images/entities/char_2009.gif) : :![[thin space (1/6-em)]](https://www.rsc.org/images/entities/char_2009.gif) 5 5![[thin space (1/6-em)]](https://www.rsc.org/images/entities/char_2009.gif) : :![[thin space (1/6-em)]](https://www.rsc.org/images/entities/char_2009.gif) 2 2 |
Yes | 46 | 2.4909 | 11.60 | 2.65 | 16.98 |
3![[thin space (1/6-em)]](https://www.rsc.org/images/entities/char_2009.gif) : :![[thin space (1/6-em)]](https://www.rsc.org/images/entities/char_2009.gif) 6 6![[thin space (1/6-em)]](https://www.rsc.org/images/entities/char_2009.gif) : :![[thin space (1/6-em)]](https://www.rsc.org/images/entities/char_2009.gif) 1 1 |
Yes | 38 | 2.4424 | 13.52 | 2.64 | 19.12 |
3![[thin space (1/6-em)]](https://www.rsc.org/images/entities/char_2009.gif) : :![[thin space (1/6-em)]](https://www.rsc.org/images/entities/char_2009.gif) 7 7![[thin space (1/6-em)]](https://www.rsc.org/images/entities/char_2009.gif) : :![[thin space (1/6-em)]](https://www.rsc.org/images/entities/char_2009.gif) 0 0 |
Yes | 19 | 2.3843 | — | 2.60 | 38.12 |
It can be seen from Table 3 that phase transition can occur if n-butanol is added, which can also be said that n-butanol plays the role of phase separation accelerator in the phase transition system. The viscosity of the phase transition system increases with the increase of the mass concentration of n-butanol, and the viscosity of the upper liquid phase is maintained at about 2.60 mPa s, while the data show that the viscosity of n-butanol at room temperature is 2.55 mPa s. Therefore, it is speculated that the main composition of the upper liquid phase is n-butanol, which is a CO2-lean phase.
Fig. 11 shows the comparison of CO2 absorption capacity and CO2 absorption rate of MNBH with different mass ratios.
From Fig. 11, the CO2 absorption capacity of MNBH increased and then decreased with the increase of n-butanol dosage. When the mass ratio of MNBH was 3![[thin space (1/6-em)]](https://www.rsc.org/images/entities/char_2009.gif) :
:![[thin space (1/6-em)]](https://www.rsc.org/images/entities/char_2009.gif) 4
4![[thin space (1/6-em)]](https://www.rsc.org/images/entities/char_2009.gif) :
:![[thin space (1/6-em)]](https://www.rsc.org/images/entities/char_2009.gif) 3, the maximum CO2 absorption capacity was 2.5227 mol CO2 L−1. The CO2 absorption rates were close at different mass ratios. The density and CO2 loading data of the upper and lower phases were measured and the results are shown in Table 4.
3, the maximum CO2 absorption capacity was 2.5227 mol CO2 L−1. The CO2 absorption rates were close at different mass ratios. The density and CO2 loading data of the upper and lower phases were measured and the results are shown in Table 4.
| Mass ratios | Upper phase density (g mL−1) | lower phase density (g mL−1) | Upper phase CO2 loading (mol CO2 L−1) | Lower phase CO2 loading (mol CO2 L−1) |
|---|---|---|---|---|
3![[thin space (1/6-em)]](https://www.rsc.org/images/entities/char_2009.gif) : :![[thin space (1/6-em)]](https://www.rsc.org/images/entities/char_2009.gif) 1 1![[thin space (1/6-em)]](https://www.rsc.org/images/entities/char_2009.gif) : :![[thin space (1/6-em)]](https://www.rsc.org/images/entities/char_2009.gif) 6 6 |
0.7924 | 1.0011 | 0.1361 | 3.0612 |
3![[thin space (1/6-em)]](https://www.rsc.org/images/entities/char_2009.gif) : :![[thin space (1/6-em)]](https://www.rsc.org/images/entities/char_2009.gif) 2 2![[thin space (1/6-em)]](https://www.rsc.org/images/entities/char_2009.gif) : :![[thin space (1/6-em)]](https://www.rsc.org/images/entities/char_2009.gif) 5 5 |
0.7345 | 1.0017 | 0.0865 | 3.0416 |
3![[thin space (1/6-em)]](https://www.rsc.org/images/entities/char_2009.gif) : :![[thin space (1/6-em)]](https://www.rsc.org/images/entities/char_2009.gif) 3 3![[thin space (1/6-em)]](https://www.rsc.org/images/entities/char_2009.gif) : :![[thin space (1/6-em)]](https://www.rsc.org/images/entities/char_2009.gif) 4 4 |
0.7408 | 1.0263 | 0.1296 | 3.0298 |
3![[thin space (1/6-em)]](https://www.rsc.org/images/entities/char_2009.gif) : :![[thin space (1/6-em)]](https://www.rsc.org/images/entities/char_2009.gif) 4 4![[thin space (1/6-em)]](https://www.rsc.org/images/entities/char_2009.gif) : :![[thin space (1/6-em)]](https://www.rsc.org/images/entities/char_2009.gif) 3 3 |
0.7307 | 1.0620 | 0.1162 | 3.0175 |
3![[thin space (1/6-em)]](https://www.rsc.org/images/entities/char_2009.gif) : :![[thin space (1/6-em)]](https://www.rsc.org/images/entities/char_2009.gif) 5 5![[thin space (1/6-em)]](https://www.rsc.org/images/entities/char_2009.gif) : :![[thin space (1/6-em)]](https://www.rsc.org/images/entities/char_2009.gif) 2 2 |
0.7493 | 1.0991 | 0.0936 | 3.0006 |
3![[thin space (1/6-em)]](https://www.rsc.org/images/entities/char_2009.gif) : :![[thin space (1/6-em)]](https://www.rsc.org/images/entities/char_2009.gif) 6 6![[thin space (1/6-em)]](https://www.rsc.org/images/entities/char_2009.gif) : :![[thin space (1/6-em)]](https://www.rsc.org/images/entities/char_2009.gif) 1 1 |
0.7536 | 1.1508 | 0.1276 | 2.9989 |
3![[thin space (1/6-em)]](https://www.rsc.org/images/entities/char_2009.gif) : :![[thin space (1/6-em)]](https://www.rsc.org/images/entities/char_2009.gif) 7 7![[thin space (1/6-em)]](https://www.rsc.org/images/entities/char_2009.gif) : :![[thin space (1/6-em)]](https://www.rsc.org/images/entities/char_2009.gif) 0 0 |
0.7426 | 1.2012 | 0.1348 | 2.9879 |
As shown in Table.4. The density of the upper phase of MNBH is stable at about 0.75 g mL−1, while the density of the lower phase increases with the increase of the mass concentration of n-butanol. The density of n-butanol is about 0.81 g mL−1 at room temperature, and the density of the upper phase of MNBH is very close to the density value of n-butanol at room temperature. In addition, the CO2 loading of the lower phase of the MNBH absorbent reaches more than 95% at all mass ratios. Therefore, we can speculate that after the absorption of CO2 by MNBH, the CO2 absorption products are mainly concentrated in the lower phase, which is a CO2-rich phase, while the upper phase is mainly composed of n-butanol, which is a CO2-lean phase.
Theoretically, only the CO2-rich phase needs to be sent to the desorption unit when the phase change absorbent is thermally regenerated. Therefore, the small CO2-rich phase volume is helpful to reduce the regeneration energy consumption. The upper and lower phase volume distribution of MNBH with different mass ratios after absorbing CO2 to saturation is shown in Fig. 12. It can be known that with the increase of n-butanol dosage, the volume of the lower phase gradually decreases.
In summary, when the mass ratio of MNBH is 3![[thin space (1/6-em)]](https://www.rsc.org/images/entities/char_2009.gif) :
:![[thin space (1/6-em)]](https://www.rsc.org/images/entities/char_2009.gif) 4
4![[thin space (1/6-em)]](https://www.rsc.org/images/entities/char_2009.gif) :
:![[thin space (1/6-em)]](https://www.rsc.org/images/entities/char_2009.gif) 3, the CO2 absorption capacity is the highest, the viscosity of the absorbent is 8.18 mpa s, and the viscosity of the rich phase is 13.46 mpa s. The volume of the CO2-rich phase was only 50% of the total volume of the absorbent, which greatly reduced the energy consumption for absorbent regeneration. Therefore, 3
3, the CO2 absorption capacity is the highest, the viscosity of the absorbent is 8.18 mpa s, and the viscosity of the rich phase is 13.46 mpa s. The volume of the CO2-rich phase was only 50% of the total volume of the absorbent, which greatly reduced the energy consumption for absorbent regeneration. Therefore, 3![[thin space (1/6-em)]](https://www.rsc.org/images/entities/char_2009.gif) :
:![[thin space (1/6-em)]](https://www.rsc.org/images/entities/char_2009.gif) 4
4![[thin space (1/6-em)]](https://www.rsc.org/images/entities/char_2009.gif) :
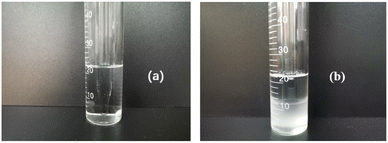
:![[thin space (1/6-em)]](https://www.rsc.org/images/entities/char_2009.gif) 3 was selected as the optimum mass ratio. The phenomena before and after phase separation of MNBH with 3
3 was selected as the optimum mass ratio. The phenomena before and after phase separation of MNBH with 3![[thin space (1/6-em)]](https://www.rsc.org/images/entities/char_2009.gif) :
:![[thin space (1/6-em)]](https://www.rsc.org/images/entities/char_2009.gif) 4
4![[thin space (1/6-em)]](https://www.rsc.org/images/entities/char_2009.gif) :
:![[thin space (1/6-em)]](https://www.rsc.org/images/entities/char_2009.gif) 3 mass ratio is shown in Fig. 13.
3 mass ratio is shown in Fig. 13.
3.3 CO2 absorption properties of MNBH
![[thin space (1/6-em)]](https://www.rsc.org/images/entities/char_2009.gif) :
:![[thin space (1/6-em)]](https://www.rsc.org/images/entities/char_2009.gif) 4
4![[thin space (1/6-em)]](https://www.rsc.org/images/entities/char_2009.gif) :
:![[thin space (1/6-em)]](https://www.rsc.org/images/entities/char_2009.gif) 3, and the CO2 absorption experiments are carried out at the temperature of 20 °C, 30 °C, 40 °C and 50 °C in sequence. The experimental results are shown in Fig. 14.
3, and the CO2 absorption experiments are carried out at the temperature of 20 °C, 30 °C, 40 °C and 50 °C in sequence. The experimental results are shown in Fig. 14.
 | ||
| Fig. 14 (a) Curve of CO2 absorption capacity changing with time; (b) curve of CO2 absorption rate changing with time. | ||
From Fig. 14a, the CO2 absorption capacity of the MNBH absorbent with a mass ratio of 3![[thin space (1/6-em)]](https://www.rsc.org/images/entities/char_2009.gif) :
:![[thin space (1/6-em)]](https://www.rsc.org/images/entities/char_2009.gif) 4
4![[thin space (1/6-em)]](https://www.rsc.org/images/entities/char_2009.gif) :
:![[thin space (1/6-em)]](https://www.rsc.org/images/entities/char_2009.gif) 3 decreases slightly with the increase in temperature. From Fig. 14b, the temperature does not have much effect on the CO2 absorption capacity. When the actual flue gas captures CO2, the temperature at which the flue gas reaches the absorption tower is about 30–50 °C,25 which indicates that the phase change absorbent developed in this paper has good industrial practical application value. In addition, the higher the absorption temperature, the shorter the time required for absorption to reach equilibrium. After comprehensive consideration, 40 °C is chosen as the best absorption temperature.
3 decreases slightly with the increase in temperature. From Fig. 14b, the temperature does not have much effect on the CO2 absorption capacity. When the actual flue gas captures CO2, the temperature at which the flue gas reaches the absorption tower is about 30–50 °C,25 which indicates that the phase change absorbent developed in this paper has good industrial practical application value. In addition, the higher the absorption temperature, the shorter the time required for absorption to reach equilibrium. After comprehensive consideration, 40 °C is chosen as the best absorption temperature.
 | ||
| Fig. 15 (a) Effect of CO2 partial pressure on absorption capacity; (b) effect of CO2 partial pressure on absorption rate. | ||
From Fig. 15, with the increase of CO2 partial pressure, the CO2 absorption capacity and absorption rate increase, and the absorption time to reach equilibrium is shortened. When the partial pressure of CO2 in the flue gas is 15 vol% CO2, the MNBH absorbent still has good CO2 absorption performance, the CO2 absorption capacity is 1.5961 mol CO2 L−1, and the initial CO2 absorption rate is 0.0271 mmol CO2 s−1. This shows that the MNBH still has a good absorption capacity in the low partial pressure CO2 environment.
3.4 Desorption performance of CO2 by MNBH
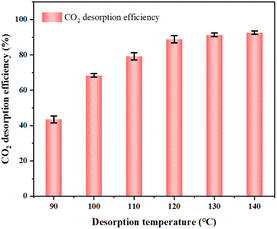
It can be seen from Fig. 16 that the desorption efficiency of CO2 increases with the increase of desorption temperature. When the desorption temperature is 120 °C, the desorption efficiency reaches 89.96%. When the desorption temperature rises to 130 °C, the desorption efficiency is 91.32%. The desorption efficiency did not increase significantly. Therefore, considering the energy consumption of thermal desorption, selecting the regeneration temperature to 120 °C.
![[thin space (1/6-em)]](https://www.rsc.org/images/entities/char_2009.gif) :
:![[thin space (1/6-em)]](https://www.rsc.org/images/entities/char_2009.gif) 4
4![[thin space (1/6-em)]](https://www.rsc.org/images/entities/char_2009.gif) :
:![[thin space (1/6-em)]](https://www.rsc.org/images/entities/char_2009.gif) 3 was tested using a CO2 equilibrium solubility measurement device at different CO2 partial pressures and temperatures.
3 was tested using a CO2 equilibrium solubility measurement device at different CO2 partial pressures and temperatures.
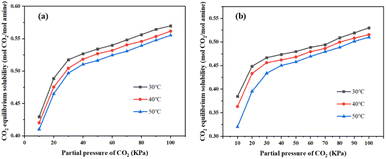 | ||
Fig. 17 (a) 30 wt% MEA absorbent CO2 equilibrium solubility; (b) CO2 equilibrium solubility of MNBH absorbent with mass ratio of 3![[thin space (1/6-em)]](https://www.rsc.org/images/entities/char_2009.gif) : :![[thin space (1/6-em)]](https://www.rsc.org/images/entities/char_2009.gif) 4 4![[thin space (1/6-em)]](https://www.rsc.org/images/entities/char_2009.gif) : :![[thin space (1/6-em)]](https://www.rsc.org/images/entities/char_2009.gif) 3. 3. | ||
As shown in Fig. 18, temperatures (T) and pressures (PCO2) corresponding to the same CO2 loading were selected from the data in Fig. 17, and then plotted linearly between In(PCO2) and 1/T. Multiply the slope of the line shown in the diagram by the gas constant 8.314 J (mol−1 K−1) to get the corresponding ΔHabs.21
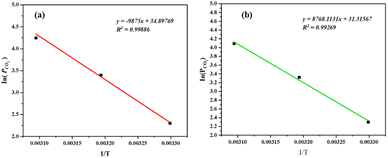 | ||
Fig. 18 (a) 30 wt% MEA absorbent ΔHabs calculation; (b) calculation of MNBH absorbent ΔHabs with mass ratio of 3![[thin space (1/6-em)]](https://www.rsc.org/images/entities/char_2009.gif) : :![[thin space (1/6-em)]](https://www.rsc.org/images/entities/char_2009.gif) 4 4![[thin space (1/6-em)]](https://www.rsc.org/images/entities/char_2009.gif) : :![[thin space (1/6-em)]](https://www.rsc.org/images/entities/char_2009.gif) 3. 3. | ||
As calculated from Fig. 18a, 30 wt% MEA absorbent ΔHabs is 82.1 kJ mol−1. This is like the 83 kJ mol−1 data reported by Kim et al.,28 indicating that it is feasible to determine heat absorption by CO2 using the device shown in Fig. 5. The ΔHabs of the MNBH phase change absorbent with a mass ratio of 3![[thin space (1/6-em)]](https://www.rsc.org/images/entities/char_2009.gif) :
:![[thin space (1/6-em)]](https://www.rsc.org/images/entities/char_2009.gif) 4
4![[thin space (1/6-em)]](https://www.rsc.org/images/entities/char_2009.gif) :
:![[thin space (1/6-em)]](https://www.rsc.org/images/entities/char_2009.gif) 3 was calculated from Fig. 18b to be 49.09 kJ mol−1.
3 was calculated from Fig. 18b to be 49.09 kJ mol−1.
Combining the calculation formulas of ΔHabs, Qsens and Qlatent, the desorption energy consumption of MNBH phase change absorbent with mass ratio of 3![[thin space (1/6-em)]](https://www.rsc.org/images/entities/char_2009.gif) :
:![[thin space (1/6-em)]](https://www.rsc.org/images/entities/char_2009.gif) 4
4![[thin space (1/6-em)]](https://www.rsc.org/images/entities/char_2009.gif) :
:![[thin space (1/6-em)]](https://www.rsc.org/images/entities/char_2009.gif) 3 is estimated and compared with 30 wt% MEA absorbent. The results are shown in Fig. 19.
3 is estimated and compared with 30 wt% MEA absorbent. The results are shown in Fig. 19.
Fig. 19 shows that the Qsens of MNBH absorbent is 44% lower than that of 30 wt% MEA absorbent, and the Qlatent of MNBH absorbent is 64% lower than that of 30 wt% MEA absorbent. The total regenerative energy consumption of MNBH absorbent is 2.6 GJ t−1 CO2, which is 35% lower than that of 30 wt% MEA absorbent (3.8 GJ t−1 CO2).28
3.5 Recycling ability of MNBH
In the industrial CO2 capture process, the absorbent needs to be recycled between the absorption and desorption towers.24 Therefore, the absorbent with high CO2 recycling capacity is more conducive to the CO2 capture process, so the recycling capacity is often taken as an important index when evaluating the absorbent performance. The CO2 cycling capacity of MNBH with mass ratios of 3![[thin space (1/6-em)]](https://www.rsc.org/images/entities/char_2009.gif) :
:![[thin space (1/6-em)]](https://www.rsc.org/images/entities/char_2009.gif) 1
1![[thin space (1/6-em)]](https://www.rsc.org/images/entities/char_2009.gif) :
:![[thin space (1/6-em)]](https://www.rsc.org/images/entities/char_2009.gif) 6–3
6–3![[thin space (1/6-em)]](https://www.rsc.org/images/entities/char_2009.gif) :
:![[thin space (1/6-em)]](https://www.rsc.org/images/entities/char_2009.gif) 7
7![[thin space (1/6-em)]](https://www.rsc.org/images/entities/char_2009.gif) :
:![[thin space (1/6-em)]](https://www.rsc.org/images/entities/char_2009.gif) 0 were determined at an absorption temperature of 40 °C and a desorption temperature of 120 °C, as shown in Fig. 20a. In addition, MNBH with a mass ratio of 3
0 were determined at an absorption temperature of 40 °C and a desorption temperature of 120 °C, as shown in Fig. 20a. In addition, MNBH with a mass ratio of 3![[thin space (1/6-em)]](https://www.rsc.org/images/entities/char_2009.gif) :
:![[thin space (1/6-em)]](https://www.rsc.org/images/entities/char_2009.gif) 4
4![[thin space (1/6-em)]](https://www.rsc.org/images/entities/char_2009.gif) :
:![[thin space (1/6-em)]](https://www.rsc.org/images/entities/char_2009.gif) 3 was regenerated by four absorption–desorption cycles under the above conditions, and its CO2 cycling capacity was measured and compared with the 30 wt% MEA absorbent, as shown in Fig. 20b.
3 was regenerated by four absorption–desorption cycles under the above conditions, and its CO2 cycling capacity was measured and compared with the 30 wt% MEA absorbent, as shown in Fig. 20b.
 | ||
| Fig. 20 (a) Comparison chart of recycling capacity; (b) comparison of four sorbation–desorption cycle regeneration experiments. | ||
It can be seen from Fig. 20a that with the increase of n-butanol concentration, the CO2 recycling capacity of MNBH first increased and then decreased. Compared with 30 wt% MEA absorbent, when MNBH mass ratio is 3![[thin space (1/6-em)]](https://www.rsc.org/images/entities/char_2009.gif) :
:![[thin space (1/6-em)]](https://www.rsc.org/images/entities/char_2009.gif) 4
4![[thin space (1/6-em)]](https://www.rsc.org/images/entities/char_2009.gif) :
:![[thin space (1/6-em)]](https://www.rsc.org/images/entities/char_2009.gif) 3, the CO2 cycle capacity is improved by 67%. The highest CO2 cycling capacity was achieved at a mass ratio of 3
3, the CO2 cycle capacity is improved by 67%. The highest CO2 cycling capacity was achieved at a mass ratio of 3![[thin space (1/6-em)]](https://www.rsc.org/images/entities/char_2009.gif) :
:![[thin space (1/6-em)]](https://www.rsc.org/images/entities/char_2009.gif) 6
6![[thin space (1/6-em)]](https://www.rsc.org/images/entities/char_2009.gif) :
:![[thin space (1/6-em)]](https://www.rsc.org/images/entities/char_2009.gif) 1, which resulted in a 72% increase in CO2 cycling capacity compared to the 30 wt% MEA absorbent.
1, which resulted in a 72% increase in CO2 cycling capacity compared to the 30 wt% MEA absorbent.
As shown in Fig. 20b, in all four absorption-desorption cycling experiments, the CO2 cycling capacity of the MNBH absorber with a mass ratio of 3![[thin space (1/6-em)]](https://www.rsc.org/images/entities/char_2009.gif) :
:![[thin space (1/6-em)]](https://www.rsc.org/images/entities/char_2009.gif) 4
4![[thin space (1/6-em)]](https://www.rsc.org/images/entities/char_2009.gif) :
:![[thin space (1/6-em)]](https://www.rsc.org/images/entities/char_2009.gif) 3 was higher than that of the 30 wt% MEA absorbent. The CO2 cycle capacity of MNBH decreases somewhat after the first cycle and is stable at about 3.5 mol CO2 L−1 in the subsequent cycle. In four cycles, the total circulating capacity of MNBH is 14.1672 mol CO2 L−1, which is 5.9752 mol CO2 L−1 higher than that of 30 wt% MEA absorbent. This indicates that MNBH has a higher CO2 cycle capacity, that is, it has good cycle stability, and is a promising CO2 absorbent.
3 was higher than that of the 30 wt% MEA absorbent. The CO2 cycle capacity of MNBH decreases somewhat after the first cycle and is stable at about 3.5 mol CO2 L−1 in the subsequent cycle. In four cycles, the total circulating capacity of MNBH is 14.1672 mol CO2 L−1, which is 5.9752 mol CO2 L−1 higher than that of 30 wt% MEA absorbent. This indicates that MNBH has a higher CO2 cycle capacity, that is, it has good cycle stability, and is a promising CO2 absorbent.
3.6 Explanation of phase transition mechanism
![[thin space (1/6-em)]](https://www.rsc.org/images/entities/char_2009.gif) :
:![[thin space (1/6-em)]](https://www.rsc.org/images/entities/char_2009.gif) 4
4![[thin space (1/6-em)]](https://www.rsc.org/images/entities/char_2009.gif) :
:![[thin space (1/6-em)]](https://www.rsc.org/images/entities/char_2009.gif) 3.
3.
As can be seen from Fig. 21, in the infrared spectrum of fresh MNBH, the O–H stretching vibration peak appears at 3353 cm−1, the C–H stretching vibration peak appears at 2940 cm−1, and the methyl stretching vibration peak appears at 2880 cm−1.29 The characteristic peaks at 2151 cm−1 and 1579 cm−1 can be attributed to the bending vibration of the N–H bond on the amino group (–NH2) in the amine molecule. A weaker acromion is also observed at about 1648 cm−1, representing a characteristic peak of the amine cation (–NH3+).30,31 When CO2 is absorbed by the phase change absorbent, the acromion at 1648 cm−1 is enhanced, which may be due to the overlap between the carbonyl (C![[double bond, length as m-dash]](https://www.rsc.org/images/entities/char_e001.gif) O) stretching vibration peak and the –NH3+peak.32 This result shows that carbamate products are formed in the absorption system after the reaction of phase change absorbent with CO2. After desorption, the peaks of 3353 cm−1, 2940 cm−1 and 2880 cm−1 re-emerged. This means that the carbamate is decomposed into MEA.
O) stretching vibration peak and the –NH3+peak.32 This result shows that carbamate products are formed in the absorption system after the reaction of phase change absorbent with CO2. After desorption, the peaks of 3353 cm−1, 2940 cm−1 and 2880 cm−1 re-emerged. This means that the carbamate is decomposed into MEA.
Fig. 22 shows the 1H NMR results of the upper liquid phase and lower liquid phase of MNBH with a mass ratio of 3![[thin space (1/6-em)]](https://www.rsc.org/images/entities/char_2009.gif) :
:![[thin space (1/6-em)]](https://www.rsc.org/images/entities/char_2009.gif) 4
4![[thin space (1/6-em)]](https://www.rsc.org/images/entities/char_2009.gif) :
:![[thin space (1/6-em)]](https://www.rsc.org/images/entities/char_2009.gif) 3 before absorbing CO2 and after absorbing CO2 to saturation.
3 before absorbing CO2 and after absorbing CO2 to saturation.
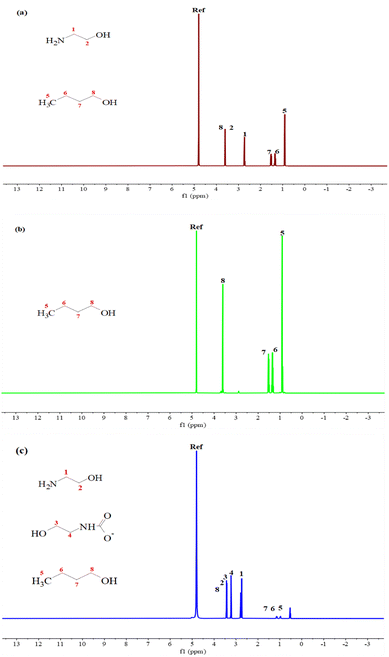 | ||
Fig. 22 1H NMR of MNBH with a mass ratio of 3![[thin space (1/6-em)]](https://www.rsc.org/images/entities/char_2009.gif) : :![[thin space (1/6-em)]](https://www.rsc.org/images/entities/char_2009.gif) 4 4![[thin space (1/6-em)]](https://www.rsc.org/images/entities/char_2009.gif) : :![[thin space (1/6-em)]](https://www.rsc.org/images/entities/char_2009.gif) 3 (a) before CO2 absorption; (b) upper liquid phase; (c) lower liquid phase. 3 (a) before CO2 absorption; (b) upper liquid phase; (c) lower liquid phase. | ||
As can be seen from Fig. 22a, there are both characteristic peaks of MEA (1 and 2) and n-butanol (5, 6, 7 and 8) in the fresh solution before CO2 absorption. Due to the rapid exchange of protons with water, the signals of MEA and protonated MEA cannot be distinguished.33–35 According to Fig. 22b, the upper liquid phase presents only the characteristic peak of n-butanol with relatively high peak intensity, which indicates that the main component of the upper liquid phase is n-butanol. Fig. 22c shows that in the lower liquid phase after CO2 absorption to saturation, there are two more characteristic peaks (3 and 4) at the chemical shifts of 3.06 ppm and 3.55 ppm, which can be attributed to carbamate.36 In addition, there are MEA characteristic peaks and weak peak intensity n-butanol characteristic peaks in the lower liquid phase This shows that the lower liquid phase is a CO2-rich phase, mainly composed of MEA and carbamate, and contains a small amount of n-butanol, which may be caused by incomplete liquid separation during liquid separation operation.
3.7 Simulated flue gas experiments
The total flue gas flow was controlled as 100 mL min−1, and the simulated flue gas composition was 15 vol% CO2 + 85 vol N2. Four regeneration experiments were carried out under the conditions of absorption temperature of 40 °C and desorption temperature of 120 °C, and the experimental results are shown in Fig. 23.It can be seen from Fig. 23 that the CO2 absorption capacity decreased by 0.5966 mol CO2 L−1 after the first cycle, and then stabilized at about 1.6 mol CO2 L−1. In the simulated flue gas environment, the loading of CO2 is about 75% of that in the pure CO2 environment. After four absorption–desorption cycles, the total CO2 cyclic loading of the MNBH was 5.21 mol CO2 L−1 absorbent, which had a better absorption effect and could be well applied to the decarbonization of flue gas in coal-fired power plants.
4. Conclusion
In this paper, a new phase change absorbent MNBH was developed using MEA as the main absorbent, n-butanol as the phase separation promoter and water as the solvent, and the CO2 absorption performance, desorption performance, phase separation behaviour, cyclic regeneration capacity and two-phase material distribution of MNBH were explored and talked about, and the conclusions are as follows:(1) Compared with the MEA phase change absorbent with n-propanol, isopropanol, and tert-butanol as phase separation promoters, the MNBH developed in this paper has higher CO2 absorption capacity, smaller absorbent viscosity, and lower CO2-rich phase volume.
(2) The optimum mass concentration of MEA was selected as 30 wt%. Fixing the mass concentration of MEA at 30 wt% and changing the mass ratio of n-butanol/H2O, the MNBH absorbent had the strongest CO2 absorption capacity of 2.5227 mol CO2 L−1 when the mass ratio of MNBH absorbent was 3![[thin space (1/6-em)]](https://www.rsc.org/images/entities/char_2009.gif) :
:![[thin space (1/6-em)]](https://www.rsc.org/images/entities/char_2009.gif) 4
4![[thin space (1/6-em)]](https://www.rsc.org/images/entities/char_2009.gif) :
:![[thin space (1/6-em)]](https://www.rsc.org/images/entities/char_2009.gif) 3. The CO2 loading in the lower phase of the MNBH phase change absorbent was higher than 95% at all MNBH mass ratios.
3. The CO2 loading in the lower phase of the MNBH phase change absorbent was higher than 95% at all MNBH mass ratios.
(3) At the desorption temperature of 120 °C, the CO2 desorption efficiency of the MNBH absorbent with a mass ratio of 3![[thin space (1/6-em)]](https://www.rsc.org/images/entities/char_2009.gif) :
:![[thin space (1/6-em)]](https://www.rsc.org/images/entities/char_2009.gif) 4
4![[thin space (1/6-em)]](https://www.rsc.org/images/entities/char_2009.gif) :
:![[thin space (1/6-em)]](https://www.rsc.org/images/entities/char_2009.gif) 3 reached 89.96%, and the energy consumption of CO2 regeneration was 2.6 GJ t−1 CO2, which was about 35% lower than that of the 30 wt% MEA absorbent. The CO2 absorption–desorption cycle experiments were carried out at an absorption temperature of 40 °C and a desorption temperature of 120 °C, and the results showed that the CO2 cycling capacity increased and then decreased with the increase of n-butanol mass concentration. The highest CO2 cycling capacity of 4.1918 mol CO2 L−1 was achieved at the MNBH mass ratio of 3
3 reached 89.96%, and the energy consumption of CO2 regeneration was 2.6 GJ t−1 CO2, which was about 35% lower than that of the 30 wt% MEA absorbent. The CO2 absorption–desorption cycle experiments were carried out at an absorption temperature of 40 °C and a desorption temperature of 120 °C, and the results showed that the CO2 cycling capacity increased and then decreased with the increase of n-butanol mass concentration. The highest CO2 cycling capacity of 4.1918 mol CO2 L−1 was achieved at the MNBH mass ratio of 3![[thin space (1/6-em)]](https://www.rsc.org/images/entities/char_2009.gif) :
:![[thin space (1/6-em)]](https://www.rsc.org/images/entities/char_2009.gif) 6
6![[thin space (1/6-em)]](https://www.rsc.org/images/entities/char_2009.gif) :
:![[thin space (1/6-em)]](https://www.rsc.org/images/entities/char_2009.gif) 1, which was 72% higher than that of 30 wt% MEA absorbent. The CO2 recycling capacity of the MNBH adsorbent with a mass ratio of 3
1, which was 72% higher than that of 30 wt% MEA absorbent. The CO2 recycling capacity of the MNBH adsorbent with a mass ratio of 3![[thin space (1/6-em)]](https://www.rsc.org/images/entities/char_2009.gif) :
:![[thin space (1/6-em)]](https://www.rsc.org/images/entities/char_2009.gif) 4
4![[thin space (1/6-em)]](https://www.rsc.org/images/entities/char_2009.gif) :
:![[thin space (1/6-em)]](https://www.rsc.org/images/entities/char_2009.gif) 3 and the 30 wt% MEA absorbent was compared in four absorption–desorption cycles. The results showed that the total recycling capacity of the MNBH absorbent with a 3
3 and the 30 wt% MEA absorbent was compared in four absorption–desorption cycles. The results showed that the total recycling capacity of the MNBH absorbent with a 3![[thin space (1/6-em)]](https://www.rsc.org/images/entities/char_2009.gif) :
:![[thin space (1/6-em)]](https://www.rsc.org/images/entities/char_2009.gif) 4
4![[thin space (1/6-em)]](https://www.rsc.org/images/entities/char_2009.gif) :
:![[thin space (1/6-em)]](https://www.rsc.org/images/entities/char_2009.gif) 3 mass ratio was 14.1672 mol CO2 L−1. It was 5.9752 mol CO2 L−1 higher than 30 wt% MEA absorbent. The MNBH absorbent has good recycling stability and is a promising CO2 absorbent.
3 mass ratio was 14.1672 mol CO2 L−1. It was 5.9752 mol CO2 L−1 higher than 30 wt% MEA absorbent. The MNBH absorbent has good recycling stability and is a promising CO2 absorbent.
(4) FTIR and 1H NMR results showed that the upper phase of MNBH was mainly composed of n-butanol, which was a CO2-lean phase. The main components of the lower phase are MEA and carbamate, which is a CO2-rich liquid phase. Experiments in simulated flue gas showed that the MNBH phase change absorbent has good potential for application in flue gas decarbonization in coal-fired power plants.
Data availability
Data will be made available on request.Author contributions
Yanlong Hu: writing – original draft. Qiang Wang: funding acquisition. Dingkai Hu: data curation. Yingshuang Zhang: review & editing. Furqan Muhammad: data curation. Shijian Lu: aspenplus technical support.Conflicts of interest
The authors declare that they have no known competing financial interests or personal relationships that could have appeared to influence the work reported in this paper.Acknowledgements
Funding for this work was provided by Xinjiang Uygur Autonomous Region 2022 “Listed and Commanded” Science and Technology Project “Development and Industrialization Verification of a New Type of CO2 Capture Solvent with Low Energy Consumption” & the Xinjiang Uygur Autonomous Region doctoral innovation project (XJ2023G039).References
- S. Bachu, Energy Convers. Manage., 2000, 41, 953–970 CrossRef CAS.
- M. Li, G. Jia, Y. Zhao, X. Zhang and J. Zhao, J. Chem. Eng., 2023, 74, 365–379 Search PubMed.
- H. Yang, Z. Xu, M. Fan, R. Gupta, R. B. Slimane, A. E. Bland and I. Wright, J. Environ. Sci., 2008, 20, 14–27 CrossRef CAS PubMed.
- J. Rogelj, M. den Elzen, N. Höhne, T. Fransen, H. Fekete, H. Winkler, R. Schaeffer, F. Sha, K. Riahi and M. Meinshausen, Nature, 2016, 534, 631–639 CrossRef CAS PubMed.
- N. Nakicenovic, World Energy Outlook 2007: China and India Insights Paperback, oecd publishing, 1st edn, 2007 Search PubMed.
- L. Duan, M. Zhao and Y. Yang, Energy, 2012, 45, 107–116 CrossRef CAS.
- C. Zheng, J. Tan, Y. J. Wang and G. S. Luo, Ind. Eng. Chem. Res., 2013, 52, 12247–12252 CrossRef CAS.
- L. Hu, Phase transitional absorption method, US Pat., 7541011, 2009 Search PubMed.
- Q. Zhuang, B. Clements, J. Dai and L. Carrigan, Int. J. Greenhouse Gas Contro, 2016, 52, 449–460 CrossRef CAS.
- S. Liu, H. Ling, J. Lv, H. Gao, Y. Na and Z. Liang, Ind. Eng. Chem. Res., 2019, 58, 20461–20471 CrossRef CAS.
- J. Ye, C. Jiang, H. Chen, Y. Shen, S. Zhang, L. Wang and J. Chen, Environ. Sci. Technol., 2019, 53, 4470–4479 CrossRef CAS PubMed.
- M. W. Arshad, P. L. Fosbøl, N. von Solms, H. F. Svendsen and K. Thomsen, J. Chem. Eng. Data, 2013, 58, 1974–1988 CrossRef CAS.
- A. F. Ciftja, A. Hartono and H. F. Svendsen, Chem. Eng. Sci., 2013, 102, 378–386 CrossRef CAS.
- Q. Huang, G. Jing, X. Zhou, B. Lv and Z. Zhou, J. CO2 Util., 2018, 25, 22–30 CrossRef CAS.
- G. Li, D. Deng, Y. Chen, H. Shan and N. Ai, J. Chem. Thermodyn., 2014, 75, 58–62 CrossRef CAS.
- K. Warmuzinski, M. Tanczyk and M. Jaschik, Int. J. Greenhouse Gas Contro, 2015, 37, 182–190 CrossRef CAS.
- B. Wang, X. Chen and G. Yu, Sep. Purif. Technol., 2022, 294, 121173 CrossRef CAS.
- W. Zhang, X. Jin, W. Tu, Q. Ma, M. Mao and C. Cui, Appl. Energy, 2017, 195, 316–323 CrossRef CAS.
- W. Zhang, X. Jin and W. Tu, et al., Energy Fuels, 2017, 31(4), 4273–4279 CrossRef CAS.
- Y. Shen, C. Jiang, S. Zhang, J. Chen, L. Wang and J. Chen, Appl. Energy, 2018, 230, 726–733 CrossRef CAS.
- M. Xiao, W. Zheng, H. Liu, P. Tontiwachwuthikul and Z. Liang, AIChE J., 2019, 65, e16605 CrossRef.
- R. Zhang, Q. Yang, B. Yu, H. Yu and Z. Liang, Energy, 2018, 144, 1064–1072 CrossRef CAS.
- W. Tu, J. Fang, Z. Li, M. Mao, X. Jin, X. Liu and W. Zhang, Sci. China: Chem., 2018, 48, 641–647 Search PubMed.
- H. Hu, M. Fang, F. Liu, T. Wang, Z. Xia, W. Zhang, C. Ge and J. Yuan, Appl. Energy, 2022, 324, 119570 CrossRef CAS.
- W. Jiang, F. Wu, G. Gao, X. Li, L. Zhang and C. Luo, Chem. Eng. J., 2021, 420, 129897 CrossRef CAS.
- M. Wang, M. Rahimi, A. Kumar, S. Hariharan, W. Choi and T. A. Hatton, Appl. Energy, 2019, 255, 113879 CrossRef CAS.
- Z. Weifeng, Z. Wu and W. Qiuhua, Prog. Chem. Chem. Ind., 2022, 41(4), 2090–2101 Search PubMed.
- H. Kim, S. J. Hwang and K. S. Lee, Environ. Sci. Technol., 2015, 49, 1478–1485 CrossRef CAS PubMed.
- X. B. Zhou, Doctoral Dissertation, Huaqiao University, 2019 Search PubMed.
- B. Yu, H. Yu, K. Li, Q. Yang, R. Zhang, L. Li and Z. Chen, Appl. Energy, 2017, 208, 1308–1317 CrossRef CAS.
- W. Zhao, Q. Zhao, Z. Zhang, J. Liu, R. Chen, Y. Chen and J. Chen, Fuel, 2017, 209, 69–75 CrossRef CAS.
- X. Y. Luo, X. Fan, G. L. Shi, H. R. Li and C. M. Wang, J. Phys. Chem. B, 2016, 120, 2807–2813 CrossRef CAS PubMed.
- G. Fan, A. Wee, R. Idem and P. Tontiwachwuthikul, Ind. Eng. Chem. Res., 2009, 48, 2717–2720 CrossRef CAS.
- F. Barzagli, F. Mani and M. Peruzzini, Energy Environ. Sci., 2009, 2, 322–330 RSC.
- A. F. Ciftja, A. Hartono and H. F. Svendsen, Int. J. Greenhouse Gas Control, 2013, 16, 224–232 CrossRef CAS.
- K. Zhu, H. Lu, C. Liu, K. Wu, W. Jiang, J. Cheng, S. Tang, H. Yue, Y. Liu and B. Liang, Ind. Eng. Chem. Res., 2019, 58, 3811–3821 CrossRef CAS.
Footnote |
| † Electronic supplementary information (ESI) available: Supplementary material Associated with this article can be found, in the online version. See DOI: https://doi.org/10.1039/d3ra07193f |
| This journal is © The Royal Society of Chemistry 2024 |


