 Open Access Article
Enhancing the reversibility of the chemical evolution of the Ni-rich LiNi0.8Co0.1Mn0.1O2 cathode via a simple pre-oxidation process†
Yan Mo‡
ab,
Shaofeng Liu‡ab,
Guohui Yuan *ab,
Zikun Li*b,
Meng Zhangb and
Lingjun Guo*c
aSchool of Chemistry and Chemical Engineering, Harbin Institute of Technology, Harbin 150001, People's Republic of China. E-mail: ygh@hit.edu.cn
bShenzhen BTR Nanotechnology Co., Ltd, Shenzhen 518106, People's Republic of China. E-mail: lizikun@btrchina.com
cState Key Laboratory of Solidification Processing, Northwestern Polytechnical University, Xi'an 710072, China. E-mail: guolingjun@nwpu.edu.cn
First published on 17th January 2024
Abstract
For developing commercially viable LiNi1−x−yMnxCoyO2 (NCM), it is necessary to alleviate the irreversible chemical process upon Li-ion insertion/extraction, which primarily accounts for prevailing capacity loss, impedance buildup as well as low columbic efficiency. To resolve this issue, we herein propose a simple but novel method to alter the chemical composition by a facile treatment of H2O2, which remarkably reduces the cation mixing of Li+/Ni2+ and residual lithium on the cathode. The tailored composition contributes great resistance to the structural reconstruction and enhancement in structural reversibility, as shown by in situ Raman and high-resolution transmission electron microscope (HRTEM) results. Thus, the modified sample outperforms the pristine one; it exhibits cyclability with 95.7% capacity retention over 300 cycles, high columbic efficiency and enhanced rate capability.
Introduction
Lithium-ion batteries (LIBs) occupy a favorable position in today's energy storage landscape: triumphing in the application of portable electronics in the early decades and now aiding their advancement in the fields of transportation and the grid storage market.1,2 The cathodes are the limiting component but primary determinant for raising the power and energy density of LIBs.3,4 In contrast to the conventional cathode material LiCoO2, Ni-rich oxide cathodes (NCM), LiNi1−x−yCoxMnyO2, have received widespread attention as potential high-performance cathode materials due to their high nickel fraction (1 − x − y ≥ 0.8) boosting their practical capacity to above 200 mA h g−1.5 Structural and chemical instability induced by the progressive increment of Ni content, however, have hampered the application of NCM cathodes.6–8 Notably, numerous studies have reported that the irreversible chemical evolution occurring in cathodes during the charge/discharge process can lead to failure in cycling stability, high voltage operation as well as reasonable columbic efficiency in the first few cycles. For instance, unstable structure instability induced by cation mixing and transition metal (TM) reduction, along with the phase transition from layered structure to spinel-like and F![[3 with combining macron]](https://www.rsc.org/images/entities/char_0033_0304.gif) m, is related to the capacity fading and high-voltage failure.9–11 Contaminating species that remain on the electrode surface caused by the synthesis procedure are another source of irreversible electrochemical process because they can react with electrolytes to generate excess side reaction.12,13
m, is related to the capacity fading and high-voltage failure.9–11 Contaminating species that remain on the electrode surface caused by the synthesis procedure are another source of irreversible electrochemical process because they can react with electrolytes to generate excess side reaction.12,13
Surface amelioration and design are recognized as efficient remedies to solve these issues from chemical and structural degradation. Various surface coating, such as inert materials MgO, AlF, Li conductive materials (Li2TiO3 and LiCoOx) and conductive polymer have been applied to the modification of the NCM materials.14–19 Admittedly these efforts have contributed substantially to the cycle life and power performance, but most coating materials are isolated to the substrate material with obvious boundary, throwing barriers in the process of uniform distribution and complete protection for the NCM host upon prolonged cycling. Alternately, the pretreatment of cathode materials with mild acid (HNO3, (NH4)2S2O8) or alkaline solution (N2H4) are demonstrated to be a facile strategy to alter the component of the material, which also displayed significant effect on the enhancement of the electrochemical behavior.20–22 For example, it is widely reported that lithium depletion depth can be adjusted by using diluted HNO3 solution based on the exchange between Li-ion and H-ion, which mitigated the initial capacity loss of the cathodes due to the leached Li2O from the component.21 Besides that, some researches confirmed that introducing oxidizing agents would be a good choice for enhancing the performance. Typically, KMnO4 is widely reported to treat the precursor, in which a nanoscale thickness MnO2 layer was induced into the outer and thus suppressed the capacity fade of the materials during cycling.23 Han et al. reported Li-rich materials modified with Na2S2O8, and found that crystal lattice O2− was oxidized to O22− and facilitated the chemical Li+ de-intercalation.24 Therefore, improvement mechanisms vary widely and depends on the properties of oxidizing agents. Compared to other oxidants, H2O2 can avoid introduction of heteroatoms of Na+ or K+ that may reduce the activity of NCM materials. However, H2O2 with strong oxidizing properties is less been reported on cathode material modification, and whether it contributes enhancement is still unclarified.
Motivated by the above study, we demonstrate a facile approach for concurrently enhancing the structural integrity and chemical composition of the Ni-rich LiNi0.8Co0.1Mn0.1O2 material, which aims to assist the electrochemical behavior in the Li-ion batteries. The preparation strategy of the modified LiNi0.8Co0.1Mn0.1O2 material is that a certain amount of H2O2 is adopted to treat the precursor of spherical Ni0.8Co0.1Mn0.1(OH)2, which leads to the oxidation of transition metal (TM) ions in varying degrees from the surface to outerlayer. Such preactivation of the precursor provides decreased amount of Ni2+, which is expected to mitigate the amount of lithium-deficient Li1−xNi1+xO2 during the following lithiation process, which specifically decreases the structural disordering and lithium residues remained on the particle surface of the final LiNi0.8Co0.1Mn0.1O2 products.
Experimental
Materials preparation
The hydroxide precursor (Ni0.8Co0.1Mn0.1(OH)2) used here was synthesized by the co-precipitation method, the detailed process was presented in our previous report.25 The pristine LiNi0.8Co0.1Mn0.1O2 denoted as N-NCM was produced by sintering the mixture of the precursor and LiOH powder with atomic ratio of Li/(Ni + Co + Mn) = 1.05 at 750 °C for 12 h under an O2 flow. The modified material treated with different amounts of H2O2 here are denoted as H-1, H-2 and H-3. To synthesized the modified samples, the obtained precursors (1 g) were soaked in hydrogen peroxide (H2O2, 30 mL) solution and stirred for 20 min at room temperature, the H2O2 concentration is 5 mol L−1 for H-1, 10 mol L−1 for H-2, 15 mol L−1 for H-3. Then, the obtained substances were filtered to obtain the modified precursor and dried at 60 °C overnight. The modified precursors are calcining by using the same condition of N-NCM as mentioned above to produce the final H-1, H-2 and H-3 materials.Materials characterization
The crystalline phase of the materials was characterized by the X-ray diffractograms (XRD) of Bruker D2 ADVANCE. The morphologies of the N-NCM and H-1, H-2 and H-3 materials were checked via scanning electron microscopy (SEM, FEI Helios Nanolab 600i). High-resolution morphological images were collected via the transmission electron microscope (TEM) with the equipment of Tecnai G2 F30 operated at 200 keV. The surface configuration of the cycled cathodes is characterized by the X-ray photoelectron spectroscopy (XPS, Thermo ESCALAB 250). Raman spectroscopy is performed in the wavenumber range of 200–850 cm−1 by utilizing DXRxi from Thermo Fisher with a solid state laser source with 532 nm. The chemical composition was analyzed using an inductively coupled plasmas spectrometer (ICP, SPS-7800, Japan).The cathode slurry was synthesized by mixing 80 wt% of active material, 10 wt% of conductive agent (Ketjenblack) dried under vacuum at 110 °C for 12 h and 10 wt% of polyvinylidenedifluoride (PVdF) dissolved in N-methyl-2-pyrrolidone (NMP). Following, the resulting slurry was deposited on the aluminum foil and dried at 110 °C overnight. The foil was then cut into disk cathodes with 10 mm in diameter.
The electrodes were fabricated by adopting coin-typed cells (CR2025) in glove box from Mikrouna filled with argon gas. Lithium metal with a diameter of 10 mm pressed on the current collector was used as the counter electrode. A solution of 1 M LiPF6 as electrolyte in EC and DMC was used in combination with PP separator (Celgard 2500). The battery for in situ-Raman measurements was a tailor-made coin cell, whose positive side of the cell case had a hole of 5 mm and the hole was covered by a window made by quartz.
Cyclic voltammetry (CV) and electrochemical impedance spectroscopy (EIS) were conducted on a multichannel workstation from Biologic VSP-300. The tests for CV used a scan rate of 0.05 to 1 mV s−1 between 2.7 and 4.5 V, for EIS were performed on a charged state of 4.5 V and used a frequency ranged from 100 kHz to 100 mHz. Galvanostatic cycling tests were carried out on the Landt cycler (series CT2001A) and a nominal current density of 1C (200 mA g−1) was adopted for all cathodes to ensure the comparability. The differential capacity vs. voltage (dQ/dV) and the galvanostatic intermittent titration technique (GITT) were measured using HOKUTO DENKO test system.
Results and discussion
Despite the treatment with the strong oxidizing H2O2 solution, it is difficult to find differences in surface morphology (Fig. S1†) and chemical composition (Table S1†) among the pristine and the H2O2 treated samples. However, detailed divergences of the crystal structure are successfully detected by the XRD and Rietveld refinement (Fig. 1). The main diffractions for all materials are demonstrated to be a single phase, corresponded to LiNiO2 (PDF 12-0543) in the hexagonal R![[3 with combining macron]](https://www.rsc.org/images/entities/char_0033_0304.gif) m space group.26,27 With careful illustration of refinement results in Table 1, all modified materials exhibit obvious increase in lattice parameter c compared with the pristine sample. And more importantly, the percentage of Ni in Li layer (R(Ni/Li)) is restrained after H2O2 treatment, the R(Ni/Li) of H-3 sample and N-NCM sample is 5.86% and 0.28%, respectively, which can be also confirmed by the higher ratio of (003)/(104) peak for the H-2 (1.74) and H-3 material (1.76). The low Li/Ni mixing can be ascribed to the pre-oxidation process that significantly decreases the amounts of Ni2+ (Fig. S3†), in which the XPS signal of Ni3+ (857.6 eV) of the N-NCM precursor is barely invisible, while the proportion of Ni2+ to Ni3+ significantly decreases after H2O2 treatment. Meanwhile, upon close inspection, the enhanced crystallization of the enhanced crystallization of the modified materials can be further reflected by the two pairs of (006)/(102) and (108)/(110) splitting of the treated materials, which separates more obviously when compared with the patterns of N-NCM material (insert view of I and II in Fig. 1a).28 Consequently, based on the above-mentioned results, it suggests that the peroxidation method promotes the structural ordering as well as the Li-ion diffusivity. Such improved structural properties of the modified materials are expected to show advantage in the following electrochemical performance.
m space group.26,27 With careful illustration of refinement results in Table 1, all modified materials exhibit obvious increase in lattice parameter c compared with the pristine sample. And more importantly, the percentage of Ni in Li layer (R(Ni/Li)) is restrained after H2O2 treatment, the R(Ni/Li) of H-3 sample and N-NCM sample is 5.86% and 0.28%, respectively, which can be also confirmed by the higher ratio of (003)/(104) peak for the H-2 (1.74) and H-3 material (1.76). The low Li/Ni mixing can be ascribed to the pre-oxidation process that significantly decreases the amounts of Ni2+ (Fig. S3†), in which the XPS signal of Ni3+ (857.6 eV) of the N-NCM precursor is barely invisible, while the proportion of Ni2+ to Ni3+ significantly decreases after H2O2 treatment. Meanwhile, upon close inspection, the enhanced crystallization of the enhanced crystallization of the modified materials can be further reflected by the two pairs of (006)/(102) and (108)/(110) splitting of the treated materials, which separates more obviously when compared with the patterns of N-NCM material (insert view of I and II in Fig. 1a).28 Consequently, based on the above-mentioned results, it suggests that the peroxidation method promotes the structural ordering as well as the Li-ion diffusivity. Such improved structural properties of the modified materials are expected to show advantage in the following electrochemical performance.
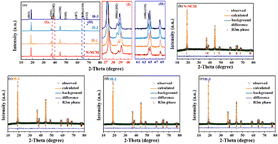 | ||
| Fig. 1 XRD patterns (a) with the enlarged view of (006)/(102) (I) and (108)/(110) (II) splitting and the corresponded Rietveld refinements (b–e). | ||
| Sample | Lattice parameters | c/a | I(003)/I(106) | R(Ni/Li) (%) | Rwp (%) | ||
|---|---|---|---|---|---|---|---|
| a (Å) | c (Å) | V (Å3) | |||||
| N-NCM | 2.879358 | 14.24321 | 102.266 | 4.946 | 1.62 | 5.86 | 2.81 |
| H-1 | 2.879287 | 14.24393 | 102.267 | 4.947 | 1.60 | 4.76 | 2.37 |
| H-2 | 2.881170 | 14.26756 | 102.569 | 4.952 | 1.74 | 0.34 | 2.08 |
| H-3 | 2.879441 | 14.24634 | 102.294 | 4.948 | 1.76 | 0.28 | 2.16 |
Fig. 2 displays the charge and discharge profiles and corresponding dQ/dV curves of the first cycles for the NCM material treated with different amounts of H2O2. The N-NCM cathode has a more extended and lower platform during the initial charging process as compared with H-2 and H-3 cathodes, which is also can be reflected by the higher intensity of the peak for H1 phase in the dQ/dV (Fig. 2b). This suggests that the existence of contaminating species that remain on the electrode surface directly results spontaneous side reaction and lower columbic efficiency (83%).28 But this phenomenon seems to be constrained after H2O2 treatment. The cathodes with H-2 and H-3 samples have a higher platform and H-2 sample shows the highest reversible capacity with a high columbic efficiency of 87%. To evaluate the cycling stability, the cathodes are examined at 1C first. As shown in Fig. 2c, the discharge capacity of the electrode with N-NCM sample reaches its pinnacle capacity of 183.7 mA h g−1 until 22 cycles and exhibits relatively low columbic efficiency around 95% at the first 30 cycles. Considering that the slowly growing capacity in the early cycles is resulted from the common effects of the lithium residues that remain on the surface, surface reconstruction and phase transition induced by cation migration, which cause a higher activation energy barrier for Li-ion diffusion.29–31 And obviously, such slow activation process also has a detrimental effect on the subsequent cycling and causes less stability of N-NCM cathode with capacity retention of 92.4% detected within 100 cycles. But it seems that the irreversible capacity in the early cycles can be mitigated in the modified materials by increasing the amount of H2O2. It can be seen in Fig. 2d–f, the capacity of modified materials is higher and reaches their pinnacle earlier as compared with the pristine, 185.2 mA h g−1 for H-1 sample at 15th cycle, 196.3 mA h g−1 for H-2 sample at 11th cycle and 190.1 mA h g−1 at 9th cycle for H-3 sample. And all of these modified materials show improved columbic efficiency and conserve their capacity better to that of the pristine one. Most notably, the H-2 and H-3 samples exhibit superior capacity retention of 94.9% and 98.5% after 100 cycles, respectively.
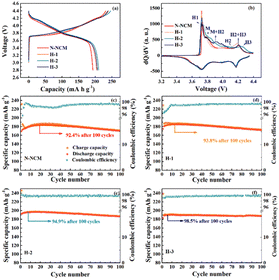 | ||
| Fig. 2 The initial charge–discharge profile and corresponding dQ/dV results (a and b); the cycling performance at 1C (d–f). | ||
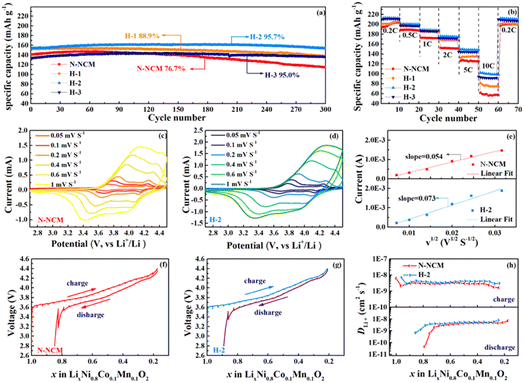
Fig. 3a compares the long-term cycling performance for all materials at a high rate of 5C. As seen, the electrode with N-NCM material delivers a pinnacle 147.3 mA h g−1 with capacity retention of 76.7% after 300 cycles. In contrast to the drastic capacity fading of N-NCM sample, all the modified samples outperform the pristine one in capacity retention after 300 cycles, 88.9% for H-1, 95.7% for H-2 and 95.0% for H-3. Meanwhile, as illustrated in Fig. S2,† the central voltage plateau of the N-NCM sample decreases to below 3.3 V after 300 cycles, while that of the H-2 and H-3 sample varies from the initial 3.75 V to 3.63 V, 3.60 V, respectively, after 300 cycles. The rate capability at 0.5C–10C also demonstrates the superiority of H2O2-treated samples (Fig. 3b). Although the differences between their capacities below 0.5C are negligible, the modified materials maintain much higher capacity than that of pristine during the subsequent cycles. With H2O2 amounts increasing, the relative high capacity 148.6 mA h g−1 for H-2 sample and 143.19 mA h g−1 for H-3 sample at 5C, and 101.0 mA h g−1 for H-2 sample and 91.8 mA h g−1 for H-3 sample at 10C are detected. The cation mixing of the materials can affect dynamic characteristic of N-NCM as well, which is responsible for opened Li-ion mobility channel during cycling. Therefore, the H-2 and H-3 samples with better structural integrity have much enhanced cycling stability and rate capability.
CV and GITT are used to evaluate the diffusion coefficient of Li-ions (DLi+), which reflect the electrochemical kinetic properties (Fig. 3c–h). Based on the CV experiment, the DLi+ of N-NCM and H-2 samples are to be 7.44 × 10⁻¹⁰ cm2 s−1 and 1.36 × 10⁻⁹ cm2 s−1, respectively, according to the Randle–Sevcik equation.32 This superiority is also demonstrated by GITT, in which the detailed DLi+ of the N-NCM and H-2 samples during the entire charge/discharge process is presented in Fig. 3h. The measured DLi+ ranges from 4.5 × 10⁻¹¹ cm2 s−1 and 7 × 10⁻⁹ cm2 s−1 along with the increased value of the modified cathode, which is consistent with the results from CV. Additionally, the extremely low DLi+ of N-NCM cathode (4.52 × 10⁻¹¹ cm2 s−1) appearing at the end of discharge accounts for the capacity fading upon a cycle.33 Comparably, the DLi+ of H-2 sample is 6.77 × 10⁻¹⁰ cm2 s−1 at the end of discharge, much larger than that of the N-NCM cathode, indicating the improved chemical reversibility on the modified material once more.
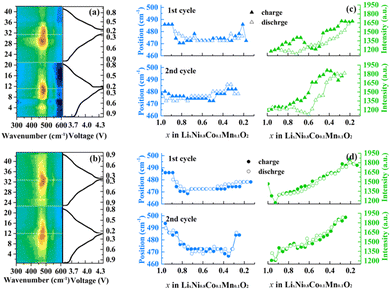
In situ Raman spectroscopy is carried out to better understand the contribution of the hierarchical composition on the electrochemical response and related structure changes during cycling. Corresponding counter map and detailed position and intensity change of Eg in the first two cycles of the N-NCM and H-2 samples are compared in Fig. 4. Upon charging, the A1g peak apparently declined to a minor signal is assigned to the generation of Li-ion vacancy30. But it is difficult to track and fit it because of its low intensity. As for Eg peak, the intensity for the H-2 sample exhibits a monotonically increase as the potential increases, which originates from the gradually oxidized nickel ion.31 By contrast to the H-2 sample, there is a segment of abruptly week intensity for the N-NCM sample during the delithiation progress (0.7 < x < 0.3), which indicates the appearance of excess side reaction resulted from the surface contaminating species as well as the cation mixing. This discrepancy between the two samples would in turn confirm that the pre-oxidation procedure can effectively prevent surface reconstruction and undesired structural transition. Additionally, the band shift during cycling is also a significant parameter to determine the structure and symmetry, which is related to the variation of lattice parameters and coordination within the TMO6 unit.30 In the case of H-2 sample, the band position of Eg (p(Eg)) exhibits a U-shape trend, which decreases first to lower wavenumber and maintains a constant upon 0.4 < x < 0.8, hereafter the p(Eg) again increases. Unlike the case of H-2, where both the p(Eg) and I(Eg) well overlap during charge and discharge of the initial two cycles, charging the N-NCM cathode to 4.4 V leads to a hysteresis in p(Eg) and I(Eg), which confirms that the tailored composition of H-2 sample is favorable for maintaining the structural reversibility upon cycling.
To further detect the structural stability, the cycled cathodes for the N-NCM and H-2 samples are detected by HRTEM (Fig. 5). Apparently, we can find large areas of NiO rock-salt on the surface of the N-NCM particles but find a few for the H-2 particles after long-term cycling. In the case of the particle of N-NCM, its surface mainly contains group with layered R![[3 with combining macron]](https://www.rsc.org/images/entities/char_0033_0304.gif) m structure after 10th cycle but some dominant of mixed phases with NiO-like impurities (Fig. 5a). After 100 cycles, the NiO-like impurities with a thickness above 15 nm are observed in the surface of the N-NCM particle, which can be confirmed by the fast Fourier transform (FFT) pattern exhibited Fm
m structure after 10th cycle but some dominant of mixed phases with NiO-like impurities (Fig. 5a). After 100 cycles, the NiO-like impurities with a thickness above 15 nm are observed in the surface of the N-NCM particle, which can be confirmed by the fast Fourier transform (FFT) pattern exhibited Fm![[3 with combining macron]](https://www.rsc.org/images/entities/char_0033_0304.gif) m structure (Fig. 5c). These impurities lead to ironically inert layer from continuous cation mixing during repeated cycling, which is also responsible for the increment of impendence and thus the capacity fading. By contrast, the H-2 electrode after 10th cycle shows a bulk of layered structure with R
m structure (Fig. 5c). These impurities lead to ironically inert layer from continuous cation mixing during repeated cycling, which is also responsible for the increment of impendence and thus the capacity fading. By contrast, the H-2 electrode after 10th cycle shows a bulk of layered structure with R![[3 with combining macron]](https://www.rsc.org/images/entities/char_0033_0304.gif) m phase and a thin surface layer of Fm
m phase and a thin surface layer of Fm![[3 with combining macron]](https://www.rsc.org/images/entities/char_0033_0304.gif) m phase (Fig. 5b). After 100 cycles, inherently generated layer with mixed phases is also observed in the particle surface of H-2 electrode, but its thickness is well retained at about 5 nm (Fig. 5d). This observation further confirms that the H2O2 pretreatment is helpful for suppressing the structural distortion and leading to more sustainable intercalation reaction.
m phase (Fig. 5b). After 100 cycles, inherently generated layer with mixed phases is also observed in the particle surface of H-2 electrode, but its thickness is well retained at about 5 nm (Fig. 5d). This observation further confirms that the H2O2 pretreatment is helpful for suppressing the structural distortion and leading to more sustainable intercalation reaction.
 | ||
| Fig. 5 HRTEM images of the charged electrodes after 10th (a and b) and 100th (c and d) cycle at the rate of 1C. | ||
The depth XPS conducted around 40 nm from the top surface further gives an insight to the considerable improvement in the electrochemical performance (Fig. 6). As shown in Fig. 6a and c, the C 1s spectra can be fitted into four peaks, C![[double bond, length as m-dash]](https://www.rsc.org/images/entities/char_e001.gif) O, C–O, PVdF and C–C, respectively located at binding energies of 290.45 eV, 286.45 eV, 285.51 eV and 284.39 eV.33 In the case of N-NCM, the C
O, C–O, PVdF and C–C, respectively located at binding energies of 290.45 eV, 286.45 eV, 285.51 eV and 284.39 eV.33 In the case of N-NCM, the C![[double bond, length as m-dash]](https://www.rsc.org/images/entities/char_e001.gif) O assigned to the Li2CO3 is relatively high, suggesting a high quantity of residual lithium species that inhibits the migration of Li-ions and electrons33. But the peak intensity for C
O assigned to the Li2CO3 is relatively high, suggesting a high quantity of residual lithium species that inhibits the migration of Li-ions and electrons33. But the peak intensity for C![[double bond, length as m-dash]](https://www.rsc.org/images/entities/char_e001.gif) O in the case of NCM622 sample shows sharp reduction from 0 nm to 40 nm, indicating that the pre-oxidation process improve the utilization of lithium source and thus facilitates the Li-ion storage process. Besides, observed peaks in the F 1s spectra are associated with electrolyte decomposition products (LiPxFy, 688.86 eV; LixPyOFz, 687.28 eV; TMFx, 685.94 eV; LiF, 685.06 eV) as well as PVdF binder (688.10 eV).28 LiF and TMFx is the result of the substrates dissolution of NCM cathode, therefore the relative intensity of gradually increases from inside out. The LiPxFy and LixPyOFz are the byproducts of electrolyte decomposition, thus their intensity gradually decreases from inside out. Notably, the peaks for the parasitic-reaction products of LiF and TMFx are fairly pronounce in the case of N-NCM, especially in the depth up to 20 nm, where the total quantity of LiF and TMFx accounts for a much larger proportion than the other species (Fig. 6b). By contrast, the amounts ratio of LiF and TMFx of the H-2 sample are significantly reduced. Even at the depth of the 40 nm, the surface of the H-2 electrode mostly consists of LixPyOFz rather than that of LiF or TMFx (Fig. 6d). Such reduced parasitic reaction products clearly confirms that the pre-oxidation method is also conducive to the stability of the electrode/electrolyte interface.
O in the case of NCM622 sample shows sharp reduction from 0 nm to 40 nm, indicating that the pre-oxidation process improve the utilization of lithium source and thus facilitates the Li-ion storage process. Besides, observed peaks in the F 1s spectra are associated with electrolyte decomposition products (LiPxFy, 688.86 eV; LixPyOFz, 687.28 eV; TMFx, 685.94 eV; LiF, 685.06 eV) as well as PVdF binder (688.10 eV).28 LiF and TMFx is the result of the substrates dissolution of NCM cathode, therefore the relative intensity of gradually increases from inside out. The LiPxFy and LixPyOFz are the byproducts of electrolyte decomposition, thus their intensity gradually decreases from inside out. Notably, the peaks for the parasitic-reaction products of LiF and TMFx are fairly pronounce in the case of N-NCM, especially in the depth up to 20 nm, where the total quantity of LiF and TMFx accounts for a much larger proportion than the other species (Fig. 6b). By contrast, the amounts ratio of LiF and TMFx of the H-2 sample are significantly reduced. Even at the depth of the 40 nm, the surface of the H-2 electrode mostly consists of LixPyOFz rather than that of LiF or TMFx (Fig. 6d). Such reduced parasitic reaction products clearly confirms that the pre-oxidation method is also conducive to the stability of the electrode/electrolyte interface.
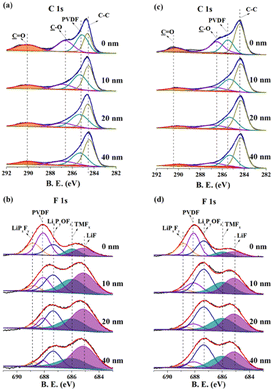 | ||
| Fig. 6 Depth XPS of the charged electrodes for the (a and b) N-NCM and (c and d) H-2 samples after 100th cycle at 1C. | ||
As illustrated above, our designed H-2 material with unique architecture, showing enhanced Li-ion mobility and reversibility during repeated Li-ion insertion/extraction, makes it possible to achieve 95.7% capacity retention over 300 cycles when cycling at 4.4 V. The kinetics of the electrodes during cycling is further examined by EIS. It can be seen in Fig. 7, all plots exhibit a semicircle lied in the high-to medium frequency and attributed to the resistances of charge transfers (Rct) on the electrodes. As the cycling proceeded, Rct of the pristine cell increases considerably as compared with that of the H-2 cell. The increment in Rct for the pristine is almost three times its initial value, which can be ascribed to the gradually generated byproducts that are highly resistant to the diffusion of both Li-ions and electronics. By contrast, the Rct of H-2 cell increases more slowly, showing 66.6 Ω at 1st and 90 Ω at 110.6th, indicating that adverse side reaction occur less extensively for the H-2 cell, which is also consistent with the result of the XPS.
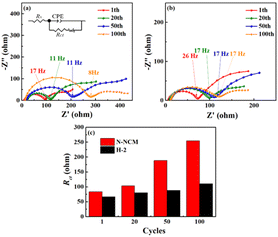 | ||
| Fig. 7 Nyquist plots for the (a) N-NCM and (b) H-2 cells charged to 4.4 V at 1C; (c) Rct calculated by the equivalent circuit drawn in (a). | ||
Conclusions
In summary, a facile approach for unique architecture construction is proposed to enhance the chemical reversibility of Ni-rich-layered cathode via the treatment of H2O2. The modified materials show significantly reduced Li+/Ni2+ mixing to below 0.34%, which is attributed to the H2O2 preoxidation that increases the amount of Ni3+ and mitigates the lithium-deficient Li1−xNi1+xO2. This is also proved by the domains enriched with Ni3+ detected by Raman mapping. The electrochemical properties of the modified one show extended capacity retention of 98.5% over 100 cycles, better rate capability as well as higher columbic efficiency when working up to 4.4 V. To elucidate the superiority of the modified material on the structure integrity, the examination of in situ Raman within the first two cycles and HRTEM obtained after cycling are conducted. As compared with the N-NCM, the peak intensity and position of the Eg mode for the modified one is more reversible upon charge/discharge and the amount of NiO-like phase is effectively restrained during cycling. Furthermore, the depth XPS suggests that the residual lithium remain on the electrode surface as well as the side reaction products (TMFx and LiF) are significantly reduced after H2O2 modification, further proving the outstanding functionality of the modification.Author contributions
Yan Mo and Shaofeng Liu conceived the idea, synthesized materials and wrote the original draft. ZiKun Li: and Meng Zhang carried out the electrochemical measurements and data analysis. Lingjun Guo conducted the in situ Raman test and data analysis. Guohui Yuan charged with financing, reviewed and edited the manuscript.Conflicts of interest
The authors declare no conflict of interest.Acknowledgements
The authors thank Prof. Chen Yong for fruitful discussions. This study was financially supported by National key Research and Development projects (2021YFC2902903).Notes and references
- M. S. Whittingham, Chem. Rev., 2004, 104, 4271 CrossRef CAS PubMed.
- V. Etacheri, R. Marom, E. Ran, G. Salitra and D. Aurbach, Energy Environ. Sci., 2011, 4, 3243–3262 RSC.
- J. Li, M. Zhang, D. Zhang, Y. Yan and Z. Li, Chem. Eng. J., 2020, 402, 126195 CrossRef CAS.
- J. Kim, H. Cho, H. Y. Jeong, H. Ma, J. Lee, J. Hwang, M. Park and J. Cho, Adv. Energy Mater., 2017, 7, 1602259 Search PubMed.
- S. S. Zhang, Energy Storage Mater., 2020, 24, 247–254 CrossRef.
- D. Liu, S. Liu, C. Zhang, L. You, T. Huang and A. Yu, ACS Sustainable Chem. Eng., 2019, 7, 10661–10669 CrossRef CAS.
- J. H. Kim, S. J. Kim, T. Yuk, J. Kim, C. S. Yoon and Y. K. Sun, ACS Energy Lett., 2018, 3, 3002–3007 CrossRef CAS.
- F. Zhao, X. Li, Y. Yan, M. Su, L. Liang, P. Nie, L. Hou, L. Chang and C. Yuan, J. Power Sources, 2022, 524, 231035 CrossRef CAS.
- F. Lin, I. M. Markus, D. Nordlund, T. C. Weng, M. D. Asta, H. L. Xin and M. M. Doeff, Nat. Commun., 2014, 5, 3529 CrossRef PubMed.
- C. Xu, W. Xiang, Z. Wu, L. Qiu, Y. Ming, W. Yang, L. Yue, J. Zhang, B. Zhong, X. Guo, G. Wang and Y. Liu, Chem. Eng. J., 2021, 403, 126314 CrossRef CAS.
- F. Wu, J. Tian, N. Liu, Y. Lu, Y. Su, J. Wang, R. Chen, X. Ma, L. Bao and S. Chen, Energy Storage Mater., 2017, 8, 134–140 CrossRef.
- K. Min, C. Jung, D. S. Ko, K. Kim, J. Jang, K. Park and E. Cho, ACS Appl. Mater. Interfaces, 2018, 10, 20599–20610 CrossRef CAS PubMed.
- W. Li, H. Y. Asl, Q. Xie and A. Manthiram, J. Am. Chem. Soc., 2019, 141, 5097–5101 CrossRef CAS PubMed.
- H. Deng, P. Nie, H. Luo, Y. Zhang, J. Wang and X. Zhang, J. Mater. Chem. A, 2014, 2, 18256–18262 RSC.
- W. S. Yoon, K. W. Nam, D. Jang, K. Y. Chung, J. Hanson, J. M. Chen and X. Q. Yang, J. Power Sources, 2012, 217, 128–134 CrossRef CAS.
- S. H. Ju, I. S. Kang, Y. S. Lee, W. K. Shin, S. Kim, K. Shin and D. W. Kim, ACS Appl. Mater. Interfaces, 2014, 6, 2546–2552 CrossRef CAS PubMed.
- J. Liu and A. Manthiram, Chem. Mater., 2009, 21, 1695–1707 CrossRef CAS.
- H. Kim, M. G. Kim, H. Y. Jeong, H. Nam and J. Cho, Nano Lett., 2015, 15, 2111–2119 CrossRef CAS PubMed.
- W. Zhang, L. Liang, F. Zhao, Y. Liu, L. Hou and C. Yuan, Electrochim. Acta, 2020, 340, 135871 CrossRef CAS.
- C. Yang, Q. Zhang, W. Ding, J. Zang, M. Lei, M. Zheng and Q. Dong, J. Mater. Chem. A, 2015, 3, 7554–7559 RSC.
- S. H. Kang, C. S. Johnson, J. T. Vaughey, K. Amine and M. M. Thackeray, J. Electrochem. Soc., 2006, 153, A1186 CrossRef CAS.
- P. Oh, S. Myeong, W. Cho, M. J. Lee, M. Ko, H. Y. Jeong and J. Cho, Nano Lett., 2014, 14, 5965 CrossRef CAS PubMed.
- B. Huang, M. Wang, X. Yang, G. Xu and Y. Gu, J. Alloys Compd., 2019, 808, 151683 CrossRef CAS.
- S. Han, B. Qiu, Z. Wei, Y. Xia and Z. Liu, J. Power Sources, 2014, 268, 683–691 CrossRef CAS.
- Y. Mo, L. Guo, B. Du, H. Jin, B. Cao, Y. Lu, D. Li and Y. Chen, J. Power Sources, 2020, 477, 228699 CrossRef CAS.
- T. Ohzuku and A. Ueda, J. Electrochem. Soc., 1994, 141, 2972–2977 CrossRef CAS.
- M. Jeong, H. Kim, W. Lee, S. J. Ahn, E. Lee and W. S. Yoon, J. Power Sources, 2020, 474, 228592 CrossRef CAS.
- H. Deng, I. Belharouak, Y. K. Sun and K. Amine, J. Mater. Chem., 2009, 19, 4510–4516 RSC.
- W. Liu, P. Oh, X. Liu, M. J. Lee, W. Cho, S. Chae, Y. Kim and J. Cho, Angew. Chem., Int. Ed., 2015, 54, 4440–4457 CrossRef CAS PubMed.
- H. H. Ryu, K. J. Park, C. S. Yoon and Y. K. Sun, Chem. Mater., 2018, 30, 1155–1163 CrossRef CAS.
- L. Liang, X. Li, M. Su, L. Wang, J. Sun, Y. Liu, L. Hou and C. Yuan, Angew. Chem., Int. Ed., 2023, 62, e202216155 CrossRef CAS PubMed.
- X. D. Zhang, J. L. Shi, J. Y. Liang, Y. X. Yin, J. N. Zhang, X. Q. Yu and Y. G. Guo, Adv. Mater., 2018, 30, 1801751 CrossRef PubMed.
- C. Hong, Q. Leng, J. Zhu, S. Zheng, H. He, Y. Li, R. Liu, J. Wana and Y. Yang, J. Mater. Chem. A, 2020, 8, 8540 RSC.
Footnotes |
| † Electronic supplementary information (ESI) available. See DOI: https://doi.org/10.1039/d3ra07178b |
| ‡ These authors contributed equally. |
| This journal is © The Royal Society of Chemistry 2024 |

