DOI:
10.1039/D3RA06185J
(Paper)
RSC Adv., 2024,
14, 3289-3303
A highly sensitive triazole-based perfectly water soluble novel bis-Schiff base reversible fluorescent-colorimetric chemosensor for fast detection of Pb2+ ions†
Received
11th September 2023
, Accepted 4th January 2024
First published on 19th January 2024
Abstract
A reversible fluorescent-colorimetric azino bis-Schiff base receptor for the detection of Pb2+ in aqueous medium has been developed for the first time. Receptor L exhibits an excellent selective and rapid fluorescent-colorimetric response towards Pb2+. The sensitivity of the fluorescent-based assay (0.53 nM) and colorimetric assay (1.0 nM) for Pb2+ is sufficiently good in comparison to previously reported literature. From 1H NMR data, Job plot measurement and the ESI-MS spectrum, a 1![[thin space (1/6-em)]](https://www.rsc.org/images/entities/char_2009.gif) :2 stoichiometric complexation between L and Pb2+ has been established. Receptor L shows a remarkable detection ability in a wide pH range of 4–8 and it has been successfully utilised in the determination of Pb2+ in aqueous solution of bovine serum albumin protein and in real samples. The geometry of L has been optimized by both DFT studies and NMR, FTIR and mass spectra. Moreover, we have studied molecular docking of the probe L.
:2 stoichiometric complexation between L and Pb2+ has been established. Receptor L shows a remarkable detection ability in a wide pH range of 4–8 and it has been successfully utilised in the determination of Pb2+ in aqueous solution of bovine serum albumin protein and in real samples. The geometry of L has been optimized by both DFT studies and NMR, FTIR and mass spectra. Moreover, we have studied molecular docking of the probe L.
1. Introduction
Many metal ions play important roles in regulation and maintenance of living organisms. Some metals are hazardous in nature, and intake of these has an adverse toxic effect on the body. Detection and removal of these types of toxic harmful elements are most essential nowadays. In the modern era, many techniques are available for the detection of heavy and harmful elements. These techniques include cold vapor atomic absorption spectrometry, inductively coupled plasma mass spectrometry, electrochemical sensing and many other recognition methods such as atomic absorption, potentiometry and ion-exchange chromatography.1–5 These traditional methods have good selectivity and sensitivity but have some drawbacks, like being expensive and involving complicated and lengthy processes while also requiring skilled personnel, sophisticated instrumentation, high operating expenditures and difficult sample preparation processes. In order to overcome these types of issues, simple and inexpensive chemosensors that can detect analytes online in real time with little time commitment are favoured to address these problems. One of the most considered and in-demand techniques is based on optical sensing. Due to their widespread usage in the identification and monitoring of cations and anions, particularly those of a dangerous nature, colorimetric and fluorometric sensors with a “naked eye” sensing capability have recently gained popularity in the chemical, environmental, and biological fields.6–10
Pb2+ serves as a crucial transitional component and is crucial in many fields. According to the history of lead, lead nitrate manufacture for commercial purposes started in the 19th century. In the industrial domain, it was primarily used at the time as the main raw material for the creation of pigments.11,12 Due to titanium dioxide's less hazardous effects than lead, the use of lead gradually declined over time. It did, however, significantly contribute to industrial production. It was employed in industry as a heat stabiliser in the coatings of nylon, polyester, and thermal imaging paper.13 Recent studies claim that lead (Pb) and its compounds impair the kidney, brain system, digestive system, and other organs and systems in the body after entering through wastewater and waste residues.14 Neurasthenia syndrome, peripheral neuropathy, and lead poisoning encephalopathy are the predominant neurological symptoms. According to WHO, the maximum contaminant level of Pb2+ ions in drinking water is set to 10 mg L−1.12 For this reason, much effort has been made to develop effective methods for Pb2+ detection. The ability of many fluorescence chemosensors to distinguish between Pb2+/Ag+, Pb2+/Fe3+/Hg2+, and Pb2+/Hg2+/Cd2+ has been demonstrated, but these chemosensors may exhibit poor binding selectivity for Pb2+ over other heavy transition metal ions, which would reduce the accuracy of Pb2+ detection in practical applications. Hence, it is of interest to create highly sensitive and focused fluorescent chemosensors for naked-eye Pb2+ detection.15,16
Azo compounds have been crucial as colorants because of their versatile application in diverse fields like electrophotography, laser printing, reversible optical storage, nonlinear optical devices, liquid crystalline displays, and biological-medical studies.17,18 The wide range of applications for azo compounds, especially azobenzene dyes, can be attributed to their many benefits, including intense colour, simplicity in synthesis from inexpensive, easily accessible raw materials, desirable fastness properties, and special characteristics resulting from light-induced cis–trans isomerization.19,20
In continuation of our previous21–25 studies in the search of fluorescent colorimetric Schiff bases, we report a novel, highly selective and sensitive optical chemosensor L based on triazole associated with azo dye for the easy onsite detection of Pb2+. The introduction of SO3H group into the flexible structure resulted in an improvement of the stability and the selectivity to metal ions as well as perfect solubility in aqueous solution. The presence of two donor sites and two acceptor sites increases the binding affinity of L and makes the detection limit lower than that of a single donor/acceptor (donor-π conjugation-acceptor) based chemosensor. The results showed that sensor L exhibited higher selectivity and sensitivity toward Pb2+ over many other metal ions in aqueous medium.
2. Experimental
2.1 General information
An X-4 digital melting-point device was used to determine the melting point, which was not corrected. Using a quartz cuvette with a 10 mm path length, UV-visible spectra were captured by a Shimadzu UV-vis 1800 spectrophotometer. A Hitachi spectrophotometer (RF-6000) was used to capture the fluorescence spectra. 1H NMR and 13C NMR spectra of the ligand were obtained with a Bruker Ultra Shield 400 MHz spectrometer, and the chemical shifts are given in ppm in relation to TMS. With a waters mass spectrometer, ESI-mass spectra were captured using a mixed solvent of HPLC methanol and triple-distilled water. All of the chemicals and metal salts were bought from Merck, and sodium was used as the counter ion for anions and nitrate for metals. In triple-distilled water, solutions of the receptor L (1 × 10⁻⁵ M) and metal salts (1 × 10⁻⁴ M) were made.
2.2 Synthesis of ligand L
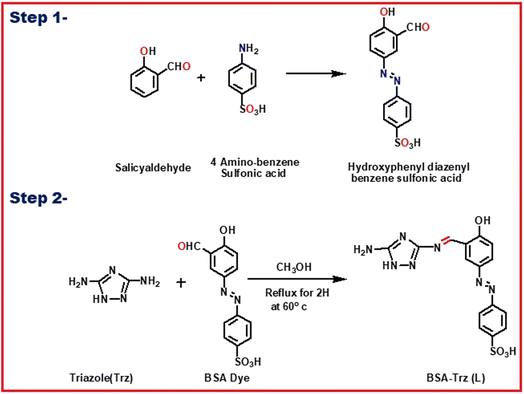
The acidic –SO3H group of sulphanilic acid (1 mmol, 168 mg) was converted to –SO3Na group and its diazonium salt was prepared in good yield following previously described methods26 with slight modification. After completion of the diazotization reaction, in another flask, salicylaldehyde (1 mmol, 122 mg) was dissolved in 10 mL water containing sodium hydroxide and sodium carbonate and cooled to 0 to −5 °C in an ice bath. The ice-cold diazonium solution was slowly added to the phenolate ion solution in basic medium by adjusting the pH at 7.5–8.5 over 30 min. The resulting solution was stirred for 30 min in an ice bath and then for 1 h at room temperature. The precipitate was collected and was washed several times with cold water after acidification of the solution (pH = 5.5–6.5) by addition of diluted HCl. The precipitate was finally re-crystallized from MeOH/H2O to obtain the azo dye 1.
A methanolic solution of the azo dye 1 (2 mmol in 25 mL) was added to another methanolic solution of 1H-1,2,4-triazole-3,5-diamine (0.099 g, 1 mmol in 25 mL). The reaction mixture was refluxed for 8 h, under dry condition. Then, it was slowly cooled to room temperature. A deep-red-coloured solid separated out, which was filtered off and dried in air. Yield: 0.612 g (75%); m.p. > 220 °C. Anal. found (calc. for C28H21N9O8S2): C, 49.87 (49.77%); H, 3.08 (3.13%); N, 18.59 (18.66%). ESI-MS: 676.45 (MH+, 25%) (Fig. S1†). FTIR/cm−1 (KBr): 1616 (vs.) (C![[double bond, length as m-dash]](https://www.rsc.org/images/entities/char_e001.gif) N), 1541 (vs., NN), 1483 (w), 1420 (w), 1363 (m), 1296 (s), 1198 (vs., SO), 1114 (s), 1042 (vs.), 998 (m), 900 (s), 834 (s), 755 (w), 708 (s), 638 (w) (Fig. S2†). 1H NMR (400 MHz, CDCl3, TMS): δ 11.62 (s, 1H, –NH), 10.68 (s, 2H, –SO3H), 9.82 (s, 2H, –CHN), 8.51 (s, 2H, phenyl), 7.98 (s, 4H), 7.52 (s, 2H, phenyl), 7.48 (m, 4H), 6.35 (m, 2H), 3.50 (s, 2H, –OH) (Fig. S3†). 13C NMR (400 MHz, CDCl3, TMS): δ 190.12, 160.07, 145.20, 139.62, 137.55, 132.15, 131.19, 130.26, 127.51, 129.39, 127.91, 126.46, 125, 32 (Fig. S4†). UV-visible: λmax/nm (CH3OH): 235 (11200), 330 (17500).
N), 1541 (vs., NN), 1483 (w), 1420 (w), 1363 (m), 1296 (s), 1198 (vs., SO), 1114 (s), 1042 (vs.), 998 (m), 900 (s), 834 (s), 755 (w), 708 (s), 638 (w) (Fig. S2†). 1H NMR (400 MHz, CDCl3, TMS): δ 11.62 (s, 1H, –NH), 10.68 (s, 2H, –SO3H), 9.82 (s, 2H, –CHN), 8.51 (s, 2H, phenyl), 7.98 (s, 4H), 7.52 (s, 2H, phenyl), 7.48 (m, 4H), 6.35 (m, 2H), 3.50 (s, 2H, –OH) (Fig. S3†). 13C NMR (400 MHz, CDCl3, TMS): δ 190.12, 160.07, 145.20, 139.62, 137.55, 132.15, 131.19, 130.26, 127.51, 129.39, 127.91, 126.46, 125, 32 (Fig. S4†). UV-visible: λmax/nm (CH3OH): 235 (11200), 330 (17500).
2.3 Preparation of stock solution for photophysical measurements
L (6.75 mg) was dissolved in 10 mL of triple-distilled water to make a solution of 1 × 10⁻³ M and 30 μL of this solution was diluted with 2.97 mL of solvent mixture to make a final concentration of 10 μM. The guest cation solutions were prepared separately using the corresponding nitrate salts at a concentration of 10 mM with triple-distilled water and further diluted to the desired concentration. After mixing L with each of the metal ions for a few seconds, UV-visible and fluorescence spectra were obtained at room temperature.
2.4 Job plot measurements
L (6.75 mg, 0.01 mmol) was dissolved in triple-distilled water (10 mL). 100, 90, 80, 70, 60, 50, 40, 30, 20, 10 and 0 μL of the L solution were taken and transferred to vials. Each vial was diluted with 2.9 mL of distilled water.
An aqueous solution of Pb(NO3)2 (10 μM) was prepared in triple-distilled water. 10, 20, 30, 40, 50, 60, 70, 80, 90 and 100 μL of the Pb(NO3)2 solution were added to each diluted L solution. Each vial had a total volume of 3 mL. After shaking them for a minute, absorption spectra were obtained at room temperature.
2.5 Competition with other metal ions
To determine the possible interference from other metal ions and selective binding affinity of chemosensor L towards Pb2+, absorption spectra were obtained in the presence of other analytes. Chemosensor L (6.75 mg, 0.01 mmol) was dissolved in triple-distilled water (10 mL) and 30 μL of it was diluted to 3 mL to make a final concentration of 10 μM. M(NO3)2 (0.1 mmol) (where M = metal cation) was dissolved in 10 mL of triple-distilled water (each). 30 μL of each metal solution (10 mM, Al3+, Hg2+, Co2+, Ni2+, Zn2+, Ca2+, Mn2+, Cd2+, Cr3+, Mg2+, Fe3+ and Ag+) was taken and added to 3 mL of the solution of receptor L (10 μM) to give 10 equiv. of metal ions. Then, 30 μL of metal solution (10 mM) was added to the mixed solution of each metal ion and L to make 10 equiv. After mixing them for a few seconds, absorption spectra were obtained at room temperature.
2.6 pH study
This pH study has been considered as the charge separation of ligand with presence and absence of metal ion, the observed change was due to different absorbance behaviour of solution in the variation of pH. A set of buffer solutions with different range of pH values from 2 to 13 was prepared using 100 mM HEPES buffer. After the solution of desired pH was achieved, receptor L (6.75 mg) was dissolved in water (10 mL). For metal solution, 1 mM of Pb(NO3)2 was dissolved in HEPES buffer (10 mL, pH 7.00). 30 mL of these solutions (10 mM) was added to each of the previously made receptor solutions (10 M). After a brief period of mixing at room temperature, UV-visible spectra were obtained.
2.7 Computational details
The GAUSSIAN-09 revision C.01 program package was used for all calculations.27 The gas-phase geometries of the compound were fully optimized without any symmetry restrictions in singlet ground state with the gradient-corrected density functional theory (DFT) level coupled with the hybrid exchange-correlation functional that uses Coulomb-attenuating method B3LYP.28 Basis set 6-31++G was found to be suitable for the whole molecule. LanL2DZ basis sets were implemented for the geometry optimization of L + Pb2+ complex.
3. Results and discussion
3.1 Synthesis of ligand L
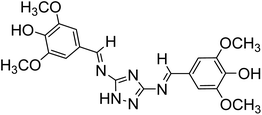
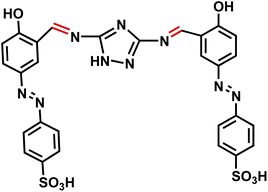
At the beginning, the starting material (E)-4-(3-formyl-4-hydroxyphenyl)diazyenyl benzenesulfonic acid (1) was synthesized by azo coupling reaction between salicylaldehyde and 4-aminobenzenesulfonic acid in good yield. This process was followed by the condensation reaction of 1H-1,2,4-triazole-3,5-diamine (trz) with the benzosulfonic azo dye to give rise to our desired chemosensor L which was precipitated out by methanol in pure state (Scheme 1). L was characterized by 1H NMR, 13C NMR, FT-IR and ESI-mass spectroscopy and elemental analysis.
 |
| | Scheme 1 Synthetic procedure of the probe L. | |
In order to get the most probable structure of L, computations on the chemosensor L were performed based on DFT. The geometry-optimized structure and a schematic representation of the energy of MOs and contours of selected HOMO and LUMO orbitals of L are shown in Fig. 1. The calculated energy gap between HOMO and LUMO is 3.355 eV. The energy gap between HOMO and LUMO in the lead complex is 2.081 eV.
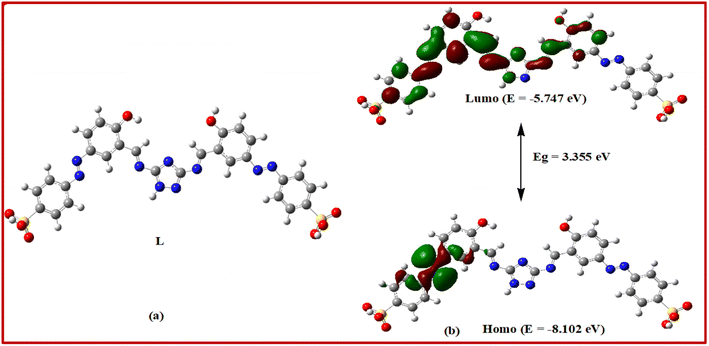 |
| | Fig. 1 (a) Optimized geometry and (b) frontier molecular orbitals and HOMO–LUMO energy gap of the probe L. | |
3.2 UV-visible spectral study of the chemosensor L
The optical behaviour of chemosensor L was investigated in water solution by using UV-visible absorption measurements. It was observed that initially the chemosensor L had a sharp single absorption band at 345 nm in aqueous solution which was attributed to the n–π* transition.29 After determining the optical properties of the newly synthesized triazole derivative L, the effect of other charged metal ions on its optical spectra was investigated. This absorption behaviour of L was almost constant for all selected metal ions Al3+, Cu2+, Cd2+, Hg2+, Zn2+, Co2+, Ni2+, Mn2+, Cr3+, Fe3+ and Ag+ until addition of 3 equiv. of the different cations. This trend of similar spectra was changed for addition of Pb2+ ions. A blue-shifted absorption band appeared at 300 nm after addition of 2 equiv. of Pb2+ ions to the receptor solution with a clear observable colour change from yellow to colourless. More research was done on the ability of chemosensor L to detect metal ions. Fig. 2 illustrates L metal ion selectivity; only Pb2+ creates a yellow to colourless transition that is visible to the unaided eye and when exposed to UV radiation (Fig. 3). No colour shift is caused by other metal ions. The colour changes were clearly visible to the naked eye and under UV light with Pb2+ in the presence of other metal ions.30
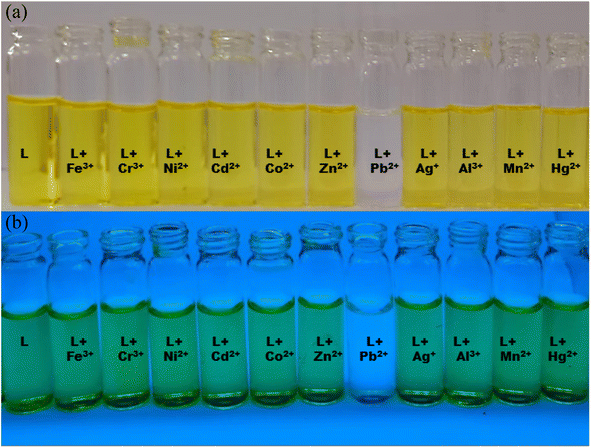 |
| | Fig. 2 Colour changes (a) to the naked eye and (b) under UV light of ligand L with Pb2+ ions and other cations in CH3OH/H2O (1:2). | |
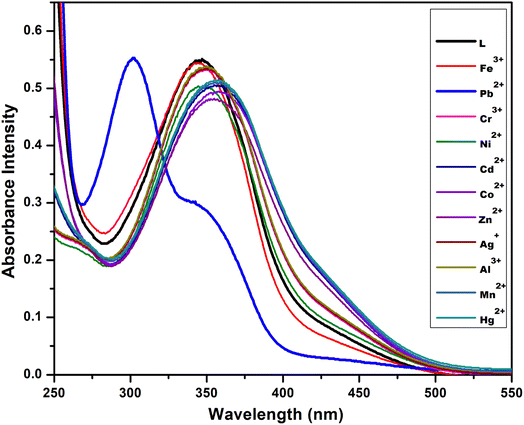 |
| | Fig. 3 Absorption spectra of L (10 μM) in the presence of 3 equiv. of different metal ions in CH3OH–H2O (1:2). | |
As expected from the above experimental analysis, we conclude that our synthesised L can be used for the selective detection of Pb2+ ions. We observed the best colorimetric and fluorometric response in a solvent mixture of MeOH:H2O (1:2) when we examined the spectral behaviour of L with different types of solvent, i.e., DMSO, ethanol, acetonitrile, water, MeOH:H2O (1:1), MeOH:H2O (1:2), the results of which are shown in Fig. 4 and Table 1.
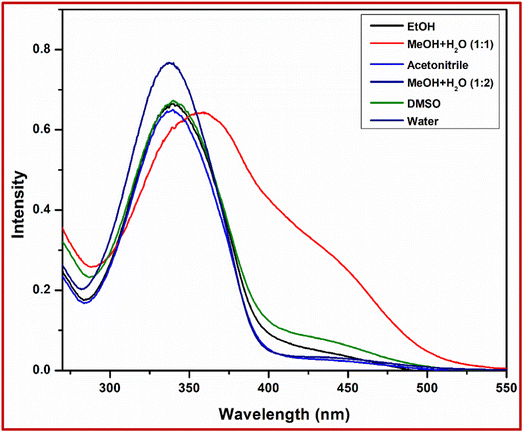 |
| | Fig. 4 Absorption spectra of L with different solvents and varied solvent concentration. | |
Table 1 Absorption properties of L in different solvents
| Solvent |
Absorption wavelength (nm) |
logε |
| DMSO |
338 |
4.72 |
| Acetonitrile |
340 |
4.6 |
| EtOH |
337 |
4.79 |
| MeOH:H2O (1:1) |
357 |
4.7 |
| MeOH:H2O (1:2) |
345 |
4.88 |
| Water |
340 |
4.75 |
Upon the addition of 2 equiv. of Pb2+ to L, the absorption band at 345 nm gradually decreased and a new absorption band appeared at 300 nm. A clear isosbestic point at 317 nm indicated the formation of only one complex species between L and Pb2+ (Fig. 5). The molar extinction coefficient of the new peak at 300 nm is 14.5 × 10³ M−1 cm−1, which is too large for Pb-based d–d transitions and thus must correspond to metal–ligand transitions. As there are blue shifts in the absorption spectra of Pb2+ with the chromophore L, there are chances for ligand to metal charge transfer (LMCT) and formation of a complex between the receptor L and Pb2+. The colorimetric detection limit obtained from the titration curves was found to be 1.0 × 10⁻⁹ M for Pb2+ ions (Fig. 6), which is far below the WHO guidelines for drinking water. Thus, the chemosensor L can be applicable as a visual colorimetric probe towards Pb2+ at physiological conditions.
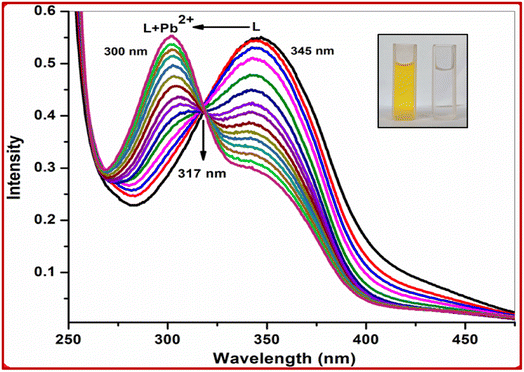 |
| | Fig. 5 UV-visible titration of L with Pb2+ in CH3OH–H2O (1:2). Inset: colour change of L on addition of 2 equiv. of Pb2+. | |
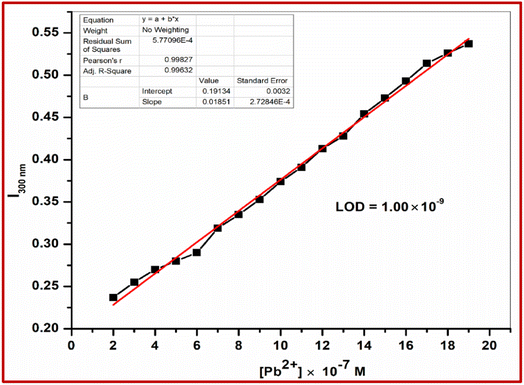 |
| | Fig. 6 Detection limit for Pb2+ from absorption spectra in CH3OH–H2O (1:2). | |
One of the important features of a chemosensor is its high selectivity towards metal ions and resistance to other interfering ions. To evaluate the selectivity of the receptor for the detection of Pb2+ ions, UV-visible spectra were obtained for the receptor L in the presence of a series of ions: Al3+, Cu2+, Cd2+, Hg2+, Zn2+, Co2+, Ni2+, Mn2+, Cr3+, Fe3+ and Ag+ (Fig. 7). The intensity of the absorption band formed at 300 nm due to the formation of L–M2+ complex was not at all disturbed by the presence of other metal ions simultaneously in the solution. The colour intensity somewhat decreases only due to dilution effects. The other metals do not interfere with the fluorescence enhancement process. Thus, the predicted chemosensor L has selectivity towards Pb2+ ions even in the presence of 3-fold higher concentration of background ions.
 |
| | Fig. 7 Absorbance competitive experiment of L with other metal ions (where 1 = L, 2 = Fe3+, 3 = Cr3+, 4 = Ni2+, 5 = Cd2+, 6 = Ni2+, 7 = Zn2+, 8 = Pb2+, 9 = Ag+, 10 = Al3+, 11 = Mn2+ and 12 = Hg2+). Wavelength was monitored at 300 nm. | |
3.3 Determination of stability constant
From UV-visible spectral changes, the binding constants for the formation of the respective complexes were evaluated using the Benesi–Hildebrand (B–H) plot, eqn (1):| | |
log {(A − A0)/(Am − A)} = nlog [M] + logK
| (1) |
where A0 is the absorbance of free L at a particular wavelength and A is the observed absorbance at that wavelength in any intermediate metal ion concentration (C). Am is the absorption intensity value that was obtained in the presence of metal ion at saturation.
Assuming 1:2 interaction of L with Pb2+, the binding constant (K) has been determined from the intercept of the linear plot (Fig. 8), which is found to be K = 2.0 × 10⁷ M1/2.
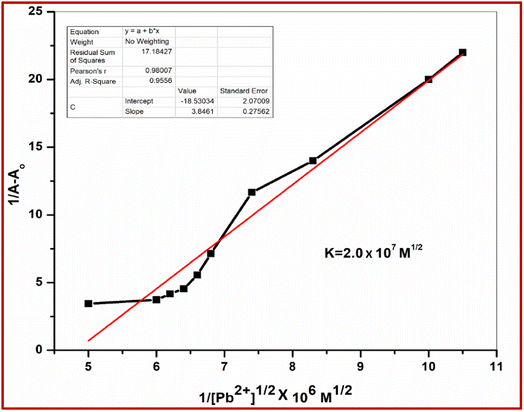 |
| | Fig. 8 Binding constants of L–Pb2+ complex. | |
3.4 Stoichiometric measurements
Job's continuous variation method was used to determine the stoichiometry of the receptor for Pb2+ ions at a wavelength of 300 nm. The resulting curves showed a maximum at 0.62 mole fractions for Pb2+ ions indicating 1:2 complex formation between L and metal (Fig. S5†). In addition, the formation of the 1:2 complexations for L–Pb2+ was confirmed by ESI-mass spectrometry (Fig. 9). The positive-ion mass spectrum of L + Pb2+ showed that the peak at m/z = 1161.7595 was assignable to [L + 2Pb2+ + 4H2O] (Fig. S6†).
 |
| | Fig. 9 Reversibility study of L complex with Na2 EDTA. | |
3.5 pH effect
The pH effects on the sensing process were also investigated, which showed that the chemosensor L is effective in a wide pH range from 6 to 13 for Pb2+ ion detection (Fig. S7†). At strongly acidic conditions (pH < 4) there exists a strong competition between H+ ions and metal ions as well as the possibility of imine >CN bond breaking, leading to inhibition of coordination ability. However, in basic solution (pH > 7) the absorption intensity of the L–Pb2+ complex around 300 nm was significantly lower as the un-protonated ionic substance can readily coordinate with Pb2+ ions.
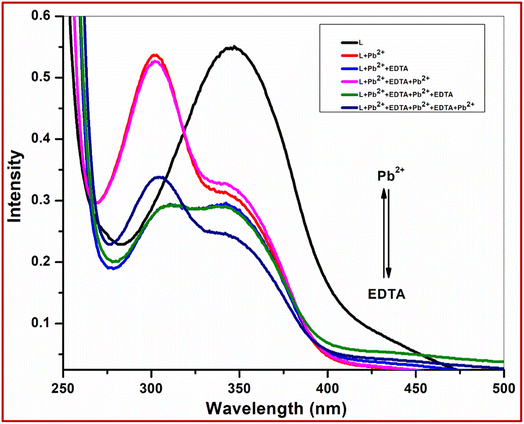
3.6 Reversibility
The reversibility of chemosensor L has been investigated by using the common metal chelator disodium ethylenediaminetetraacetic acid (Na2 EDTA). The absorption bands around 300 nm along with colourless solution of host–guest complex immediately turning yellow with the appearance of the original absorption band at 345 nm of L were observed when L + Pb2+ complex was treated with 2 equiv. of strong chelator Na2EDTA (Fig. 9). With repeated addition of Pb2+ ions, the colour change and spectral change almost recovered. The switching behavior between L and L + Pb2+ complexes was systematic even after 3 cycles with the alternating addition of chelator and analyte (Fig. S8†).
3.7 Fluorescence studies of L toward different metal cations
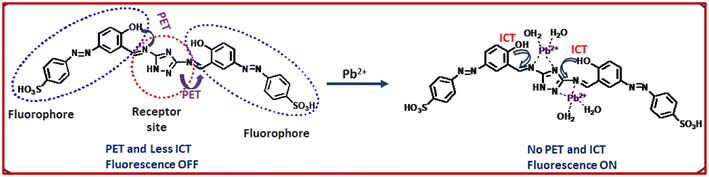
The fluorescence behaviours of receptor L towards various metal ions (Al3+, Cu2+, Cd2+, Hg2+, Zn2+, Co2+, Ni2+, Mn2+, Cr3+, Fe3+ and Ag+) were investigated in methanol–water (1/2, v/v). Upon excitation at 310 nm at room temperature, L exhibits little emission at 417 nm with a low fluorescence quantum yield (Φ = 0.015) with sky-blue coloration under a UV lamp. The low fluorescence intensity of L can be ascribed to the photoinduced electron transfer (PET) process and >CN isomerization. However, the addition of nitrate salt of Pb2+ resulted in an immediate 8-fold enhancement of fluorescence intensity at 417 nm (Fig. 10). Other metal ions do not increase the fluorescence quantum yield. This is because of the fact that the presence of Pb2+ ions causes PET blocking through selective coordination to Pb2+ with the inner imino nitrogen atoms of the probe L (Scheme 2). In addition to the stable chelate formation of Pb2+ with L, the rigidity of the resulting complex is increased thereby generating efficient chelation-enhanced fluorescence.30,31 These results clearly point to the receptor L being a selective sensor for Pb2+.
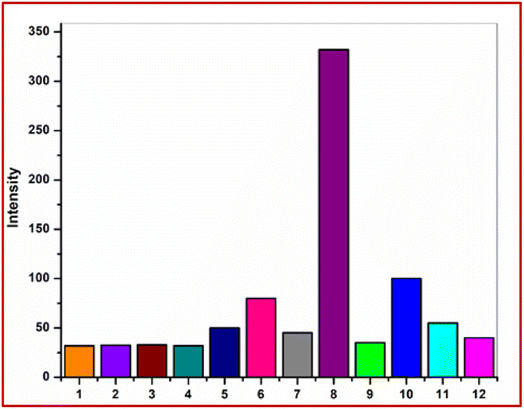 |
| | Fig. 10 Fluorescence study of L with different metal ions in CH3OH–H2O (1:2) on excitation at 310 nm and emission maxima at 417 nm (where 1 = L, 2 = Fe3+, 3 = Cr3+, 4 = Ni2+, 5 = Cd2+, 6 = Ni2+, 7 = Zn2+, 8 = Pb2+, 9 = Ag+, 10 = Al3+, 11 = Mn2+ and 12 = Hg2+). | |
 |
| | Scheme 2 Proposed sensing mechanism of L. | |
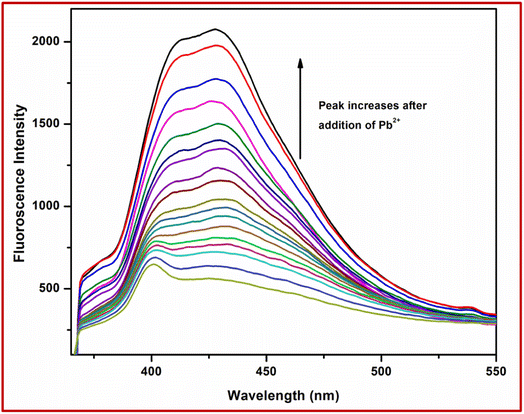
3.8 Fluorescence titration
Sensitivity is an important criterion for the fluorescence sensor. To study the sensitivity of the receptor L with respect to Pb2+, the probe L was titrated with Pb2+ ions. Upon gradual addition of Pb2+, the fluorescence intensity increased gradually. The fluorescence changes of L upon addition of Pb2+ are shown in Fig. 11. From this titration profile it is observed that saturation is achieved after 4–5 equiv. addition of Pb2+ ions.
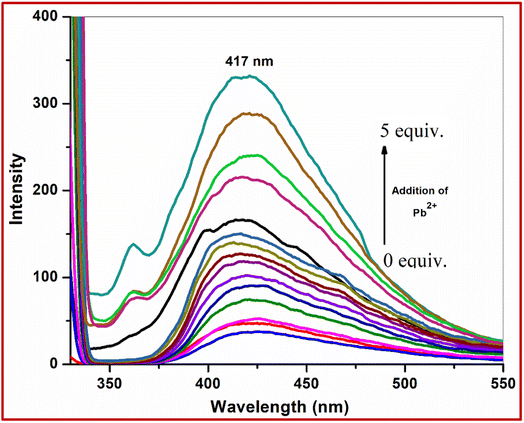 |
| | Fig. 11 Fluorescence titration of L with different concentrations of metal ions in CH3OH–H2O (1:2) on excitation at 310 nm. | |
The fluorometric detection limit obtained from the titration curves was found to be 0.53 × 10⁻⁹ M for Pb2+ ions and the R-square value was 0.994 (Fig. 12). This detection limit was below the colorimetric detection limit. It is concluded that the fluorometric detection with the probe shows higher sensitivity. Thus, the chemosensor L can be applicable as a visual colorimetric and fluorometric probe towards Pb2+ at physiological conditions.
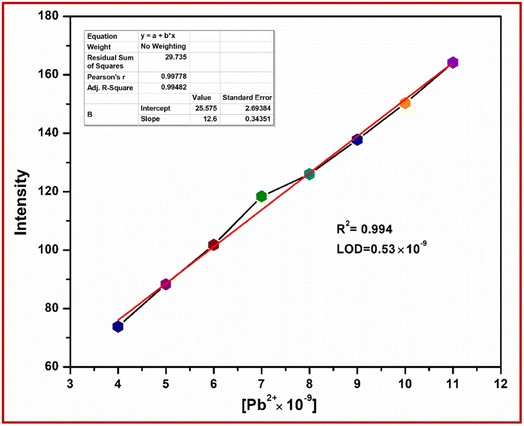 |
| | Fig. 12 Detection limit for Pb2+ from emission spectra in CH3OH–H2O (1:2). | |
3.9 Fluorescence interference study
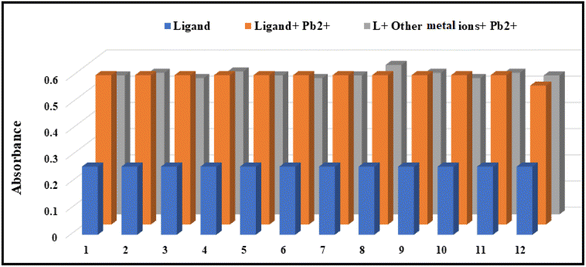
To examine the selectivity of the receptor L for the detection of Pb2+ ions, we measured the fluorescence spectra of the ligand L, L + Pb2+ ions, and L + Pb2+ ions + other metal ions (Fig. 13) and observed that the fluorescence intensity of L–Pb2+ adduct is not altered in the presence of other metal ions.
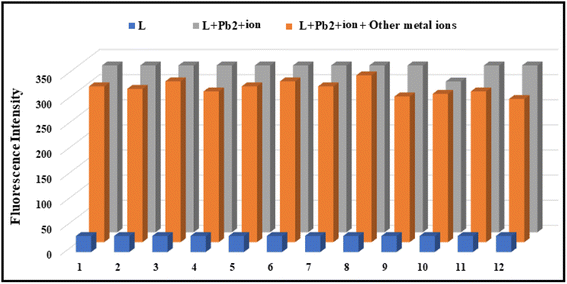 |
| | Fig. 13 Fluorescence interference study of L (where 1 = L, 2 = Fe3+, 3 = Cr3+, 4 = Ni2+, 5 = Cd2+, 6 = Ni2+, 7 = Zn2+, 8 = Pb2+, 9 = Ag+, 10 = Al3+, 11 = Mn2+ and 12 = Hg2+). Excitation wavelength was 340 nm and emission maxima were at 417 nm. | |
3.10 Sensing mechanism of the probe L
The coordination sites of the proposed receptor towards selected guest Pb2+ were investigated by 1H NMR spectral studies (Fig. S9†). The chemical shift at δ = 11.62 ppm due to triazole –NH in free receptor L shifted upfield with the addition of 2 equiv. Pb2+ ions. Also, the azomethine proton signal shifted to the upfield region (from δ = 9.82 ppm to δ = 9.1 ppm), which confirmed the participation of imine in complexation. These upfield shifts are due to the chelation-induced internal charge transfer (ICT) process. This 1H NMR behaviour of L was consistent even in the presence of 2-fold higher concentration of the analytes.
The FTIR spectra of L and its Pb(II) complexes are shown in Fig. S10.† The IR spectrum of free ligand L showed a broad band centred around 1616 cm−1 which is due to CN groups of imine moiety and triazole. In the spectrum of the Pb2+ complex, these bands shifted towards lower wavenumbers to 1597 cm−1 which suggests that the azomethine group is involved in the coordination of both the metal ions to the ligand L. Further, the other peaks due to –NH and –CH groups of ligand L became small and shifted towards lower wavenumbers.
Metal sensing is primarily due to analyte recognition to binding site and signal transduction mechanism. The imine-attached triazole moiety contains multiple pockets suitable for metal coordination whereas the phenol containing two azine units act as a signalling sub-unit. Starting from absorption spectra, strong blue shift of absorption gives an indication for complexation at the acceptor site which enhances the ICT process in the ground state, allowing colorimetric sensing, and in the excited state both the PET and ICT effects were responsible for fluorometric sensing. The binding mechanism is shown in Scheme 2.
3.11 Real sample analysis
The chemosensor L was utilized successfully in the recognition of Pb2+ ions in different water samples. For this purpose, Pb2+ ion-contaminated samples were prepared individually through spiking different known concentration levels. Then, their concentrations were analysed with the sensing system described above. The experiment was repeated 3 times and a good recovery with very low standard deviation was observed. The results are presented in Table 2.
Table 2 Determination of Pb2+ ions in different water samples
| Metal ion |
Spiked amount (μM) |
Recovered amount (μM) |
% Recovery ± D (n = 3) |
| Pb2+ |
5.00 |
5.06 |
101.6 ± 0.4 |
| 10.00 |
9.97 |
99.7 ± 0.62 |
| 20.00 |
19.95 |
98.2 ± 2.62 |
3.12 Analysis of biological samples by the chemosensor L
In order to check the potential of the chemosensor L for biological samples, the probe L of conc. 10 μM was successfully exploited for the recognition of Pb2+ in aqueous solution of bovine serum albumin (BSA) protein by fluorometry. Upon the addition of Pb2+, the fluorescence intensity was increased in BSA medium. An almost one-hundredth increase in emission intensity was observed in the case of Pb2+ (Fig. 14).
 |
| | Fig. 14 Fluorescence spectra of L in the presence of 3 equiv. of Pb2+ in aqueous bovine serum albumin medium. | |
3.13 Molecular docking studies
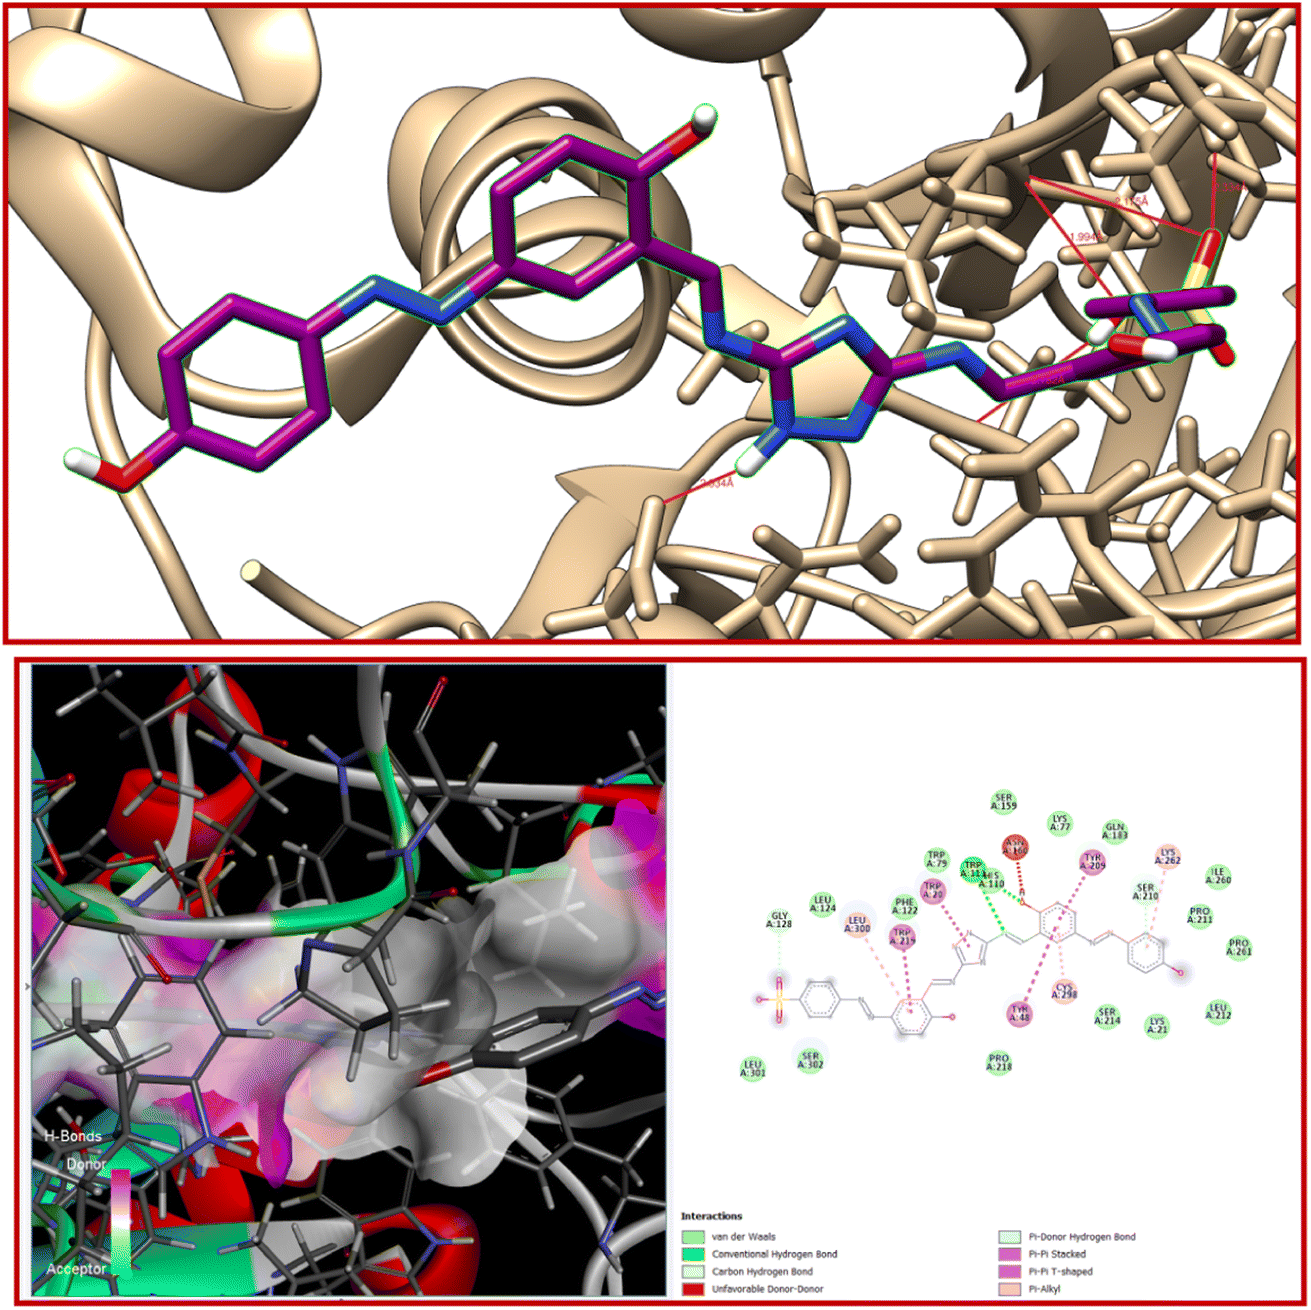
Triazole derivatives possess a wide range of biological properties like antioxidant, anti-inflammatory, antibacterial, antiviral, antimalarial, etc. Molecular docking studies were carried out to reveal the biological properties and binding mode at the active site of proteins. In order to find the best position to dock our ligand32 L, we first used Swiss ADME target prediction utilising a database from the protein database (RCSB PDB). After that, we used Chimera 1.14 to minimise the structure.33 The probe L had no trouble docking with the oxidoreductase protein 1USO. The lowest binding energy, −11.6 kcal mol−1, indicates that this is biologically active. The bound residue of 1USO and the ligand are separated by hydrogen bonds with distances of 2.034, 2.182, 1.994, 2.175 and 2.334 Å. The molecule shows strong bioactivity as concluded from its low binding energy score. Finding the H-bond distance between the residue and the ligand (compound) shows that this ligand is appropriate for use with a protein receptor (Table 3).34 Different interactions in 2D molecular docking diagrams (using Discovery studio tool) are clearly demonstrated in Fig. 15.
Table 3 Hydrogen bonding and molecular docking with centromere associated protein inhibitor protein targets
| Protein (PDB ID) |
No. of residues |
Bond distance (Å) |
Inhibition constant (micromolar) |
Binding energy (kcal mol−1) |
Reference RMSD (Å) |
| 1USO |
3 |
2.034 |
0.0031 |
−11.6 |
24.591 |
| |
|
2.182 |
|
|
|
| |
|
1.994 |
|
|
|
| |
|
2.175 |
|
|
|
| |
|
2.334 |
|
|
|
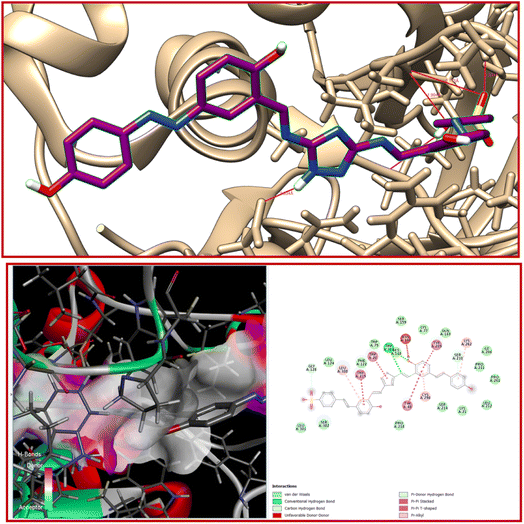 |
| | Fig. 15 Interaction of L with oxidoreductase protein 1USO. | |
3.14 Comparison of L with other previously reported chemosensors for Pb2+ ions
As part of our ongoing effort for providing useful analytical techniques to monitor the increasing number of analytes of environmental relevance as quickly and as cheaply as possible and with the highest sensitivity, the present paper describes the synthesis of a new fluorescent-colorimetric probe L, which was validated for detection and quantification of Pb2+ ions in aqueous–methanol medium.
There are several reports where a few Schiff base, macrocyclic and bodipy compounds have been utilized for the selective detection of Pb2+ ions. The probe L was compared with those reported chemosensors (Table 4). While each of the other chemosensors showed some advantages such as high sensitivity and selectivity, the important features of the fluorescent-colorimetric chemosensor L are easy, practical and cost-effective synthesis and naked-eye detection as well as high sensitivity and selectivity.
Table 4 Comparison of some previously reported chemosensors for Pb2+ ions
| Structure of probe |
Solvent/medium |
Sensing method |
Binding constant |
LOD |
Ref. |
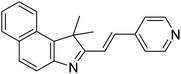
 |
CH2Cl2–MeOH (1:1) |
Both colorimetric and fluorescent |
2.1 × 10⁴ |
3.1 × 10⁻⁷ M for Pb2+ |
35 |
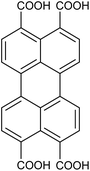
 |
CH2Cl2–MeOH (3:2) |
Both chromogenic and fluorogenic |
3.4 × 10⁴ |
2.6 × 10⁻¹³ M for Cu2+ |
36 |
| 1.3 × 10⁻¹¹ M for Pb2+ |
 |
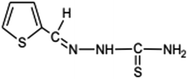
CH3CN–water mixture (9:1, v/v) |
Fluorescent sensor |
Not available |
1.24 μM for Cu2+ |
37 |
| 3.41 μM for Pb2+ |
 |
Aqueous solution |
Both colorimetric and fluorescent |
Not available |
Not available |
38 |
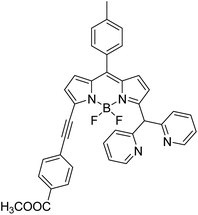 |
CH3CN |
Colorimetric and fluorescent chemosensor |
5.01 × 10⁵ |
0.14 μM |
39 |
 |
PVC:DOP:LL2:NaTPB |
Potentiometric |
|
1.0 × 10⁻⁷ M |
40 |
 |
CH3OH-tris buffer (1:1, v/v) |
Colorimetric and fluorescent chemosensor |
9 × 10⁵ |
Colorimetric: 1.2 × 10⁻⁶; fluorometric: 9 × 10⁻⁷ M |
41 |
 |
MeOH–H2O |
Colorimetric and fluorescent chemosensor |
2 × 10⁷ |
Colorimetric: 1.0 × 10⁻⁹ M; fluorometric: 0.53 × 10⁻⁹ M |
Present work |
4. Conclusion
Herein, we report a perfectly water soluble novel bis-Schiff base simple colorimetric and turn-on fluorescence chemosensor L with a triazole moiety for the sensitive and selective detection of Pb2+ in CH3OH–water (1:2, v/v). In the presence of Pb2+ ions, L displayed good fluorescence characteristics with discernible colour change from yellow to colourless. To the best of our knowledge, there are several papers concerning fluorescence-enhanced probes for triazole-based cations, but only a few concerning reversible “off–on” fluorescent probes for the triazole-based detection of Pb2+ ions. Additionally, 1H-NMR, FTIR, and ESI-mass spectrometry were used to explore the sensing mechanism. The colorimetric detection limit for Pb2+ is 1.0 × 10⁻⁹ M. The chemosensor L shows its application potential in the detection of Pb2+ in BSA proteins and in real samples. Moreover, we have studied the molecular docking of the probe L.
Author contributions
Vanshika Sharma: conceptualization, methodology, investigation, formal analysis, visualization and writing – original draft. Sandhya Savita: theoretical calculations. Dr Goutam Kumar Patra: conceptualization, review, editing, funding acquisition and supervision.
Conflicts of interest
The authors declare no conflicts of interest.
Acknowledgements
G. K. P. would like to thank the Department of Science and Technology (SR/FST/CSI-264/2014 and EMR/2017/0001789) and Department of Biotechnology, Government of India, New Delhi for financial support.
References
- M. H. Mashhadizadeh, M. Pesteh, M. Talakesh, I. Sheikhshoaie, M. M. Ardakani and M. A. Karimi, Spectrochim. Acta, Part B, 2008, 63, 885–888 CrossRef.
- C. F. Harrington, S. A. Merson and T. M. D. D'Silva, Anal. Chim. Acta, 2004, 505, 247–254 CrossRef CAS.
- S. L. C. Ferreira, A. S. Queiroz, M. S. Fernandes and H. C. dos Santos, Spectrochim. Acta, Part B, 2002, 57, 1939–1950 CrossRef.
- R. N. Goyal, V. K. Gupta and S. Chatterjee, Sens. Actuators, B, 2010, 149, 252–258 CrossRef CAS.
- R. Kumar, V. Bhalla and M. Kumar, Dalton Trans., 2013, 42, 8808–8814 RSC.
-
(a) Y. Li and A. H. Flood, Angew. Chem., Int. Ed., 2008, 47, 2649–2652 CrossRef CAS PubMed;
(b) Y. Li and A. H. Flood, J. Am. Chem. Soc., 2008, 130, 12111–12122 CrossRef CAS PubMed.
- D. Wang, J. Q. Zheng, X. Yan, X. J. Zheng and L. P. Jin, RSC Adv., 2015, 5, 64756–64762 RSC.
- J. Liu, M. Yu, X. C. Wang and Z. Zhang, Spectrochim. Acta, 2012, A93, 245–249 CrossRef PubMed.
- X. Zhou, S. Lee, Z. Xu and J. Yoon, Chem. Rev., 2015, 115, 7944–8000 CrossRef CAS PubMed.
- A. K. Manna, M. Sahu, K. Rout, U. K. Das and G. K. Patra, Microchem. J., 2020, 157, 104860 CrossRef CAS.
- Y. Erel, T. Axelrod, A. Veron, Y. Mahrer, P. Katsafados and U. Dayan, Environ. Sci. Technol., 2002, 36, 3230 CrossRef CAS PubMed.
-
(a) C. B. Swearingen, D. Wernette, P. D. M. Cropek, Y. Lu, J. V. Sweedler and P. W. Bohn, Anal. Chem., 2005, 77, 442 CrossRef CAS PubMed;
(b) J. Li and Y. Lu, J. Am. Chem. Soc., 2000, 122, 10466 CrossRef CAS;
(c) D. W. Domaille, E. L. Que and C. J. Chang, Nat. Chem. Biol., 2008, 4, 168 CrossRef CAS PubMed.
- L. Bonin, V. Vitry and F. Delaunois, Sustainable Mater. Technol., 2020, 23, e00130 CrossRef CAS.
- L. D. Grant, Lead and compounds, in Environmental Toxicants: Human Exposures and Their Health Effects, 2020, pp. 627–675 Search PubMed.
-
(a) Y. Xiao, A. A. Rowe and K. W. Plaxco, J. Am. Chem. Soc., 2007, 129, 262 CrossRef CAS PubMed;
(b) F. Chai, C. Wang, T. Wang, L. Li and Z. Su, ACS Appl. Mater. Interfaces, 2010, 2, 1466 CrossRef CAS PubMed.
- A. Ghorai, J. Mondal, R. Saha, S. Bhattcharya and G. K. Patra, Anal. Methods, 2016, 8, 2032–2040 RSC.
- J. K. Fawell, Guidelines for Drinking Water Quality, World Organization, Geneva, 2nd edn, 1996, vol. 2, pp. 940–1033 Search PubMed.
- S. Menati, A. Azadbakht, R. Azadbakht, A. Taeb and A. Kakanejadifard, Dyes Pigm., 2013, 98, 499–506 CrossRef CAS.
- A. Mohammadi, Z. Dehghana, M. Rassa and N. Chaibakhsh, Sens. Actuators, B, 2016, 230, 388–397 CrossRef CAS.
- A. K. Manna, J. Mondal, R. Chandra, K. Rout and G. K. Patra, Anal. Methods, 2018, 10, 2317 RSC.
- M. Sahu, A. K. Manna and S. Chowdhaury, RSC Adv., 2020, 10, 44860 RSC.
- M. Sahu, A. K. Manna and G. K. Patra, Mater. Adv., 2022, 3, 2495 RSC.
- V. Sharma, M. Sahu, A. K. Manna, D. De and G. K. Patra, RSC Adv., 2022, 12, 34226–34235 RSC.
- A. Ghorai, J. Mondal, A. K. Manna, S. Chowdhury and G. K. Patra, Anal. Methods, 2018, 10, 1063–1073 RSC.
- A. Ghorai, J. Mondal and G. K. Patra, J. Mol. Struct., 2015, 1097, 52–60 CrossRef CAS.
- A. Mohammadi, M. R. Yazdanbakhsh and L. Farahnak, Spectrochim. Acta, A, 2012, 89, 238 CrossRef CAS PubMed.
- M. J. Frisch, G. W. Trucks, H. B. Schlegel, G. E. Scuseria, M. A. Robb, J. R. Cheeseman, G. Scalmani, V. Barone, B. Mennucci, G. A. Petersson, H. Nakatsuji, M. Caricato, X. Li, H. P. Hratchian, A. F. Izmaylov, J. Bloino, G. Zheng, J. L. Sonnenberg, M. Hada, M. Ehara, K. Toyota, R. Fukuda, J. Hasegawa, M. Ishida, T. Nakajima, Y. Honda, O. Kitao, H. Nakai, T. Vreven, J. A. Montgomery Jr, J. E. Peralta, F. Ogliaro, M. Bearpark, J. J. Heyd, E. Brothers, K. N. Kudin, V. N. Staroverov, R. Kobayashi, J. Normand, K. Raghavachari, A. Rendel, J. C. Burant, S. S. Iyengar, J. Tomasi, M. Cossi, N. Rega, J. M. Millam, M. Klene, J. E. Knox, J. B. Cross, V. Bakken, C. Adamo, J. Jaramillo, R. Gomperts, R. E. Stratmann, O. Yazyev, A. J. Austin, R. Cammi, C. Pomelli, J. W. Ochterski, R. L. Martin, K. Morokuma, V. G. Zakrzewski, G. A. Voth, P. Salvador, J. J. Dannenberg., S. Dapprich, A. D. Daniels, Ö. Farkas, J. B. Foresman, J. V. Ortiz, J. Cioslowski and D. J. Fox, Gaussian 09, Revision C.01, Gaussian Inc., Wallingford, CT, 2009 Search PubMed.
-
(a) A. D. Becke, J. Chem. Phys., 1993, 98, 5648 CrossRef CAS;
(b) C. Lee, W. Yang and R. G. Parr, Phys. Rev. B: Condens. Matter Mater. Phys., 1988, 37, 785 CrossRef CAS PubMed.
- A. K. Manna, J. Mondal, K. Rout and G. K. Patra, Sens. Actuators, B, 2018, 275, 350–358 CrossRef CAS.
- P. Venkatesan, N. Thirumalivasan and S. P. Wu, RSC Adv., 2017, 7, 21733–21739 RSC.
- V. Sharma, B. Sahu, U. K. Das and G. K. Patra, Inorg. Chim. Acta, 2023, 552, 121491 CrossRef CAS.
- S. Savita, A. Fatima, K. Garima, K. Pooja, I. Verma, N. Siddiqui and S. Javed, J. Mol. Struct., 2021, 1243, 130932 CrossRef CAS.
- E. F. Pettersen, T. D. Goddard, C. C. Huang, G. S. Couch, D. M. greenblatt, E. C. meng and T. E. Ferrin, J. Com. Chem., 2004, 25, 1605–1612 CrossRef CAS PubMed.
- N. Singh, A. Fatima, M. Singh, M. Kumar, I. Verma, S. Muthu, N. Siddiqui and S. Javed, J. Mol. Liquids, 2022, 351, 118670 CrossRef CAS.
- Y. Chen and J. Jiang, Org. Biomol. Chem., 2012, 10, 4782 RSC.
- Y. Chen and K. Wang, Photochem. Photobiol. Sci., 2013, 12, 2001 CrossRef CAS.
- X. Yang, W. Zeng, L. Wang, X. Lu, Y. Yan, J. Qu and R. Liu, RSC Adv., 2014, 4, 22613 RSC.
- S. Sowmiyha, V. Kumar, J. Pitchaimani, V. Madhu, R. Thiagarajan, N. S. Subramanian and S. P. Anthony, J. Lumin., 2018, 203, 42 CrossRef CAS.
- Z. Gu, H. Cheng, X. Shen, T. He, K. Jiang, H. Qiu, Q. Zhang and S. Yin, Spectrochim. Acta, Part A, 2018, 203, 315 CrossRef CAS PubMed.
- C. Mohan, K. Sharma and S. Chandra, Anal. Bioanal. Electrochem., 2022, 14, 860–870 CAS.
- K. Rout, A. K. Manna, M. Sahu, J. Mondal, S. K. Singh and G. K. Patra, RSC Adv., 2019, 9, 25919–25931 RSC.
|
| This journal is © The Royal Society of Chemistry 2024 |
Click here to see how this site uses Cookies. View our privacy policy here. 
 Open Access Article
 This Open Access Article is licensed under a Creative Commons Attribution-Non Commercial 3.0 Unported Licence
 and
Goutam Kumar Patra
and
Goutam Kumar Patra