 Open Access Article
Creative Commons Attribution 3.0 Unported Licence
2,4,5-Triaminopyrimidines as blue fluorescent probes for cell viability monitoring: synthesis, photophysical properties, and microscopy applications†
Jorge M.
Gonçalves
ab,
João N. D.
Gonçalves
 ac,
Luís F.
Sousa
ab,
Lígia R.
Rodrigues
 de,
Paulo
Correia-de-Sá
 f,
Paulo J. G.
Coutinho
 b,
Elisabete M. S.
Castanheira
 b,
Rui
Oliveira
 c and
Alice M.
Dias
 *a
*a
aCQ-UM — Centre of Chemistry of University of Minho, Department of Chemistry, University of Minho, Campus de Gualtar, 4710-057 Braga, Portugal. E-mail: ad@quimica.uminho.pt
bCF-UM-UP — Physics Centre of Minho and Porto Universities and LaPMET (Laboratory of Physics for Materials and Emergent Technologies), Campus de Gualtar, 4710-057, Braga, Portugal
cCBMA — Centre of Molecular and Environmental Biology, Department of Biology, University of Minho, Campus de Gualtar, 4710-057, Braga, Portugal
dCEB — Centre of Biological Engineering, Department of Biological Engineering, University of Minho, Campus de Gualtar, 4710-057, Braga, Portugal
eLABBELS – Associate Laboratory, Guimarães, Braga, Portugal
fLaboratório de Farmacologia e Neurobiologia, Center for Drug Discovery and Innovative Medicines (MedInUP), Instituto de Ciências Biomédicas de Abel Salazar, Universidade do Porto, R. Jorge Viterbo Ferreira, 228, 4050-313 Porto, Portugal
First published on 15th February 2024
Abstract
Monitoring cell viability is critical in cell biology, pathology, and drug discovery. Most cell viability assays are cell-destructive, time-consuming, expensive, and/or hazardous. Herein, we present a series of newly synthesized 2,4,5-triaminopyrimidine derivatives able to discriminate between live and dead cells. To our knowledge, these compounds are the first fluorescent nucleobase analogues (FNAs) with cell viability monitoring potential. These new fluorescent molecules are synthesized using highly efficient and cost-effective methods and feature unprecedented photophysical properties (longer absorption and emission wavelengths, environment-sensitive emission, and unprecedented brightness within FNAs). Using a live–dead Saccharomyces cerevisiae cell and theoretical assays, the fluorescent 2,4,5-triaminopyrimidine derivatives were found to specifically accumulate inside dead cells by interacting with dsDNA grooves, thus paving the way for the emergence of novel and safe fluorescent cell viability markers emitting in the blue region. As the majority of commercially available viability dyes emit in the green to red region of the visible spectrum, these novel markers might be useful to meet the needs of blue markers for co-staining combinations.
1. Introduction
Small-molecule fluorescent probes have been extensively used for monitoring cell viability. Cell viability assays are critical for multiple studies in cell biology, pathology, and drug discovery, which span from antimicrobial research to disease pathophysiology and pharmacological drug development. Live–dead assays often use time-consuming cell-unrecoverable colorimetric reagents (e.g. MTT, XTT, and WST). In this regard, fluorescence imaging techniques are advantageous compared to the colorimetric ones, since they offer fast, highly sensitive and non-destructive alternatives, also allowing real-time in situ observations.1 Countless fluorescent probes for cell viability (FPCV) assays have been developed; these are designed to detect changes in specific intracellular components and/or the physicochemical properties associated with cell death.2 Despite these advantages, FPCVs exhibit complex molecular structures, which are often difficult to synthesize and may cause significant photodamage to the cell.3 FPCVs are also unable to distinguish different cell stages.4 Hence, the development of highly sensitive red-shifted biocompatible FPCVs acting through different mechanisms is of utmost importance in several research settings, for instance, to deepen our understanding of the pathophysiological mechanisms of cell death and to develop and screen new drugs.Fluorescent nucleoside analogues (FNAs) have multiple applications in biochemical research,5,6 which include their emerging roles as microenvironmental-specific bioimaging probes. Major hurdles concern the synthesis efficiency of fluorescent nucleobases, mostly due to the presence of multiple reactive functional groups.7,8 The synthetic design is even more challenging when optimal photophysical properties and/or intramolecular charge transfer characteristics towards microenvironment sensitivity are needed for live-cell imaging.9–11 Chemical modifications to generate FNAs normally involve decorating commercial pyrimidines and purines with bulky and highly conjugated groups at C-2 or C-8, respectively, through cross-coupling condensation reactions.12 The main constraints of FNAs for efficient and environmentally safe syntheses include the use of costly precursors and hazardous metal catalysts. The undesirable group-size effects have also limited nucleobase pairing and target recognition. Most FNAs developed so far exhibit near-UV emission and/or smaller Stokes shifts, which limit their use in live-cell fluorescence microscopy.6,9 To the best of our knowledge, FNAs are rarely considered for live-cell viability assays, mostly due to their inadequate photophysical properties.
Due to the wide distribution of pyrimidines in natural products and functional materials, and their remarkable biological and pharmacological significance, a variety of methods for the synthesis of these molecules have been reported over the past few decades.13 To obtain 2- or 4-amino, and 2,4- or 4,6-diaminopyrimidines, which are privileged structures in drug development, preferred methods involved the amination of the corresponding 2,4(4,6)-dihalopyrimidines by direct substitution with primary and secondary amines via SNAr reactions.14,15 Nevertheless, the preparation of these halopyrimidine precursors from simple building blocks often involves the use of hazardous reagents/catalysts and harsh reaction conditions, also requiring multistep procedures. On the other hand, 4,5-diaminopyrimidines are the most versatile precursors for the synthesis of biologically relevant purines, pteridines and other bicyclic heterocycles. Yet, the synthesis of these less common diaminopyrimidines requires an additional incorporation of the 5-amino group, usually involving nitrosation or nitration at the 5-position by SEA followed by reduction reactions.16 An alternative approach, which is one of the oldest methods to obtain 4,5-diaminopyrimidines, is the opening of the ring of purine precursors at the C-8 position.17 Yet, this method generally demands the use of strong electrophiles to activate the N7-position for ring-opening and a basic medium to facilitate the cleavage of the formyl group. Ring-opening in the acidic medium had only been achieved for N7-substituted adenine derivatives, yielding the corresponding N5-substituted 4,5,6-triaminopyrimidines. Reports on the acid hydrolysis of N9-substituted purines to afford N5-substituted 4,5-diaminopyrimidines were not found, and attempts to obtain 2,4,5-triaminopyrimidines by the hydrolysis of 2-aminopurines at C-8 have been particularly difficult to achieve.18
Using efficient and cost-effective strategies, new N4-aryl 2,4,5-triaminopyrimidines with a cyano group at the C-6 position (4) were synthesized by our group from N4-aryl 2-amino-6-cyanopurines 2. These small-sized nucleobases exhibit excellent fluorescence properties with the highest quantum yields reported to date for this group of compounds, which are accompanied by outstanding Stokes shifts and environmental sensitivity. Preliminary microscopy tests and dsDNA interaction studies suggest that these molecules accumulate inside and specifically stain dead yeast cells, underpinning their putative use as a new class of cell viability markers emitting in the blue region of the visible spectrum. Strikingly, the majority of commercially available viability dyes emit in the green to red region of the visible spectrum, such as propidium iodide and SYBR Green I. Moreover, most fluorescent reporter constructs also encode for green to red fluorescent proteins such as GFP, YFP, and mCherry. This can be limiting to multiplex imaging due to the lack of combinations of contrasting colours which facilitate image analyses.19,20 In addition, good colour separation is essential for detecting multiple entities using different fluorophores, which is achieved by ensuring minimal spectral overlap. Since most commercially available fluorophores emit in the green to red region, blue-emitting dyes provide means for tackling spectral overlap issues in multispectral techniques, as emission spectral overlap is minimized, particularly with red-emitting fluorophores, such as in fluorescence microscopy and flow cytometry.21,22 Thus, the unique spectral properties of 2,4,5-triaminopyrimidines herein presented make them easily combinable with the most common green to red fluorescent markers. This enables new palettes of contrasting colour combinations which may be extremely useful for multicolour fluorescence imaging.
2. Results and discussion
2.1. Synthesis of 2,4,5-triaminopyrimidines
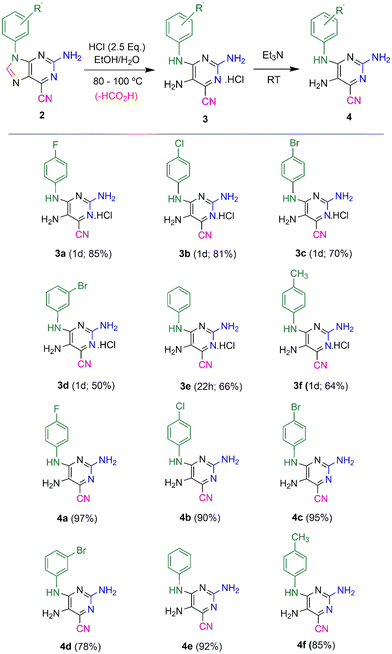
Previously, highly fluorescent 2-amino-6-cyanopurines 2 were synthesized through condensation reactions of imidazole precursors with cyanamide, followed by cyclization of key intermediates 1 (Scheme 1).23 Aiming to generate new fluorescent analogues, the reactivity of this new purine scaffold was investigated. Attempts to modify the 6-cyano group revealed that purines 2 with 9-aryl substituents undergo ring-opening of the imidazole moiety upon heating in acidic media, which generates new N4-substituted 2,4,5-triaminopyrimidines 3. To find the reaction conditions that favour ring-opening, preliminary tests involving the heating of cyanopurines 2 in ethanol and 12 M hydrochloric acid at 80 °C were conducted. After 1–5 days, mixtures of the desired product and the starting purines 2 were isolated, and no appreciable changes in the composition of the isolated mixtures, or in the reaction times, were detected when different amounts of acid (2.5–8.0 equivalents) were used. In contrast, increasing the reaction temperature up to 100 °C not only favoured the reaction rate, but also solved the problems of the limited solubility of the starting reagent 2. As it was observed that the lower the purine 2 solubility, the longer the time required for the completion of the reaction, certain starting reagents 2 required higher temperatures for reaction completion and/or the addition of a co-solvent with a higher boiling point (DMSO). Finally, the use of different amounts of acid under these conditions revealed that 2.5 equivalents was the optimum amount, regardless of the substituent. Based on these results, the hydrolysis of a series of 9-aryl 2-amino-6-cyanopurines 2 was achieved by stirring the starting reagents with 2.5 equivalents of 12 M hydrochloric acid in ethanol (or a mixture of ethanol/DMSO) at 80 or 100 °C for 1 day (Scheme 2). The products, isolated in 50-85% yields as green solids, were characterized by NMR spectroscopy and the obtained data enable their identification with the structures of HCl salts 3. Finally, thin layer chromatography (TLC) analysis revealed that these compounds exhibit intense blue-cyan fluorescence under UV light. After optimizing the conditions for the synthesis of salts 3, a neutralizing step of the isolated solids was also performed to characterize the neutral form and investigate the effect of protonation on the photophysical properties of this new group of compounds. For this purpose, compounds 3 were neutralized with triethylamine (2.5 equivalents) in acetonitrile, and their neutral forms were successfully isolated with 78–97% yields. TLC analysis of these solids also showed an intense blue fluorescent spot under UV light. | ||
| Scheme 1 (A) Previously developed pathway for the synthesis of 2-amino-6-cyanopurines 2 from imidazole precursors; (B) synthesis of the new 2,4,5-triaminopyrimidines 3–4 presented here. | ||
According to the proposed mechanism presented in Scheme 3, these reactions should start when hydrochloric acid protonates the N-7 nitrogen of the purine ring, as the C-8 carbon becomes susceptible to nucleophilic attack. The water present in the reaction mixture might attack the purine ring at this position, leading to the formation of a tetrahedral intermediate that undergoes the opening of the five-membered ring, thus generating a pyrimidine-based formamide intermediate. This formamide group is also sensitive to cleavage in an acidic medium by hydrolysis and elimination of one molecule of formic acid, leading to compounds 3.
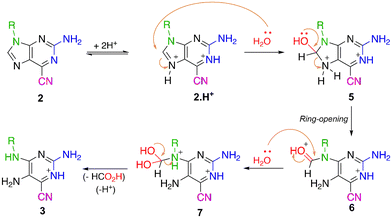 | ||
| Scheme 3 Proposed mechanism for the synthesis of 2,5-diaminopyrimidines 3 from 6-cyano-2-aminopurines 2. | ||
Full characterization of the new compounds by NMR (1H, 13C NMR, HSQC and HMBC techniques) and IR spectroscopy, and mass spectrometry are presented in Fig. S13–S36 (ESI†). The 1H NMR spectra of compound 3 indicate that the highest chemical shift signal was assigned to the NH group, which appears as a broad singlet at δ 9.9–10.8 ppm. Signals from the protons of the phenyl group appear as doublets or triplets, depending on the number of their neighbouring protons. Their chemical shifts vary in the region δ 6.9–7.9 ppm, according to the effect of the substituent group present on the benzene ring. In these spectra, it was not possible to observe the NH2 signals because the molecules were in their protonated form. Concerning compounds 4, it was observed that chemical shifts tend to lower values. For instance, the NH signal was observed at δ 9.7–10.7 ppm in the protonated form 3, which shifted towards δ 8.6–9.7 ppm in the neutral form, evidencing the absence of the positive charge in the molecule. In the 13C NMR spectra of compounds 3, the signals assigned to the pyrimidine carbons linked to the amino groups were recorded at δ 150 ppm (C-2), δ 130 ppm (C-5) and δ 153 ppm (C-6). A typical signal of the 6-nitrile group was observed at δ 112–113 ppm, thus confirming its presence in their structure. In compounds 4, it was verified that the corresponding signals tend to show higher chemical shift values when compared to compounds 3.
2.2. Photophysical characterization
The photophysical characterization of compounds 3 and 4 comprised the determination of the maximum absorption and emission wavelengths, Stokes shifts, fluorescence quantum yields and molar absorption coefficients (Tables S1–S4 and Fig. S37–S40, ESI†). Molar absorption coefficient values are very reasonable, in the range of 1–2.5 × 10⁴ M−1 cm−1 (or slightly below) and point to allowed transitions from the ground to the excited electronic state. Overall, both groups of compounds present low fluorescence quantum yields in protic solvents, due to solute–solvent hydrogen bonding. However, the yields are significantly higher in non-protic solvents. By comparing the neutral and protonated forms of these compounds, one can conclude that the emission quantum yield increases in the neutral form when non-protic solvents (e.g. dioxane and dichloromethane) are used, while it decreases in protic solvents, such as aqueous buffer solutions, which is particularly useful in microenvironment-monitoring applications.24 Considering absorption and emission wavelengths, some differences were detected when comparing compounds 3 and 4 (Fig. 1), from which the sensitivity differs with solvent polarity (Fig. S37–S40, ESI†).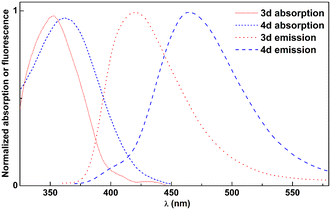 | ||
| Fig. 1 Normalized absorption and fluorescence spectra of 2.5 × 10⁻⁶ M solutions of compounds 3d and 4d in dioxane, as an example. | ||
Triaminopyrimidines reported here exhibit red-shifted absorption and emission maxima within FNAs due to their unique substituent patterns. The reported fluorescent pyrimidine analogues exhibit absorption in the region of 290–330 nm and emission in the region of 374–430 nm, whereas these newly prepared pyrimidines show absorption near 360 nm, emission near 470 nm, and large Stokes shifts (S = 83 nm in aqueous buffer and 108 nm in dioxane). In addition, they also exhibit very high fluorescence quantum yields (ΦF = 0.5–0.6 in dioxane) and brightness (some ε·ΦF values around 15![[thin space (1/6-em)]](https://www.rsc.org/images/entities/char_2009.gif) 000 M−1 cm−1) when compared with the two brightest reported pyrimidine analogues which presented brightness of ε·ΦF = 2000 M−1 cm−1 and 3800 M−1 cm−1.6,25
000 M−1 cm−1) when compared with the two brightest reported pyrimidine analogues which presented brightness of ε·ΦF = 2000 M−1 cm−1 and 3800 M−1 cm−1.6,25
2.3. Live–dead fluorescence cell assay and cytotoxicity test
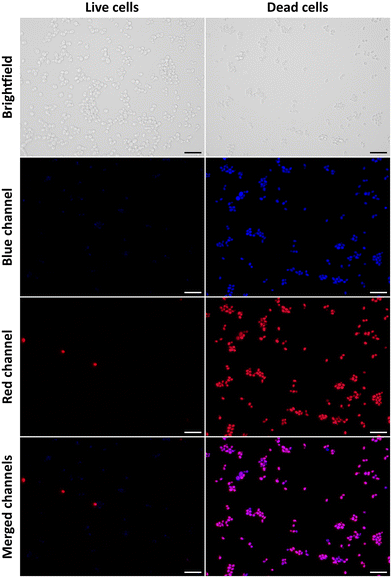
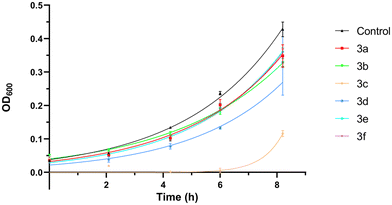
To assess the putative role of the novel 2,4,5-triaminopyrimidines as fluorescent cell viability probes, we used a live–dead yeast cell assay. To this end, cultures of the yeast Saccharomyces cerevisiae were co-stained with 2,4,5-triaminopyrimidines (blue channel) and propidium iodide (PI, red channel), used as a reference cell death marker. The results show that most living cells exclude signals detected in the blue fluorescence channel when the cells were incubated with compound 3d (Fig. 2). The same occurred for other 2,4,5-triaminopyrimidines (Fig. S43, ESI†). Few living cells, however, incorporate the red fluorescent probe corresponding to PI. The influx of PI through the membranes of living cells has been reported before.26,27 The fluorescence intensities of compounds 3b–3e dramatically increased in PI-positive dead yeast cells (Fig. 2 and Fig. S43, ESI†). Moreover, small dots were also found in dead cells treated with compounds 3b and 3e (Fig. S43, ESI†), and their nature is yet to be determined. Surprisingly, no significant increase in fluorescence was observed in live or dead yeast cells incubated with compounds 3a and 3f (not shown). Overall, data indicate that several novel 2,4,5-triaminopyrimidines can fluorescently label dead yeast cells, possibly with fewer false positives than the widely used cell-death indicator, PI.For the sake of cell viability assay validation, the new 2,4,5-triaminopyrimidines were also tested for cytotoxicity. The growth rates of S. cerevisiae cultures in the absence and the presence of 2,4,5-triaminopyrimidines were determined and the results show that most 2,4,5-triaminopyrimidines failed to affect yeast cell proliferation compared to control conditions without drug addition (Fig. 3, no statistically significant changes were detected, P value >0.05). The only exception was compound 3c, which extended the lag phase of the culture, indicating a toxic effect (Fig. 4).
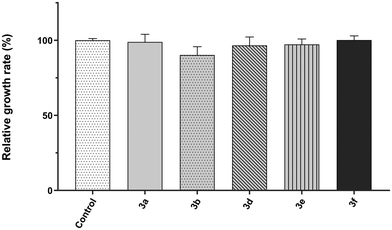 | ||
| Fig. 3 Relative growth rates of the Saccharomyces cerevisiae strain BY4741 incubated at 30 °C with 200 rpm in SD medium in the presence of 1% DMSO (control, solvent of the compounds) or 2,4,5-triaminopyrimidines 3 (3a, 3b, 3c, 3d, 3e or 3f). Growth was monitored by measuring the optical density at 600 nm, growth rates were calculated, and the mean relative growth percentages were determined taking the control as the reference. Data are presented as mean ± standard deviation from three independent replicas. Statistical analysis was performed through one-way ANOVA followed by Dunnett's multiple comparison test to compare with the control conditions and no statistically significant changes were detected (P value >0.05). The growth rate in the presence of compound 3c was not calculated due to a very prolonged lag phase (see Fig. 4). | ||
2.4. dsDNA interaction studies
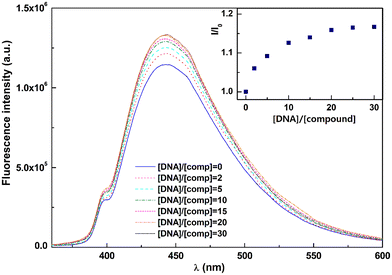
The fluorescence microscopy results prompted us to perform a dsDNA interaction assay with compound 4d through fluorescence (Fig. 5; see experimental details in the ESI†). The observed fluorescence intensity increases with higher DNA concentrations, reaching a limit value for [DNA]/[4d] ratios ≥30, indicating that total compound binding was achieved at this [DNA]/[4d] ratio. The binding constant and binding site size were determined using the modified Scatchard equation, given by McGhee and von Hippel28 (see the ESI†).The fluorescence measurement results were fitted by least squares methods, allowing us to obtain a reasonably high binding constant of Ki = (4.1 ± 0.5) × 105 M−1 and n = 5 ± 0.6. These results are similar to the ones previously obtained for other polycyclic aromatic molecules.29
To further investigate the interaction between compound 4d and dsDNA, i.e., through intercalation or groove binding, fluorescence quenching experiments with iodide ions were also performed for the solution with [DNA]/[4d] = 30 (Fig. 6). The quenching data were first plotted according to the Stern–Volmer relation (Fig. 6A).30 The Stern–Volmer plot is non-linear, exhibiting a downward curvature, which means that not all fluorescent molecules are accessible to the quencher. In this case, some compounds are accessible to the quencher and other molecules are not accessible and therefore the Stern–Volmer equation must be modified as described by others.31 The modified equation (see the ESI†) allows the determination of a 93% fraction of accessible molecules (fa = 0.93) (Fig. 6B). This would correspond to the percentage of non-intercalated molecules, with the major fraction of 4d possibly binding to DNA grooves.
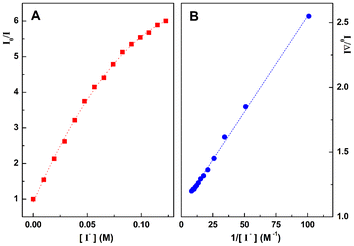 | ||
| Fig. 6 (A) Stern–Volmer plot for quenching with iodide ions. (B) The corresponding modified Stern–Volmer plot. | ||
The observed increase in fluorescence (Fig. 5) and the fluorescence microscopy results (Fig. 2) led us to conclude that the 2,4,5-triaminopyrimidines and PI may share the same staining mechanism through dsDNA binding after penetrating dead cells lacking the plasma membrane barrier. These results do not exclude the possibility that both DNA fluorescent dyes may enter living cells via regulated plasma membrane transport, but even after discounting this bias, the net influx into living cells should be considerably much lower compared to dead and/or dying cells. Taking this into account, the mechanisms underlying the putative transport of the new 2,4,5-triaminopyrimidines across the plasma membrane and their stability/compartmentalization inside living cells also remain to be determined, which might affect fluorescence signals.
2.5. Molecular docking
Further information on the binding preferences of the studied compounds with dsDNA can be obtained through molecular docking simulations using Autodock4,32 as used in other published works.33,34 The crystallographic structures of a native dsDNA dodecamer (PDB ID 1hq7), proflavine (profl.) intercalated in a dsDNA hexamer (PDB ID 3 ft6) and a diamidine derivative (X8 V) groove-bound to a dsDNA dodecamer (PDB ID 7kwk) were used in docking studies by keeping only the polynucleotide structure.Table 1 shows the obtained results for compounds in the protonated form 3a–f and in the neutral form 4a–f, and for the ligands that were removed from the starting crystallographic structures. The latter cases allow the validation of the docking procedure effectiveness and provide reference values for comparison with the studied compounds. Additionally, propidium iodide (PI), a well-known DNA intercalator, was also docked into 3 ft6.
| dsDNA | 3ft6 | 7kwk | 1hq7 | |||
|---|---|---|---|---|---|---|
| Cpd. | 3 (protonated) | 4 (neutral) | 3 (protonated) | 4 (neutral) | 3 (protonated) | 4 (neutral) |
| 3a/4a | −8.20 | −7.54 | −8.54 | −8.48 | −9.36 | −9.62 |
| 3b/4b | −8.32 | −7.87 | −9.13 | −9.43 | −9.80 | −9.90 |
| 3c/4c | −8.19 | −7.95 | −9.51 | −9.75 | −9.90 | −9.51 |
| 3d/4d | −8.80 | −8.46 | −9.61 | −9.46 | −10.36 | −10.74 |
| 3e/4e | −8.17 | −7.68 | −8.49 | −8.67 | −9.36 | −9.65 |
| 3f/4f | −8.23 | −7.68 | −8.76 | −8.98 | −9.32 | −9.92 |
| profl. | −8.83 | −8.61 | ||||
| X8V | −12.73 | |||||
| PI | −10.32 | |||||
Fig. S44 (in the ESI†) shows examples of the obtained docking poses. It can be concluded that the compounds intercalate into DNA with binding energies similar to those of proflavine, especially in the case of the protonated forms. Binding energies are more favourable for groove binding, although the reference compound thiophene diamidine is much more effective. The obtained results confirm the experimental evidence obtained from the fluorescence quenching experiments in the previous section. In the same way, reports on the lower dielectric constant of DNA grooves35,36 seems to be in line with the increased emission quantum yield observed for the neutral form in non-protic solvents, supporting the enhanced fluorescence observed in the bioimaging of dead cell assays.
2.6. Ab initio molecular quantum chemistry calculations
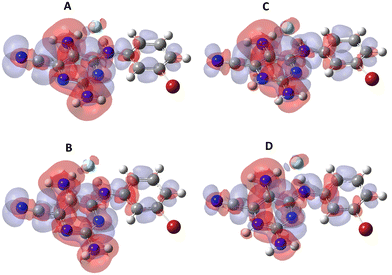
The electronic and structural properties of compound 4d were studied by ab initio molecular quantum chemistry calculations using Gaussian 09 software37 with a 6-31++G** basis set using the TD-SCF DFT method with the MPW1PW91 functional and a continuous solvation model (PCM-polarizable continuum model) corresponding to ethanol. Ground state and first excited state equilibrium geometries for the neutral form are shown in Fig. S45 (ESI†). The molecule is planar in the ground state with the phenyl ring going 32° out-of-plane upon electronic excitation. The corresponding S0–S1 transitions are 362.7 nm and 474.6 nm with oscillator strengths of 0.544 and 0.396, respectively. Using FCclasses3,38 it is possible to calculate absorption/emission spectra. The results showed a very low molar absorptivity coefficient, explained by the large geometry variation upon electronic excitation. As experimental values are orders of magnitude higher, we hypothesized that additional molecules, such as solvent and ions, could be stabilizing the planarity of the excited state. So, an explicit water molecule was added in the vicinity of both the amino group acting as the bridge and the amino group in the pyrimidine ring. Indeed, hydrogen bonds between the water molecule and the amino groups are formed and the change in planarity corresponds to 21°. Chlorine atoms are expected to be present, so we thought of using fluoride, as it has a lower impact on computational resources of the quantum mechanical calculations. A planar geometry of the excited state was obtained and the electron density variations upon S0–S1 excitation are shown in Fig. 7, for both neutral and protonated forms in ground and first excited state equilibrium geometries. For the neutral form, the S0–S1 transitions occur at 400.8 nm and 490.2 nm with oscillator strengths of 0.581 and 0.491, respectively, while for the protonated form, the S0–S1 transitions occur at 387.0 nm and 473.0 nm with oscillator strengths of 0.702 and 0.588, respectively.It can be observed that the π-electron system spans all across the molecule including the two primary amines and through the secondary amine connecting the pyrimidine to the substituted phenyl, thus extending conjugation. Upon electronic excitation to the first excited state, the main changes in the electron distribution are a decrease in π-electron density in the amines, an increase in the cyano group and an increase in the phenyl moiety.
After all equilibrium geometry calculations, a frequency analysis was performed to make sure the program didn't stop at a saddle point (local maximum on the potential energy surface corresponding to a transition state), which would result in the appearance of imaginary frequencies.
Taking the obtained vibrational normal modes, it is possible, using, for example, FCclasses3, to make a vibronic analysis that can predict the form of the absorption and emission spectra. The results are shown in Fig. 8, together with the experimental spectra for the neutral form.
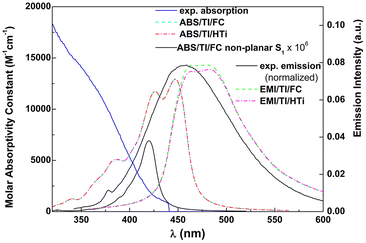 | ||
| Fig. 8 Experimental vs. calculated absorption (one photon absorption, OPA) and emission (EMI) spectra using the MPW1PW91 functional for compound 4d in ethanol. | ||
FCclasses3 calculations are based on the harmonic approximation of the potential energy surfaces (PESs). We chose to use a constant transition dipole moment (Franck–Condon, FC) or allow its linear variation with the nuclear coordinates of the initial state (Herzberg–Teller, HTi, non-Condon effect). We used the Adiabatic Hessian method as it takes into account both ground and excited state equilibrium geometries. This method was shown to give equivalent results to the more intuitive Vertical Hessian (VH) method.39 The calculated spectra were obtained at 25 °C using a Lorentzian broadening with 0.4 eV HWHM and selection of hot states through a Boltzmann threshold of 0.1 (initial state i is selected if exp(−Ei/kBT) > 0.1).
A reasonable accordance was observed between the experimental emission spectral shape and the simulated spectral shape. A red-shift of ∼20 nm is related to the usual underestimation of excitation energies in TD-SCF DFT methods. The shape of the simulated absorption spectrum is much different from the experimental one, which indicates that electronic excitations to higher excited states (S0–Sn, n > 1), not accounted for in the simulated spectrum, have a dominating contribution. The energy difference between the equilibrium geometries of both states is 443 nm. The transitions that occur in the red tail correspond to hot states, whose importance stems from the presence of various low frequency modes (Table S5 in the ESI†). Nevertheless, the experimental molar absorptivity of compound 4d in ethanol at the first shoulder (∼435 nm) is 1.0 × 10³ M−1 cm−1, which is not too far from the one obtained in the simulated spectrum at the maximum absorption wavelength.
3. Conclusions
A series of novel N4-aryl 2,4,5-triamino-6-cyanopyrimidines were obtained, both in hydrochloride salt (3) and neutral (4) forms, by the acid ring-opening of previously prepared highly fluorescent 2-amino-6-cyanopurines 2. These newly prepared 2,4,5-triaminopyrimidines exhibit longer absorption and emission spectral wavelengths and good brightness (between 5400 and 18![[thin space (1/6-em)]](https://www.rsc.org/images/entities/char_2009.gif) 000 M−1 cm−1) compared to other known FNAs. In addition, the newly synthesized compounds possess interesting environmental sensitivity, increasing the emission quantum yields in non-protic solvents. This demonstrates that the 2,4,5-triamino-6-cyanopyrimidine scaffold is an exceptional fluorophore, where the strong push–pull electronic structure resulting from the interplay between amino donors and nitrile acceptors may be responsible for their remarkable photophysical properties, as indicated by ab initio calculations. These characteristics may be valuable in cell biology, pathology, and drug development, given their ability to discriminate between live and dead cells, at least using the eukaryotic cell model organism S. cerevisiae. Their binding mechanism as DNA groove binders was disclosed by theoretical and experimental evidence. The lack of viability cell markers in the blue fluorescence spectrum highlights the importance of these 2,4,5-triaminopyrimidines as valuable alternatives to the most common green and red markers, paving the way for new fluorophore combinations and adding alternatives for spectral overlap issues.
000 M−1 cm−1) compared to other known FNAs. In addition, the newly synthesized compounds possess interesting environmental sensitivity, increasing the emission quantum yields in non-protic solvents. This demonstrates that the 2,4,5-triamino-6-cyanopyrimidine scaffold is an exceptional fluorophore, where the strong push–pull electronic structure resulting from the interplay between amino donors and nitrile acceptors may be responsible for their remarkable photophysical properties, as indicated by ab initio calculations. These characteristics may be valuable in cell biology, pathology, and drug development, given their ability to discriminate between live and dead cells, at least using the eukaryotic cell model organism S. cerevisiae. Their binding mechanism as DNA groove binders was disclosed by theoretical and experimental evidence. The lack of viability cell markers in the blue fluorescence spectrum highlights the importance of these 2,4,5-triaminopyrimidines as valuable alternatives to the most common green and red markers, paving the way for new fluorophore combinations and adding alternatives for spectral overlap issues.
Although the absorption wavelength is still in the UV region and the molar absorption coefficients are not so high, the chromophore scaffold reported here is promising for further development of new FNAs with improved photophysical properties and new applications.
4. Experimental
4.1. Materials and instruments
All compounds were fully characterized by elemental analysis and spectroscopic data. The NMR spectra, including the 1H-13C correlation spectra (HSQC and HMBC), were recorded at room temperature on a Bruker Avance 3400 (1H: 400 MHz, 13C: 100 MHz). The coupling constants, J, are reported in hertz (Hz). For the 1H NMR analysis, about 3 mg of solid were used, while for the 13C NMR analyses, about 20 mg were used. The solvent used in both cases was deuterated dimethylsulfoxide (DMSO-d6). Infrared spectra were recorded using a FT-IR Spectrum Two – PerkinElmer. Melting points were determined on a Stuart cat. SMP3. The reactions were monitored by thin layer chromatography (TLC) using silica gel 60 F254 (Merck). The melting points were determined on a Stuart SMP3 melting point apparatus and are uncorrected.UV-visible absorption spectra were recorded using a Shimadzu UV-3600 Plus spectrophotometer. Fluorescence emission spectra were recorded using a Fluorolog 3 spectrofluorimeter, with double monochromators in both excitation and emission. The emission spectra were corrected for the instrumental response, and absorbance at the excitation wavelength was kept below 0.1, to avoid the inner filter effect. Spectroscopic grade solvents (from Sigma-Aldrich/Merck) and Milli-Q grade water were used for the preparation of all solutions.
The fluorescence quantum yields were determined by the standard method40 using eqn (1),
 | (1) |
Quinine sulphate in 0.05 M H2SO4 aqueous solution was used as the reference, Φr = 0.546 at 25 °C.41
4.2. Synthesis
4.2.1.1. 2-Amino-9-(4-fluorophenyl)-9H-purine-6-carbonitrile (2a). Compound 1a (0.61 g; 2.4 mmol), acetonitrile and trifluoroacetic acid. Compound 2a was isolated, after 16 h, as a light yellow solid (0.49 g; 2.0 mmol; 82%). Mp >300 °C. 1H NMR (400 MHz, DMSO-d6): δ 7.19 (s, 2H), 7.44 (t, J = 8.8 Hz, 2H), 7.84 (dd, J = 9.2, 4.8 Hz; 2H), 8.67 (s, 1H) ppm; 13C NMR (100 MHz, DMSO-d6): δ 114.4, 116.4 (d, J = 23.0 Hz), 126.1 (d, J = 9.0 Hz), 128.5, 130.3, 130.4 (d, J = 2.0 Hz), 145.2, 154.8, 160.9, 161.3 (d, J = 244.0 Hz) ppm. IR (Nujol mull): ν 3493 m (NH), 3314 m (NH), 3204 m (NH), 2240 w (CN), 1643 s (C
![[double bond, length as m-dash]](https://www.rsc.org/images/entities/char_e001.gif) N) cm−1. Anal. Calcd for C12H7FN6 (254.22): C, 56.69; H, 2.78; N, 33.06; found: C, 56.85; H, 2.87; N, 32.68.
N) cm−1. Anal. Calcd for C12H7FN6 (254.22): C, 56.69; H, 2.78; N, 33.06; found: C, 56.85; H, 2.87; N, 32.68.
4.2.1.2. 2-Amino-9-(4-chlorophenyl)-9H-purine-6-carbonitrile (2b). Compound 1b (0.12 g; 0.44 mmol), mixture H2O (1.0 mL)/DMSO (0.1 mL) and trifluoroacetic acid. Compound 2b was isolated, after 2 h, as a brown solid (0.11 g; 0.41 mmol; 93%). Mp 229–230 °C. 1H NMR (300 MHz, DMSO-d6): δ 7.22 (s, 2H), 7.67 (d, J = 9.2 Hz, 2H), 7.88 (d, J = 8.8 Hz, 2H), 8.74 (s, 1H) ppm; 13C NMR (75 MHz, DMSO-d6): δ 114.4, 125.2, 128.6, 129.5, 130.3, 132.4, 133.0, 144.9, 154.7, 160.9 ppm. IR (Nujol mull): ν 3465 m (NH), 3313 m (NH), 3202 m (NH), 3107 w (NH), 2238 w (CN), 1643 s (C
![[double bond, length as m-dash]](https://www.rsc.org/images/entities/char_e001.gif) N) cm−1. Anal. Calcd For C12H7ClN6 (270.68): C, 53.25; H, 2.61; N, 31.05; found: C, 54.09; H, 3.00; N, 31.17.
N) cm−1. Anal. Calcd For C12H7ClN6 (270.68): C, 53.25; H, 2.61; N, 31.05; found: C, 54.09; H, 3.00; N, 31.17.
4.2.1.3. 2-Amino-9-(4-bromophenyl)-9H-purine-6-carbonitrile (2c). Compound 1c (0.50 g; 1.59 mmol), acetonitrile and trifluoroacetic acid. Compound 2c was isolated, after 19 h, as a light yellow solid (0.34 g; 1.08 mmol; 67%). Mp >298 °C. 1H NMR (400 MHz, DMSO-d6): δ 7.21 (s, 2H), 7.76 (d, J = 8.0 Hz, 2H), 7.80 (d, J = 8.0 Hz, 2H), 8.72 (s, 1H) ppm; 13C NMR (100 MHz, DMSO-d6): δ 114.3, 120.7, 125.3, 128.6, 130.3, 132.3, 133.4, 144.7, 154.5, 160.8 ppm. Anal. Calcd For C12H7BrN6 (315.13): C, 45.74; H, 2.24; N, 26.67; found: C, 45.66; H, 2.37; N, 26.53.
4.2.1.4. 2-Amino-9-(3-bromophenyl)-9H-purine-6-carbonitrile (2d). Compound 1d (0.26 g; 0.90 mmol), acetonitrile and trifluoroacetic acid. Compound 2d was isolated, after 4 h, as a light yellow solid (0.20 g; 0.64 mmol; 71%). Mp > 287 °C (Dec). 1H NMR (400 MHz, DMSO-d6): δ 7.25 (s, 2H), 7.54 (t, J = 8.4 Hz, 1H), 7.67 (ddd; J1 = 8.0 Hz, J2 = 2.0 Hz, J3 = 1.2 Hz; 1H), 7.88 (ddd; J1 = 8.0 Hz, J2 = 2.0 Hz, J3 = 1.2 Hz; 1H), 8.12 (t, J = 2.0 Hz, 1H), 8.77 (s, 1H) ppm; 13C NMR (100 MHz, DMSO-d6): δ 114.4, 122.0, 122.5, 126.1, 128.6, 130.3, 130.8, 131.4, 135.5, 144.9, 154.7, 160.9 ppm. IR (Nujol mull): ν 3455 m (NH), 3307 m (NH), 3198 m (NH), 3093 (
![[double bond, length as m-dash]](https://www.rsc.org/images/entities/char_e001.gif) CH), 2177 w (CN), 1641 s (C
CH), 2177 w (CN), 1641 s (C![[double bond, length as m-dash]](https://www.rsc.org/images/entities/char_e001.gif) N) cm−1. Anal. Calcd for C12H7BrN6 (315.13): C, 45.74; H, 2.24; N, 26.67; found: C, 46.00; H, 2.56; N, 26.78.
N) cm−1. Anal. Calcd for C12H7BrN6 (315.13): C, 45.74; H, 2.24; N, 26.67; found: C, 46.00; H, 2.56; N, 26.78.
4.2.1.5. 2-Amino-9-phenyl-9H-purine-6-carbonitrile (2e). Compound 1e (0.41 g; 1.7 mmol), acetonitrile and trifluoroacetic acid. Compound 2e was isolated, after 16 h, as a white solid (0.29 g; 1.2 mmol; 70%). Mp 259–271 °C. 1H NMR (400 MHz, DMSO-d6): δ 7.19 (s, 2H), 7.47 (t, J = 8.0 Hz, 1H), 7.59 (t, J = 8.0 Hz, 2H), 7.82 (dd, J1 = 8.8 Hz, J2 = 1.6 Hz, 2H), 8.73 (s, 1H) ppm; 13C NMR (75 MHz, DMSO-d6): δ 114.5, 123.6, 128.1, 128.7, 129.5, 130.3, 134.1, 145.1, 154.7, 160.9 ppm. IR (Nujol mull): ν 3475 m (NH), 3294 m (NH), 3181 m (NH), 3096 m (
![[double bond, length as m-dash]](https://www.rsc.org/images/entities/char_e001.gif) CH), 2270s (CN), 1625 s (C
CH), 2270s (CN), 1625 s (C![[double bond, length as m-dash]](https://www.rsc.org/images/entities/char_e001.gif) N) cm−1. Anal. Calcd for C12H8N6 (236.23): C, 61.01; H, 3.41; N, 35.58; found: C, 60.68; H, 3.22; N, 33.30.
N) cm−1. Anal. Calcd for C12H8N6 (236.23): C, 61.01; H, 3.41; N, 35.58; found: C, 60.68; H, 3.22; N, 33.30.
4.2.1.6. 2-Amino-9-(p-tolyl)-9H-purine-6-carbonitrile (2f). Compound 1f (0.23 g; 0.92 mmol), acetonitrile and trifluoroacetic acid. Compound 2f was isolated, after 4 h, as a light yellow solid (0.20 g; 0.80 mmol; 87%). Mp 263–265 °C. 1H NMR (400 MHz, DMSO-d6): δ 2.36 (s, 3H), 7.12 (s, 2H), 7.37 (d, J = 7.6 Hz, 2H), 7.65 (d, J = 8.4 Hz, 2H), 8.63 (s, 1H) ppm; 13C NMR (100 MHz, DMSO-d6): δ 20.6, 114.4, 123.5, 128.6, 129.9, 130.2, 131.6, 137.7, 145.1, 154.7, 160.8 ppm. IR (Nujol mull): ν 3502 m (NH), 3310 m (NH), 3292 m (NH), 3099 m (NH), 2164 w (CN), 1638 s (C
![[double bond, length as m-dash]](https://www.rsc.org/images/entities/char_e001.gif) N) cm−1. Anal. Calcd for C13H10N6 (250.26): C, 62.39; H, 4.03; N, 33.58; found: C, 62.01; H, 3.88; N, 33.13.
N) cm−1. Anal. Calcd for C13H10N6 (250.26): C, 62.39; H, 4.03; N, 33.58; found: C, 62.01; H, 3.88; N, 33.13.
4.2.2.1. 2,5-Diamino-6-cyano-4-((4-fluorophenyl)amino)-pyrimidinium chloride (3a). Compound 2a (0.10 g; 0.40 mmol), 37% hydrochloric acid (0.08 mL; 0.39 mmol) and ethanol, 80 °C. Compound 3a was isolated as a light green solid after 1 day (0.097 g; 0.34 mmol; 85%). Mp 200 °C. 1H NMR (400 MHz, DMSO-d6): δ 7.23 (t, J = 8.8 Hz, 2H), 7.87 (dt, J1 = 9.2 Hz, J2 = 4.8 Hz, 2H), 10.44 (s, 1H) ppm; 13C NMR (100 MHz, DMSO-d6): δ 98.2, 113.0, 115.5 (d, J = 22 Hz), 125.1 (d, J = 8.0 Hz), 130.1, 133.8 (d, J = 3.0 Hz), 150.9, 153.5, 159.5 (d, J = 242 Hz) ppm. IR: ν 3392 m (NH), 3150 m (NH), 2229 w (CN), 1660 s (C
![[double bond, length as m-dash]](https://www.rsc.org/images/entities/char_e001.gif) N), 1651 s (C
N), 1651 s (C![[double bond, length as m-dash]](https://www.rsc.org/images/entities/char_e001.gif) N), 1623 s (C
N), 1623 s (C![[double bond, length as m-dash]](https://www.rsc.org/images/entities/char_e001.gif) N) cm−1. C11H10ClFN6 (280.72).
N) cm−1. C11H10ClFN6 (280.72).
4.2.2.2. 2,5-Diamino-6-cyano-4-((4-chlorophenyl)amino)-pyrimidinium chloride (3b). Compound 2b (0.10 g; 0.37 mmol), 37% hydrochloric acid (0.08 mL; 0.39 mmol) and ethanol, 100 °C. Compound 3b was isolated as a dark green solid after 1 day (0.09 g; 0.30 mmol; 81%). Mp 235 °C. 1H NMR (400 MHz, DMSO-d6): δ 7.44 (dt, J1 = 8.8 Hz, J2 = 2.2 Hz, 2H), 7.92 (dt, J1 = 8.8 Hz, J2 = 2.2 Hz, 2H), 10.52 (s, 1H) ppm; 13C NMR (100 MHz, DMSO-d6): δ 98.7, 113.0, 124.5, 128.6, 129.3, 130.1, 136.5, 150.8, 153.3 ppm. IR: ν 3153 m (NH), 2223 w (CN), 1653 s (C
![[double bond, length as m-dash]](https://www.rsc.org/images/entities/char_e001.gif) N), 1617 s (C
N), 1617 s (C![[double bond, length as m-dash]](https://www.rsc.org/images/entities/char_e001.gif) N) cm−1. C11H10Cl2N6 (296.03).
N) cm−1. C11H10Cl2N6 (296.03).
4.2.2.3. 2,5-Diamino-6-cyano-4-((4-bromophenyl)amino)-pyrimidinium chloride (3c). Compound 2c (0.28 g; 0.89 mmol), 37% hydrochloric acid (0.23 mL; 2.70 mmol) and ethanol, 80 °C. Compound 3c was isolated as a light brown solid after 1 day (0.22 g; 0.62 mmol; 70%). Mp 241 °C. 1H NMR (400 MHz, DMSO-d6): δ 7.56 (dt, J1 = 6.8 Hz, J2 = 2.0 Hz, 2H), 7.86 (dt, J1 = 7.2 Hz, J2 = 2.4 Hz, 2H), 10.74 (s, 1H) ppm; 13C NMR (100 MHz, DMSO-d6): δ 98.7, 113.0, 117.5, 124.9, 130.1, 131.5, 136.9, 150.8, 153.3 ppm. IR: ν 3554 m (NH), 3153 m (NH), 2224 w (CN), 1652 s (C
![[double bond, length as m-dash]](https://www.rsc.org/images/entities/char_e001.gif) N), 1620 s (C
N), 1620 s (C![[double bond, length as m-dash]](https://www.rsc.org/images/entities/char_e001.gif) N) cm−1. C11H10ClN6Br (341.60).
N) cm−1. C11H10ClN6Br (341.60).
4.2.2.4. 2,5-Diamino-6-cyano-4-((3-bromophenyl)amino)-pyrimidinium chloride (3d). Compound 2d (0.06 g; 0.18 mmol), 37% hydrochloric acid (0.05 mL; 0.23 mmol) and ethanol, 100 °C. Compound 3d was isolated as a light brown solid after 1 day (0.03 g; 0.09 mmol; 50%). Mp 226 °C. 1H NMR (400 MHz, DMSO-d6): δ 7.33 (t, J = 2.0 Hz, 1H), 7.37 (dt, J1 = 8.0 Hz, J2 = 2.0 Hz, 1H), 7.93 (dt, J1 = 7.6 Hz, J2 = 2.0 Hz, 1H), 8.05 (t, J = 2.0 Hz, 1H), 10.27 (s, 1H) ppm; 13C NMR (100 MHz, DMSO-d6): δ 100.6, 113.2, 121.3, 121.5, 124.9, 127.8, 129.7, 130.6, 139.2, 151.2, 153.3 ppm. IR: ν 3168 m (NH), 2223 w (CN), 1652 s (C
![[double bond, length as m-dash]](https://www.rsc.org/images/entities/char_e001.gif) N), 1622 s (C
N), 1622 s (C![[double bond, length as m-dash]](https://www.rsc.org/images/entities/char_e001.gif) N) cm−1. C11H10ClN6Br (341.60).
N) cm−1. C11H10ClN6Br (341.60).
4.2.2.5. 2,5-Diamino-6-cyano-4-(phenylamino)pyrimidinium chloride (3e). Compound 2e (0.14 g; 0.58 mmol), 37% hydrochloric acid (0.08 mL; 0.39 mmol) and ethanol, 80 °C. Compound 3e was isolated as a light yellow solid after 22 hours (0.10 g; 0.38 mmol; 66%). Mp 214 °C. 1H NMR (400 MHz, DMSO-d6): δ 7.19 (t, J = 7.2 Hz, 1H), 7.39 (t, J = 8.8 Hz, 2H), 7.82 (d, J = 7.6 Hz, 2H), 10.03 (s, 1H) ppm; 13C NMR (100 MHz, DMSO-d6): δ 97.7, 112.9, 123.0, 125.6, 128.7, 130.2, 137.3, 150.7, 153.4 ppm. IR: ν 3154 m (NH), 2226 w (CN), 1651 s (C
![[double bond, length as m-dash]](https://www.rsc.org/images/entities/char_e001.gif) N), 1627 s (C
N), 1627 s (C![[double bond, length as m-dash]](https://www.rsc.org/images/entities/char_e001.gif) N), 1600 s (C
N), 1600 s (C![[double bond, length as m-dash]](https://www.rsc.org/images/entities/char_e001.gif) N) cm−1. C11H10ClN6 (262.70).
N) cm−1. C11H10ClN6 (262.70).
4.2.2.6. 2,5-Diamino-6-cyano-4-(p-tolylamino)-pyrimidinium chloride (3f). Compound 2f (0.13 g; 0.53 mmol), 37% hydrochloric acid (0.11 mL; 0.56 mmol) and ethanol, 80 °C. Compound 3f was isolated as a light green solid after 1 day (0.10 g; 0.34 mmol; 64%). Mp 220 °C. 1H NMR (400 MHz, DMSO-d6): δ 2.29 (s, 3H), 7.17 (d, J = 8.0 Hz, 2H), 7.69 (dt, J1 = 8.4 Hz, J2 = 2.4 Hz, 2H), 9.65 (s, 1H) ppm; 13C NMR (100 MHz, DMSO-d6): δ 20.6, 97.4, 112.9, 123.0, 129.1, 130.1, 134.7, 134.9, 150.7, 153.3 ppm. IR: ν 3180 m (NH), 2222 w (CN), 1649 s (C
![[double bond, length as m-dash]](https://www.rsc.org/images/entities/char_e001.gif) N), 1622 s (C
N), 1622 s (C![[double bond, length as m-dash]](https://www.rsc.org/images/entities/char_e001.gif) N) cm−1. C12H13ClN6 (276.06).
N) cm−1. C12H13ClN6 (276.06).
4.2.3.1. 2,5-Diamino-6-cyano-4-((4-fluorophenyl)amino)-pyrimidine (4a). Compound 3a (0.097 g; 0.34 mmol), triethylamine (0.10 mL; 0.69 mmol) and ethanol, room temperature. Compound 4a was isolated as a light green solid after 1 minute (0.08 g; 0.33 mmol; 97%). Mp 219 °C. 1H NMR (400 MHz, DMSO-d6): δ 5.18 (bs, 1H), 5.85 (bs, 1H), 7.14 (dt, J1 = 8.8 Hz, J2 = 2.0 Hz, 2H), 7.81 (dt, J1 = 9.2 Hz, J2 = 4.8 Hz, 2H), 8.70 (s, 1H) ppm; 13C NMR (100 MHz, DMSO-d6): δ 115.1 (d, J = 22 Hz), 116.8, 117.9, 122.5 (d, J = 8.0 Hz), 125.9, 135.8 (d, J = 3.0 Hz), 151.7, 155.5, 157.9 (d, J = 239 Hz) ppm. IR: ν 3491 m (NH), 3390 m (NH), 3353 m (NH), 3290 m (NH), 2229 w (CN), 1636 s (C
![[double bond, length as m-dash]](https://www.rsc.org/images/entities/char_e001.gif) N), 1617 s (C
N), 1617 s (C![[double bond, length as m-dash]](https://www.rsc.org/images/entities/char_e001.gif) N) cm−1. m/z calcd for C11H9FN6 245.094549, found 245.094868.
N) cm−1. m/z calcd for C11H9FN6 245.094549, found 245.094868.
4.2.3.2. 2,5-Diamino-6-cyano-4-((4-chlorophenyl)amino)-pyrimidine (4b). Compound 3b (0.09 g; 0.30 mmol), triethylamine (0.09 mL; 0.60 mmol) and ethanol, room temperature. Compound 4b was isolated as a dark green solid after 1 minute (0.07 g; 0.27 mmol; 90%). Mp 250 °C. 1H NMR (400 MHz, DMSO-d6): δ 5.20 (bs, 1H), 5.90 (bs, 1H), 7.34 (dt, J1 = 7.2 Hz, J2 = 3.2 Hz, 2H), 7.85 (dt, J1 = 7.2 Hz, J2 = 3.2 Hz, 2H), 8.76 (s, 1H) ppm; 13C NMR (100 MHz, DMSO-d6): δ 116.8, 118.4, 122.0, 126.0, 126.3, 128.3, 138.5, 151.5, 155.5 ppm. IR: ν 3492 m (NH), 3389 m (NH), 3354 m (NH), 3188 m (NH), 2218 w (CN), 1669 s (C
![[double bond, length as m-dash]](https://www.rsc.org/images/entities/char_e001.gif) N), 1604 s (C
N), 1604 s (C![[double bond, length as m-dash]](https://www.rsc.org/images/entities/char_e001.gif) N) cm−1. m/z calcd for C11H9ClN6 261.064998, found 261.065117.
N) cm−1. m/z calcd for C11H9ClN6 261.064998, found 261.065117.
4.2.3.3. 2,5-Diamino-6-cyano-4-((4-bromophenyl)amino)-pyrimidine (4c). Compound 3c (0.22 g; 0.62 mmol), triethylamine (0.19 mL; 1.24 mmol) and ethanol, room temperature. Compound 4c was isolated as a light yellow solid after 1 minute (0.18 g; 0.59 mmol; 95%). Mp 256 °C. 1H NMR (400 MHz, DMSO-d6): δ 5.21 (s, 1H), 5.91 (s, 1H), 7.46 (d, J = 8.8 Hz, 2H), 7.81 (d, J = 8.8 Hz, 2H), 8.78 (s, 1H) ppm; 13C NMR (100 MHz, DMSO-d6): δ 114.3, 116.8, 118.4, 122.5, 126.1, 131.2, 138.9, 151.5, 155.5 ppm. IR: ν 3496 m (NH), 3391 m (NH), 3351 m (NH), 3189 m (NH), 2218 w (CN), 1668 s (C
![[double bond, length as m-dash]](https://www.rsc.org/images/entities/char_e001.gif) N), 1634 s (C
N), 1634 s (C![[double bond, length as m-dash]](https://www.rsc.org/images/entities/char_e001.gif) N), 1602 s (C
N), 1602 s (C![[double bond, length as m-dash]](https://www.rsc.org/images/entities/char_e001.gif) N) cm−1. m/z calcd for C11H9N6Br 305.014483, found 305.014668.
N) cm−1. m/z calcd for C11H9N6Br 305.014483, found 305.014668.
4.2.3.4. 2,5-Diamino-6-cyano-4-((3-bromophenyl)amino)-pyrimidine (4d). Compound 3d (0.03 g; 0.09 mmol), triethylamine (0.03 mL; 0.18 mmol) and ethanol, room temperature. Compound 4d was isolated as a light brown solid after 1 minute (0.02 g; 0.07 mmol; 78%). Mp 216 °C. 1H NMR (400 MHz, DMSO-d6): δ 5.18 (bs, 1H), 5.95 (bs, 1H), 7.20 (dt, J1 = 8.4 Hz, J2 = 1.2 Hz, 1H), 7.26 (t, J = 8.0 Hz, 1H), 7.88 (dt, J1 = 8.0 Hz, J2 = 1.2 Hz, 1H), 7.99 (t, J = 2.0 Hz, 1H), 8.74 (s, 1H) ppm; 13C NMR (100 MHz, DMSO-d6): δ 116.7, 118.7, 119.2, 121.4, 122.5, 125.3, 126.0, 130.5, 141.1, 151.5, 155.5 ppm. IR: ν 3492 m (NH), 3431 m (NH), 3391 m (NH), 3302 m (NH), 3187 m (NH), 2220 w (CN), 1650 s (C
![[double bond, length as m-dash]](https://www.rsc.org/images/entities/char_e001.gif) N) cm−1. m/z calcd for C11H9N6Br 305.014483, found 305.014505.
N) cm−1. m/z calcd for C11H9N6Br 305.014483, found 305.014505.
4.2.3.5. 2,5-Diamino-6-cyano-4-(phenylamino)pyrimidine (4e). Compound 3e (0.10 g; 0.38 mmol), triethylamine (0.13 mL; 0.76 mmol) and ethanol, room temperature. Compound 4e was isolated as a light yellow solid after 1 minute (0.08 g; 0.35 mmol; 92%). Mp 231 °C. 1H NMR (400 MHz, DMSO-d6): δ 5.20 (bs, 1H), 5.85 (bs, 1H), 7.03 (tt, J1 = 7.2 Hz, J2 = 1.2 Hz, 1H), 7.31 (tt, J1 = 8.4 Hz, J2 = 2.4 Hz, 2H), 7.80 (dt, J1 = 8.4 Hz, J2 = 2.4 Hz, 2H), 8.63 (s, 1H) ppm; 13C NMR (100 MHz, DMSO-d6): ν 116.9, 118.1, 120.6, 122.8, 122.9, 126.0, 128.6, 139.5, 151.7, 155.6 ppm. IR: δ 3476 m (NH), 3376 m (NH), 3167 m (NH), 2225 w (CN), 1615 s (C
![[double bond, length as m-dash]](https://www.rsc.org/images/entities/char_e001.gif) N) cm−1. m/z calcd for C11H9N6 227.103971, found 227.104173.
N) cm−1. m/z calcd for C11H9N6 227.103971, found 227.104173.
4.2.3.6. 2,5-Diamino-6-cyano-4-(p-tolylamino)pyrimidine (4f). Compound 3f (0.10 g; 0.34 mmol), triethylamine (0.12 mL; 0.68 mmol) and ethanol, room temperature. Compound 4f was isolated as a light green solid after 1 minute (0.07 g; 0.29 mmol; 85%). Mp 247 °C. 1H NMR (400 MHz, DMSO-d6): δ 2.30 (s, 3H), 7.19 (d, J = 8.0 Hz, 2H), 7.69 (dt, J1 = 8.4 Hz, J2 = 2.4 Hz, 2H), 9.65 (s, 1H) ppm; 13C NMR (100 MHz, DMSO-d6): δ 20.4, 116.9, 117.8, 120.8, 122.5, 125.9, 129.0, 131.9, 136.8, 151.8, 155.6 ppm. IR: ν 3456 m (NH), 3403 m (NH), 3363 m (NH), 3263 m (NH), 3160 m (NH), 2223 w (CN), 1615 s (C
![[double bond, length as m-dash]](https://www.rsc.org/images/entities/char_e001.gif) N), 1603 s (C
N), 1603 s (C![[double bond, length as m-dash]](https://www.rsc.org/images/entities/char_e001.gif) N) cm−1. m/z calcd for C12H11N6 241.119621, found 241.119687.
N) cm−1. m/z calcd for C12H11N6 241.119621, found 241.119687.
4.3. DNA interaction assay
Natural double-stranded salmon sperm DNA was obtained from Invitrogen. Compound and DNA stock solutions were prepared in 10−2 M Tris-HCl buffer (pH = 7.2), with 10−3 M EDTA. The DNA concentration in a number of bases (or phosphate groups) was determined from the molar absorption coefficient, ε = 6600 M−1 cm−1 at 260 nm. The emission spectra of several solutions with different [DNA]/[4d] ratios, using the same compound concentration (5 × 10⁻⁶ M), were recorded. The solutions were left for 24 h to stabilize. The absorbance at an excitation wavelength (λexc = 350 nm) was lower than 0.1 to avoid inner filter effects. All measurements were performed at room temperature (25.0 ± 0.5 °C). Binding analysis of the experimental data was performed according to the McGhee and von Hippel model24 to determine the intrinsic binding constant and the binding site size.4.4. Biological studies
The Saccharomyces cerevisiae strain used in this work was BY4741 (MATα leu2Δ0 ura3Δ0 his3-Δ1 met15Δ0). Yeast cells were taken from a frozen stock at −80 °C, streaked on fresh yeast extract-peptone-dextrose plates (YPDA; 1% w/v yeast extract, Acros Organics, 2% w/v peptone, Biolife, 2% w/vD-glucose, and 2% w/v agar, LabChem), and incubated at 30 °C for 2–3 days before storing at 4 °C. Yeast cultures were prepared by inoculating one colony from a YPDA plate into fresh liquid YPD (YPDA without agar) medium followed by overnight incubation at 30 °C with shaking at 200 revolutions per minute (rpm). Growth was monitored by measuring the optical density at 600 nm (OD600).
S. cerevisiae cultures of strain BY4741 in the exponential growth phase were used for micrograph acquisition by diluting an overnight culture to an OD600of ∼0.1 and growth under the same conditions to an OD600 of ∼0.4. For live/dead verification, cells were centrifuged at 7200g for 3 min at room temperature (RT), washed with phosphate-buffered saline (PBS, pH 7.2), re-suspended in PBS with 10 μM propidium iodide (PI) and 250 μM of 2,4,5-triaminopyrimidines with incubation at RT for 15 min, and protected from light. For microscopy inspection, the cells were washed and resuspended in PBS. To generate dead-cell samples, cells were heat-killed before staining in a water bath at 80 °C for 2 min.
All microscopic observations were carried out using an Olympus BX-51 epifluorescence microscope equipped with a 100× oil immersion objective lens. Micrographs were obtained with an Olympus DP72 digital camera and using CellSens software and processed with ImageJ (NIH) version 1.54b. At least two independent experiments were conducted.
Conflicts of interest
There are no conflicts to declare.Acknowledgements
This work was supported by the Foundation for Science and Technology (FCT-Portugal) under the scope of the strategic funding of CQ-UM (UIDB/00686/2020), CF-UM-UP (UIDB/04650/2020), CBMA (UIDB/04050/2020), CEB (UIDB/04469//2020), MedInUP (UIDB/04308/2020 and UIDP/04308/2020) and the National NMR Network (RNRMN) (PINFRA/22161/2016). We also acknowledge SearchON2 “Revitalization of HPC infrastructure of UMinho” (NORTE 07-0162-FEDER-000086), co-funded by the North Portugal Regional Operational Programme (ON.2 – O Novo Norte), under the National Strategic Reference Framework (NSRF), through the European Regional Development Fund (ERDF).References
- S. Kamiloglu, G. Sari, T. Ozdal and E. Capanoglu, Food Front., 2020, 1, 332–349 CrossRef.
- M. Tian, Y. Ma and W. Lin, Acc. Chem. Res., 2019, 52, 2147–2157 CrossRef CAS PubMed.
- Y. Zhao, C. Zhang, J. Liu, D. Li, X. Tian, A. Wang, S. Li, J. Wu and Y. Tian, J. Mater. Chem. B, 2019, 7, 3633–3638 RSC.
- Y. Lai, T. Zhang, W. Song, Z. Li and W. Lin, Anal. Chem., 2021, 93, 12487–12493 CrossRef CAS PubMed.
- R. W. Sinkeldam, N. J. Greco and Y. Tor, Chem. Rev., 2010, 110, 2579–2619 CrossRef CAS PubMed.
- W. Xu, K. M. Chan and E. T. Kool, Nat. Chem., 2017, 9, 1043–1055 CrossRef CAS PubMed.
- M. Legraverend, Tetrahedron, 2008, 64, 8585–8603 CrossRef CAS.
- M. Bood, S. Sarangamath, M. S. Wranne, M. Grøtli and L. M. Wilhelmsson, Beilstein J. Org. Chem., 2018, 14, 114–129 CrossRef CAS PubMed.
- Y. Saito and R. H. E. Hudson, J. Photochem. Photobiol., C, 2018, 36, 48–73 CrossRef CAS.
- S. S. Bag and I. Saito, Fluorescent Analogues of Biomolecular Building Blocks: Design and Applications, 2016, pp. 137–173 Search PubMed.
- K. Seio, T. Kanamori and Y. Masaki, Tetrahedron Lett., 2018, 59, 1977–1985 CrossRef CAS.
- J. J. Strouse, M. Jegelnik and J. B. Arterburn, Acta Chim. Slov., 2005, 52, 187–199 CAS.
- F. Fang, J. Xia, S. Quan, S. Chen and G.-J. Deng, J. Org. Chem., 2023, 88, 14697–14707 CrossRef CAS PubMed.
- L. Yet, Privileged Structures in Drug Discovery, John Wiley & Sons, Ltd, 2018, pp. 237–283 Search PubMed.
- J. Yang, Q. Dang, J. Liu, Z. Wei, J. Wu and X. Bai, J. Comb. Chem., 2005, 7, 474–482 CrossRef CAS PubMed.
- R. K. Robins, K. J. Dille, C. H. Willits and B. E. Christensen, J. Am. Chem. Soc., 1953, 75, 263–266 CrossRef CAS.
- K. Leškovskis, J. M. Zaķis, I. Novosjolova and M. Turks, Eur. J. Org. Chem., 2021, 2021, 5027–5052 CrossRef.
- M. Brændvang, C. Charnock and L.-L. Gundersen, Bioorg. Med. Chem. Lett., 2009, 19, 3297–3299 CrossRef PubMed.
- H.-J. Yang, C.-L. Hsu, J.-Y. Yang and W. Y. Yang, PLoS One, 2012, 7, 1–8 Search PubMed.
- A. Orth, R. N. Ghosh, E. R. Wilson, T. Doughney, H. Brown, P. Reineck, J. G. Thompson and B. C. Gibson, Biomed. Opt. Express, 2018, 9, 2943–2954 CrossRef CAS PubMed.
- C. Yang, V. Hou, L. Y. Nelson and E. J. Seibel, J. Biomed. Opt., 2013, 18, 86012 CrossRef PubMed.
- R. Hulspas, M. R. G. O'Gorman, B. L. Wood, J. W. Gratama and D. R. Sutherland, Cytometry, Part B, 2009, 76, 355–364 CrossRef PubMed.
- J. M. Gonçalves, J. N. D. Gonçalves, A. S. Pêra, N. R. Senhorães, A. R. O. Rodrigues, R. Oliveira, P. J. G. Coutinho, E. M. S. Castanheira and A. M. Dias, Eur. J. Org. Chem., 2023, 26, e202300176 CrossRef.
- J. Yin, L. Huang, L. Wu, J. Li, T. D. James and W. Lin, Chem. Soc. Rev., 2021, 50, 12098–12150 RSC.
- B. Y. Michel, D. Dziuba, R. Benhida, A. P. Demchenko and A. Burger, Front. Chem., 2020, 8, 112 CrossRef CAS PubMed.
- M. Rosenberg, N. F. Azevedo and A. Ivask, Sci. Rep., 2019, 9, 6483 CrossRef PubMed.
- C. Kirchhoff and H. Cypionka, J. Microbiol. Methods, 2017, 142, 79–82 CrossRef CAS PubMed.
- J. D. McGhee and P. H. von Hippel, J. Mol. Biol., 1974, 86, 469–489 CrossRef CAS PubMed.
- A. S. Abreu, E. M. S. Castanheira, P. J. G. Coutinho, M.-J. R. P. Queiroz, P. M. T. Ferreira, L. A. Vale-Silva and E. Pinto, J. Photochem. Photobiol., A, 2012, 240, 14–25 CrossRef CAS.
- B. Valeur, Molecular Fluorescence: Principles and Applications, Wiley–VCH Verlag GmbH, Weinheim, 2001 Search PubMed.
- S. S. Lehrer, Biochemistry, 1971, 10, 3254–3263 CrossRef CAS PubMed.
- G. M. Morris, D. S. Goodsell, R. S. Halliday, R. Huey, W. E. Hart, R. K. Belew and A. J. Olson, J. Comput. Chem., 1998, 19, 1639–1662 CrossRef CAS.
- C. G. Ricci and P. A. Netz, J. Chem. Inf. Model., 2009, 49, 1925–1935 CrossRef CAS PubMed.
- A. R. O. Rodrigues, M. S. D. Carvalho, J. A. V. Cardoso, R. C. Calhelha, M.-J. R. P. Queiroz, P. J. G. Coutinho and E. M. S. Castanheira, J. Photochem. Photobiol., A, 2014, 294, 20–30 CrossRef CAS.
- V. R. Jadhav, D. A. Barawkar and K. N. Ganesh, J. Phys. Chem. B, 1999, 103, 7383–7385 CrossRef CAS.
- T. Kimura, K. Kawai and T. Majima, Org. Lett., 2005, 7, 5829–5832 CrossRef CAS PubMed.
- M. J. Frisch, G. W. Trucks, H. B. Schlegel, G. E. Scuseria, M. A. Robb, J. R. Cheeseman, G. Scalmani, V. Barone, G. A. Petersson, H. Nakatsuji, X. Li, M. Caricato, A. Marenich, J. Bloino, B. G. Janesko, R. Gom-perts, B. Mennucci, H. P. Hratchian, J. V. Ortiz, A. F. Izmaylov, J. L. Sonnenberg, D. Williams-Young, F. Ding, F. Lip-parini, F. Egidi, J. Goings, B. Peng, A. Petrone, T. Henderson, D. Ranasinghe, V. G. Zakrzewski, J. Gao, N. Rega, G. Zheng, W. Liang, M. Hada, M. Ehara, K. Toyota, R. Fukuda, J. Hasegawa, M. Ishida, T. Nakajima, Y. Honda, O. Kitao, H. Nakai, T. Vreven, K. Throssell, J. A. Montgomery Jr., J. E. Peralta, F. Ogliaro, M. Bearpark, J. J. Heyd, E. Brothers, K. N. Kudin, V. N. Staroverov, T. Keith, R. Kobayashi, J. Normand, K. Raghavachari, A. Rendell, J. C. Burant, S. S. Iyengar, J. Tomasi, M. Cossi, J. M. Millam, M. Klene, C. Adamo, R. Cammi, J. W. Ochterski, R. L. Martin, K. Moroku-ma, O. Farkas, J. B. Foresman and D. J. Fox, Gaussian 09, Revision C.01, Gaussian, Inc., Wallingford CT, 2016 Search PubMed.
- Fabrizio Santoro and Javier Cerezo, FCclasses3, A code for vibronic calculations.v3-1.0-2-g78ec1d1,2022, https://www.iccom.cnr.it/en/fcclasses.
- F. J. A. Ferrer and F. Santoro, Phys. Chem. Chem. Phys., 2012, 14, 13549–13563 RSC.
- S. Fery-Forgues and D. Lavabre, J. Chem. Educ., 1999, 76, 1260–1264 CrossRef CAS.
- S. R. Meech and D. Phillips, J. Photochem., 1983, 23, 193–217 CrossRef CAS.
Footnote |
| † Electronic supplementary information (ESI) available. See DOI: https://doi.org/10.1039/d4ob00092g |
| This journal is © The Royal Society of Chemistry 2024 |

