 Open Access Article
Creative Commons Attribution 3.0 Unported Licence
Polyetherimide (PEI) nanocomposite with WS2 nanotubes†
Dotan
Babai
 ab,
Iddo
Pinkas
 c,
Doron
Naveh
 *a and
Reshef
Tenne
 *b
*b
aFaculty of Engineering, Bar-Ilan University, Ramat-Gan 5290002, Israel. E-mail: Doron.Naveh@biu.ac.il
bDepartment of Molecular Chemistry and Materials Science, Weizmann Institute, Rehovot 7600001, Israel. E-mail: reshef.tenne@weizmann.ac.il
cDepartment of Chemical Research Support, Weizmann Institute of Science, Rehovot 7600001, Israel
First published on 26th April 2024
Abstract
Nanocomposite materials, integrating nanoscale additives into a polymer matrix, hold immense promise for their exceptional property amalgamation. This study delves into the fabrication and characterization of polyetherimide (PEI) nanocomposite strings fortified with multiwall WS2 nanotubes. The manufacturing process capitalizes on the preferential alignment of WS2 nanotubes along the string axis, corroborated by scanning electron microscopy (SEM). Mechanical measurements unveil a remarkable acceleration of strain hardening in the nanocomposite strings, chiefly attributed to the WS2 nanotubes. Structural analyses via X-ray diffraction (XRD) and wide-angle X-ray scattering (WAXS) reveal intriguing structural alterations during tensile deformation. Notably a semi-crystalline framework ∼100 nm in diameter surrounding the WS2 nanotubes emerges, which is stabilized by the π–π interactions between the PEI chains. The amorphous majority phase (97% by volume) undergoes also major structural changes upon strain becoming more compact and closing-up of the distance beweeetn the PEI chains. Dynamic mechanical analysis (DMA) demonstrates improved thermal stability of the evolved semi-crystalline π–π oriented PEI molecules, characterized by delayed thermal “structural melting”, underscoring the pivotal role of the WS2 nanotubes in reinforcing the nanocomposite. The insight gained in this study of WS2 nanotube-reinforced PEI nanocomposite strings, could offer diverse applications for such tailor-made polymeric materials.
1. Introduction
Nanocomposite materials emerged as a promising class of materials, synergistically hybridizing different constituents to achieve superior properties for various applications.1–9 Carbon nanotubes-based polymer nanocomposites have been thoroughly studied and have demonstrated promising potential for numerous applications.10–14 More recently, significant efforts were devoted to the study of polymer nanocomposites incorporating graphene as a polymer additive.15–17 The intensive research in the field of polymer nanocomposites stems from the potentially myriad applications, spanning almost every aspect of our daily life. Among the large array of investigated polymer nanocomposites, those based on inorganic WS2 nanotubes (INT) and fullerene-like (IF) nanoparticles (NPs) make a special class. Although the tungsten sulfur bond is six times weaker than the carbon–carbon bond, these nanomaterials present several unique advantages, as demonstrated before.18–20 WS2 INTs interact mostly via van der Waals forces, which are appreciably weaker than the π–π staking typical for aromatic systems like carbon nanotubes and graphene. Hence, in general WS2 nanotubes disperse well and evenly in polymer matrices. Also, being properly synthesized at elevated temperatures and having highly crystalline order, these multiwall nanotubes are stiff and robust and can support loads 100 times stronger than polymer matrices (tensile strength of 5–20 GPa).21 Not less important, WS2 nanotubes were found to show low toxicity and are considered to be biocompatible.22,23 Since most biodegradable polymers, like poly-L-lactic acid, are polymerized via weak chemical bonds like esterification, they are mechanically fragile. Therefore, their reinforcement by the addition of small amounts of WS2 INTs could, potentially be very important for their applications.23,24 Being a semiconductor with a bandgap in the visible part of the spectrum, they can also be exploited as photo-catalysts for accelerating the photocuring of polymer films, which offers other sort of applications for WS2 INTs.25Polyetherimide (PEI), also known as ULTEM, is a high-performance engineering thermoplastic recognized for its exceptional mechanical, thermal, and electrical properties.26,27 Derived from the condensation polymerization of bisphenol-A and aromatic diamines, PEI exhibits remarkable properties such as heat resistance, chemical stability, mechanical strength, and fire retardancy.28–30
Widely utilized across aerospace, electronics, automotive, and medical industries, PEI ensures reliability in lightweight and durable aerospace components, even under extreme conditions.31,32 Its excellent electrical insulating properties make PEI a valued material, especially in electronics for applications like printed circuit boards (PCBs),33,34 and for gas separation.25 Furthermore, PEI's biocompatibility and resistance to sterilization methods make it a safe choice for medical devices, contributing to patient safety in healthcare settings.35 Efforts to enhance PEI's properties involve incorporating nanofillers to create nanocomposites. Described in the literature, these nanocomposites exhibit improved mechanical properties and enhanced thermal stability.36–38
In the present study, a new PEI nanocomposite is fabricated containing 0.25–2.0 wt% WS2 INT. The mechanical properties of the nanocomposite PEI fibers were investigated through correlative tensile experiments and optical imaging, revealing a new reinforcement mechanism via structural reorganization of the polymer chains. To comprehend the structural changes induced by stretching the nanofibers, various X-ray scattering methods and scanning thermal analysis were employed. These analyses unveiled a semi-crystalline ordering of the aromatic PEI moieties in the vicinity of the nanotubes within the amorphous matrix of the polymer as well as stretching and rapprochement of the molecules in the remainder of the amorphous matrix.
2. Materials and methods
2.1. Synthesis and characterization of the nanocomposite fibers
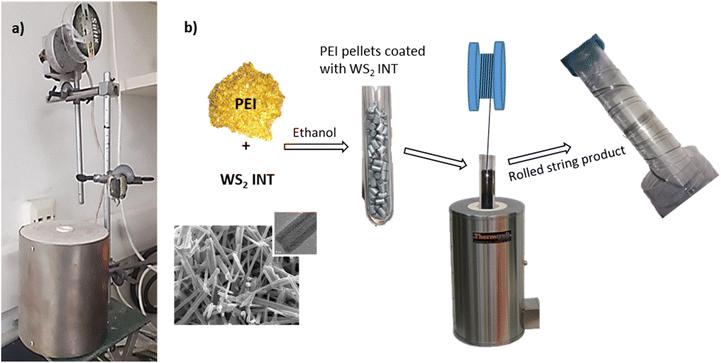
In this study, nanocomposite filaments were produced by enhancing the properties of polyetherimide (PEI) through the incorporation of WS2 nanotubes. The WS2 nanotubes utilized in this investigation were synthesized following a well-established procedure, comprehensively outlined in ref. 39 and 40. These nanotubes exhibited varying lengths (1–20 μm) and diameters (30–150 nm), as determined by careful analysis.18 Notably, Fig. S1† provides high-resolution scanning electron microscopy (SEM) and transmission electron microscopy (TEM) images, offering visualization of the WS2 nanotubes employed in this study. The structural perfection of the nanotubes is key to their reinforcement effect on the polymer matrix. In a preliminary study, the nanocomposite specimens were prepared via solvent-based method (see Fig. S2 in the ESI†), which did not result in a reinforcement effect, as discussed in the ESI.† Therefore, in the next step the nanotubes were dispersed in a molten PEI matrix, directly.41 PEI's advantageous melting temperature (approximately 340 °C) and structural resilience at temperatures below 500 °C made it an ideal candidate for this method of direct mixing with the melt.42A solution of analytical-grade ethanol (Merck) containing 1 wt% of WS2 INTs were dispersed by ultrasonic bath for minimizing agglomeration. This suspension was introduced into quartz tubes, each containing 1 g of PEI pellets (Aldrich). After low vacuum annealing at 80 °C for two days to remove ethanol and humidity, a systematic array of PEI and WS2 INTs compositions spanning concentrations from 0 to 2.0 wt% were prepared. Generally, nanotubes concentrations above 2 wt% led to their agglomeration with adverse effect on the mechanical properties of the nanocomposite.43 The quartz tubes with the specimen were inserted into a cylindrical furnace, which was preheated to 350 °C. A schematic rendering of the drawing setup of the polymer string is depicted in Fig. 1. Later, a higher temperature of 400 °C was used and found to enhance the continuity and uniformity of the manufactured strings.
After approximately one minute of heating, the material softened and transformed into a viscous resin. A slender steel needle was inserted into the softened resin and was pulled-off vertically, trailing behind it a fresh nanocomposite string. This string was then attached to a mechanized spinning wheel rotating at a velocity of approximately 4 cm s−1. It is noteworthy that the length and continuity of these nanocomposite strings exhibited an inverse correlation with the concentration of WS2 nanotubes.
A pronounced outcome of this process is the clear orientation of the WS2 nanotubes. This alignment is supposedly driven by drift flux of the molten PEI during the thread formation, which resulted in a parallel orientation of the nanotubes along the string axis.
2.2. Characterization techniques
DMA-850 (TA Instruments, New Castle, USA) apparatus equipped with film/string clamps was also used for tensile tests at ambient temperature. In some specimens, the full stress–strain curve was constructed incrementally. The load on the material was released at specific strain values, and after the string underwent elastic relaxation, the tensile test was resumed, instantaneously.
SEM images of the string cross-section area from the fractured surface were used for the calibration of the stress–strain curves. Temperature dependent mechanical properties of the strings were explored through temperature scans at a rate of 5 °C min−1, ranging from 30 to 250 °C. Furthermore, in vicinity to the expected glass-transition temperature (Tg), a finer scanning rate of 0.5 °C min−1 was employed, covering the range from 195 to 235 °C. The dynamic mechanical characteristics of the nanocomposite strings were examined also over a temperature range approaching cryogenic levels, utilizing the DMA-850 Air-Chiller System infused with liquid nitrogen. These measurements were conducted incrementally; stepping in delta of 10 °C from room temperature to −150 °C with the temperature stabilized at ±0.5 °C.
3. Results and discussion
This section is organized as follows: first the morphology of the fibers is examined via SEM and EDS mapping. Next, the mechanical properties of the polymer nanocomposite fibers are analyzed using correlative tensile tests and optical microscopy. The fibers exhibit three regimes i.e., elastic, plastic and elastoplastic domains until failure. The addition of the nanotubes leads to a remarkable increase in the ultimate strength as well as strain hardening of the fibers. The procedure for renormalization of the mechanical properties is described. Hints for the large influence of the WS2 nanotubes on the structure and mechanical properties of the nanocomposite fibers are revealed and discussed. Subsequently, three X-ray diffraction techniques are employed in order to understand the strain hardening and elucidate the major structural changes affected by the nanotubes during tensile of the nanocomposite fibers. Finally, the thermomechanical properties of the fibers are studied, and the results are discussed and correlated with the structural changes during tensile testing.3.1. Fabrication of the strings
The fabrication process of the nanocomposite strings initially involved pulling threads from a molten suspension at a temperature of 350 °C, resulting in lengthy strings with irregular cross-sectional geometries, as demonstrated in Fig. S3 of the ESI.† Subsequently, the temperature in the furnace was increased to 400 °C, revealing an improved cylindrical regularity in the cross-sectional shape of the strings.The production method in this study offers a significant advantage through the natural alignment of nanotubes within the polymer string. By pulling threads from the molten suspension, a drift flux of molten polymer aligns the nanotubes parallel to the string axis. This alignment is clearly visible in the SEM image in Fig. 2. This series of SEM images show the fractured surface in different magnifications, emphasizing the orthogonality between the surface and the aligned WS2 INTs.
Furthermore, Fig. 2c effectively demonstrates evidence for the reinforcement mechanism of the polymer within the nanocomposite matrix by displaying the pulled-out and fractured nanotubes. The figure presents three distinct failure modes of the WS2 INTs: a drawn pulled out nanotube, a truncated nanotube and an open hole from which a nanotube was dislodged, which is in fact a negative image of a pulled-out nanotube. Given the fact that the multiwall WS2 nanotubes are appreciably stronger (tensile strength of 5–20 GPa) than the PEI polymer, their fracture is a strong testimony for stress transfer from the matrix to the nanotubes and the reinforcement effect of the INTs in the nanocomposite.44,45
The long WS2 nanotube seen in Fig. 2 appears to have a conical contour, wide at the base and narrow at the broken tip. Since the nanotube itself has a cylindrical contour with a constant diameter, this figure indicates that a thin polymer film was strongly attached to the pulled-out nanotube surface. The tip suffered the highest tensile strain during the test, and consequently the polymer film there was the thinnest, which explains the conical shape of the pulled-out nanotube. Another instance of truncated nanotubes is highlighted in Fig. S4 and S5.† These images display fractured interfaces of nanocomposite string containing 0.75 wt% WS2 INTs following a rupture during tensile testing. Noticeably, the bright contrast in the center of the protruding nanostructure in Fig. S4c and S5† is a (broken) WS2 nanotube, conformably coated with a darker contour of a tightly bound polymer film 50–100 nm wide. To verify that the thin nanowhiskers protruding from the fractured surface are indeed WS2 INTs or their residue, several such threads were subjected to analysis via energy dispersive X-ray spectroscopy (EDS). An SEM image of one such example is presented in Fig. S6,† illustrating a solitary nanotube protruding from a fractured surface of a strained nanocomposite string. The EDS maps in the figure, corresponding to the SEM image, indicate an overlap of the tungsten and sulfur maps localized along the length of the nanotube, demonstrating an atom ratio S/W close to 2 (refer to the integrated table in Fig. S6†). Background carbon, iridium coating, and oxygen signals were also detected, and were disregarded for the semi-quantitative calculation of the S/W ratio. Analysis of the polymer matrix in the vicinity of the nanotubes revealed no tungsten and sulfur signal but a strong carbon signal.
The above observations hint that, while the pristine PEI is amorphous with some nanocrystalline domains, the proximate polymer film attached to the nanotubes is tightly bound and possibly well ordered. This appears to be the case also for the nanotube in Fig. S4c† on the right. This long pulled-out nanotube seems to have a base of larger diameter than the tip. This base is truncated a few hundred nm away from the polymer surface. Clearly, this breaking mode appears to follow the sword in a sheath mechanism. However, the sheath is probably a polymer film that detached from the tube, suggesting again a polymer film tightly attached to the nanotube.
Based on the SEM image in Fig. S5a,† the areal density of an individual nanotube was determined as 13.3 μm−2, exhibiting excellent agreement with theoretical predictions. The theoretical density was computed by considering the specific densities of the constituents (1.3 g cm−3 for the polymer and 7.5 g cm−3 for the nanotubes) and accounting for nanotube diameter of 0.15 μm and its mass fraction in the blend. These considerations ascertained the theoretical areal density value, which concurs with the observation in Fig. S5.†
In general, the nanotubes seem to be chemically very stable in the PEI matrix with no evidence for an interfacial chemical reaction with the polymer. However, the present analysis does not exclude the possibility that the high temperature processing of the nanotubes in the PEI matrix promoted some cross-linking between the polymer chains in the vicinity of the nanotube surface. This analysis is beyond the scope of the present work.
3.2. Mechanical strengthening of the nanocomposite strings
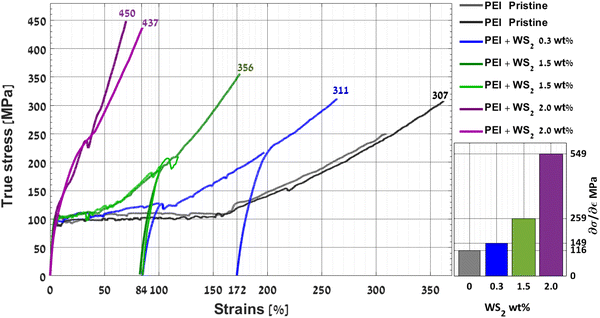
The examination of pristine PEI samples in previous studies has revealed that stress–strain curves during tensile testing manifest three domains with distinct mechanical behavior: elastic, plastic, and elastoplastic behaviors.46 In this study, tensile test measurements were conducted on both pristine PEI strings and nanocomposite strings, as depicted in Fig. S7.† The stress–strain curves for the pristine string exhibit the same three characteristic domains as reported in the literature.46 However, for nanocomposite strings, the appearance of these domains exhibits different behavior linked to the WS2 content in the strings. Fig. S7† displays stress–strain curves on an engineering scale.47 The stress is calculated based on the cross-sectional area of the post-tested broken string, determined through SEM analysis of the fracture interface. Accordingly, the endpoint of each curve, denoted as the ultimate tensile strength (UTS), represents the true stress value at the time of fracture, considering the elastic reduction of the cross-section as negligible. The true UTS for each of the measured strings is tabulated in Table 1.| dσ/dε in the elastoplastic zone [GPa] ± 3% accuracy | UTS | Young's modulus [GPa] ± 2.5% accuracy | ||||
|---|---|---|---|---|---|---|
| True stress [MPa] | Total strains | Native string | ∼84% strain | 172% strain | ||
| Pristine PEI | 0.116 | 307 | 362% | 2.95 | ||
| PEI + 0.3 wt% WS2 INT | 0.149 | 311 | 264% | 3.07 | 3.10 | 4.95 |
| PEI + 1.5 wt% WS2 INT | 0.259 | 356 | 174% | 2.86 | 3.95 | |
| PEI + 2.0 wt% WS2 INT | 0.437 | 437 | 84.9% | 3.09 | ||
| 0.662 | 450 | 69.9% | 2.98 | |||
To compare the performance of the different strings across various strain ranges, it is essential to present the measured stress–strain curves with “true stress values” as presented in Fig. 3.47 This is achieved by rescaling the stress using the “Instantaneous Area Method” with the known true UTS value.48,49 Here, the principle of volume conservation was assumed together with uniform thinning of the string in the elastoplastic domain to scale back the true stress values according to eqn (S1).† Additional details about this rescaling process are available in the ESI section SI_2a† where Fig. S8† displays three examples of the curves before and after rescaling.
The resulting true-stress–strain curves in Fig. 3 enable a comparative analysis of the influence of WS2 INTs on the mechanical behavior of the strings – both in their native state and after extensive elongation. This comparison reveals that all native strings (prior to plastic elongation) exhibited similar Young's moduli, ranging within 3.0 ± 0.15 GPa (see Table 1). Additionally, Fig. 3 demonstrates that an increased content of WS2 INTs is associated with a shortened plateau range in the plastic domain. It furthermore shows an accelerated rate of the strain-hardening in the elastoplastic domain with increasing nanotube content, leading to higher UTS values. The block diagram on the right of Fig. 3 illustrates the linearized slope dσ/dε of the stress–strain curves in the elastoplastic region.
Some of the tensile tests shown in Fig. 3 were interrupted and resumed almost instantaneously (twice for the string with 0.3 wt% and once for the string with 1.5 wt% nanotubes). These stress–relaxation cycles were conducted to examine the impact of strain hardening on the Young's moduli of the elongated strings. Fig. S9a and S9b>† illustrate the measured loads and calculated stresses, respectively, as a function of strains. The stress values are the same as in Fig. 3 and the strains were calculated based on the length of the strings at the beginning of each measurement cycle. The fitted linearized curves and slopes (Young's moduli) of the strings are also shown in the figure and are listed in Table 1. Note that the slopes of the applied load vs. strain (see Fig. S9a†) hardly changed during repeated stress–relaxation cycling of the strings, while the fitted Young's moduli of the strings increase substantially after elongation into the elastoplastic domain (owing to thinning of the string).
The Young's modulus for the native string with 0.3 wt% WS2 as shown in Fig. S9b† and tabulated in Table 1 is 3.07 GPa. The first cycle was terminated after the string was elongated to 100%, followed by an elastic contraction back to 85% upon stress release. Resuming the tensile test in the second cycle, the Young's modulus exhibited minimal change. Within this cycle, the string experienced a strain of 200%, entering the elastoplastic range of behavior (refer to Fig. 3). After stress release, it contracted back to 172%. In the third cycle, the Young's modulus increased to 4.95 GPa, indicating a growth of 62%.
A similar interruption was done during the measurement of the strings with 1.5 wt% WS2. Fig. S9† shows that in the first straining cycle a Young's modulus of 2.86 GPa was obtained. This cycle continued until the string was elongated to 100%, and upon stress release, the string contracted back to 83%. In the second straining cycle, the calculated Young's modulus was 3.95 GPa i.e., an increase of 38%.
Examining the stiffening behavior between the two strings reveals notable differences. The Young's modulus of the fiber with 0.3 wt% nanotubes exhibited an average increase of 36% for every 100% elongation, while the fiber with 1.5 wt% showed an average increase of 46% in the Young's modulus per 100% elongation. These findings emphasize the significant role of the WS2 INTs on the elastic stiffening of the structure during plastic elongation. Upon inspecting the consistent slopes in Fig. S9a†, which represent the applied load vs. strain during repeated stress–relaxation cycles, it becomes evident that the observed increase in elastic modulus is closely connected to the string's thinning due to plastic elongation. Furthermore, the fact that the string maintains its strength despite having smaller cross-sectional area suggests that the strain hardening process results in a string with more compact and denser structure with stronger intermolecular interactions.
In fact, the increase in Young's modulus during plastic elongation occurs independently of the presence of nanotubes as shown previously.46,50 This phenomenon is attributed to plastic flow, compelling the PEI chains to straighten and align parallel to the tensile force. As a result, the string undergoes thinning, forming a compacted structure that leads to an elevated Young's modulus. This compactness is also the source of strain hardening, where the long-range interaction among the aligned chains enhances polymer viscosity.50
In formulating a hypothesis regarding the role of the WS2 INTs in the accelerated strain hardening during string elongation, it is proposed that the nanotubes, with their vertically preferred orientation, obstruct the flow of shear deformations of the polymer chains. This hindrance is evident in the shortened range of isobaric plastic flow, with higher concentrations of nanotubes in the nanocomposite strings as shown in Fig. 3. Notably, the duration of this plateau shows an inverse correlation with the WS2 INTs content. For example, while the plateau lasts for over 150% strain for the pristine string, it is reduced to zero for the nanocomposite strings with 2.0 wt% WS2 INTs. In these cases, the elastoplastic mode, featuring true strain-hardening, promptly initiates after the elastic zone, without any discernible yield point. To validate this hypothesis, a more in-depth analysis of the mechanical behavior and structural modifications of the nanocomposite strings during the tensile tests, is required.
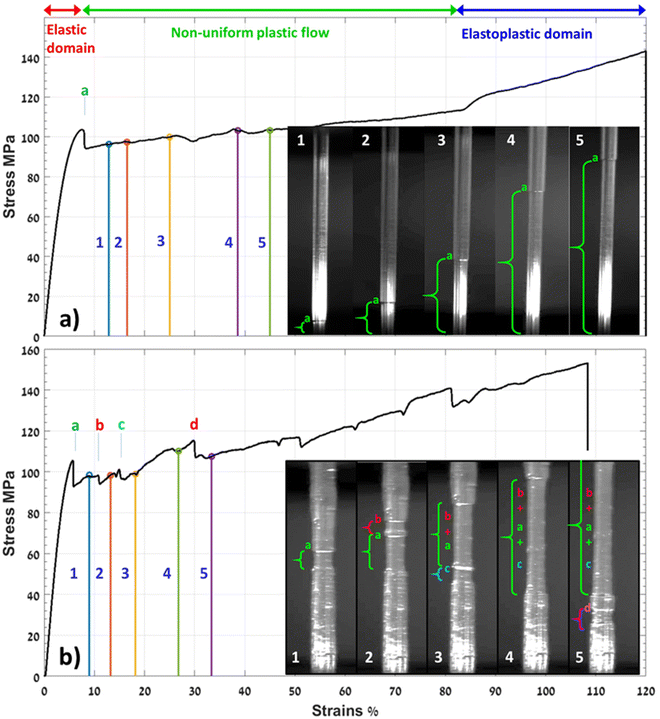
To comprehensively investigate the impact of oriented WS2 INTs on the plastic behavior of the nanocomposite strings, the dynamic response of the string was documented through video recordings during the tensile test. Engineering stress–strain curves for both the pristine PEI string and the one containing 0.5 wt% WS2 INT are depicted in Fig. 4a and b, respectively. These figures include sequences of video frames that were time-synchronized with the corresponding events in the stress–strain curves.
Analyzing the stress–strain curve of the pristine string in conjunction with visual observations during the tensile test revealed the presence of non-uniform plastic strain within the ‘isobaric flow’ range, as depicted in Fig. 4a.
The stress values depicted in Fig. 4 were computed by dividing the applied load by the initial cross-sectional area, which was approximated by measuring the diameter of the nearly cylindrical string. Inset video frames within the figure document the emergence of a localized neck and its subsequent expansion due to plastic flow. Through careful alignment of the video footage with the stress–strain curve, it was observed that plastic yielding is characterized by the formation of a distinct neck, leading to a sudden drop in the stress and local softening as described in.46,51 This softening marks the initiation of plastic shear flow. As the neck progressed upwards during the test, the strained portion beneath became thinner, while the section above the neck maintained the original diameter. This neck flow signifies the onset of strain hardening, enabling the thinned, strained section of the string, subjected to higher stresses, to retain its thickness until uniform reduction of the string's diameter was obtained. Once the entire material suffered plastic flow and thinning, elastoplastic behavior began, accompanied by a significant hardening effect. This elastoplastic behavior continued progressively until eventual failure at the ultimate tensile strength (UTS).46
In Fig. 4b, the time-synchronized results for the string with 0.5 wt% WS2 are presented. Comparing the stress–strain curves within and slightly beyond the elastic domain for the two strings (pristine and with 0.5 wt% INT) reveals a somewhat similar behavior. This similarity encompasses a similar Young's modulus and identical stress release post-yield point (Yp) attributed to plastic necking. However, unlike the pristine string, the nanocomposite one displayed accelerated strain hardening, evident in a steeper elastoplastic trend. The ultimate tensile strength (UTS) increased by 8%, while the elongation decreased by 9% for the nanotube-containing string. Another indication of accelerated strain hardening is the emergence of multiple necks during elongation. In the pristine string, a single neck could run freely, but the accelerated strain hardening in the nanocomposite seems to impede neck mobility, leading to the initiation of new necks to run instead.
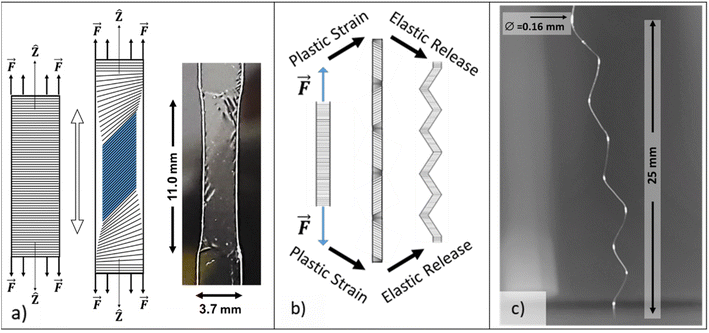
The impeding aspect, as suggested earlier, is associated with the obstruction of the shear flow by the WS2 INTs. Typically, in isotropic materials, the shear deformation begins to flow at a 45° angle with respect to the tensile axis. The sketch in Fig. 5a, illustrates necking in an isotropic sample, supported by a clear image of a pristine PEI stripe under tensile strain. The elongated stripe presented in the figure was extracted from a thin film (0.05 mm thick) of pristine PEI (Sigma-Aldrich). The formation of slip lines on the neck of the elongated PEI sample, are similar to the Lüders bands in low-carbon steels, highlighting the 45° orientation of the flow.47,52,53
As demonstrated in Fig. 5a, in the absence of impediments, like nanotubes, the shear flow with a 45° wavefront traverses the entire width of the string.54 Under uniaxial test, as the neck extends along the string, the shear wavefront adjusts its propagation course from side to side, ±45°, as depicted in Fig. 5b. This alternating pattern of the shear flow is anticipated to generate residual shear stresses between distinct sections of the strings, which become apparent in the zigzag geometry of the relaxed string. Fig. 5c presents this zigzag geometry in a fragment of pristine PEI string after it was elongated in the tensile test by 180%.
In the presence of oriented WS2 INTs, the duration of isobaric flow (characteristic of the plastic zone) was shortened, and a steeper elastoplastic trend was observed. One could argue that the hardening mechanisms involving oriented WS2 INTs originated from plastic shear deformation. This can be attributed to the significant difference between the shear moduli of PEI (1.2 GPa)46 and the WS2 INT intralayer shear modulus (C12), which is about two orders of magnitude larger.55 It is worth mentioning that the interlayer shear (sliding) modulus of WS2 (C44) – is comparable to PEI, 2 GPa.55 The higher shear modulus of the oriented nanotubes suppresses the strains in their vicinity preventing the wavefront of the shear-flow from expanding along the entire width of the string. This is manifested also through the fact that, in contrast to the pristine string that adopts a zigzag structure (Fig. 5c), the relaxed nanocomposite string remained straight. This phenomenon was studied also through numerical calculations using the shear-lag model and experimental results.56 The oriented WS2 INTs are proposed to suppress plastic shear strains due to their higher Yp, which can reach 20 GPa, exceeding the Yp of PEI by two orders of magnitudes.21 In that sense, the oriented WS2 INTs act as nano-obstacles that impede strain flow, consistent with the expected behavior of the advanced shear-lag model, which goes beyond the elastic behavior into the plastic regime.57 Consequently, as the shear flow is obstructed, the PEI chains undergo structural reorganization around the obstructing WS2 nanotubes, resulting in an oriented semi-crystalline structure in their vicinity.36 Similar π–π interactions have been described in the literature between the rings of stretched polyimide chains.58 In the present experiments the π–π stacking are organized transversely, along the orientation of the nanotubes. This new semi-crystalline structure, combined with π–π interaction and packing of the entire quasi-amorphous matrix, is assumed to be the primary cause of the observed strength enhancements and the higher ultimate tensile strength (UTS) values (see Fig. 3).
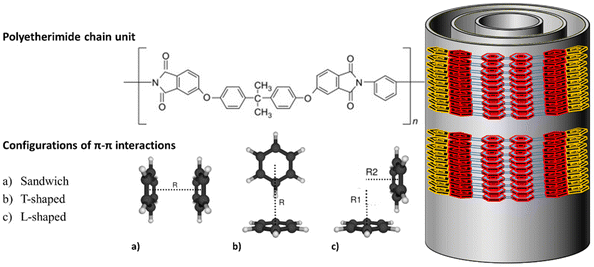
A simplified illustration is provided in Fig. 6, depicting the π–π stacking of PEI chains, forming a semi-crystalline structure. The width of the semi-crystalline film can possibly be deduced from Fig. S4c and S5† to be 50–100 nm. Therefore, it is likely that the strained composite string consists of a semi-crystalline zone surrounding the nanotubes, occupying less than 3% of the areal density. The majority of the matrix is an amorphous PEI with oriented polymer chains and embedded nanocrystalline domains, which will be discussed later in the text. The specific interaction between the polymer molecules and the nanotubes surface was not investigated and requires a specific study. Some hints to a possible carbon–sulfur interaction between PEI and WS2 nanoparticles were provided in ref. 59.
The structure and properties of PEI nanocomposites containing up to 4.4 vol% single wall carbon nanotubes (SWCNT) were studied before.60 Addition of the SWCNT led to a substantial reinforcement of the PEI, largely attributed to a highly crystalline and well adhering PEI film 8 nm thick around the nanotube. Therefore, the composite PEI consisted of two distinguished domains, a highly crystalline component surrounding the SWCNT and the rest of the polymer which remained either amorphous or semi-crystalline. The crystalline film surrounding the SWCNT disappeared upon heating the polymer beyond its melting point. More generally, a semi crystalline structure of polymer films around SWCNT induced by “soft epitaxy” between the polymer chains and the nanotubes were described in the literature as “nanohybrid shish-kebab” (NHSK) structural motif.61 The NHSK periodic motifs spanned a diameter of about 100 nm and served as a wedge leading to substantial reinforcement effect of the polymer composite. Nonetheless, the NHSK superstructures was not found for extruded poly(L)lactic acid (PLLA)-WS2 NT composite,62 which was attributed to the lack of specific interactions between the polymer chains and the nanotubes.
A substantial support for the proposed hypothesis is provided by careful examination of the magnified images in Fig. S10b and S10d.† The figures unveil distinct crater topography on the surface of the fractured nanocomposite strings. The nodular topography of the fractured surface supports the reinforcement effect achieved by incorporating the WS2 nanotubes in the amorphous PEI strings. Generally, (broken or pulled-out) nanotubes can be identified in the epicenter of each conical crater. The interlocking of polymer molecules through π–π intermolecular stacking, as well as the strong adhesion between the polymer molecules and the WS2 INTs contribute to the remarkable forces required to dislodge the nanotubes from the PEI matrix. The presence of characteristic craters with nodular topography surrounding the uprooted nanotubes serves as clear evidence for stress concentration.63 In contrast, the ruptured interface of the pristine PEI string (Fig. S3a†) lacks such craters’ topography, emphasizing the distinctive feature introduced by the insertion of WS2 INTs. An additional contribution of WS2 INTs to the robustness of the nanocomposite string could be associated with the resistance to the progression of cracks. Fig. S11† effectively demonstrates how the nanotubes could hinder the propagation of cracks within the nanocomposite matrix.64 An investigation into the microstructural disparities between neat PEI and its nanocomposite can offer valuable insights into the mechanisms underlying the enhanced performance of the nanocomposite material.
The forthcoming XRD studies offer additional support for the rearrangement of the PEI molecules around the nanotubes into a semi-crystalline structure.
3.3. X-ray diffraction analysis
To explore the amorphous structure of PEI and investigate the effects of incorporating WS2 nanotubes into the matrix, a series of XRD tests were conducted on bundles of strings with identical compositions. The aim was to scrutinize the structural alterations in the strings before and after the application of tensile elongation. The experimental setup encompassed two modes of analysis: reflection and transmission. In the reflection mode, the strings were set on the XRD stage plane, aligned perpendicular to the X-ray trajectory, as illustrated in Fig. 7a. In the transmission mode, the strings were oriented normal to the XRD stage, as depicted in Fig. 7b.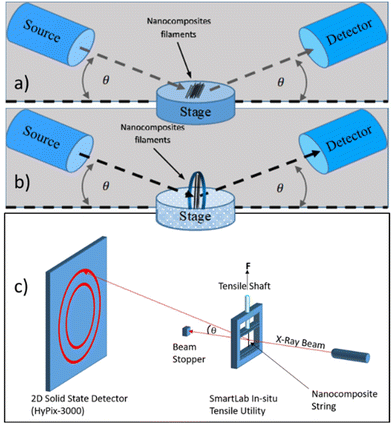 | ||
| Fig. 7 (a) Schematic sketch of the X-ray apparatus setup in reflection mode, and (b) in transmission mode. (c) Schematics of the WAXS apparatus and the stage with SmartLab ISTU. | ||
In conjunction with the XRD tests, angular data for individual strings were acquired through wide-angle X-ray scattering (WAXS) tests. The experimental arrangement for these measurements is depicted in Fig. 7c. The analyzed strings underwent incremental elongation using the SmartLab ISTU in sequential steps until failure ensued. Following each elongation step, the stretched string underwent a WAXS measurement.
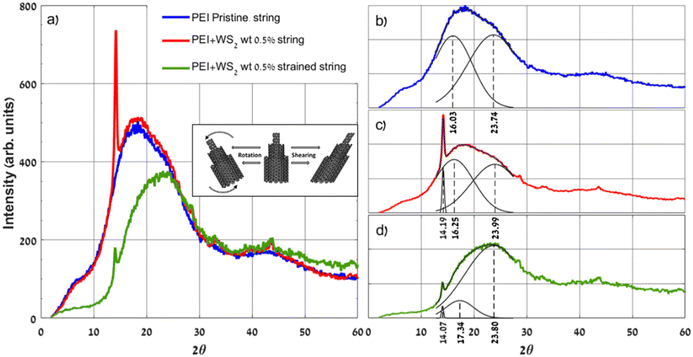
Before delving into the XRD analysis of a specific composition, it is prudent to initially examine the pattern variations among freshly prepared nanocomposite strings, each containing varying quantities of WS2 INTs. As depicted in Fig. S12,† all the patterns in the figure exhibit a similar broad scattering pattern, characteristic of the PEI amorphous structure as published before.65–67 However, the XRD patterns of the nanocomposite string include additional peaks corresponding to WS2 nanotubes. Notably, a prominent peak at 14.2° (6.3 Å) is attributed to the WS2 (002) plane.68,69 The heightened intensity of this peak is ascribed to the alignment of the nanotubes along the string axis and to the ratio of WS2 in the string composition (refer to the inset in Fig. S12†). Typically, the XRD pattern of amorphous PEI (Fig. 8a) reveals three main regions with distinctive features: a shallow knee around 2θ = 5.0°, with a spacing of 17.7 Å;36,70,71 an asymmetrical hump around 2θ = 18.0°;72,73 and higher scattering orders with 2θ values ranging from 30.0° to 50.0°. The XRD pattern of the pristine PEI strings resembles the patterns of Ultem1000 in.66,74
Deconvolution of the main peaks of the pristine species alongside the PEI with 0.5 wt% WS2 INT strings before and after prolonged elongation, are shown in Fig. 8b–d.
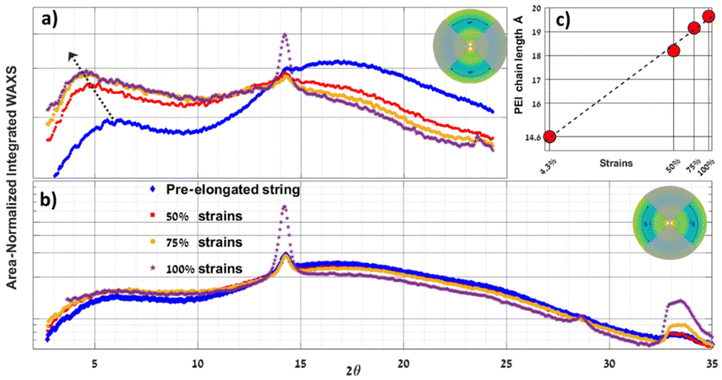
Examination of the XRD patterns in Fig. 8a reveals both the similarity of the native string patterns and changes resulting from prolonged elongation of the nanocomposite string. First, one notices the reduction of the faint shallow knee located at 2θ = 6.3°. This knee is associated with the relaxed state of the PEI's chain units, which possesses a wrinkled and entangled configuration, correlating with a d-space of 14.0 Å. After elongation, this knee appears to shift leftward and diminish as the polymer chains become taut in parallel to the elongation axis.36 These induced changes in the long-order structures are less noticeable using the XRD reflection mode and will be examined carefully in the next paragraph through WAXS measurements.
To explore the changes in the asymmetric central hump, the raw data of each pattern were normalized and deconvoluted separately. The deconvolution of the pristine string pattern (see Fig. 8b) reveals two well-balanced Gaussians with characteristic distances of 5.54 ± 0.08 Å (16.0°) and 3.76 ± 0.07 Å (23.7°). These distances are associated, respectively, with two major configurations representing π–π interactions of the intermolecular phenyl rings see Fig. 6, namely the L-shape configuration and the parallel face-to-face configuration.64,73,76,77 These two broad peaks can be attributed to nanocrystalline domains exiting in the overall amorphous phase of the PEI.
A similar analysis was performed for the pattern of the nanocomposite strings containing 0.5 wt% WS2 INTs (see Fig. 8c), resulting in two comparably centered Gaussians (d-spacings of 5.46 ± 0.08 Å and 3.72 ± 0.07 Å), along with an additional Lorentzian to account for the WS2 (002) main peak. The center of the Lorentzian was found at 2θ = 14.19° (equivalent to a d-spacing of 6.25 Å).68,69 Similarly, analyzing the nanocomposite pattern after prolonged elongation (>100%) reveals major structural transformation (see Fig. 8d). It is observed that the d-spacing of the PEI chains (π–π interaction with L-configuration) experiences a shift from 2θ = 16.25° (5.54 ± 0.08 Å) in the native string to 17.34° (5.12 ± 0.02 Å) after elongation. The narrowing of the peak width at half maximum (FWHM) indicates that the average size of the nanocrystalline domains in the amorphous matrix was increased upon pulling. A straightforward interpretation suggests that the L-shape configuration (Fig. 6c) in the amorphous matrix becomes less favorable than the parallel configuration of the rings (Fig. 6a) in the elongated string. Consequently, the influence of the nanotubes is not limited to the proximate PEI film attached to their surface. Rather, the nanotubes affect the structure of the entire PEI matrix of the string, which undergoes major structural reorganization under tensile strain.
Furthermore, a significant reduction in the intensity of the WS2 (002) peak at 2θ = 14.07° becomes evident (refer to Fig. 8a). This intensity reduction is attributed to a substantial reorientation of the WS2 nanotubes, causing them to deviate from being aligned with the trajectory plane of the X-ray. Initially, these nanotubes were oriented parallel to the axial direction of the string. However, due to the substantial shear strains generated during the stretching of string, these nanotubes appear to adopt a tilted orientation. As depicted in the inset of Fig. 8a, slanting in the nanotubes can occur through two shear mechanisms: extensive shear of the PEI matrix, where macro PEI domains of the string rotate with the inserted undeformed nanotubes, or direct shearing of the nanotube, resulting in the reduced (002) peak intensity. To understand the impact of plastic strain on the nanocomposite's structure, the patterns in Fig. 8 were deconvoluted, and the results of this analysis are summarized in Table 2.
| Deconvoluted peaks | WS2 (002) | π–π interaction L-shape configuration | π–π interaction parallel face-to-face configuration | |||
|---|---|---|---|---|---|---|
| 2θ | Deconvolution partial area (%) | 2θ (d-spacing) [Å] | Deconvolution partial area (%) | 2θ (d-spacing) [Å] | Deconvolution partial area (%) | |
| Pristine PEI string | None | 0 | 16.03° (5.52 ± 0.08) | 44 | 23.74° (3.74 ± 0.07) | 56 |
| PEI + 0.5 wt% WS2 INT | 14.19° | 2 | 16.25° (5.45 ± 0.08) | 48 | 23.99° (3.70 ± 0.07) | 50 |
| Strained PEI + 0.5 wt% WS2 INT | 14.07 ± 0.2° | 1 | 17.34° (5.11 ± 0.02) | 13 | 23.88° (3.72 ± 0.04) | 86 |
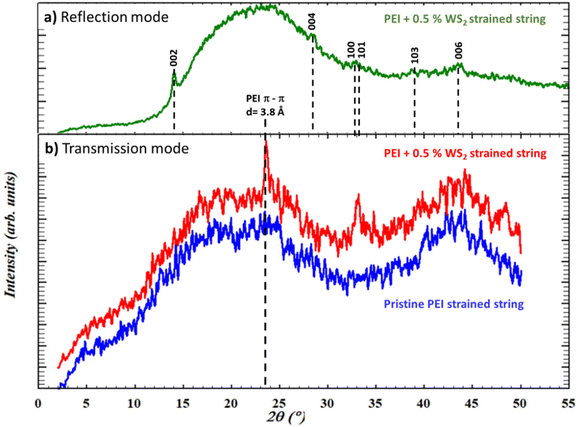
| Strained PEI + 0.5 wt% WS2 INTs transmission | None | 0 | 17.18° (5.15 ± 0.07) | 3 | 23.12° (3.84 ± 0.03) | 96 |
| 23.61° (3.76 ± 0.04) | 1 | |||||
Deeper insight into the impact of the plastic strain on the nanocomposite's structure was obtained by applying transmission XRD measurements to pristine PEI strings and nanocomposite strings containing 0.5 wt% WS2 INTs. The transmission X-ray setup is depicted in Fig. 7b. A reflection X-ray analysis of the last string is also displayed (Fig. 9a), for the sake of comparison between the results obtained by the two XRD methods. The analysis of pristine PEI strings and nanocomposite strings containing 0.5 wt% WS2 INTs, after prolonged elongation (>100%) are shown in Fig. 9b. It is worth noting that the absence of the (002) WS2 peak at 14.1° and its higher-order harmonics in the transmitted pattern of the nanocomposite string (see Fig. 9b) is well justified due to the nanotubes’ orientation with respect to the X-ray beam.
After the tensile test and extended elongation (>100%), the XRD patterns in Fig. 9a revealed the emergence of a new sharp peak at 23.61° (3.76 Å), exclusively for the nanocomposite string. This finding strongly supports the existence of a semi-crystalline phase induced by the π–π stacking of the phenyl rings in PEI chains, which adopt a parallel face-to-face configuration.36,66,73,75,76 The reassembled preferred orientation of this phase aligns well with the suggested reorganization of this phase wrapping the WS2 nanotube,58 as illustrated schematically in Fig. 6.
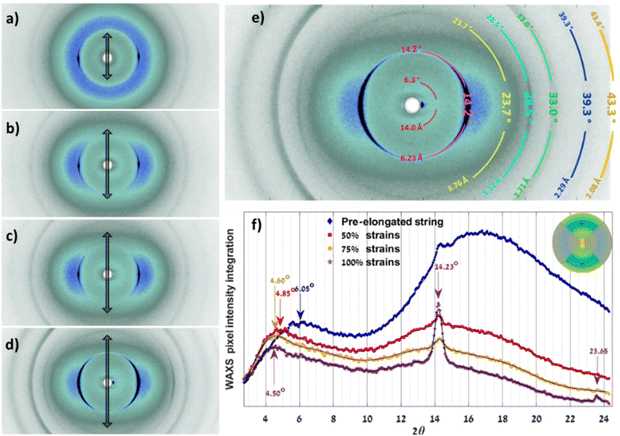
For further elucidation of the emerging semi-crystalline phase, WAXS measurements were carried out using the SmartLab ISTU, as depicted in Fig. 7c. The experimental approach involved subjecting a single string to incremental tensile strain in steps of 25% until it reached the point of failure. Following each successive elongation step, the corresponding WAXS data were recorded for the individual string. The resulting WAXS patterns obtained by applying this methodology to a nanocomposite string containing 1.5 wt% WS2 are presented in Fig. 10a–d. The final WAXS pattern, after 100% elongation, is magnified in Fig. 10e, facilitating the discernment of key features in the pattern. Circular segments are used to emphasize specific 2θ values, representing the angle between the incident and scattered X-ray beams.
To gain a deeper understanding of the structural alterations during elongation, intensity graphs were constructed in Fig. 10f. The height of each point on the curves corresponds to the summation of intensities along ±45° of specific segments around the vertical axis of the WAXS patterns. The 2θ values were determined by the radii of the summed segments. The specific analyzed areas are highlighted in the inset of Fig. 10f. A similar summation of the intensities of the X-ray scattered beams was performed around the equatorial axis.
The variations observed between the curves in Fig. 10f, resulting from plastic elongation, stem from two sources. Firstly, there is a structural reorganization of the polymer molecules upon straining of the string. Secondly, the scattered intensities by the string decrease owing to its reduced diameter as it becomes thinner with each successive elongation step. In the effort to investigate the effect of the structural reorganization of the molecules, the effect of the reduced cross-section of the string has been eliminated via a normalization procedure. This was achieved by dividing each point in the curves by the integrated area beneath the curve. The resulting normalized curves for both sections of analysis, around the vertical and equatorial axes, are presented in Fig. 11a and b.
Several significant structural changes in the nanocomposite strings during tensile deformation become apparent from Fig. 10 and 11. The following discussion elaborates on the key findings from this analysis, supported by results from other XRD methods:
(a) The first WAXS pattern (Fig. 10a) belongs to the nanocomposite string in minimal tension, which is virtually its native state. The pattern of the native string exhibits circular symmetry, attributed to the amorphous structure of the PEI, and it displays narrow patterns corresponding to the circumferential shells of the axially oriented WS2 nanotubes. Among these, the two mirrored isolated (dark) spots on the equatorial axis (14.2°) are notable and are associated with the WS2 (002) planes.
(b) As plastic strain increases during string elongation, the WAXS pattern undergoes a gradual transition from its initial circular symmetry, characteristic of amorphous PEI, to a two-fold mirror symmetry pattern marked by a growing eccentricity with increased strains. This transformation is the result of the reconfiguration of the polymer chains in the majority (amorphous) phase, aligning along the axial orientation of the string and densely packing in the transverse (radial) direction.36,58 An in-depth analysis of the changes in the patterns in Fig. 10 provides a broader perspective on the evolution of the nanocomposite structure.
Summing the WAXS pattern within ±45° around the vertical axis (Fig. 10f) reveals the reorganization of the polymer chains along the axial direction of the string upon strain. The observed faint knee shift, from 6.05° to 4.5° after 100% elongation, signifying substantial changes in the d-spacing (14.4 Å to 20.1 Å), corresponding to a cumulative 44% extension of the PEI chains upon strain. The augmented relative intensities of the maxima in the normalized curves (Fig. 11a) reflect the increased order in the oriented PEI chains. Fig. 11c shows a linear variation of the d-spacing with the elongation presented in a semi-logarithmic (x-axis) scale.
In Fig. 11a, all curves intersect at 2θ = 13°, defining a kind of an ‘isosbestic point’ that marks the transition between two regions with opposing trends during elongation. The first region, preceding this point, shows increasing intensities in the normalized curves, while the second region, for higher 2θ values, exhibits the opposite trend. Both trends result from the straightening of the initially wrinkled and entangled PEI chains in response to the axial strain. The only exception to the monotonic trend of diminishing intensity above 2θ = 13° is around 2θ = 23.65°, corresponding to the new semi-crystalline phase of stacked π–π interacting phenyl rings of the ordered PEI molecules surrounding the nanotubes, as depicted schematically in Fig. 6.
The analyzed data around the equatorial axis in the WAXS patterns are presented in Fig. 11b. It is worth noting that the curves taken after each step of elongation maintain their overall shape throughout the tensile process, albeit with some observed differences in the peaks of the WS2 INTs. The similarity between the curves in Fig. 11b indicates that the structure of the amorphous PEI phase, oriented toward the radial axis, does not exhibit discernible variations upon straining.
(c) As the nanocomposite string undergoes elongation and experiences increasing plastic deformation, noticeable changes in the orientations of the WS2 nanotubes and the attached thin polymer film become apparent. Under the combined influence of tensile and shear strain, the nanotubes incline relative to the string axis, as illustrated in Fig. 8a (inset). The sequential WAXS patterns in Fig. 10 show distinct changes corresponding to the WS2 (002) planes (14.2°). The initially focused pair of peaks disperses into a broader ring as the string elongates. The findings in Fig. 11b support this observation; the intensity of the WS2 (002) peak remains relatively unchanged up to a 75% strain, while concurrently the peaks around 2θ = 33° increase. These additional peaks correspond to the (100) and (101) sets of planes, which were initially less visible in the original configuration due to the preferred nanotubes orientation. The rise in intensity of these peaks with further elongation can be attributed to a slanted reorientation of the nanotubes induced by the prevailing shear strains.
(d) Exploring WAXS measurements of an individual nanocomposite string after extended elongation of 100% could enhance our understanding of the strain mechanism. Furthermore, it could reveal the synergistic effects between plastic strains and oriented WS2 nanotubes, which lead to improved mechanical properties of the string. The WAXS patterns in Fig. 10 show that as the string elongates, a new peak gradually emerges at 23.65°. This peak was previously identified in Fig. 9b and is attributed to the tightly bound and semi-crystalline polymer film with strong π–π interactions between the phenyl rings of adjacent polymer chains. These interactions maintain a face-to-face configuration, resulting in a specific d-spacing of 3.76 Å. The information in Fig. 10e is attributed to the semi-crystalline structure in a predominantly vertical orientation of the string and the direction of the strain. In proximity to the vertical axis, the pattern associated with this structure sharpens, while in other orientations, it remains blurred, indicating a lack of crystallinity. The fact that this semi-crystalline structure's peak is only observed in elongated nanocomposite strings and not in pristine PEI strings makes a compelling evidence of the WS2 nanotubes’ contribution to the string's mechanical resilience.
3.4. Dynamic mechanical analysis
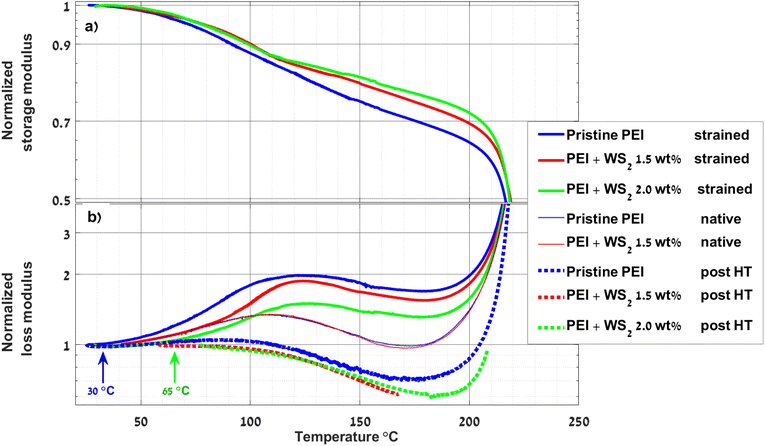
Dynamic mechanical analysis (DMA) tests were conducted on the nanocomposite strings across a wide temperature range (−120 to 235 °C). The storage modulus (E′), loss modulus (E′′), and their ratio tan(δ) were measured during dynamic stress oscillation at a frequency of 1 Hz. Fig. S13† shows the measured E′ for pristine PEI string in the full range, and for nanocomposite strings in the limited range of −150 to 25 °C. The results for the pristine PEI string demonstrate a linear trend of 6.5 MPa °C−1 over a substantial temperature range (−120 to 120 °C). Fig. S14† displays the measured data for E′, E′′ after normalization by their maximum value and their ratio-tan(δ). The table in the inset provides details about the glass transition temperature (Tg) of the strings. The Tg does not vary much with the concentration of the nanotubes, which is comparable to the value (Tg = 215 °C) reported in.46 Overall, no significant correlations are found between the dynamic mechanical behavior of the strings in their native state and the quantity of WS2 INTs.Following this, additional investigation was conducted to determine the effect of the added WS2 INTs after substantial elongation of the strings. The DMA was measured for the pristine PEI string and the nanocomposite strings containing 1.5 and 2.0 wt% WS2 INTs. The storage moduli (E′) are presented in Fig. 12a, after normalization to the maximum value. Fig. 12b presents the normalized loss modulus (E′′) for the strings in the native form (before elongation); for elongated strings and the same strings after thermal treatment for 15 min above Tg.
The storage modulus for the nanocomposite strings (E′) in Fig. 12a exhibits a distinct characteristic. As expected, the stiffness of the strings decreases with increasing temperature, but the rate of decay appears to be influenced by the quantity of WS2 INTs. Thus, increasing the nanotube content in the string reduces the rate of decay of E′ with temperature. This observation indicates that the semicrystalline order in the PEI domains increases with the nanotubes content and its melting is therefore slower upon heating. This dependence becomes more evident when inspecting the results of the loss modulus (E′′) in Fig. 12b. All the curves for the elongated strings show a subtle peak at 124 °C, indicating the “structural melting” of the ordered phenyl rings, which is induced by the π–π interactions.78,79 The same measurement for the strings before elongation or after heat treatment reveals major difference compared to the elongated strings. First, the maxima of the native and heat-treated samples are observed at lower temperatures of 109 °C and 90 °C, respectively, compared with the elongated stings. Furthermore, the “structure melting” peak at 124 °C is more prominent for the elongated strings (thick curves) than for the native and postheated strings (thin and dashed curves, respectively). This observation can be attributed to larger dissipative energy of the elongated strings during “structural melting” of the DMA analyzed specimen. Another related observation is the point at which the E′′ curve of the strained (continuous curve) and the non-strained-native strings (dashed curve) start to depart from each other. For the pristine string (blue curves) this temperature is below 30 °C. For strings with 2 wt% nanotubes (green curves), this temperature is about 65 °C. In Fig. 12b blue and green arrows mark the departing temperatures, for the pristine PEI string and for the nanocomposite string, respectively. This difference of about 35 °C is a testimony for the higher crystalline order of the polymer molecules in the strained compared to the native (unstrained) strings. All these trends can be interpreted as a manifestation of the π–π stacking and their strengthening effect, indicating that higher temperatures are required for the “structural melting” of the elongated (strain hardened) strings. The specific interaction between the PEI molecules and the WS2 nanotubes surface could also influence the results of the DMA analysis but was not investigated in sufficient detail in order to make specific conclusions. These findings underscore also the significant role of WS2 nanotubes in enhancing the structural order and strength of the nanocomposite strings.
3.5. Raman spectroscopy
Raman spectra of both the pristine and nanocomposite (0.75 wt% WS2 INT) strings are presented in Fig. S15.† Notably, the peaks at 357.4 cm−1 and 422.4 cm−1 corresponding to the E2g1 and A1g vibrational modes of WS2 are evident in the nanocomposite string.80,81 Upon comparing the spectra of the various strings in Fig. S15,† no noticeable differences are observed with respect to the peaks associated with the vibrational modes of PEI, despite the presence of WS2 INT. In some analogy to the DMA results, also here attempt is made to seek for shifts in the Raman spectra due to the substantial elongation of the strings.Comparing the Raman spectra of the strings before and after elongation revealed discernible differences. A subtle yet noticeable redshift was detected in peaks associated with the breathing mode of the meta substituted etheric phenyl rings at 1005 cm−1 as demonstrated in Fig. S16.†![[thin space (1/6-em)]](https://www.rsc.org/images/entities/char_2009.gif) 82 This peak exhibited a redshift of 1.2 cm−1 in the native fiber after straining. The strained nanocomposite string (0.75 wt% WS2 INT) exhibited a somewhat smaller redshift (0.65 cm−1). Further extensive research is required to gain a deeper understanding of how the incorporated WS2 INTs affects the Raman spectra of the nanocomposite strings.
82 This peak exhibited a redshift of 1.2 cm−1 in the native fiber after straining. The strained nanocomposite string (0.75 wt% WS2 INT) exhibited a somewhat smaller redshift (0.65 cm−1). Further extensive research is required to gain a deeper understanding of how the incorporated WS2 INTs affects the Raman spectra of the nanocomposite strings.
4. Conclusions
This study focused on the production, mechanical reinforcement, and the structural rearrangements of nanocomposite strings composed of polyetherimide (PEI) and WS2 nanotubes. The strings were prepared by extraction of PEI threads from a molten nanocomposite resin. The threading of the molten polymer strings led to axially oriented nanotubes in the strings and remarkable changes in the mechanical properties of the strings. The strings exhibited three domains during stress–strain tests: elastic, plastic and elastoplastic. While pristine strings displayed strains of greater than 350%, the plastic zone of the nanocomposite strings diminished gradually with increasing concentration of the nanotubes, and they exhibited appreciable strain hardening in the elastoplastic range. Real-time observations unveiled accelerated strain hardening of the nanocomposite strings, attributed to strong π–π interactions between the PEI chains, which was facilitated by the axially oriented WS2 nanotubes. X-ray diffraction analysis indicated a reduction in the interlayer spacing between the phenyl rings of the PEI chains upon elongation, with the concurrent formation of a semi-crystalline structure around the WS2 nanotubes, further enhancing the nanocomposite's strength. A back-of-the-envelope calculation indicates that the semi-crystalline phase of the PEI sheathing the nanotubes constitutes less than 3% of the nanocomposite areal density, with the bulk being composed of an amorphous PEI phase featuring nanocrystalline domains. The analysis revealed also that the PEI molecules in the bulk are wrinkled and entangled in the native strings. Following the tensile test, they adopt a straightened and elongated shape getting closer to each other. These changes make the string structure more compact and induce its hardening. Moreover, upon releasing the strain of pristine strings they were found to adopt a repeating zigzag pattern. Furthermore, optical imaging of strained pristine PEI strips revealed bands tilted at 45° with respect to the tensile axis. As for the nanocomposite strings, clear evidence has been obtained from WAXS analysis that the shear flow of the polymer chains during straining induced tilting of the nanotubes.Dynamic mechanical analysis (DMA) demonstrated comparable thermal stability between pristine PEI and the nanocomposite strings in their native state. However, after subjecting the strings to elongation and shear strain, the DMA results highlight the improved thermal stability of the strain-induced semi-crystalline structure phase. The Raman data of the nanocomposite strings also detect the strengthening effect of the plastic strain. Nonetheless, no detectable differences were found due to the existence of WS2 nanotubes. These findings underscore the substantial potential of nanocomposites reinforced with WS2 INTs. It furthermore offers new avenues for the development of advanced polymer materials in various fields, including aerospace, automotive, and structural applications, where enhanced mechanical properties and thermal stability are paramount.
Author contributions
DB – data curation (2), formal analysis (2), investigation (5), software (9), visualization (12), writing (14). IP – data curation (2), investigation (5), resources (8), validation (11). DN – conceptualization (1), funding acquisition (4), methodology (6), project administration (7), resources (8), supervision (10), validation (11), writing (13). RT – (5) investigation, methodology (6), supervision (10), validation (11), writing (13), writing (14).Conflicts of interest
There are no conflicts to declare.Acknowledgements
We thank Dr Y. Feldman for the assistance with the XRD analysis. We also acknowledge the assistance of Dr I. Kaplan-Ashiri with the SEM-EDS analysis. RT acknowledges the support of The Estate of Manfred Hecht and the Estate of Diane Recanati. The Perlman Family Foundation, and the Kimmel Center for Nanoscale Science are greatly acknowledged. IP is the incumbent of the Sharon Zuckerman research fellow chair.References
- F. Lossada, D. Hoenders, J. Guo, D. Jiao and A. Walther, Acc. Chem. Res., 2020, 53(11), 2622–2635 CrossRef CAS PubMed.
- J. Huang, J. Zhou and M. Liu, JACS Au, 2022, 2(2), 280–291 CrossRef CAS PubMed.
- A. C. Balazs, T. Emrick and T. P. Russell, Science, 2006, 314(5802), 1107–1110 CrossRef CAS PubMed.
- S. K. Kumar, B. C. Benicewicz, R. A. Vaia and K. I. Winey, Macromolecules, 2017, 50(3), 714–731 CrossRef CAS.
- T. Verho, M. Karesoja, P. Das, L. Martikainen, R. Lund, A. Alegría, A. Walther and O. Ikkala, Adv. Mater., 2013, 25(26), 5055–5059 CrossRef CAS PubMed.
- D. Feldman, J. Macromol. Sci., Part A: Pure Appl. Chem., 2016, 53(1), 55–62 CrossRef CAS.
- H. Luo, X. Zhou, C. Ellingford, Y. Zhang, S. Chen, K. Zhou, D. Zhang, C. R. Bowen and C. Wan, Chem. Soc. Rev., 2019, 48(12), 4424–4465 RSC.
- M. Bhattacharya, Materials, 2016, 9, 262 CrossRef PubMed.
- F. Shaoyun, S. Zheng, H. Pei, L. Yuanqing and H. Ning, Nano Mater. Sci., 2019, 1, 2–30 CrossRef.
- D. G. Papageorgiou, Z. Li, M. Liu, I. A. Kinloch and R. J. Young, Nanoscale, 2020, 12(4), 2228–2267 RSC.
- M. Moniruzzaman and K. I. Winey, Macromolecules, 2006, 39(16), 5194–5205 CrossRef CAS.
- J. Amraei, J. E. Jam, B. Arab and R. D. Firouz-Abadi, Polym. Compos., 2019, 40, E1219–E1234 CAS.
- P. C. Ma, N. A. Siddiqui, G. Marom and J. K. Kim, Composites, Part A, 2010, 41(10), 1345–1367 CrossRef.
- O. Lourie, D. M. Cox and H. D. Wagner, Phys. Rev. Lett., 1998, 81(8), 1638 CrossRef CAS.
- X. Sun, C. Huang, L. Wang, L. Liang, Y. Cheng, W. Fei and Y. Li, Adv. Mater., 2021, 33(6), 2001105 CrossRef CAS PubMed.
- T. Ramanathan, A. A. Abdala, S. Stankovich, D. A. Dikin, M. Herrera-Alonso, R. D. Piner, D. H. Adamson, H. C. Schniepp, X. Chen, R. S. Ruoff, S. T. Nguyen, I. A. Aksay, R. K. Prud'Homme and L. C. Brinson, Nat. Nanotechnol., 2008, 3(6), 327–331 CrossRef CAS PubMed.
- Y. Cui, S. Kundalwal and S. Kumar, Carbon, 2016, 98, 313–333 CrossRef CAS.
- O. Golan, H. Shalom, I. Kaplan-Ashiri, S. R. Cohen, Y. Feldman, I. Pinkas, R. Ofek Almog, A. Zak and R. Tenne, Polymer, 2021, 13, 3851 CAS.
- S. Paszkiewicz, A. Szymczyk, I. Janowska, R. Jedrzejewski, A. Linares, T. A. Ezquerra, H. D. Wagner, R. Tenne and Z. Rosłaniec, Polym. Adv. Technol., 2017, 28, 645–657 CrossRef CAS.
- S. Ghosh, G. Otorgust, A. Idelevich, O. Regev, I. Lapsker, D. Y. Lewitus and A. Zak, Compos. Sci. Technol., 2021, 207, 108736 CrossRef CAS.
- D. M. Tang, X. Wei, M. S. Wang, N. Kawamoto, Y. Bando, C. Zhi, M. Mitome, A. Zak, R. Tenne and D. Golberg, Nano Lett., 2013, 13(3), 1034–1040 CrossRef CAS PubMed.
- M. Pardo, T. Shuster-Meiseles, S. Levin-Zaidman, A. Rudich and Y. Rudich, Environ. Sci. Technol., 2014, 48(6), 3457–3466 CrossRef CAS PubMed.
- K. Ramachandran, Z. Shao, T. Di Luccio, B. Shen, E. E. R. Bello, L. Tammaro, F. Villani, F. Loffredo, C. Borriello, F. Di Benedetto, E. Magee, T. McNally and J. A. Kornfield, Acta Biomater., 2022, 138, 313–326 CrossRef CAS PubMed.
- H. Shalom, S. Kapishnikov, V. Brumfeld, N. Naveh, R. Tenne and N. Lachman, Sci. Rep., 2020, 10(1), 88–92 CrossRef PubMed.
- N. Yosef Tal, H. Dodiuk, S. Farran, R. Carmieli, I. Pinkas, S. Kenig and R. Tenne, ACS Appl. Polym. Mater., 2024, 6(6), 3303–3315 CrossRef CAS.
- Y. Alqaheem and A. Alomair, J. Chin. Chem. Soc., 2019, 66(12), 1738–1744 CrossRef CAS.
- R. O. Johnson and H. S. Burlhis, J. Appl. Polym. Sci.: Appl. Polym. Symp., 1983, 70(1), 129–143 CrossRef CAS.
- M. Davies, J. N. Hayf and B. Woodfine, High Perform. Polym., 1993, 5, 37–45 CrossRef CAS.
- Y. F. Lv, W. Thomas, R. Chalk and S. Singamneni, Mater. Today: Proc., 2020, 33, 5720–5724 CAS.
- H. Wu, M. Sulkis, J. Driver, A. Saade-Castillo, A. Thompson and J. H. Koo, Addit. Manuf., 2018, 24, 298–306 CAS.
- C. Cho, S. L. Nam, A. P. de la Mata, J. J. Harynuk, A. L. Elias, H. J. Chung and P. I. Dolez, J. Appl. Polym. Sci., 2022, 139(15), 51955 CrossRef CAS.
- V. S. Vakharia, H. Leonard, M. Singh and M. C. Halbig, Polymer, 2023, 15(3), 561 CAS.
- W. W. Lin and E. Savrun, MRS Online Proc. Libr., 1995, 390, 111 CrossRef CAS.
- X. M. Zhang, J. G. Liu and S. Y. Yang, Rev. Adv. Mater. Sci., 2016, 46(1), 22–38 CAS.
- B. Ying, H. Wang, Z. Yu, X. Xu, X. Liu, S. Liu, D. Zeng, R. Li and Y. Qin, Surf. Interfaces, 2023, 43, 103588 CrossRef CAS.
- J. Lee, Y. E. Kim, G. Lee, M. J. Kim, Y. Eom and H. G. Chae, Compos. Sci. Technol., 2020, 200, 108452 CrossRef CAS.
- M. K. Pitchan, S. Bhowmik, M. Balachandran and M. Abraham, Composites, Part A, 2016, 90, 147–160 CrossRef CAS.
- A. Kausar and M. Siddiq, Int. J. Polym. Anal. Charact., 2016, 21(5), 436–446 CrossRef CAS.
- P. Chithaiah, S. Ghosh, A. Idelevich, L. Rovinsky, T. Livneh and A. Zak, ACS Nano, 2020, 14, 3004–3016 CrossRef CAS PubMed.
- A. Zak, L. Sallacan-Ecker, A. Margolin, M. Genut and R. Tenne, Nano, 2009, 4(02), 91–98 CrossRef CAS.
- A. I. Isayev, R. Kumar and T. M. Lewis, Polymer, 2009, 50, 250–260 CrossRef CAS.
- S. M. Pasini, M. A. Batistella, S. Souza, M. G. Ulson, J. Wang, D. Hotza and A. U. Souza, Polym. Bull., 2020, 77, 4937–4958 CrossRef CAS.
- M. Naffakh and A. M. Díez-Pascual, Inorganics, 2014, 2(2), 291–312 CrossRef CAS.
- I. Kaplan-Ashiri, S. R. Cohen, K. Gartsman, V. Ivanovskaya, T. Heine, G. Seifert, I. Wiesel, H. D. Wagner and R. Tenne, Proc. Natl. Acad. Sci. U. S. A., 2006, 103, 523–528 CrossRef CAS PubMed.
- D. M. Tang, X. Wei, M. S. Wang, N. Kawamoto, Y. Bando, C. Zhi, M. Mitome, A. Zak, R. Tenne and D. Golberg, Nano Lett., 2013, 13, 1034–1040 CrossRef CAS PubMed.
- B. Zuanetti, N. Mutter and A. P. Gordon, Mater. Perform. Charact., 2014, 3(1), 178–203 CrossRef CAS.
- Atlas of stress-strain curves, ed. C. Moosbrugger, International ASM, 2nd edn, 2002. ISBN: 0-87170-739-X Search PubMed.
- H. Wang, D. Jiang, L. Zhang and B. Liu, J. Appl. Mech., 2017, 84(11), 111009 CrossRef.
- H. Ho, T. Xiao, C. Chen and K. Chung, J. Phys.: Conf. Ser., 2021, 1777, 012070 CrossRef CAS.
- D. K. Mahajan and S. Basu, Modell. Simul. Mater. Sci. Eng., 2010, 18(2), 025001 CrossRef.
- N. Brown and I. Ward, J. Polym. Sci., Polym. Phys. Ed., 1968, 6(3), 607–620 CAS.
- V. Ananthan and E. Hall, Acta Metall. Mater., 1991, 39(12), 3153–3160 CrossRef CAS.
- G. Ananthakrishna, Phys. Rep., 2007, 440(4–6), 113–259 CrossRef.
- L. Whitmore, J. Denk, G. Zickler, G. Bourret, O. Huber, N. Huesing and O. Diwald, Eur. J. Phys., 2019, 40(4), 045501 CrossRef.
- I. Kaplan-Ashiri, S. R. Cohen, N. Apter, Y. Wang, G. Seifert, H. D. Wagner and R. Tenne, J. Phys. Chem. C, 2007, 111(24), 8432–8436 CrossRef CAS.
- J. C. Hanan, S. Mahesh, E. Üstündag, I. J. Beyerlein, G. A. Swift, B. Clausen, D. W. Brown and M. A. Bourke, Mater. Sci. Eng., A, 2005, 399, 32–42 CrossRef.
- S. Mahesh, J. Hanan, E. Üstündag and I. Beyerlein, Int. J. Solids Struct., 2004, 41(15), 4197–4218 CrossRef.
- Q. Wang, Y. Bai, Y. Chen, J. Ju, F. Zheng and T. Wang, J. Mater. Chem. A, 2015, 3(1), 352–359 RSC.
- S. Batool, M. Idrees, M. S. Javed, M. Saleem and J. Kong, Mater. Chem. Phys., 2010, 246, 122832 CrossRef.
- M. Hegde, E. T. Samulski, M. Rubinstein and T. J. Dingemans, Compos. Sci. Technol., 2015, 110, 176–187 CrossRef CAS.
- L. Li, C. Y. Li and C. Ni, J. Am. Chem. Soc., 2006, 128, 1692–1699 CrossRef CAS PubMed.
- L. Rocher, A. S. Ylitalo, T. Di Luccio, R. Miscioscia, G. De Filippo, G. Pandolfi, F. Villani, A. Zak, G. H. Menary and A. B. Lennon, et al. , Polymer, 2021, 13(11), 1764 CAS.
- G. Otorgust, H. Dodiuk, S. Kenig and R. Tenne, Eur. Polym. J., 2017, 89, 281–300 CrossRef CAS.
- M. Shneider, H. Dodiuk, R. Tenne and S. Kenig, Polym. Eng. Sci., 2013, 53(12), 2624–2632 CrossRef CAS.
- P. Thiruvasagam and D. Venkatesan, High Perform. Polym., 2011, 23, 22–31 CrossRef CAS.
- R. H. Vora, S. H. Goh and T. Chung, Polym. Eng. Sci., 2000, 40(6), 1318–1329 CrossRef CAS.
- B. V. Tawade, A. D. Kulkarni and P. P. Wadgaonkar, Polym. Int., 2015, 64, 1770–1778 CrossRef CAS.
- M. Genut, L. Margulis, G. Hodes and R. Tenne, Thin Solid Films, 1992, 217, 91–97 CrossRef CAS.
- M. Genut, L. Margulis, R. Tenne and G. Hodes, Thin Solid Films, 1992, 219(1–2), 30–36 CrossRef CAS.
- X. Zhao, Y. Li, S. Zhang, Y. Shao and X. Wang, Polymer, 2007, 48(18), 5241–5249 CrossRef CAS.
- A. Rahnamoun, P. D. Engelhart, S. Humagain, H. Koerner, E. Plis, W. J. Kennedy, R. Cooper, G. S. Greenbaum, R. Hoffmann and C. A. van Duin, Polymer, 2019, 176, 135–145 CrossRef CAS.
- X. Sun and L. Ye, Polym. Int., 2018, 67(12), 1655–1663 CrossRef CAS.
- A. J. Hsieh, C. R. Desper and N. S. Schneider, Polymer, 1992, 33(2), 306–313 CrossRef CAS.
- J. Kurdi and A. Tremblay, Desalination, 2002, 148, 341–346 CrossRef CAS.
- M. G. García, M. José and A. O. Nelio, J. Appl. Polym. Sci., 2017, 134(14), 44682 CrossRef.
- M. D. Blanchard, R. P. Hughes, T. E. Concolino and A. L. Rheingold, Chem. Mater., 2000, 12(6), 1604–1610 CrossRef CAS.
- C. R. Martinez and B. L. Iverson, Chem. Sci., 2012, 3(7), 2191–2201 RSC.
- J. Belana, J. Canadas, J. Diego, M. Mudarra, R. Díaz-Calleja, S. Friederichs, C. Jaimes and M. Sanchis, Polym. Int., 1998, 46, 11–19 CrossRef CAS.
- M. Jenkins, Polymer, 2000, 41, 6803–6812 CrossRef CAS.
- T. Sekine, T. Nakashizu, K. Toyoda, K. Uchinokura and E. Matsuura, Solid State Commun., 1980, 35, 371–373 CrossRef CAS.
- M. Ghorbani-Asl, N. Zibouche, M. Wahiduzzaman, A. F. Oliveira, A. Kuc and T. Heine, Sci. Rep., 2013, 3(1), 2961 CrossRef PubMed.
- S. Devasahayam, D. J. Hill and J. W. Connell, J. Appl. Polym. Sci., 2006, 101(3), 1575–1582 CrossRef CAS.
Footnote |
| † Electronic supplementary information (ESI) available. See DOI: https://doi.org/10.1039/d4nr00818a |
| This journal is © The Royal Society of Chemistry 2024 |

