
 Open Access Article
 This Open Access Article is licensed under a
 Creative Commons Attribution 3.0 Unported Licence
Nanoscale dynamical investigation of the hemoglobin complex with the bacterial protein IsdB: is their interaction stabilized by catch bonds?†
Valentina
Botti‡
 a,
Omar
De Bei‡
b,
Marialaura
Marchetti
b,
Barbara
Campanini
c,
Salvatore
Cannistraro
a,
Stefano
Bettati
*bd and
Anna Rita
Bizzarri
*a
a,
Omar
De Bei‡
b,
Marialaura
Marchetti
b,
Barbara
Campanini
c,
Salvatore
Cannistraro
a,
Stefano
Bettati
*bd and
Anna Rita
Bizzarri
*a
aBiophysics and Nanoscience Centre, DEB, Università della Tuscia, Largo dell'Università, 01100, Viterbo, Italy. E-mail: bizzarri@unitus.it
bDepartment of Medicine and Surgery, University of Parma, Via Volturno 39, 43125, Parma, Italy. E-mail: stefano.bettati@unipr.it
cDepartment of Food and Drug, University of Parma, Parco Area delle Scienze 23/A, 43124, Parma, Italy
dInstitute of Biophysics, National Research Council, via G. Moruzzi, 56124, Pisa, Italy
First published on 14th February 2024
Abstract
Iron-regulated surface determinant B (IsdB) is a surface protein of Staphylococcus aureus that plays essential roles in host cell invasion by mediating both bacterial adhesion and hemic iron acquisition. Single-molecule experiments have recently revealed that the binding of IsdB to vitronectin and integrins is dramatically strengthened under mechanical stress conditions, promoting staphylococcal adhesion. Here we conducted atomic force spectroscopy (AFS) measurements of the interaction between IsdB and hemoglobin (Hb), in both its oxidized (metHb) and reduced forms (HbCO). While the former represents the natural substrate for IsdB, the latter is resistant to heme extraction. For the unbinding between IsdB and HbCO, we obtained a linear trend in the Bell–Evans plot, indicative of a weakening of the interaction upon mechanical stress. For the unbinding between IsdB and metHb, we found similar behavior at low loading rates. Remarkably, a non-linear trend of the complex interaction force was detected at higher force-pulling rates. Such behavior may provide some cues to the ability of IsdB to form stress-dependent bonds also with Hb, possibly enabling a more efficient heme transfer through stabilization of the transient (in vivo) IsdB–Hb complex.
Introduction
Staphylococcus aureus (SA) is a human commensal bacterium and an opportunistic pathogen that can give rise to severe infections affecting e.g. skin, respiratory apparatus, circulatory system, and the heart, often with fatal consequences.1 Due to its propensity to acquire antibiotic resistance, SA has become a worldwide clinical problem that requires urgent and appropriate solutions.2 To settle the infection, SA takes advantage of an arsenal of virulence factors that include assorted cell wall-anchored (CWA) proteins, which, when covalently attached to the peptidoglycan, are in charge of bacterial adhesion and internalization, biofilm formation, and host immune system evasion.3 Among CWA proteins of SA, the iron-regulated surface determinant (Isd) system is responsible for ensuring iron acquisition during bacterial infection, being upregulated under iron-restricted conditions.4–8 Isd comprises nine proteins (IsdA–IsdI) that act in synergy to bind the Hb released from red blood cells by bacterial hemolysins, extract heme, and then transport it into the cytoplasm. Specifically, IsdB, together with IsdH, is directly involved in Hb binding; it has a modular structure formed by two NEAr iron Transporter (NEAT) domains organized in an immunoglobulin-like fold (Fig. 1A): NEAT1, which is involved in Hb binding, and NEAT2, which performs heme extraction.9,10 Besides having a role as a heme scavenger, IsdB – with IsdA – is also involved in various steps of adhesion, colonization and pathogenesis in different host niches.3,11,12 In particular, IsdB interacts with the extracellular matrix protein vitronectin and GPIIb/IIIa, αIIbβ3, and αVβ3 integrins on platelets and endothelial cells,13–17 and with the von Willebrand factor,18 to improve cell adhesion and invasion. Notably, the interaction of IsdB with vitronectin, integrins, and other adhesion proteins has revealed a distinctive trend characterized by force-enhanced binding under high physical stress, with such behavior being closely reminiscent of the so-called “catch bond”.13,14 The catch bond is a counterintuitive phenomenon that occurs in biomolecular complexes that are characterized by an increase of the receptor–ligand bond lifetime when a stronger external force is applied to the system, and is found in a variety of bacterial and cellular adhesion molecules.19,20 Catch bonds are opposite to slip bonds, common in biomolecular complexes, for which the application of forces yields a destabilization, or weakening, of the intermolecular binding.20 | ||
| Fig. 1 (A) Structural representation of IsdB (cartoon rendering) in a complex with Hb (depicted as a surface). (B and C) Heme localization at the interface between IsdB and either HbCO (B), where heme transfer is locked, or metHb (C), from which the cofactor is successfully extracted. (D) Zoomed-in view of (ββ)XL–Hb showing selective cross-linking between Lys82 residues of Hb β-chains that stabilizes the oligomeric structure as a tetramer. (E and F) Schematic representation of the experimental set-up for AFS measurements (E) and the blocking control (F). | ||
Recently, we investigated the interaction between IsdB and hemoglobin (Hb) by absorption spectroscopy, surface plasmon resonance (SPR), and molecular dynamics simulations.21 Such a study has allowed us to characterize different aspects, including the stoichiometry of the complex, the microscopic kinetic rates, and the structural/dynamic effect played by IsdB on Hb. Furthermore, a single-particle cryo-electron microscopy study has provided experimental evidence of key steps of the heme extraction by IsdB from Hb.22
Here, we have applied atomic force spectroscopy (AFS) to investigate the force regulating the interaction between IsdB and Hb at the single-molecule level. AFS is a nanotechnological technique that allows the study, in near physiological conditions, of the unbinding kinetics between biomolecular partners.23 Indeed, AFS allows sensing of the very small molecular forces involved in biorecognition as a response to an external force. This latter aspect warrants some interest in the IsdB![[thin space (1/6-em)]](https://www.rsc.org/images/entities/char_2009.gif) :Hb complex in connection with the aforementioned behavior of IsdB in its interaction with adhesion proteins. As a matter of fact, heme extraction from metHb is a relatively slow process, occurring on a time scale of seconds, and IsdB might take advantage of complex stabilization in the shear stress conditions experienced in blood vessels. With this aim, we investigated the interaction between IsdB and Hb carrying the heme group in either its reduced (carboxyHb, HbCO) or oxidized (methemoglobin, metHb) form (Fig. 1B and C), the latter being the only state allowing heme extraction by the hemophore. The equilibrium constant for metHb tetramer dissociation into dimers is in the low micromolar range;21 IsdB binding further promotes tetramer dissociation as part of its mechanism of action leading to heme extraction.22 Therefore, to prevent any interference from metHb tetramer-to-dimer dissociation in AFS experiments, we produced and tested cross-linked metHb ((ββ)XL–Hb), in which the two β-chains are covalently cross-linked (Fig. 1D), to exclude any interference from Hb tetramer dissociation on the measured unbinding behavior. Our results provide evidence that the unbinding between IsdB and HbCO reveals behavior similar to that commonly observed in biomolecular complexes (see e.g. ref. 24). In contrast, the unbinding between IsdB and metHb, and that between IsdB and (ββ)XL–Hb, exhibits an enhancement of the force required to induce the unbinding when higher loading rates (given by dF/dt) are applied. Such behavior can be put into the context of IsdB's ability to engage in stress-dependent bonding with Hb, which might provide some clues to the role played by external mechanical stresses on some biological functions not directly related to cell adhesion, such as the binding of free individual macromolecules in solution by a surface receptor.
:Hb complex in connection with the aforementioned behavior of IsdB in its interaction with adhesion proteins. As a matter of fact, heme extraction from metHb is a relatively slow process, occurring on a time scale of seconds, and IsdB might take advantage of complex stabilization in the shear stress conditions experienced in blood vessels. With this aim, we investigated the interaction between IsdB and Hb carrying the heme group in either its reduced (carboxyHb, HbCO) or oxidized (methemoglobin, metHb) form (Fig. 1B and C), the latter being the only state allowing heme extraction by the hemophore. The equilibrium constant for metHb tetramer dissociation into dimers is in the low micromolar range;21 IsdB binding further promotes tetramer dissociation as part of its mechanism of action leading to heme extraction.22 Therefore, to prevent any interference from metHb tetramer-to-dimer dissociation in AFS experiments, we produced and tested cross-linked metHb ((ββ)XL–Hb), in which the two β-chains are covalently cross-linked (Fig. 1D), to exclude any interference from Hb tetramer dissociation on the measured unbinding behavior. Our results provide evidence that the unbinding between IsdB and HbCO reveals behavior similar to that commonly observed in biomolecular complexes (see e.g. ref. 24). In contrast, the unbinding between IsdB and metHb, and that between IsdB and (ββ)XL–Hb, exhibits an enhancement of the force required to induce the unbinding when higher loading rates (given by dF/dt) are applied. Such behavior can be put into the context of IsdB's ability to engage in stress-dependent bonding with Hb, which might provide some clues to the role played by external mechanical stresses on some biological functions not directly related to cell adhesion, such as the binding of free individual macromolecules in solution by a surface receptor.
Results and discussion
AFS measurements have been conducted to characterize the interaction between IsdB and Hb at the single-molecule level.Force curves have been acquired by cyclically approaching and retracting the glass slide, functionalized with randomly oriented Hb molecules, towards and away from the nanometric tip at the end of the AFM cantilever on which IsdB had been anchored through a flexible cross-linker (Fig. 1E and F – for more details see the Experimental procedures).
AFS curves may exhibit different trends depending on the features of the tip–substrate-involved forces (absence of interaction, adhesion, specific interaction). Fig. 2 shows a representative force curve related to a specific interaction. The approach phase (red curve) shows deflection beginning at the contact point (Fc) as a consequence of an intermolecular repulsive force. During this phase, the interaction candidates could come into contact, enabling the formation of a complex. The approach is stopped when the cantilever applies upon the substrate a maximum contact force (FMAX) fixed at 0.7 nN to avoid protein damage.25 The cantilever is then left for an encounter time between the potential partners, fixed at 100 ms, during which IsdB should not have enough time to extract the heme moiety from Hb.21 As the tip and substrate are pulled apart (Fig. 2, black curve), the cantilever first reaches the baseline deflection and then it starts to bend downward due to the attractive ligand–receptor (IsdB:Hb) interaction forces. The deflection follows a nonlinear course, consistent with the peculiar features of PEG stretching (for more details see the Experimental procedures). When the spring force overcomes the intermolecular force, the bond between the partners breaks and the jump-off extension of the tip from the cantilever provides the unbinding force of the complex.
 | ||
| Fig. 2 Representative approach (red) and retraction (black) force–piezo displacement curves from AFS experiments carried out using a substrate covered with metHb approaching a tip functionalized with IsdB through a PEG linker. | ||
The approach velocity was kept fixed, while the retraction velocity (vr) was varied between 50 and 4200 nm s−1. For each retraction velocity a thousand force curves were recorded and analyzed.
For each retraction velocity, the assessed unbinding force values were collated into a histogram, and the corresponding most probable unbinding force, F*, was determined from a fit by a Gaussian curve. These F* values were plotted as a function of the natural logarithm of the loading rate, LR = dF/dt, and calculated as described in the Experimental procedures, to be analyzed in the framework of the Bell–Evans model, which allows extraction of kinetic and thermodynamic descriptors from AFS data through the equation F* = (kB·T/xβ)ln[(r·xβ)/(koff·kB·T)],26,27 where kB is the Boltzmann constant, T is the absolute temperature, koff is the dissociation rate constant, and xβ is the width of the energy barrier along the direction of the applied force. For an unbinding process that implies a single energy barrier, the Bell–Evans plot predicts a single linear trend.23
Fig. 3A collectively shows the unbinding force histograms of the IsdB:metHb complex for all the explored retraction velocities. The unbinding forces are shifted towards higher values when higher retraction speeds are applied; such behavior finds correspondence with what is usually observed in the unbinding of biomolecular complexes.24 From the corresponding Bell–Evans plot, shown in Fig. 3B, we note that F* as a function of the logarithm of LR follows a linear trend at LRs lower than about 30 nN s−1, while a remarkable deviation from the linear trend is detected at higher LR values. Therefore, these data cannot be globally described by the Bell–Evans model. At the same time, they cannot be described by two different linear trends (indicative of two distinct energy barriers).24 Similarly, our data cannot be satisfactorily fitted by the Friddle–Noy–De Yoreo model, which takes into consideration the possibility that reversible binding could occur;28 examples of the fits by these two models are shown in Fig. S11 of the ESI.† Additionally, we performed an analysis of the average unbinding force as a function of loading rate (see Fig. S12†). The results show a change in the trend by going from low to high loading rates only for IsdB:metHb and IsdB:(ββ)XL-Hb systems, but not for IsdB:HbCO. Such behavior is reminiscent of that observed in the Bell–Evans plot and supports the establishment of a new process in the IsdB:Hb system.
 | ||
| Fig. 3 (A) Histograms of the unbinding forces for the IsdB:metHb complex from AFS measurements carried out at increasing retraction velocities (vr). The most probable unbinding force value (F*) has been determined from the maximum of the main peak of each histogram by fitting with a Gaussian function. Separate histograms at different bindings are shown in Fig. S1 and S2 of the ESI.† (B) Bell–Evans plot given by F* vs. the logarithm of the loading rate for the IsdB:metHb complex. The red continuous line is the best fit of the linear portion of the data by the Bell–Evans model. | ||
The failure of alternative models to reproduce the observed trend opens the possibility that other mechanisms could be operative, as discussed below.
Nevertheless, F* data for LR values lower than 30 nN s−1 have been fitted by the Bell–Evans model (see the red continuous line in Fig. 3B), providing a koff = (22 ± 4) × 10−3 s−1 and an xβ = (0.7 ± 0.2) nm. The width of the energy barrier, xβ, which depends on the conformation of the molecular partners, can undergo modulation upon unbinding. The found values are consistent with the wide range reported for other biomolecular complexes (see e.g. Tables 6.1–6.3 in ref. 24). In particular, for proteins involving complexes, values ranging from 0.1 nm to 0.8 nm have been reported.
Additionally, the koff value, corresponding to a characteristic lifetime, τ = 1/koff = 45 s, falls in the range between adhesion and antigen/antibody complexes.29 Notably, koff is slightly different from the value previously evaluated by SPR for the same system (koff = 37 × 10−3 s−1). In this connection, we note that AFS and SPR data are collected under different conditions, with AFS results obtained by direct contact between the partners, while SPR data are derived using a microfluidic approach.30
Before discussing the unexpected deviation from the linear trend, the possibility that the observed phenomenon could be due to a contribution from the dissociation of the metHb tetramer induced at the highest pulling rates should be ruled out. With this aim, the experiments were repeated using a cross-linked metHb ((ββ)XL–Hb), in which a covalent bond between the two β-chains was introduced. The unbinding force histograms and the corresponding Bell–Evans plot for the IsdB:(ββ)XL–Hb system are reported in Fig. 4A and B, respectively.
 | ||
| Fig. 4 (A) Histograms of the unbinding forces for the IsdB:(ββ)XL–Hb complex from AFS measurements carried out at increasing retraction velocities (vr). The most probable unbinding force value (F*) has been determined from the maximum of the main peak of each histogram by fitting with a Gaussian function. Separate histograms at different bindings are shown in Fig. S3 and S4 of the ESI.† (B) Bell–Evans plot given by F* vs. the logarithm of the loading rate for IsdB:(ββ)XL–Hb. The brown continuous line is the best fit of the linear portion of the data by the Bell–Evans model. | ||
These histograms are rather similar to those retrieved for the IsdB:metHb complex, again with a shift to higher forces when faster retraction speeds (and then higher loading rates) are applied. Furthermore, from the Bell–Evans plot, we note that F* grows linearly with the logarithm of the loading rate for values lower than about 40 nN s−1, while a quite large deviation towards much higher unbinding force values is highlighted for higher LR values. Accordingly, the deviation from the linear trend is also exhibited by the IsdB:metHb system, which cannot be ascribed to the Hb tetramer dissociation but, rather, can be assumed as being correlated with the molecular mechanism underlying the interaction between IsdB and metHb. By fitting the linear portion of the Bell–Evans plot, we extracted a koff = (15 ± 5) × 10−3 s−1 and an xβ = (0.5 ± 0.2) nm for IsdB:(ββ)XL–Hb. Both these values are in good agreement with those derived for IsdB:metHb. This means that the kinetics and also the thermodynamics are essentially the same for the two systems. To further explore the pulling rate-enhanced binding trend found for the IsdB:metHb system, AFS experiments were carried out by using HbCO as the IsdB partner in the Hb:hemophore complex, where binding occurs normally but the extraction step does not take place.22,31
The unbinding force histograms at the various retraction velocities, and the corresponding Bell–Evans plot for the IsdB:HbCO interaction, are reported in Fig. 5A and B, respectively.
 | ||
| Fig. 5 (A) Histograms of the unbinding forces for the IsdB:HbCO complex from AFS measurements carried out at increasing retraction velocities (vr). The most probable unbinding force value (F*) has been determined from the maximum of the main peak of each histogram by fitting with a Gaussian function. Separate histograms are shown in Fig. S5 of the ESI.† (B) Bell–Evans plot given by F* vs. the logarithm of the loading rate for the IsdB:HbCO complex. The purple continuous line is the best fit of the data by the Bell–Evans model. | ||
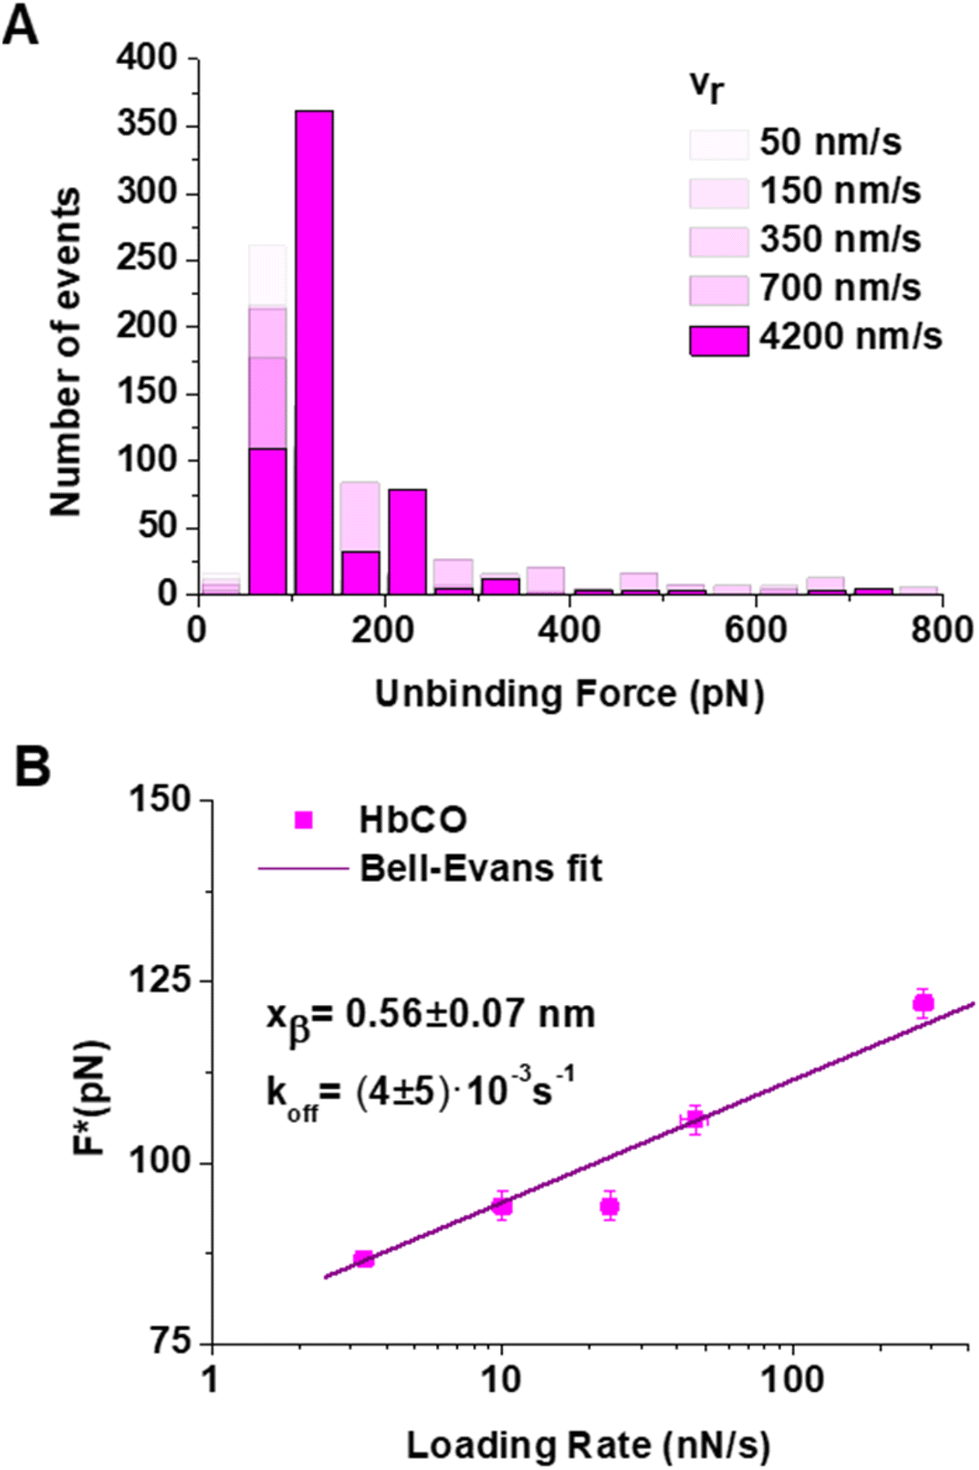
The histograms (Fig. 5A) show lower unbinding forces at the evaluated retraction velocities in comparison with the IsdB:metHb dataset. Notably, the Bell–Evans plot follows a linear trend throughout the whole LR range, with the nonlinear trend for unbinding forces at the higher retraction rates being lost when passing from IsdB:metHb to IsdB:HbCO. The extracted values from a fit by the Bell–Evans model are koff = (4 ± 5) × 10−3 s−1 and xβ = (0.56 ± 0.07) nm. The koff value is indicative of a longer-lived interaction in comparison with that of IsdB:metHb, with a lifetime τ = 1/koff = 220 s. Such an increase in the lifetime of IsdB:HbCO, with respect to that of IsdB:metHb, mirrors the slower unbinding kinetics found by SPR measurements for IsdB:oxyHb.21 Indeed, IsdB is widely reported to similarly interact with reduced ligated forms of Hb (oxyHb and HbCO), which bear iron in the Fe2+ state and bind either oxygen or carbon monoxide in the sixth coordination positions.21,22,31 Furthermore, the width of the energy barrier, xβ, is consistent with that obtained for IsdB:metHb and IsdB:(ββ)XL–Hb, suggesting that the thermodynamic properties of all these systems, in the linear regions, are substantially the same.
Before discussing our results, we would like to assess the specificity of the observed unbinding events. Accordingly, for each biomolecular system, a control experiment (called “blocking”) was carried out (Fig. 1F). In particular, force curves were collected using an IsdB-functionalized tip, previously incubated with Hb, against Hb-functionalized substrates. In all the blocking experiments, we found a decrease in the total number of specific events in comparison with the experiments performed without blocking at the same retraction velocities; see the blocking histograms shown in Fig. S6–S8 of the ESI.† The reported reduction, ranging from 41% to 66%, is in agreement with that largely observed in the literature (see e.g. ref. 25 and 32). Furthermore, support for the specificity comes from analysis of the rupture length of the IsdB:metHb complex (see Fig. S9 of the ESI†). The decrease of specific events in these blocking experiments, combined with the occurrence of PEG stretching in the retraction curves,33 confirms the presence of specific biorecognition events in our AFS experiments.
In all cases, the linear trend observed for loading rates approximately below 30 nN s−1 indicates that the application of low forces yields a destabilization, or weakening, of the intermolecular binding. Such behaviour is consistent with the occurrence of slip bonds and the interactions can be described by the Bell–Evans model. The deviation from the linear trend that appears for loading rates above about 30–40 nN s−1 for the IsdB:metHb and IsdB:(ββ)XL–Hb complexes indicates the establishment of a different regime giving rise to an enhancement of the force required to induce the unbinding. Such a phenomenon could be consistent with the occurrence of catch bonds, in which the energy barrier between the bound and the unbound states increases under the action of a force. Different models have been proposed to explain catch bonds,34 which assume that the energy barrier regulating the unbinding process could be affected by mechanical stress, leading to different pathways from bound to unbound states. Some of the models that have been put forward, also for IsdB, assume that the occurrence of catch bonds could be related to the selective stabilization of alternative conformations, or induced conformational changes, possibly including the exposure of “cryptic” binding sites strengthening the complex.35–37
On this basis, the observed effects in our systems should be discussed in connection with the similar behavior reported for the interaction between IsdB and some adhesion proteins (vitronectin and integrins).13,14 Indeed, for the IsdB:vitronectin and IsdB:integrins complexes, it has been hypothesized that force-induced processes can yield slight conformational changes, likely in IsdB, that, in turn, lead to a more stable state for the complex favoring the adhesion process. More specifically, it has been proposed that the applied force can induce an upshift to a high-affinity state, likely modulated by the H-bond network.13 Such a peculiar interaction could have been evolutionarily developed to improve the colonization efficiency of hosts even in the presence of shear forces.
Based on these observations, it is obviously tempting to extend such considerations to the complex between IsdB and Hb, the preferred iron source of SA under infection conditions. By taking into consideration the propensity of IsdB to form catch bonds, it could be hypothesized that also in complex with Hb, it may undergo a conformational rearrangement when subjected to an external force higher than a threshold value. Indeed, also in this case, as previously reported for complexes with integrins and vitronectin, the observed strengthening of the complex could have an implication in the biological function of the hemophore: it could be speculated that the catch bond behavior, exploited by IsdB to strengthen the adhesion of SA under shear stress conditions, would also grant a further evolutionary advantage by stabilizing the heme extraction–competent complex (Fig. 6).
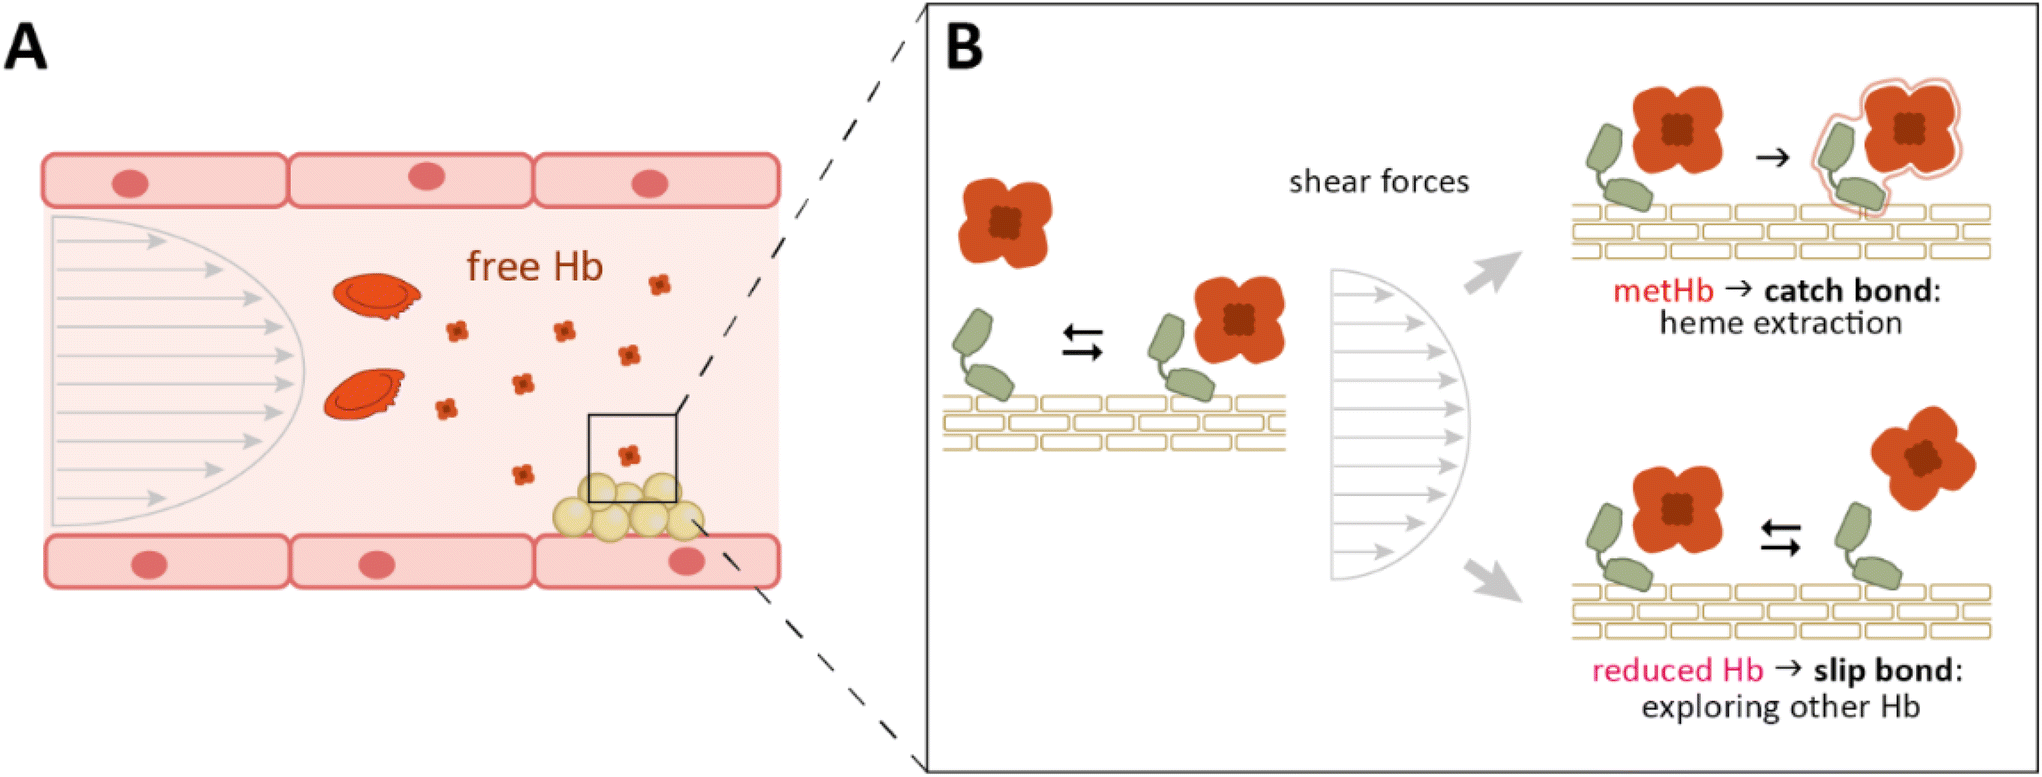 | ||
| Fig. 6 Schematic representation of the proposed physiological significance of the catch bond between IsdB and metHb. (A) S. aureus inside blood vessels has access to Hb released from red blood cells by the action of hemolysins. Hb release accelerates the oxidation of heme, giving rise to a mixture of reduced and oxidized Hb (metHb). (B) Binding of IsdB to metHb, that is susceptible to heme extraction, might be strengthened by acting forces that would thus favor iron acquisition. In contrast, the interaction between IsdB and reduced Hb (HbCO in our experimental setup) weakens under shear stress, allowing IsdB to quickly release the unproductive substrate. | ||
Such a hypothesis is corroborated by the observation that the interaction between IsdB and HbCO does not show any deviation from the linear trend in the Bell–Evans plot. In fact, IsdB is unable to extract the heme from oxyHb or its mimic HbCO (i.e. Hb with iron in the reduced Fe2+ state, coordinated to O2 or CO), and requires the heme iron to be in the ferric state.22 Consistently, the binding of IsdB to HbCO, which occurs through a dense network of contacts, is not related to major conformational changes in the interaction partners.22 On the contrary, even if high-resolution details are not available, many biochemical and biophysical techniques suggest a higher degree of flexibility of the IsdB:metHb interaction. On the hemophore side, the NEAT1 domain establishes a strong interaction with metHb,10 and is connected through the hinge region to the linker–NEAT2, which has a more dynamic nature.38,39 This behavior might be essential in heme transfer by either guiding the complex movement of the cofactor or destabilizing the structure of the protein partner. MetHb, in turn, appears less stable than HbCO or oxyHb, mainly at the level of the heme binding pocket of the β subunits.40 The significant rearrangements expected to be assumed by the IsdB:metHb complex to enable heme extraction may also have a role in opening access to specific conformations that realize bond strengthening (catch bond) under adverse external forces (e.g. shear stress) (Fig. 6). This would occur only in the case of complex formation with metHb (competent for heme extraction and therefore biologically relevant), while slip bonding would take place in the case of binding to reduced Hb (oxyHb, in vivo), allowing for fast release of Hb, which makes IsdB quickly available again to explore further Hb binding. Indeed, the shear stress sensed by bacteria inside the blood vessels can be higher than 100 nN s−1,41–43i.e. values similar to the loading rates we tested. The IsdB:metHb bond behavior revealed by our data deviates from linearity at LR higher than 30 nN s−1, mimicking conditions that can be physiologically relevant. Differing from the data reported for the bonds forming between IsdB and vitronectin or integrins13,14 – for which the adhesion forces increase to over 1000 pN – the unbinding force recorded for the IsdB:metHb complex reaches a few hundreds of pN; this behavior may reflect the bacterial need to maintain a relatively stable interaction under high shear stress conditions to allow heme extraction by the hemophore and the release of unloaded Hb.
Experimental procedures
Protein expression and purification
The gene sequence corresponding to IsdB residues 125–485 (UniProt ID Q8NX66) was optimized for the expression in an E. coli host and cloned in pASK-IBA3plus vector (IBA Lifesciences, Germany), which allows the insertion of a C-terminal Strep-tag® II in the recombinant protein.21 The expression was carried out in the E. coli BL21 strain in M9 medium for 20 hours at 20 °C by inducing the culture (OD600 = 0.5–0.6) with 0.2 μg mL−1 of anhydrotetracycline. Cells were harvested by centrifugation and the pellet was resuspended in buffer W (100 mM Tris pH 8, 150 mM NaCl, 1 mM EDTA) in the presence of 1 mg mL−1 lysozyme, 0.1 mM benzamidine, 0.1 mM PMSF, and 1 μM pepstatin A. The suspension was lysed by sonication and the supernatant was separated by centrifugation from the debris and loaded onto a Strep-Tactin®XT (IBA Lifesciences) resin-packed column pre-equilibrated with buffer W. After washing, IsdB was eluted with 50 mM biotin in buffer W. High-molecular weight contaminants were then removed by size exclusion chromatography (SEC) using a buffer W-equilibrated HiLoad 16/600 Superdex 75 prep grade column (Cytiva, Massachusetts, USA). The purity of the final IsdB preparation was higher than 95%, with a yield of more than 100 mg L−1 of cell culture.IsdB was quantified by UV-visible spectroscopy by using an extinction coefficient ε280 = 47790 M−1 cm−1, as previously reported.21 The amount of holo–IsdB was estimated as lower than 5% by calculating the heme concentration at 405 nm with ε405 = 90500 M−1 cm−1.
Human Hb A was purified from expired blood bags of non-smoking donors obtained from a local blood transfusion center. As previously described,44,45 after red blood cells lysis under hypotonic conditions (addition of 7 volumes of buffer Hb1 – 10 mM HEPES pH 6.9, 1 mM EDTA), the supernatant containing the oxygenated Hb was separated from cell debris by centrifugation for 1 hour at 23000g, 4 °C. The solution was then dialyzed in buffer Hb1 and loaded onto a pre-equilibrated 100 × 5 cm CM-Sephadex C-50 column. The resin was washed by a linear gradient from 0% to 80% of buffer Hb2 (10 mM HEPES pH 8.6, 1 mM EDTA) and oxyHb was eluted by a linear gradient from 80% to 85% in the same buffer. Eluted protein was dialyzed in storage buffer (10 mM HEPES pH 7.2, 1 mM EDTA), flash-frozen in aliquots in liquid nitrogen, and stored at −80 °C until further use.
The oxidation state and the concentration of oxyHb were checked by UV-visible absorption spectroscopy exploiting the characteristic heme peaks and molar extinction coefficients.46 Aliquots of oxyHb were oxidized in the presence of 5 mM potassium ferricyanide (Fluka, Switzerland) for 10 minutes at room temperature to obtain metHb. The reagent was then removed by desalting on a Sephadex G-25 column (GE Healthcare, Illinois, USA). MetHb concentration was determined in buffer W at pH 8.0 using ε406 = 130000 M−1 cm−1.22
HbCO was obtained from oxyHb by equilibrating the solution in a sealed glass chamber with pure carbon monoxide for 10 minutes, 4 °C, under gentle shaking to increase the gas diffusion. The ligand exchange was confirmed by UV-visible spectroscopy verifying the heme-characteristic absorption peaks and the protein was quantified using tabulated molar extinction coefficients (ε419 = 191000 M−1 cm−1).46 HbCO was selected as a suitable mimetic of oxyHb because of its reduced auto-oxidation rate in the presence of IsdB.22
Hemoglobin cross-linking
Cross-linked Hb ((ββ)XL–Hb) was obtained following the protocols published by Walder and co-workers47,48 and Yang and co-workers,49 with minor modifications. In this method, Hb tetramer is cross-linked via bis(3,5-dibromosalycil) fumarate, which bridges the lysine residues in position 82 (K82) on both β subunits of Hb. The resulting (ββ)XL–Hb can normally shift from the R- to T-state. The reaction was carried out in 10 mM HEPES pH 7.2 at 20 °C, 1 mM EDTA (buffer R) in the presence of 0.5 mM oxyHb (tetramer concentration), and equimolar cross-linker for 2 hours at 37 °C. The reaction was quenched by the addition of 0.5 mM glycine to the solution. The sample was then centrifuged for 45 minutes at 17000g at 4 °C and (ββ)XL–Hb was separated from unreacted species by SEC using a HiLoad 16/600 Superdex 75 prep grade column (GE Healthcare) mounted on an ÄKTA Prime system and equilibrated in buffer R.
Atomic force spectroscopy
IsdB and Hb molecules were covalently linked to AFM tips and glass slides, respectively, according to well-established procedures.50–52 Briefly, silicon nitride AFM tips (cantilever D, SNL-10; Bruker Corporation, Massachusetts, USA), with a nominal spring constant, knom, of 0.06 N m−1, were first cleaned in acetone (Sigma–Aldrich Co., Massachusetts, USA), dried with nitrogen and UV irradiated for 30 minutes to expose hydroxyl groups. They were then incubated for 2 hours at room temperature with a solution of 2% (v/v) 3-mercatopropyl-trimethoxysilane (MPTMS) (Sigma–Aldrich Co.) in toluene (99.5%, Sigma–Aldrich Co.), extensively washed with toluene, and dried with nitrogen. Subsequently, the silanized tips were immersed in a 1 mM solution of N-hydroxysuccinimide–polyethyleneglycol–maleimide (NHS–PEG–MAL, 3.4 kDa, hereafter PEG) (Iris Biotech, Germany) in dimethylsulfoxide (DMSO) (99.9%, Sigma–Aldrich Co.) for 3 hours at room temperature, allowing –MAL groups of the flexible PEG cross-linker to react with thiol groups of MPTMS. Finally, after washing with DMSO and microfiltered bidistilled water, the tips were incubated overnight at 4 °C with 25 μL of 5 μM IsdB in buffer W, pH 8.0 at 25 °C, enabling the NHS-ester groups of the PEG to bind to the amino groups of lysines exposed on the surface of IsdB. 2D-Aldehyde-functionalized glass surfaces, of area 1 cm2 (PolyAn GmbH, Germany), characterized by a thin silane layer able to covalently bind proteins via their exposed amino groups, were incubated with 50 μL of 10 μM Hb solutions in buffer W for 4 hours at 25 °C in an air-tight container. Then, the substrate was gently rinsed with buffer and Milli-Q water. Unreacted groups of both tips and substrates were passivated by incubation with 1 M ethanolamine hydrochloride, pH 8.5 in Milli-Q water (GE Healthcare) for 30 min at 25 °C. Finally, they were gently rinsed with buffer W. AFS measurements were immediately conducted after functionalization of the glass slides (newly prepared every day) to avoid the oxidation of Hb samples; conversely, IsdB-functionalized tips were wet stored in buffer at 4 °C in between experiments.Unbinding force measurements were performed at room temperature with a Nanoscope IIIa/Multimode AFM (Veeco Instruments, New York, USA) in force calibration mode. The interaction was studied in fluid, using buffer W saturated with CO for HbCO substrates and saturated with N2 for metHb and (ββ)XL–Hb samples. Force curves were collected by moving the IsdB-functionalized tip to approach different points of the Hb (HbCO or metHb or (ββ)XL–Hb) substrate and then retracting it. Thus, in each approach–retraction cycle, the interaction candidates were brought into contact, allowing the formation of a complex, and were subsequently pulled apart, allowing the registering of the cantilever deflection corresponding to the interacting force. The approach phase was stopped upon reaching a preset maximum contact force value of 0.7 nN, to avoid molecule damage.25 A ramp size of 150 nm and an encounter time of 100 ms were set up. The approach was fixed at a constant velocity of 50 nm s−1, while the retraction velocity was varied from 50 to 4200 nm s−1. This led to several different loading rates (LRs), defined as dF/df and given by the product of the cantilever retraction velocity (v) and the spring constant of the entire system, ksyst, accounting for the effect of the molecules tied to the tip.33 For each retraction velocity, the parameter ksyst was calculated from the slope of the retraction curve immediately before the unbinding event.33
At each retraction velocity, more than a thousand force curves were acquired to guarantee information with statistical significance. The unbinding force F, i.e. the exerted force able to break the interaction complex, was calculated by multiplying the cantilever deflection by its effective spring constant (keff), which was experimentally evaluated.53 We selected curves corresponding to specific unbinding events, being characterized, during the retraction phase, by sharp peaks with start and end points at the zero deflection line, and by a nonlinear curved shape before the jump-off, which was related to the stretching features of the PEG linker.54 More specifically, the nonlinear trend should be described by the worm-like-chain (WLC) model with a persistence length consistent with that of the used PEG (0.36 nm), according to the procedure reported in ref. 55. Experiments were conducted in triplicate.
Furthermore, a check of the specificity of the interaction was done by performing blocking experiments. The AFS experiments were repeated by collecting force curves at the retraction velocity of 350 nm s−1 with the IsdB-functionalized tip, which had been previously incubated with Hb solution at 10 μM, against the Hb-substrate in buffer W at 25 °C. In each system, the corresponding histograms revealed that the number of events after blocking was markedly decreased (see ESI†). Globally, the ratio of the total number of events, related to specific unbinding events, over the total recorded events was reduced from about 58% to 34% for IsdB:metHb, from about 66% to 36% for IsdB:(ββ)XL–Hb and from about 59% to 20% for IsdB:HbCO. Accordingly, the reduction ranges from 41% to 66%, confirming that the AFS curves refer to specific events.
Author contributions
Conceptualization: ARB, SB, BC, MM; data curation: VB, ARB; formal analysis: VB, ODB; funding acquisition: SB, ARB; investigation: VB, ODB; supervision: ARB, SC, SB, BC; writing – original draft: VB, ODB, MM, BC, SC, SB, ARB; writing – review and editing: VB, ODB, MM, BC, SC, SB, ARB.Conflicts of interest
There are no conflicts to declare.Acknowledgements
This project was funded by “PRIN-2020—Defeat antimicrobial resistance through iron starvation in Staphylococcus aureus (ERASE)” (Grant 2020AE3LTA) to Stefano Bettati and Anna Rita Bizzarri. ARB acknowledges the grant from the Associazione Italiana per la Ricerca sul Cancro (AIRC IG 24450).References
- L. Thomer, O. Schneewind and D. Missiakas, Annu. Rev. Pathol.: Mech. Dis., 2016, 11, 343–364 CrossRef CAS PubMed.
- P. Moreillon and Y. A. Que, Lancet, 2004, 363, 139–149 CrossRef PubMed.
- T. J. Foster, J. A. Geoghegan, V. K. Ganesh and M. Höök, Nat. Rev. Microbiol., 2014, 12, 49–62 CrossRef CAS PubMed.
- C. F. M. Bowden, A. C. K. Chan, E. J. W. Li, A. L. Arrieta, L. D. Eltis and M. E. P. Murphy, J. Biol. Chem., 2018, 293, 177–190 CrossRef CAS PubMed.
- S. A. Brown, K. L. Palmer and M. Whiteley, Nat. Rev. Microbiol., 2008, 6, 657–666 CrossRef CAS PubMed.
- A. Dryla, B. Hoffmann, D. Gelbmann, C. Giefing, M. Hanner, A. Meinke, A. S. Anderson, W. Koppensteiner, R. Konrat, A. von Gabain and E. Nagy, J. Bacteriol., 2007, 189, 254–264 CrossRef CAS PubMed.
- M. Marchetti, O. De Bei, S. Bettati, B. Campanini, S. Kovachka, E. Gianquinto, F. Spyrakis and L. Ronda, Int. J. Mol. Sci., 2020, 21, 2145 CrossRef CAS PubMed.
- E. P. Skaar, PLoS Pathog., 2010, 6, e1000949 CrossRef PubMed.
- S. A. Hare, Biochim. Biophys. Acta, Proteins Proteomics, 2017, 1865, 422–433 CrossRef CAS PubMed.
- G. Pishchany, J. R. Sheldon, C. F. Dickson, M. T. Alam, T. D. Read, D. A. Gell, D. E. Heinrichs and E. P. Skaar, J. Infect. Dis., 2013, 209, 1764–1772 CrossRef PubMed.
- S. R. Clarke, G. Andre, E. J. Walsh, Y. F. Dufrêne, T. J. Foster and S. J. Foster, Infect. Immun., 2009, 77, 2408–2416 CrossRef CAS PubMed.
- G. Pishchany, S. E. Dickey and E. P. Skaar, Infect. Immun., 2009, 77, 2624–2634 CrossRef CAS PubMed.
- M. Mathelié-Guinlet, F. Viela, M. J. Alfeo, G. Pietrocola, P. Speziale and Y. F. Dufrêne, Nano Lett., 2020, 20, 8919–8925 CrossRef PubMed.
- M. Mathelié-Guinlet, F. Viela, G. Pietrocola, P. Speziale and Y. F. Dufrêne, Nanoscale Adv., 2020, 2, 5728–5736 RSC.
- H. Miajlovic, M. Zapotoczna, J. A. Geoghegan, S. W. Kerrigan, P. Speziale and T. J. Foster, Microbiology, 2010, 156, 920–928 CrossRef CAS PubMed.
- G. Pietrocola, A. Pellegrini, M. J. Alfeo, L. Marchese, T. J. Foster and P. Speziale, J. Biol. Chem., 2020, 295, 10008–10022 CrossRef CAS PubMed.
- M. Zapotoczna, Z. Jevnikar, H. Miajlovic, J. Kos and T. J. Foster, Cell. Microbiol., 2013, 15, 1026–1041 CrossRef CAS PubMed.
- M. J. Alfeo, A. Pagotto, G. Barbieri, T. J. Foster, K. Vanhoorelbeke, V. De Filippis, P. Speziale and G. Pietrocola, Sci. Rep., 2021, 11, 22799 CrossRef CAS PubMed.
- B. T. Marshall, M. Long, J. W. Piper, T. Yago, R. P. McEver and C. Zhu, Nature, 2003, 423, 190–193 CrossRef CAS PubMed.
- W. Thomas, Annu. Rev. Biomed. Eng., 2008, 10, 39–57 CrossRef CAS PubMed.
- E. Gianquinto, I. Moscetti, O. De Bei, B. Campanini, M. Marchetti, F. J. Luque, S. Cannistraro, L. Ronda, A. R. Bizzarri, F. Spyrakis and S. Bettati, Sci. Rep., 2019, 9, 18629 CrossRef CAS PubMed.
- O. De Bei, M. Marchetti, L. Ronda, E. Gianquinto, L. Lazzarato, D. Y. Chirgadze, S. W. Hardwick, L. R. Cooper, F. Spyrakis, B. F. Luisi, B. Campanini and S. Bettati, Proc. Natl. Acad. Sci. U. S. A., 2022, 119, e2116708119 CrossRef CAS PubMed.
- A. R. Bizzarri and S. Cannistraro, Chem. Soc. Rev., 2010, 39, 734–749 RSC.
- A. R. Bizzarri and S. Cannistraro, Dynamic Force Spectroscopy and Biomolecular Recognition, CRC Press, 2012 Search PubMed.
- P. Hinterdorfer and Y. F. Dufrêne, Nat. Methods, 2006, 3, 347–355 CrossRef CAS PubMed.
- G. I. Bell, Science, 1978, 200, 618–627 CrossRef CAS PubMed.
- E. Evans, Annu. Rev. Biophys. Biomol. Struct., 2001, 30, 105–128 CrossRef CAS PubMed.
- R. W. Friddle, A. Noy and J. J. De Yoreo, Proc. Natl. Acad. Sci. U. S. A., 2012, 109, 13573–13578 CrossRef CAS PubMed.
- G. Schreiber, G. Haran and H. X. Zhou, Chem. Rev., 2009, 109, 839–860 CrossRef CAS PubMed.
- N. Moreno, M. Chevalier, F. Ronzon, C. Manin, M. Dupuy, T. Krell and J.-P. Rieu, J. Mol. Recognit., 2011, 24, 1105–1114 CrossRef PubMed.
- C. F. M. Bowden, M. M. Verstraete, L. D. Eltis and M. E. P. Murphy, Biochemistry, 2014, 53, 2286–2294 CrossRef CAS PubMed.
- O. H. Willemsen, M. M. E. Snel, L. Kuipers, C. G. Figdor, J. Greve and B. G. De Grooth, Biophys. J., 1999, 76, 716–724 CrossRef CAS PubMed.
- C. Friedsam, A. K. Wehle, F. Kühner and H. E. Gaub, J. Phys.: Condens. Matter, 2003, 15, S1709 CrossRef CAS.
- O. V. Prezhdo and Y. V. Pereverzev, Acc. Chem. Res., 2009, 42, 693–703 CrossRef CAS PubMed.
- M. Mathelié-Guinlet, F. Viela, D. Alsteens and Y. F. Dufrêne, Trends Microbiol., 2021, 29, 286–288 CrossRef PubMed.
- E. V. Sokurenko, V. Vogel and W. E. Thomas, Cell Host Microbe, 2008, 4, 314–323 CrossRef CAS PubMed.
- W. E. Thomas, E. Trintchina, M. Forero, V. Vogel and E. V. Sokurenko, Cell, 2002, 109, 913–923 CrossRef CAS PubMed.
- B. A. Fonner, B. P. Tripet, B. J. Eilers, J. Stanisich, R. K. Sullivan-Springhetti, R. Moore, M. Liu, B. Lei and V. Copié, Biochemistry, 2014, 53, 3922–3933 CrossRef CAS PubMed.
- M. Sjodt, R. Macdonald, T. Spirig, A. H. Chan, C. F. Dickson, M. Fabian, J. S. Olson, D. A. Gell and R. T. Clubb, J. Mol. Biol., 2016, 428, 1107–1129 CrossRef CAS PubMed.
- M. A. Sowole and L. Konermann, J. Am. Soc. Mass Spectrom., 2013, 24, 997–1005 CrossRef CAS PubMed.
- T. O. Paiva, A. Viljoen, T. M. da Costa, J. A. Geoghegan and Y. F. Dufrêne, ACS Nanosci. Au, 2023, 3, 58–66 CrossRef CAS PubMed.
- F. Viela, V. Prystopiuk, A. Leprince, J. Mahillon, P. Speziale, G. Pietrocola and Y. F. Dufrêne, mBio, 2019, 10, e0555–19 CrossRef PubMed.
- O. Yakovenko, S. Sharma, M. Forero, V. Tchesnokova, P. Aprikian, B. Kidd, A. Mach, V. Vogel, E. Sokurenko and W. E. Thomas, J. Biol. Chem., 2008, 283, 11596–11605 CrossRef CAS PubMed.
- J. E. Fuhr and P. Medici, FEBS Lett., 1970, 11, 20–22 CrossRef CAS PubMed.
- C. Viappiani, S. Abbruzzetti, L. Ronda, S. Bettati, E. R. Henry, A. Mozzarelli and W. A. Eaton, Proc. Natl. Acad. Sci. U. S. A., 2014, 111, 12758–12763 CrossRef CAS PubMed.
- E. Antonini and M. Brunori, Hemoglobin and myoglobin in their reactions with ligands, North-Holland, Amsterdam, 1971 Search PubMed.
- J. A. Walder, R. Y. Walder and A. Arnone, J. Mol. Biol., 1980, 141, 195–216 CrossRef CAS PubMed.
- J. A. Walder, R. H. Zaugg, R. Y. Walder, J. M. Steele and I. M. Klotz, Biochemistry, 1979, 18, 4265–4270 CrossRef CAS PubMed.
- T. Yang and K. W. Olsen, Biochem. Biophys. Res. Commun., 1989, 163, 733–738 CrossRef CAS PubMed.
- V. Botti, S. Cannistraro and A. R. Bizzarri, Int. J. Mol. Sci., 2022, 23, 10728 CrossRef CAS PubMed.
- I. Moscetti, A. R. Bizzarri and S. Cannistraro, Biophys. Chem., 2017, 228, 55–61 CrossRef CAS PubMed.
- I. Moscetti, S. Cannistraro and A. R. Bizzarri, Arch. Biochem. Biophys., 2019, 671, 35–41 CrossRef CAS PubMed.
- J. L. Hutter and J. Bechhoefer, Rev. Sci. Instrum., 1993, 64, 1868–1873 CrossRef CAS.
- F. Kienberger, A. Ebner, H. J. Gruber and P. Hinterdorfer, Acc. Chem. Res., 2006, 39, 29–36 CrossRef CAS PubMed.
- A. R. Bizzarri and S. Cannistraro, Phys. Chem. Chem. Phys., 2011, 13, 2738–2743 RSC.
Footnotes |
| † Electronic supplementary information (ESI) available. See DOI: https://doi.org/10.1039/d3nr05241a |
| ‡ Contributed equally. |
| This journal is © The Royal Society of Chemistry 2024 |