
 Open Access Article
 This Open Access Article is licensed under a
 Creative Commons Attribution 3.0 Unported Licence
A novel electrical depercolation model for stretchable nanocomposite strain sensors†
Oliver
Tomes
 a,
Aaron
Soul
a,
Han
Zhang
a,
Emiliano
Bilotti
b and
Dimitrios G.
Papageorgiou
*a
a,
Aaron
Soul
a,
Han
Zhang
a,
Emiliano
Bilotti
b and
Dimitrios G.
Papageorgiou
*a
aSchool of Engineering and Materials Science, Queen Mary University of London, London, E1 4NS, UK. E-mail: d.papageorgiou@qmul.ac.uk
bDepartment of Aeronautics, Imperial College London, South Kensington Campus, SW7 2AZ London, UK
First published on 29th February 2024
Abstract
Flexible strain sensors have been subject to intense research efforts in recent years, in an attempt to overcome the limitations of their rigid counterparts and find use in demanding applications. In this work, the effective calibration of resistive-type, stretchable strain sensors is discussed. A new model for the piezoresistive response of stretchable polymer nanocomposite strain sensors is presented which facilitates calibration over the full conducting strain range of the material. This offers the potential to vastly improve the practical working range of sensors made using soft conductive nanocomposites, as well as to obtain key information towards improvement of sensing performance. The model has been successfully applied to multiple experimental measurements on silicone rubber (SR) nanocomposites reinforced with reduced graphene oxide (rGO) over a range of filler loadings. The effect of parameters such as filler dimensions, filler orientation and dispersion state is discussed, while predictions on sensitivity and working range are made on the basis of interparticle distance modelling.
 Dimitrios G. Papageorgiou | Dr Dimitrios Papageorgiou is a Senior Lecturer (Associate Professor) in Materials Science at the School of Engineering and Materials Science of Queen Mary University of London (UK), where he is leading research activities on polymers, composites and nanomaterials engineering. He received his BSc, MSc and PhD in Physics from Aristotle University of Thessaloniki (Greece). Dimitrios’ research follows a holistic approach from the development of functional polymers and composites, to the detailed analysis and modelling of their properties, targeting application markets. His work has been recognised through multiple awards, including the 2022 Rosenhain Medal from the Institute of Materials, Minerals and Mining. |
1 Introduction
Stretchable strain sensors are a key component in the development of flexible and wearable electronic devices for use in applications such as the monitoring of health parameters, human–machine interfaces and soft robotics.1 Strain sensors are utilised in various contexts to track and monitor movement, transforming material deformations into electrical signals for detection and measurement purposes. In contrast with sensors made using traditional electronic materials, flexible strain sensors, such as conductive elastomer nanocomposite devices, have the capability to measure dynamic motion on irregular surfaces or shape-changing objects, allowing for the seamless integration of sensing into multiple new systems.2Resistive-type strain sensors measure the deformation of a material using the change in resistance resulting from mechanical strain. The electromechanical response arises from both geometrical changes and the piezoresistive effect. The sensitivity of the measurement is normally described by the gauge factor, G,3
 | (1) |
Metals have low piezoresistivity (Δρ/ρ0 ≈ 0) and traditionally strain measurements for monitoring automatic systems on devices, machines, and equipment would be made using metallic foil, wire or thin-film based strain gauges.4 These display values of G = 2–6 and have a highly linear electromechanical response to strain over their limited working ranges ε < 5%. Semiconductors exhibit a much stronger piezoresistive effect than metals, and they can produce strain gauges with superior sensitivities (G = 100–1000). However, they are brittle and still suffer from the same low working ranges as their metal counterparts.4,5 Polymer nanocomposites have become a popular alternative for the development of new strain sensors over the last decade, owing to the flexible nature of the majority of polymer matrices (ε = 10–1000%).6,7 Nanomaterials can impart electrical conductivity to polymers even at low filler volume fractions. Stretchable nanocomposites made using carbon nanomaterials such as graphene and carbon nanotubes (CNTs) in particular have favourable conductivity ranges for strain sensing applications (1–104 S m−1).8 Moreover, this new class of materials displays high piezoresistivity which allows for sensitivities, up to high strains, far surpassing those of metal and semiconductor strain gauges.
Depending on the design of the nanocomposite device, the piezoresistive effect is influenced, to varying degrees, from a combination of several different mechanisms. In cases where the conductive networks are made up predominantly by nanofillers in physical contact, such as in thin films, crack propagation and disconnection mechanisms can dominate the electromechanical response.9 However, electrical conduction is not only carried across nanofillers in contact, but also via quantum tunneling of electrons through thin layers of polymer between closely positioned nanofiller sites. The tunneling current through these tunneling junctions is highly dependent on the distance between nanofillers, which is affected by strain. According to theory developed by Simmons,10 the tunneling resistance of a single junction can be estimated by the following equation,
 | (2) |
In many polymer nanocomposite strain sensors, the dominant strain-responsive mechanism is the tunneling effect, particularly in nanocomposites with filler contents close to the percolation threshold.1,11–13 Zhang et al.14 used Simmons’ tunneling theory to approximate the tunneling resistance across electrically conducting composites composed of conducting fillers dispersed throughout an insulating polymer matrix as,
 | (3) |
The tunneling model in eqn (3) has been previously used to study the full response of polymer nanocomposite strain sensors in the literature,20–24 however these applications of Simmons’ tunneling theory often rely on multiple fitting parameters which lack clear physical definitions. In this study, we evaluate linear and exponential models used in the literature to calibrate polymer nanocomposite strain sensors using example data from ultrasoft silicone rubber/reduced graphene oxide (SR/rGO) strain sensors of varying filler contents. The specific composite system offers a valuable case study for the behaviour of low-density conductive filler networks as the ultra-low modulus of the elastomer matrix (<50 kPa) ensures minimal interference in the electromechanical response of the nanocomposite. A new model for the electromechanical response of these strain sensors is presented which requires only two well defined fitting parameters. This model can be employed for the accurate calibration over the full conducting strain range of resistive-type polymer nanocomposite sensors.
2 Materials and methods
2.1 Materials
Ecoflex 00-20 (platinum-catalysed silicone rubber), procured from Smooth-On was used as the polymer matrix. The filler used was reduced graphene oxide (rGO) supplied by Avanzare in powder form with an average thickness <3 nm and lateral size ∼40 μm, according to the supplier. Using XPS, the ratio of carbon to oxygen was measured to be 17.5, indicating a high level of reduction for the rGO filler (C![[thin space (1/6-em)]](https://www.rsc.org/images/entities/char_2009.gif) :O ratio typically ∼2 for graphene oxide25). Further information on the physical properties of the filler can be found in section 1 of the ESI.†
:O ratio typically ∼2 for graphene oxide25). Further information on the physical properties of the filler can be found in section 1 of the ESI.†
2.2 Sample preparation
To prepare the silicone rubber/rGO (SR/rGO) nanocomposite strain sensors, rGO powder was first dried at 60 °C for 4 hours. The powder was subsequently mixed via manual stirring into both silicone resin precursor and crosslinker respectively, to produce nanocomposites at loadings of 0.42 vol%, 0.52 vol%, 0.62 vol%, 0.70 vol% and 0.79 vol%. A three-roll mill (80E EXAKT GmbH) was then used to disperse the filler throughout both parts of the silicone resin separately (precursor and crosslinker) for a total of four cycles before combining to cure. Parameters used for the three-roll mill were chosen to match the medium shear force method detailed in Kernin et al.26 as this was found to provide a good dispersion of rGO without causing excessive break-up of rGO into particles of smaller lateral dimensions. Fixed gap sizes of 15 μm for the rear and 5 μm for the front were used, at a constant apron roller speed of 200 rpm. The two parts were then combined and manually stirred together for 5 minutes before depositing into polystyrene Petri dishes. To ensure surface smoothness in the cured nanocomposite films, a weight of 1.5 kg was applied to the surface during overnight curing at room temperature. The resulting SR/rGO films of ∼1 mm thickness were cut into dogbones for testing, using an ASTM D638 Type V cutting die and pneumatic press.2.3 Characterisation
Mechanical characterisation was carried out using an Instron 5566. Tensile testing took place according to ASTM D412 at a strain rate of 500 mm min−1. To obtain the percolation threshold, electrical conductivity measurements were performed on all samples using the 4-probe method.The electromechanical behaviour was characterised by measuring the instantaneous two-point resistance of samples with a digital multimeter (Agilent, 34410A) while applying tensile strain until resistance measurements reached overload. Electrical contacts were made within the gauge length, ∼1 cm from the grips in order to avoid distortion of the filler network during measurement, using thin copper wire embedded in carbon grease (see Fig. S3 in the ESI† for a schematic of the sample preparation). A constant strain rate of 2 mm min−1 was chosen to maximise the acquisition of data points near the end of the resistance curve. The use of a low crosshead speed facilitated characterisation of the piezoresistive behaviour near the point of breakdown of the conductive network, where the resolution of resistance data is typically low. Three specimens were tested for each sample loading and data was analysed via non-linear least squares fitting using the Python scipy package. Fitting parameters were averaged to obtain results for each sample type, and the sample standard deviation was used to represent the uncertainty for each parameter.
2.4 Wearable sensor demonstration
To monitor finger bending motion, the SR/rGO (0.62 vol%) sensor was mounted to the finger while the joint was extended (0°, 0% strain), and connected to a multimeter via wires hooked onto copper tape electrodes. To reduce contact resistance between the copper tape and the SR/rGO film, a layer of carbon grease was applied. This carbon grease layer extended approximately 1 mm into the centre of the sample on each side, in order to mitigate the effects of deformations caused by the rigid copper tape during sample stretching. White dots were marked on the sample's side – one at the edge of each carbon grease electrode and one aligned with the primary axis of the joint. The test was recorded on a camera, and the dot coordinates were tracked and extracted using the Open Source Physics Tracker application (version 6.1.6). Subsequently, the strain induced in the film due to the bending motion was calculated by summing the distances between the outer dots and the central dots across all frames of the video.3 Results and discussion
3.1 Primary characterisation
The mechanical properties of the pure silicone rubber include a very low Young's modulus of 0.04 MPa (as shown in Fig. 1a) and high failure strain of 740% (Fig. 1b). Incorporation of the rGO nanoplatelets led to a linear increase of the 100% modulus of the nanocomposite with increasing filler volume fraction, suggesting effective dispersion of rGO within the polymer matrix and formation of a strong rGO–SR interface. Notably, the range of 100% modulus values for SR/rGO composites of the given loadings (0.09–0.38 MPa) closely aligns with the stiffness range typically associated with human skin (0.08–0.60 MPa).27 The stretchable nanocomposite material therefore lends itself to applications in wearable electronics devices as it is expected to adhere favourably to the body and easily conform to bodily movements without causing any tugging or discomfort to the user.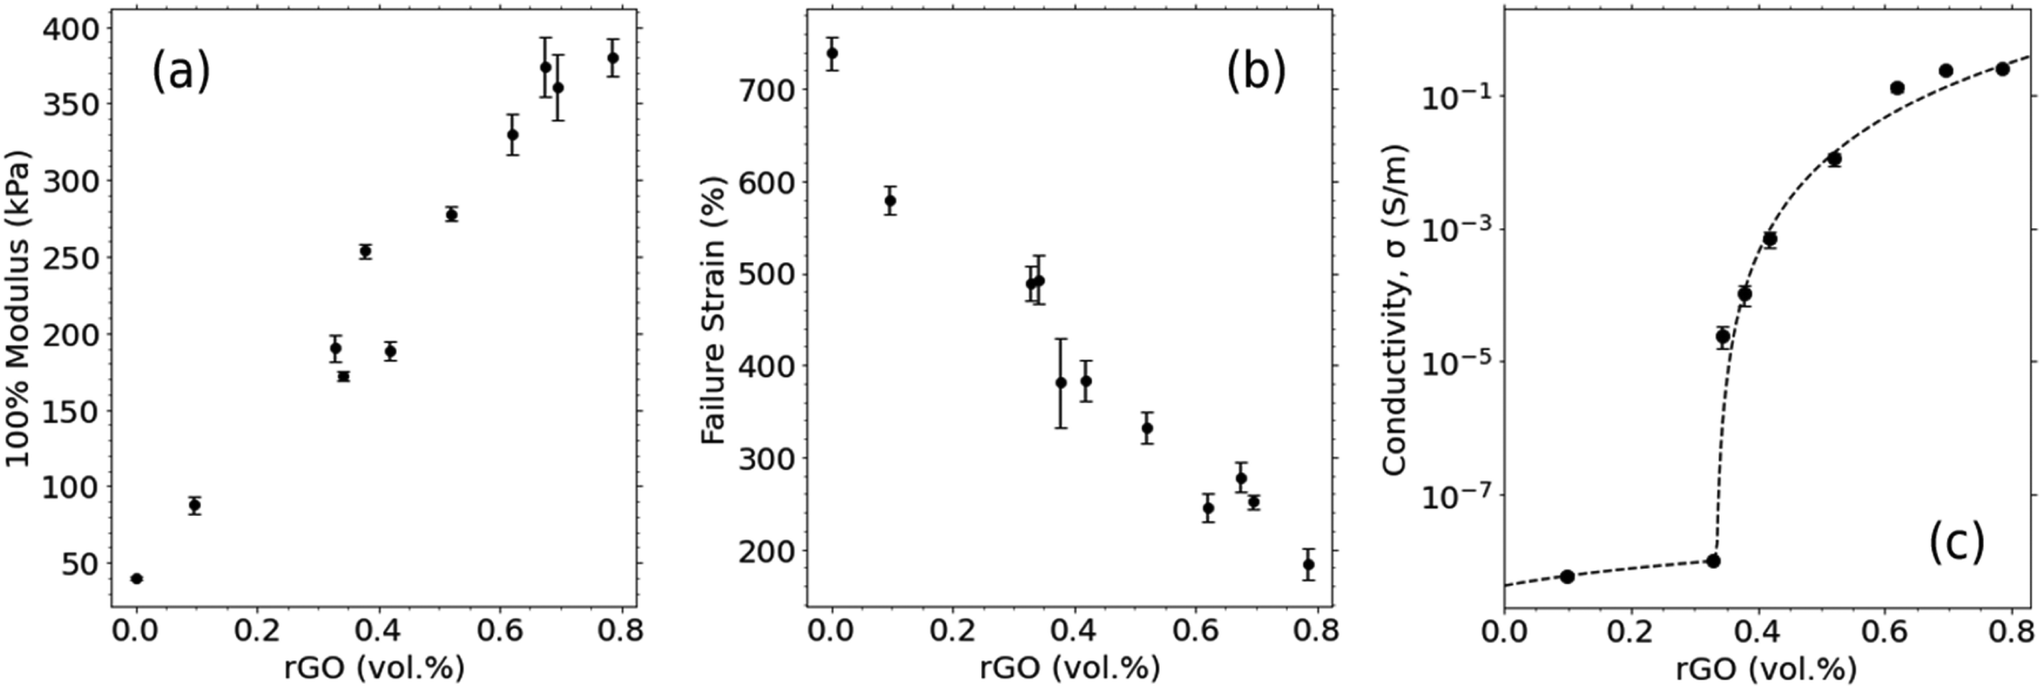 | ||
| Fig. 1 Mechanical and electrical properties of SR/rGO nanocomposites with varying rGO filler content. (a) 100% modulus. (b) Elongation at break. (c) Electrical conductivity exhibiting percolation at 0.33 vol%. | ||
As expected, higher concentrations of the rGO filler result in fracture at lower strain levels, which can be attributed to an increased incidence of nanofiller aggregates which act as stress concentration points in the material.28 Nevertheless, all conductive composites maintain a high degree of flexibility, stretching 2–5 times their original length before breaking (Fig. 1b).
The electrical conductivity of the SR/rGO nanocomposites is presented in Fig. 1c. Samples exhibit sufficient conductivity for sensing applications even at very low filler loadings, with values of 0.1–1 S m−1 being reached beyond 0.62 vol%. Fitting the data to the percolation equation, σ = σ0(θ − θc)t, yields a percolation threshold, θc, of 0.33 vol%.
3.2 Models for calibration of strain sensors
The change in resistance of conductive nanocomposites due to deformation under tensile strain can be used to facilitate strain sensing. This is demonstrated in Fig. 2a where relative resistance versus strain curves for SR/rGO nanocomposite films over a range of conductive filler loadings can be seen. All nanocomposites exhibited a strong piezoresistive response with increasing tensile strain. We observe that increasing rGO filler content increases the conducting strain range of the sample, however there is a corresponding decrease in the sensitivity of the nanocomposite's piezoresistive response to tensile strain. | ||
| Fig. 2 SR/rGO strain sensors with varying rGO filler content. (a) Strain sensing response curves over full conducting strain range. (b) Calibration of 0.42 vol% sensor approximating the piezoresistive response as linear in the low-strain region. The useable region is highlighted in red. (c) The same for 0.79 vol%. | ||
For a material to be suitable for strain sensing, it is essential that its electromechanical response to applied strain is both predictable and fundamentally understood. Hence, a successful calibration method should establish a relationship that accurately converts resistance changes into strain values, all while remaining practical to implement.
Considering the expected exponential response due to tunneling effects, comparable constraints are likely to be encountered in the case of numerous nanocomposite materials. Hence, without a substantial engineering effort to induce linearity in their piezoresistive response, this calibration method may not be the most suitable choice for utilising the stretchable properties of elastomer nanocomposites in high-strain applications.
Many works instead employ a stepwise calibration, approximating a linear response to strain over several regions29–32 which together cover the whole conducting strain range of the sensor. In our work, electromechanical tests were performed on SR/rGO nanocomposites and calibration was attempted using different models. The results for the stepwise linear calibration of a SR/rGO sensor with a filler concentration of 0.70 vol% are presented in Fig. 3. Each strain region (e.g. A, B, C in Fig. 3a) has its own gauge factor value, corresponding to the sensitivity of the strain sensor in each strain region, given by the gauge factor (G) equation.
 | (4) |
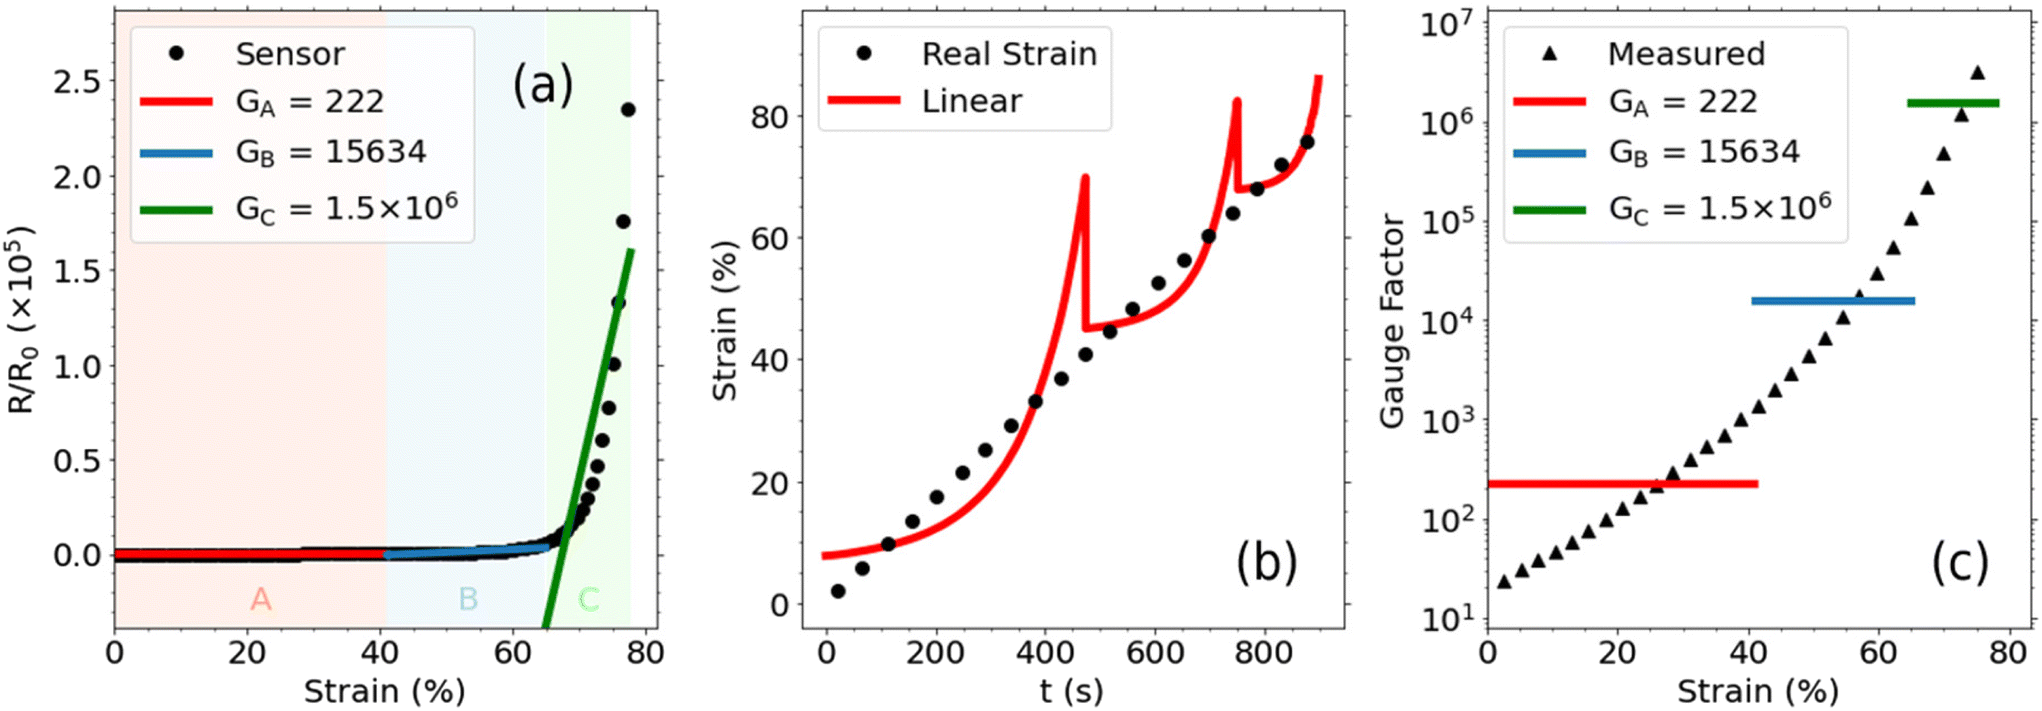 | ||
| Fig. 3 Stepwise linear calibration of SR/rGO strain sensor (0.70 vol%). (a) Response curve with red, blue and green lines representing linear fitting in three different strain regions. (b) Accuracy of calibration with the black dots representing the strain applied to the sensor. The red line shows the strain calculated using the sensor's change in resistance and the given calibration. (c) G measured at different strains using the gradient of the response curve. For comparison, the gauge factor values from the given calibration are plotted in red, blue and green. | ||
In Fig. 3a we can observe the relative change in resistance measured across the SR/rGO (0.70 vol%) strain sensor undergoing increasing tensile strain at a constant rate, until a maximum 78% strain, past which the strain sensor is electrically insulating. We have performed linear fittings at three different regions, (a) from 0%–41% strain where the gauge factor, G, is found to be 222, (b) from 47%–76% strain where the gauge factor is found to be 1.56 × 10⁴ and (c) from 76%–94% strain where the gauge factor is found to be 1.55 × 10⁶. A zoomed-in section of the graph can be seen in Fig. S4,† in which it is clearer to see the increase in gauge factor between regions A and B. In most literature works, the delineation between strain regions being calibrated over is seemingly arbitrary, which poses problems when trying to compare the performance of one strain sensor to the next. In our case, the locations of the three strain regions have been chosen to maximise the coefficient of determination, r2, which for each of the regions in the example given in Fig. 3a, was able to reach a maximum of r2 = 0.75. As expected, the electromechanical response to strain does not follow a linear trend across the whole strain range and that is reflected in the low value of r2.
The accuracy of this stepwise model could be improved by using a larger number of smaller strain regions, or by limiting the usable strain range to only very low strains. However, discontinuities between the bounds of consecutive strain regions would still translate into irregularities in the strain interpreted by the sensor output. This effect is illustrated in Fig. 3b which shows the real strain applied, compared with the strain that is read from the sensor output after the given stepwise linear calibration. Notably the absolute error in strain readings seen in Fig. 3b is at points as high as 29%. The absolute error in the strain reading is also higher in low strain regions than it is in high strain regions since the relationship between tunneling resistance and strain is exponential (see eqn (3)). Therefore, resistance intervals scale logarithmically when being converted to strain.
Given the high non-linearity observed in the increase in resistance with respect to tensile strain (Fig. 3a) a more accurate representation of the sensitivity of the sensor can be obtained using the gradient at any point along the response curve (i.e. the instantaneous rate of change in resistance with respect to strain),
 | (5) |
Fig. 3c shows the instantaneous gauge factor of the SR/rGO sensor measured using the gradient of the response curve. In contrast, the gauge factor values from the given stepwise linear calibration are plotted in red, blue and green, highlighting the inability of the linear model to accurately characterise the electromechanical response of low filler content nanocomposite materials for use in strain sensors.
| R = R0eGexpε (ε ≤ εmax) | (6) |
In Fig. 4a a fitting of experimental data for our SR/rGO strain sensor (0.70 vol%) to this relationship is shown. To give an accurate calibration for the largest part of the conducting strain range, fitting is successfully applied only up to a working strain range of εmax = 60%. Past this threshold, the resistance rises faster than the exponential model is able to predict with increasing strain. We can attribute this behaviour to the breakdown of the conductive network, represented in eqn (3) by the number of conducting paths, N, decreasing sharply.
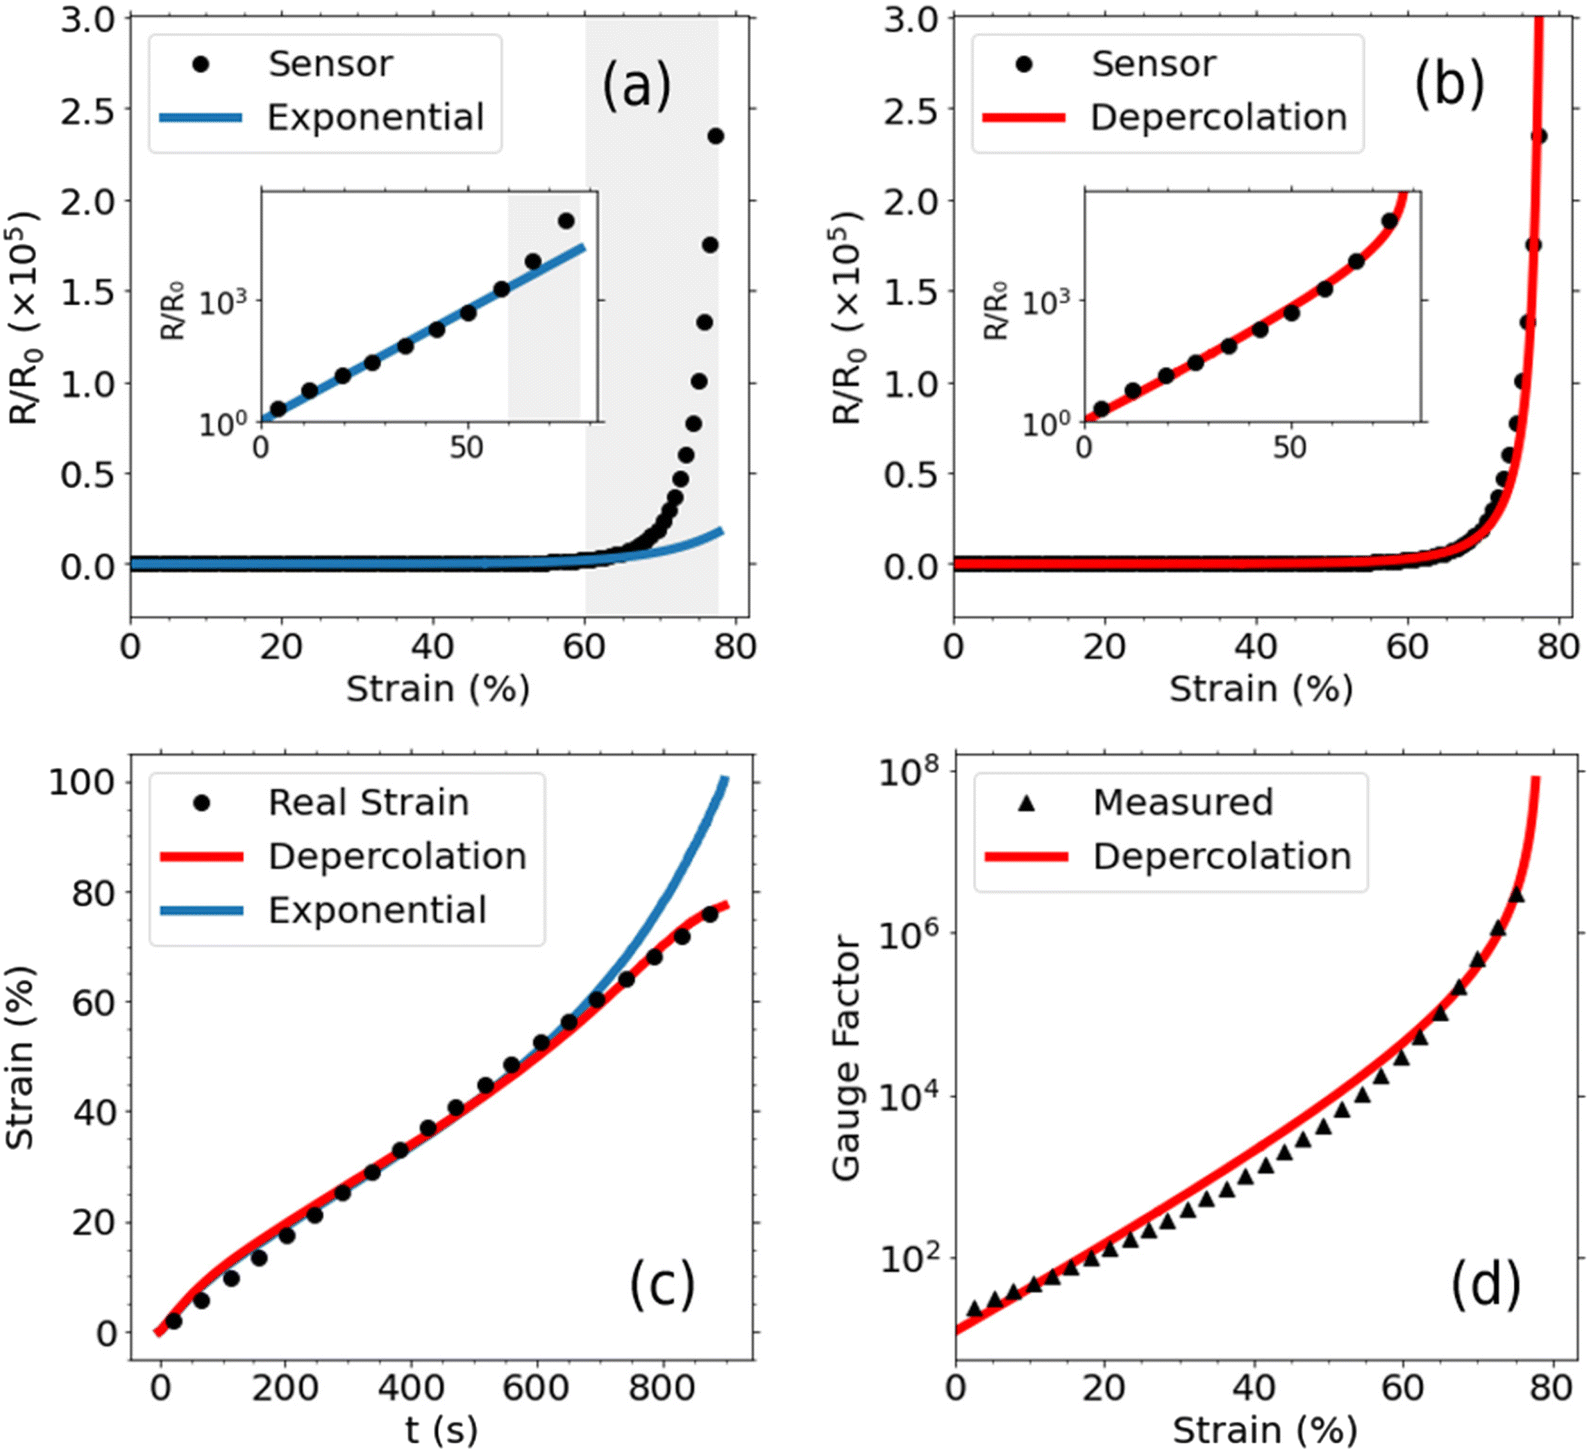 | ||
| Fig. 4 Non-linear calibration of SR/rGO strain sensor (0.70 vol%). (a) Exponential calibration up to 60% strain. Past this threshold, the resistance rises faster than the exponential model is able to predict with increasing strain (region marked in grey). The inset graph shows the same data on a logarithmic scale. (b) Calibration across full range of tensile strain using the depercolation model. (c) Accuracy of calibration using the depercolation model compared with using the exponential model. The black dots represent the strain applied to the strain sensor. The red and blue lines show the strain calculated using the sensor's change in resistance and calibrated using the depercolation and exponential model respectively. (d) Gauge factor of the sensor measured at different strains using the gradient of the response curve. The red line shows the gauge factor predicted at different strains using the depercolation model. | ||
The exponential model predicts the observed electromechanical behaviour to a high accuracy whilst also avoiding the discontinuities in outputted strain seen from using a stepwise calibration. However, the use of the exponential model can significantly limit the working range due to its inability to predict the sensing behaviour at high strains. This effect is most limiting for systems with low conductive filler contents, which is often desirable in order to achieve maximum sensitivity while keeping costs low, or for soft systems that demand sensing at large strains (higher than 100%).
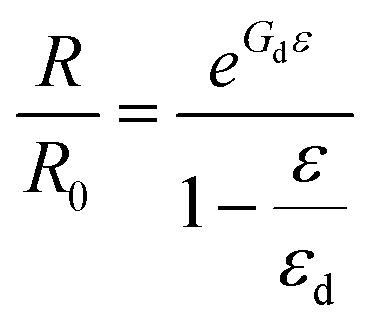 | (7) |
Fitting of our experimental data to this new model is shown in Fig. 4b for an SR/rGO strain sensor (0.70 vol%), which yielded an r2 value of 0.99. Tunneling sensitivity was found to be 10.8 and depercolation strain was found to be 78.5% which is approximately 1% strain higher than the maximum resistance that the multimeter could measure. A series of samples with filler contents ranging from 0.42 vol%–0.79 vol% were measured in the same way and were fitted to the depercolation model with r2 ≥ 0.98. Example fittings and averaged fitting parameters for all loadings are presented in section 2 of the ESI.†
Fig. 4c shows the real strain applied to the SR/rGO strain sensor (black dots) compared with the sensor's strain output calibrated using the depercolation model (red line) and the exponential model (blue line). The detailed derivation of the equation for calculating strain within the depercolation model is shown in section 3 of the ESI.† The excellent agreement of the theoretical and experimental results across the whole strain range illustrates the improved accuracy of calibration using the depercolation model compared with the exponential model at high strains.
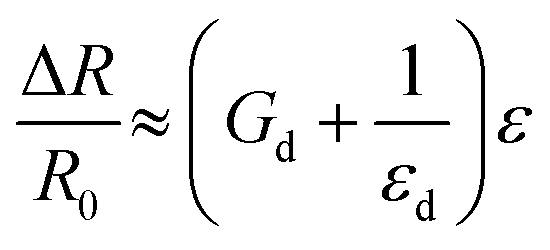
The instantaneous gauge factor can also be predicted to a high accuracy at any given strain by taking the first derivative of the proposed depercolation model (eqn (7)) with respect to strain,
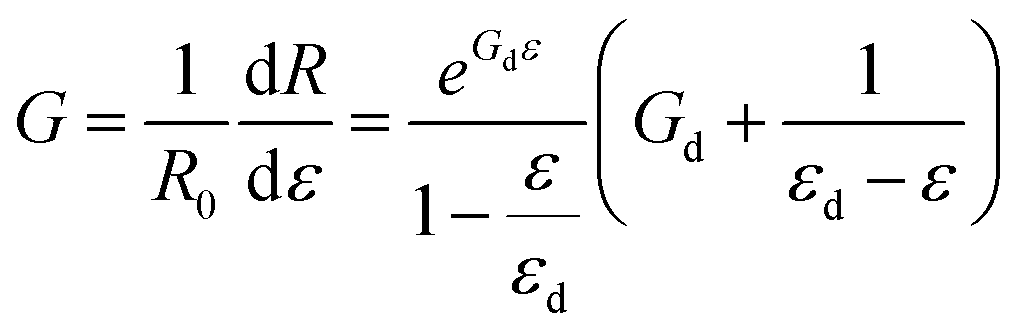 | (8) |
We can see this demonstrated in Fig. 4d which shows the gauge factor calculated using resistance measurements and the corresponding value predicted by the depercolation model. After calibrating using the depercolation model, the instantaneous gauge factor calculated for each sample tested agreed with the predicted trends to an r2 ≥ 0.98. Fig. 5a depicts the expected variation in gauge factor with increasing strain across the entire range of filler loadings for SR/rGO sensors used in this study, using the averaged fitting parameters obtained from calibration. From the figure, it's evident that higher filler loadings lead to an increase in depercolation strain, with a corresponding reduction in gauge factor over most of the usable strain range. Additionally, the rate of increase in gauge factor with respect to strain is lower for higher filler loadings. Hence, stretchable nanocomposites with high conductive filler contents are the most suitable for sensing over large strain ranges, whereas low filler loadings can be employed to make more sensitive measurements over smaller ranges.
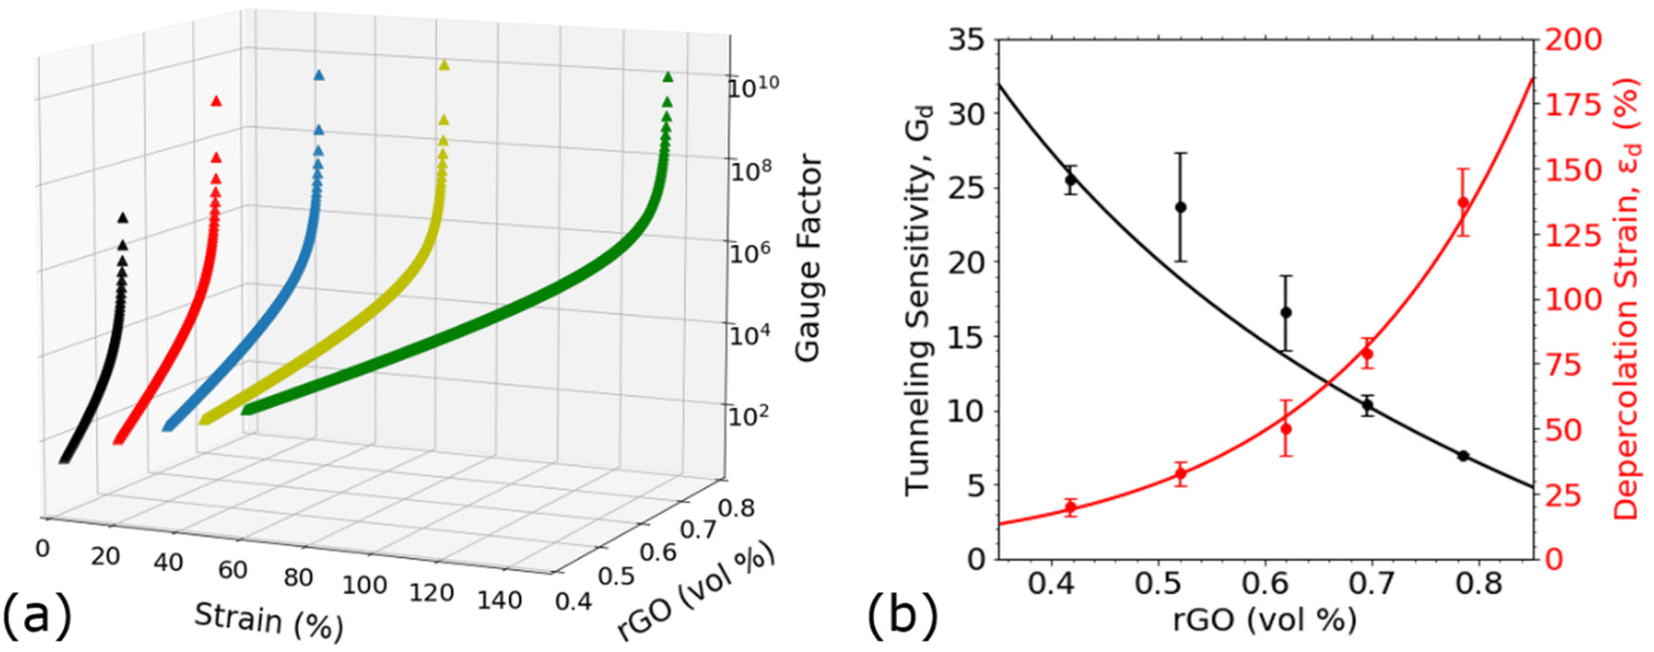 | ||
| Fig. 5 (a) Gauge factor of SR/rGO strain sensors with filler contents ranging from 0.42 vol% to 0.79 vol% as a function of strain, as predicted by the depercolation model. (b) Depercolation model parameters as a function of filler content. Data from calibration of SR/rGO strain sensors with conductive filler contents from 0.42 vol% to 0.79 vol%. Error bars represent the standard deviation from testing three specimens for each loading. On the left axis tunneling sensitivity has been fitted to an inverse cube root (black line). On the right axis the depercolation strain has been fitted to an exponential trend as a guide for the eye (red line). | ||
For low-modulus composites with high filler content featuring densely interconnected conductive filler networks, small deformations should have a minimal impact on the number of particles forming one conducting path or the number of conducting paths facilitating end-to-end conduction. Composites with low filler contents, however, are subject to large variations in the number of conducting paths when exposed to high tensile strains. The nature of these variations is highly complex and statistical, but with the following assumptions, some approximations about their strain-related behaviour can be made using the depercolation model that is presented in this work.
For a sufficiently well dispersed nanofiller network, we can approximate that at zero strain, the fillers within conductive pathways have a uniform separation of s0. For a low filler density in this configuration, the cross-sectional area over which tunneling occurs between fillers is small. Any change in this area with strain is expected to have a negligible effect on the overall resistance in comparison to that of the increase in separation of fillers, as demonstrated in eqn (3). For the sake of our model then, we can assume that this area is independent of strain and that the number of particles forming one conducting path remains constant at all strains (L = L0), so only the interparticle separation and the number of conducting paths are changing as a function of strain:
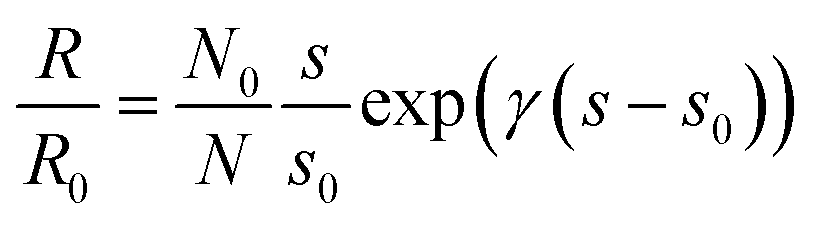 | (9) |
If we also assume that when a tensile strain, ε, is applied to the composite, this translates to a uniform and unidirectional strain to the entire filler network, then we can make the following substitution,
 | (10) |
Equating this form of the tunneling resistance equation with the resistance predicted by the depercolation model in eqn (7) allows us to solve for the tunneling sensitivity, Gd, giving the following:
| Gd = γs0 + kN | (11) |
The first term is determined by the height of the potential barrier for tunneling between fillers, and the interparticle separation of the filler at zero strain. The second term, the network decay constant, kN, is dependent on the rate of the breakdown in the conducting network with increasing strain. It is defined by the following equation, which models the number of conducting pathways, N, in relation to increasing tensile strain,
 | (12) |
It can be shown however that for robust conductive networks, where N0 is large,
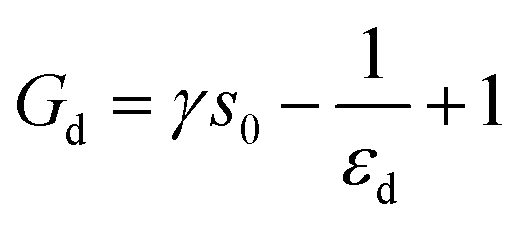 | (13) |
From eqn (11), we can see that the tunneling sensitivity, Gd, depends on the work function of the materials and the interparticle separation of the filler at zero strain, s0. The former being a function of the choice of materials forming the composite, and the latter being determined by filler dimensions, filler orientation, filler volume fraction and dispersion state. Additionally, the resilience of the conducting network with respect to increasing tensile strain has an impact on the tunneling sensitivity, represented here by kN. These network effects can influence tunneling sensitivity to varying degrees depending on, among other things, filler loading, dispersion state, and sensor dimensions. However, except in extreme cases where the network rapidly breaks down under minimal strain (εd ≪ 1), the relative contribution to Gd is small compared with that of the first term. This is evident from eqn (13) where the term for network effects is expressed in terms of the depercolation strain (see section 4.1 of the ESI† for derivation).
Fig. 5b shows the variation of depercolation strain and tunneling sensitivity of SR/rGO composites as a function of volume fraction of filler. Empirically we can observe that the depercolation strain follows an increasing exponential trend with respect to filler volume fraction (r2 = 0.99). The tunneling sensitivity decreases following an inverse cube root dependence on filler volume fraction. This is consistent with the heavy dependence on decreasing separation of fillers shown in eqn (11) as filler loading increases.
3.3 Discussion
Although not all nanocomposite systems demonstrate identical behaviour to the one examined in this study, the foundational principles of tunneling sensitivity, and complete network breakdown marked by the depercolation strain, are generally ubiquitous in instances of high-strain stretching. Particularly in elastomer nanocomposites with low conductive filler contents, where breakdown of the conductive network precedes mechanical failure. Therefore, the depercolation model presented here is expected to find broad applicability in enabling a comprehensive calibration over the full conducting strain range of various other soft nanocomposite materials. However, adaptation of the model may be required in systems featuring additional alternative piezoresistive mechanisms. Beyond this, the model serves as a valuable tool for both describing and modelling piezoresistive systems and their fundamental mechanisms within highly stretchable nanocomposite materials. This, in turn, can offer valuable insights into predicting and designing improved strain sensing performance.In a nanocomposite where the fillers are homogeneously dispersed, if the average interparticle separation between fillers is within a suitable range, then the majority of filler sites are close enough to each other to form the tunneling junctions which constitute the network of conducting pathways. When it exceeds the maximum cut-off distance to allow the exchange of tunneling currents, then the majority of tunneling junctions are deactivated and the number of conducting paths falls rapidly with increasing strain. This cut-off distance for two parallel graphene sheets insulated with polymer has been estimated as 2–3 nm.36,37 However, it has been suggested that many composites showing evidence of tunneling-dominant conductivity are sustained by conductive fillers with polymer layer coatings greater than 10 nm thick, supporting the theory that a multi-step electron hopping process is prominent in transport mechanisms through conductive polymer composites.38 In some studies cut-off distances have been reported approaching 1 μm (ref. 38–40) although these unusually high thresholds are believed to rely upon the presence of impurities and additives within the polymer.
For nanocomposites of low filler contents such as the ones studied in this work, we can predict that the strain sensing sensitivity at high strains is dominated by the creation and destruction of conducting pathways. Whereas improving sensitivity over the whole strain range can be achieved by maximising the tunneling sensitivity. This is supported by the equation for gauge factor according to the depercolation model (eqn (8)), in which Gd is dominant for all strains below the depercolation strain, εd, apart from at the highest strains (ε ≈ εd), where the behaviour of the gauge factor becomes asymptotic with increasing strain. Eqn (11) shows that tunneling sensitivity increases with an increase in the interparticle distance at zero strain, s0. Due to network effects though, this increase can be counteracted if the depercolation strain is lowered to much less than 100%. Given the range of values for Gd and εd measured in this study (see Fig. 5b), we expect the effects of any changes in interparticle separation to significantly outweigh those related to network effects, apart from in extreme cases such as very high degrees of agglomeration or filler contents being very close to the percolation threshold. To gain some control over the gauge factor then, it may help to understand how tunneling sensitivity can be affected by composite properties which dictate the spatial configuration of the filler network (e.g. filler dimensions, alignment of fillers and dispersion state).
It is expected that using fillers with a higher aspect ratio will lead to a lower percolation threshold since the average distance between adjacent particles should be lower for the same volume fraction.39 In the case of nanocomposites with platelet-like fillers, using considerations of interparticle distance, we predict that any change in filler dimensions, which leads to a decrease in percolation threshold, is counteracted by a decrease in the tunneling sensitivity (see section 4.2 of the ESI†). The trade-off that filler dimensions presents between higher sensitivity and lower percolation threshold for a given loading is in line with predictions made by other models relating to gauge factor and percolation threshold.41 However, in most cases when the percolation threshold is lowered, it is likely that the same tunneling sensitivity or greater may subsequently be recovered at a lower filler loading. It should also be noted that polydispersity can have a significant effect, as the behaviour of a percolating network is highly sensitive to the distribution of filler shapes and sizes.42
In terms of filler orientation, the preferential alignment of fillers in nanocomposites can lead to reduced connectivity between fillers, often resulting in higher percolation thresholds.41,43–46 When compared with highly aligned configurations, 3D random orientation offers a higher probability of forming percolating pathways.38 However, in many cases, the method used to produce filler alignment in nanocomposites induces a spatial reconfiguration of the filler network such that it is hard to decouple the effect of filler orientation from the effect of the change in overall dispersion state. For example, Wu et al.47 used an electric field to induce the alignment of graphene nanoplatelets (GnPs) in epoxy nanocomposites, leading to the formation of a highly directional chain-like structure of bundled GnPs which significantly lowered the percolation threshold.
Within a uniformly dispersed network, we predict that a high degree of alignment of anisotropic fillers in the direction of strain would decrease the average interparticle separation, and therefore decrease the tunneling sensitivity overall (see section 4.3 of the ESI†). Of course, relying on increasing filler separations to increase tunneling sensitivity necessarily means that networks are able to undergo less strain before tunneling junctions are deactivated, manifesting as a reduced depercolation strain (and overall lower working range of the strain sensor). The choice between high sensitivity and large working ranges is well discussed in the literature. Most notably, Boland used the Krauss model to formalise an approximate relationship between the working range of linear nanocomposite strain sensors and their gauge factors.7 In the low strain limit, this trade-off is even clear within the depercolation model. Taking the Taylor expansion of eqn (7), it can be shown that,
 | (14) |
The term in parentheses now matches the definition of the gauge factor (eqn (1)). This indicates that for low strain applications, the gauge factor of resistive-type composites can be maximised either by increasing the tunneling sensitivity, or equally, by adopting network configurations with a lower depercolation strain (e.g. inhomogeneous/highly clustered dispersion of fillers).
The formation of an effective conductive network requires the filler to be dispersed through the polymer matrix to form end-to-end conductive pathways. In the case of a poor quality of dispersion, the existence of bottlenecks (where all current is forced to flow through a single interparticle junction) can limit the conductivity of the composite.41,48 In contrast to mechanical characteristics,49 an uneven filler dispersion can actually enhance the electrical properties of nanocomposites. The presence of aggregated structures interconnected by individual fillers is able to decrease the percolation threshold and increase the conductivity compared with uniform dispersions.16,40,50–52
In the case of nanocomposites with randomly dispersed filler networks, a high degree of aggregation would likely lead to a piezoresistive response dominated by large filler separations in between aggregated clusters. Tunneling sensitivity at low tensile strain may be higher as a result of these elevated interparticle separations. However, with tunneling currents between diverging clusters being cut off at relatively low strains, the conductive network will terminate much earlier, and the sensor's working range would be severely inhibited as a result. Moreover, an excessive dependence on network effects introduces random variations into the piezoresistive behaviour, diminishing the repeatability of sensing performance. Therefore, a well dispersed nanofiller network is highly desirable for strain sensing.
Similarly, the successful calibration of nanocomposite strain sensors hinges on having an efficient transfer of strain to the filler network. The effect of nanofiller slippage on the stability of the conductive network with respect to strain makes the piezoresistive response less predictable, as well as potentially negatively impacting strain sensing sensitivity. To mitigate these effects, achieving sufficient interaction between filler and matrix is crucial for optimising strain sensing behaviour and realising a reliable calibration.
3.4 Wearable sensor demonstration
A wearable sensor demonstration was conducted in which repeated bending motion of the proximal interphalangeal joint was monitored using an SR/rGO film (0.62 vol%), mounted to an index finger (Fig. 6a). Fittings to two separate models (depercolation and exponential) were performed, using resistance and strain data obtained from the largest monotonic strain ramp within the dataset. The resulting fitting parameters were used to calibrate the sensor output to predict the strain undergone by the sample during repeated bending. | ||
| Fig. 6 Wearable device demonstration. (a) Finger bending experiment where strain is determined by tracking distance between dots drawn on the sample. (b) Resistance measured through sensor (in black) shown on a logarithmic scale, and strain (in red) monitored via motion tracking on a camera, both plotted against time over a three flexions of increasing magnitude (approximately 40–90°). | ||
Fig. 6b shows the strain plotted in black (left axis) from three sequential joint flexions of increasing magnitude. The resulting change in resistance plotted in red on a logarithmic scale (right axis), roughly mirrors the strain curve, suggesting that the piezoresistive response of the material scales approximately exponentially with strain. Notably though, the alignment is less accurate in the first peak, which spans a lower strain range, compared with the two higher peaks. This observation can be attributed to the fact that, at high strains, the piezoresistivity diverges from the exponential trend. Consequently, when employing a strictly exponential model for calibration, some inconsistency in accuracy is anticipated between low and high strain ranges.
By calibrating using the depercolation model, we see in Fig. 7a that the strain interpreted by the sensor is in good agreement with the real strain measured using motion tracking. The model can maintain high accuracy over a broader range of strain amplitudes by incorporating the deviation from the exponential trend in piezoresistivity that occurs at high strains (see Fig. 7d).
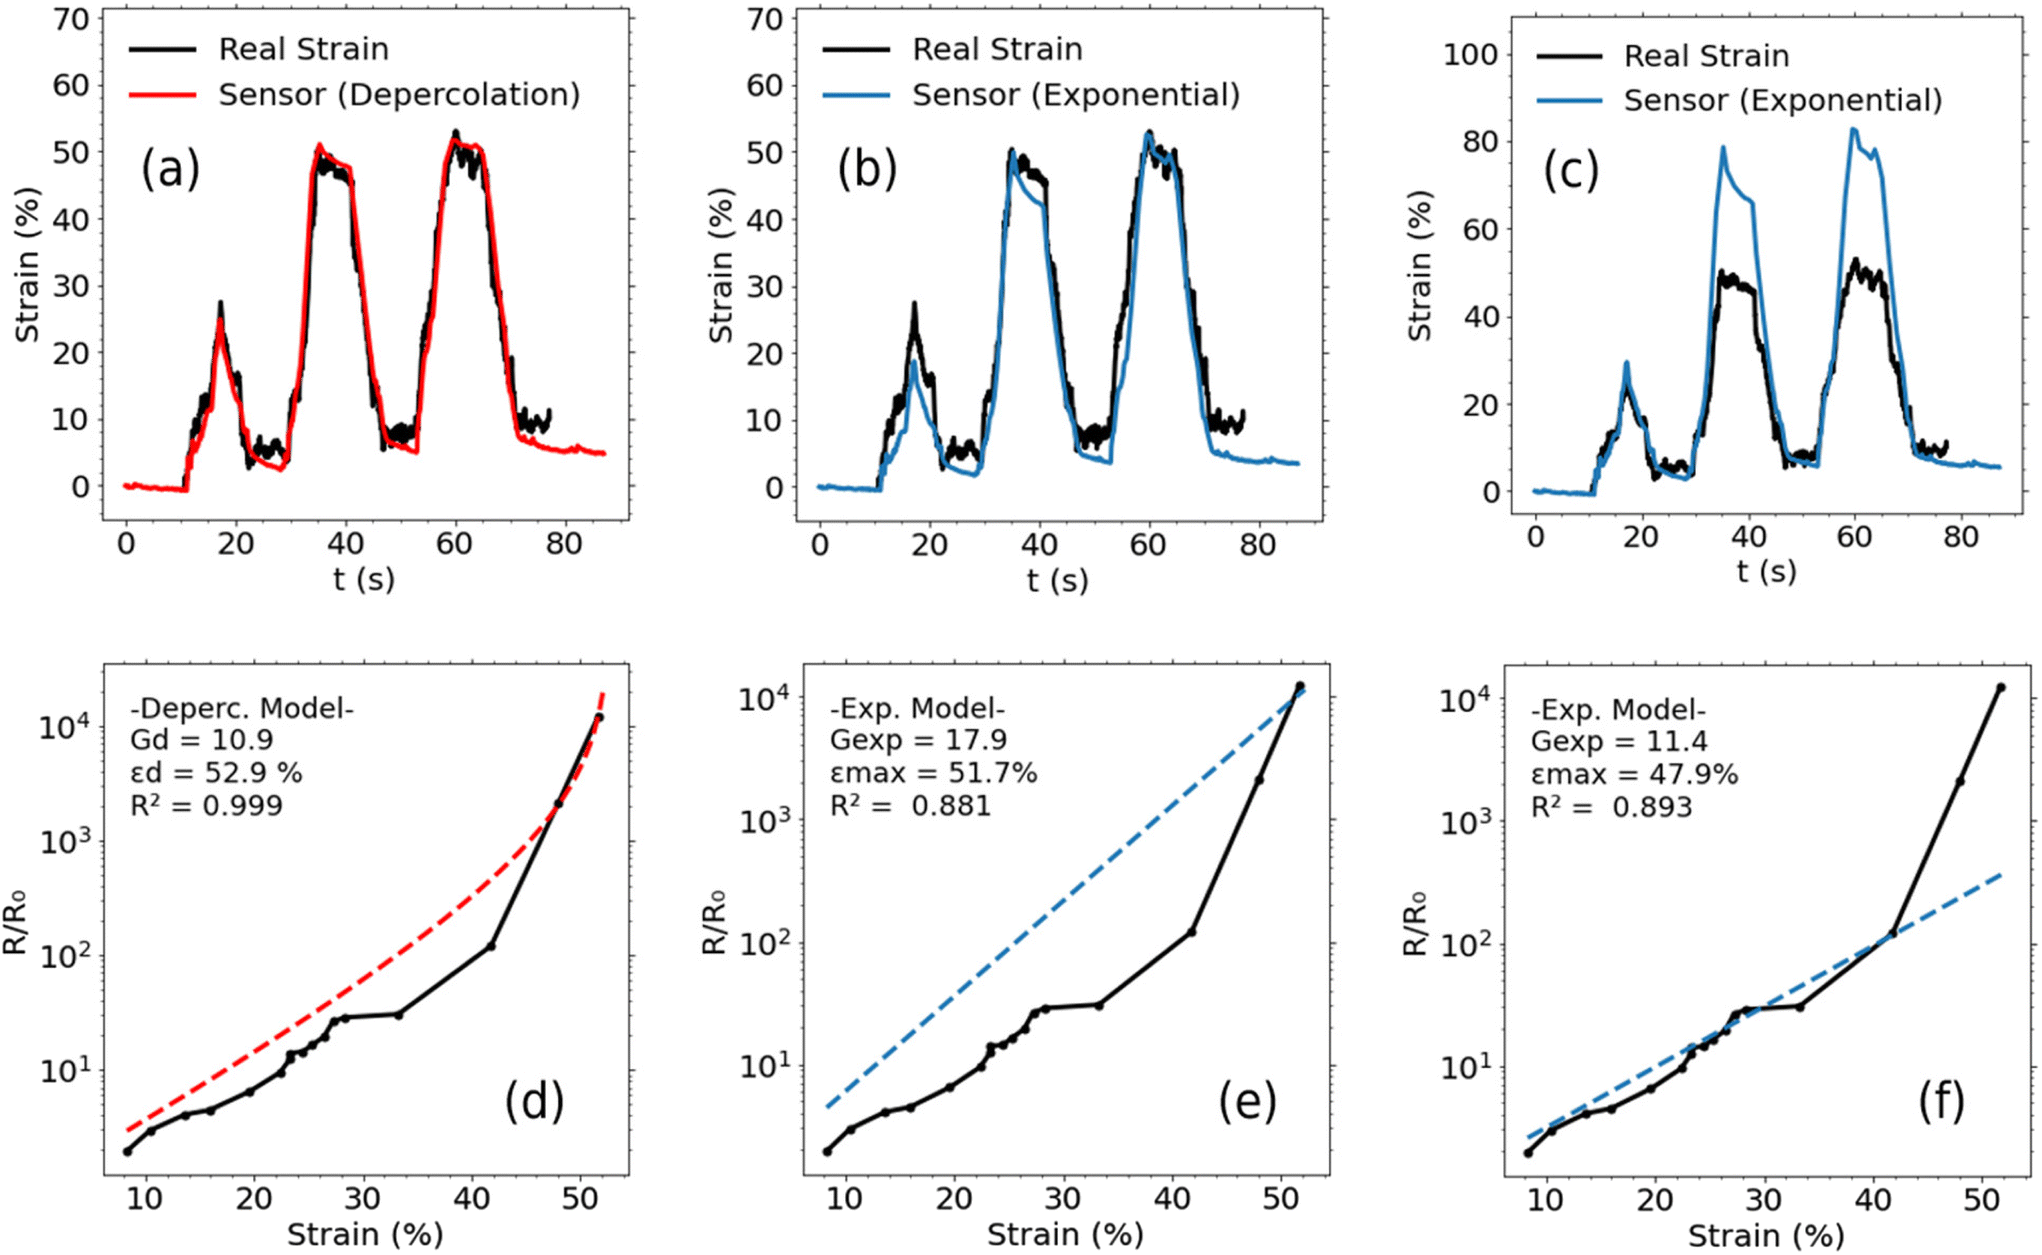 | ||
| Fig. 7 Calibration of wearable sensor monitoring finger bending motion (top) using data from the ramp with the highest strain range (bottom). (a)–(c) Strain output by sensor when calibrated using (a) depercolation model fitted across full strain range. (b) Exponential model fitted across full strain range. (c) Exponential model fitted up to strain of 47.9% (yielding maximum R2 value). (d–f) Fitting of model to data to attain calibration parameters. | ||
This distinction is illustrated more clearly in the two applications of the exponential model for calibration in Fig. 7. When the fitting over the whole strain range, as in Fig. 7b and e, the accuracy in the low range is poor. In Fig. 7c and f, fitting to the exponential model is performed only in the lower strain region, before the piezoresistive response diverges from the exponential trend. This results in a high level of accuracy in the low strain range, however higher strains are drastically overestimated (Fig. 7c), meaning the calibration limits the reliability of the sensing material to only a fraction of its conducting strain range. In contrast, the depercolation model demonstrated effectiveness in accurately predicting strain over ranges that almost entirely cover the conducting strain range of the material.
4 Conclusions
In summary, following a discussion on the various approaches for the calibration of resistive-type strain sensors, the electrical depercolation model for the piezoresistivity of conductive nanocomposites is presented. Using two well defined parameters, the tunneling sensitivity, Gd, and the depercolation strain, εd, this new model allows for calibration over the entire conducting strain range of stretchable nanocomposite sensors. The model is shown to fit example data from SR/rGO nanocomposites exceptionally well and is deemed to be particularly valuable for soft elastomer nanocomposites of low conductive filler content, for which the effects of network breakdown precede mechanical failure.Provided some fundamental understanding on the primary piezoresistive mechanisms driving the electromechanical response in a nanocomposite system, the proposed electrical depercolation model is a valuable tool for describing and modelling the resulting performance metrics. This, in turn, yields valuable insights for predicting strain sensing capabilities. In our analytical modelling, we establish a relationship between sensitivity and separation of fillers, broadly applicable to any mixed-phase conductive nanocomposite. Factors such as filler dimensions, filler orientation and dispersion quality, and their effect on sensitivity and working range are thereby discussed in the context of interparticle distance modelling.
Although widely applicable to highly stretchable nanocomposites strain sensors, the electrical depercolation model should only be valid for devices with conductive filler networks consisting predominantly of fillers not always in contact. Depending on design and filler types, other piezoresistive mechanisms may be present that cause the electromechanical response to vary in form compared to that which is being studied here.
The development of highly stretchable and accurate flexible nanocomposite strain sensors will be foundational in unlocking a number of advanced technologies. Our approach represents an important advancement toward realising the potential of stretchable nanocomposites for strain sensing, while also deepening our understanding of flexible strain sensor behaviour.
Author contributions
O. Tomes: investigation, conceptualization, formal analysis, software and writing – original draft. O. Tomes, A Soul: methodology and visualization. D. G. Papageorgiou: conceptualization and writing – review & editing. D. G. Papageorgiou, H. Zhang, E. Bilotti: supervision.Conflicts of interest
The authors declare no conflicts of interest.References
- M. Amjadi, et al., Stretchable, Skin-Mountable, and Wearable Strain Sensors and Their Potential Applications: A Review, Adv. Funct. Mater., 2016, 26(11), 1678–1698 CrossRef CAS.
- Y. Luo, et al., Technology Roadmap for Flexible Sensors, ACS Nano, 2023, 17(6), 5211–5295 CrossRef CAS PubMed.
- M. Bao, Analysis and design principles of MEMS devices, Elsevier, 2005 Search PubMed.
- A. Qiu, et al., A Path Beyond Metal and Silicon:Polymer/Nanomaterial Composites for Stretchable Strain Sensors, Adv. Funct. Mater., 2019, 29(17), 1806306 CrossRef.
- Y. Lu, et al., Recent developments in bio-monitoring via advanced polymer nanocomposite-based wearable strain sensors, Biosens. Bioelectron., 2019, 123, 167–177 CrossRef CAS PubMed.
- S. Choi, et al., High-performance stretchable conductive nanocomposites: materials, processes, and device applications, Chem. Soc. Rev., 2019, 48(6), 1566–1595 RSC.
- C. S. Boland, Stumbling through the Research Wilderness, Standard Methods To Shine Light on Electrically Conductive Nanocomposites for Future Healthcare Monitoring, ACS Nano, 2019, 13(12), 13627–13636 CrossRef CAS PubMed.
- S. Peng, et al., Conductive Polymer Nanocomposites for Stretchable Electronics: Material Selection, Design, and Applications, ACS Appl. Mater. Interfaces, 2021, 13(37), 43831–43854 CrossRef CAS PubMed.
- V. Orts Mercadillo, et al., Electrically Conductive 2D Material Coatings for Flexible and Stretchable Electronics: A Comparative Review of Graphenes and MXenes, Adv. Funct. Mater., 2022, 32(38), 2204772 CrossRef CAS.
- J. G. Simmons, Generalized formula for the electric tunnel effect between similar electrodes separated by a thin insulating film, J. Appl. Phys., 1963, 34(6), 1793–1803 CrossRef.
- L. Duan, D. R. D'Hooge and L. Cardon, Recent progress on flexible and stretchable piezoresistive strain sensors: From design to application, Prog. Mater. Sci., 2020, 114, 100617 CrossRef.
- P. Cataldi, A. Athanassiou and I. S. Bayer, Graphene Nanoplatelets-Based Advanced Materials and Recent Progress in Sustainable Applications, Appl. Sci., 2018, 8(9), 1438 CrossRef.
- H. Souri, et al., Wearable and Stretchable Strain Sensors: Materials, Sensing Mechanisms, and Applications, Adv. Intell. Syst., 2020, 2(8), 2000039 CrossRef.
- X.-W. Zhang, et al., Time dependence of piezoresistance for the conductor-filled polymer composites, J. Polym. Sci., Part B: Polym. Phys., 2000, 38(21), 2739–2749 CrossRef CAS.
- J. Chen, et al., An overview of stretchable strain sensors from conductive polymer nanocomposites, J. Mater. Chem. C, 2019, 7(38), 11710–11730 RSC.
- A. J. Marsden, et al., Electrical percolation in graphene-polymer composites, 2D Mater., 2018, 5(3), 032003 CrossRef.
- H. Liu, et al., Electrically conductive thermoplastic elastomer nanocomposites at ultralow graphene loading levels for strain sensor applications, J. Mater. Chem. C, 2016, 4(1), 157–166 RSC.
- Y. Lin, et al., Graphene–Elastomer Composites with Segregated Nanostructured Network for Liquid and Strain Sensing Application, ACS Appl. Mater. Interfaces, 2016, 8(36), 24143–24151 CrossRef CAS PubMed.
- H. Liu, et al., Electrically conductive strain sensing polyurethane nanocomposites with synergistic carbon nanotubes and graphene bifillers, Nanoscale, 2016, 8(26), 12977–12989 RSC.
- L. Chen, G. H. Chen and L. Lu, Piezoresistive Behavior Study on Finger-Sensing Silicone Rubber/Graphite Nanosheet Nanocomposites, Adv. Funct. Mater., 2007, 17(6), 898–904 CrossRef CAS.
- F. R. Al-solamy, A. A. Al-Ghamdi and W. E. Mahmoud, Piezoresistive behavior of graphite nanoplatelets based rubber nanocomposites, Polym. Adv. Technol., 2012, 23(3), 478–482 CrossRef CAS.
- L. Duan, et al., The resistivity–strain behavior of conductive polymer composites: stability and sensitivity, J. Mater. Chem. A, 2014, 2(40), 17085–17098 RSC.
- S. Yu, et al., Superior piezoresistive strain sensing behaviors of carbon nanotubes in one-dimensional polymer fiber structure, Carbon, 2018, 140, 1–9 CrossRef CAS.
- Y. Jia, et al., Flexible and thin multifunctional waterborne polyurethane/Ag film for high-efficiency electromagnetic interference shielding, electro-thermal and strain sensing performances, Composites, Part B, 2021, 210, 108668 CrossRef CAS.
- O. C. Compton and S. T. Nguyen, Graphene Oxide, Highly Reduced Graphene Oxide, and Graphene: Versatile Building Blocks for Carbon-Based Materials, Small, 2010, 6(6), 711–723 CrossRef CAS PubMed.
- A. Kernin, et al., The effect of graphene network formation on the electrical, mechanical, and multifunctional properties of graphene/epoxy nanocomposites, Compos. Sci. Technol., 2019, 169, 224–231 CrossRef CAS.
- D.-H. Kim, et al., Epidermal Electronics, Science, 2011, 333(6044), 838–843 CrossRef CAS PubMed.
- D. G. Papageorgiou, I. A. Kinloch and R. J. Young, Graphene/elastomer nanocomposites, Carbon, 2015, 95, 460–484 CrossRef CAS.
- J. Zhou, et al., Multiscale and hierarchical wrinkle enhanced graphene/Ecoflex sensors integrated with human-machine interfaces and cloud-platform, npj Flexible Electron., 2022, 6(1), 55 CrossRef PubMed.
- Z. Zhang, et al., Tunable stretchable strain sensors enabled by patterned Ecoflex-vertical aligned carbon nanotube arrays and pre-stretching transfer, Carbon, 2022, 197, 218–225 CrossRef CAS.
- Y. Wang, et al., Flexible electrically resistive-type strain sensors based on reduced graphene oxide-decorated electrospun polymer fibrous mats for human motion monitoring, Carbon, 2018, 126, 360–371 CrossRef CAS.
- Z. Tang, et al., Highly Stretchable Core–Sheath Fibers via Wet-Spinning for Wearable Strain Sensors, ACS Appl. Mater. Interfaces, 2018, 10(7), 6624–6635 CrossRef CAS PubMed.
- F. Pan, et al., 3D Graphene Films Enable Simultaneously High Sensitivity and Large Stretchability for Strain Sensors, Adv. Funct. Mater., 2018, 28(40), 1803221 CrossRef.
- Y. Yu, et al., Ultra-Stretchable Porous Fiber-Shaped Strain Sensor with Exponential Response in Full Sensing Range and Excellent Anti-Interference Ability toward Buckling, Torsion, Temperature, and Humidity, Adv. Electron. Mater., 2019, 5(10), 1900538 CrossRef CAS.
- M. A. O'Mara, et al., Ultrasensitive Strain Gauges Enabled by Graphene-Stabilized Silicone Emulsions, Adv. Funct. Mater., 2020, 30(32), 2002433 CrossRef.
- A. B. Oskouyi, U. Sundararaj and P. Mertiny, Tunneling Conductivity and Piezoresistivity of Composites Containing Randomly Dispersed Conductive Nano-Platelets, Materials, 2014, 7, 2501–2521, DOI:10.3390/ma7042501.
- J. Hicks, A. Behnam and A. Ural, A computational study of tunneling-percolation electrical transport in graphene-based nanocomposites, Appl. Phys. Lett., 2009, 95(21), 213103 CrossRef.
- A. Dani and A. A. Ogale, Electrical percolation behavior of short-fiber composites: Experimental characterization and modeling, Compos. Sci. Technol., 1996, 56(8), 911–920 CrossRef CAS.
- J. Li and J.-K. Kim, Percolation threshold of conducting polymer composites containing 3D randomly distributed graphite nanoplatelets, Compos. Sci. Technol., 2007, 67(10), 2114–2120 CrossRef CAS.
- S. F. Wang and A. A. Ogale, Continuum space simulation and experimental characterization of electrical percolation behavior of particulate composites, Compos. Sci. Technol., 1993, 46(2), 93–103 CrossRef CAS.
- J. R. Garcia, et al., A Simple Model Relating Gauge Factor to Filler Loading in Nanocomposite Strain Sensors, ACS Appl. Nano Mater., 2021, 4(3), 2876–2886 CrossRef CAS PubMed.
- R. H. J. Otten and P. van der Schoot, Connectivity percolation of polydisperse anisotropic nanofillers, J. Chem. Phys., 2011, 134(9), 094902 CrossRef PubMed.
- F. Du, J. E. Fischer and K. I. Winey, Effect of nanotube alignment on percolation conductivity in carbon nanotube/polymer composites, Phys. Rev. B: Condens. Matter Mater. Phys., 2005, 72(12), 121404 CrossRef.
- F. Du, J. E. Fischer and K. I. Winey, Coagulation method for preparing single-walled carbon nanotube/poly(methyl methacrylate) composites and their modulus, electrical conductivity, and thermal stability, J. Polym. Sci., Part B: Polym. Phys., 2003, 41(24), 3333–3338 CrossRef CAS.
- H. Kim and C. W. Macosko, Processing-property relationships of polycarbonate/graphene composites, Polymer, 2009, 50(15), 3797–3809 CrossRef CAS.
- J.-H. Pu, et al., 2D end-to-end carbon nanotube conductive networks in polymer nanocomposites: a conceptual design to dramatically enhance the sensitivities of strain sensors, Nanoscale, 2018, 10(5), 2191–2198 RSC.
- S. Wu, et al., Aligning multilayer graphene flakes with an external electric field to improve multifunctional properties of epoxy nanocomposites, Carbon, 2015, 94, 607–618 CrossRef CAS.
- M. Amjadi, et al., Highly Stretchable and Sensitive Strain Sensor Based on Silver Nanowire–Elastomer Nanocomposite, ACS Nano, 2014, 8(5), 5154–5163 CrossRef CAS PubMed.
- D. G. Papageorgiou, I. A. Kinloch and R. J. Young, Mechanical properties of graphene and graphene-based nanocomposites, Prog. Mater. Sci., 2017, 90, 75–127 CrossRef CAS.
- W. S. Bao, et al., A novel approach to predict the electrical conductivity of multifunctional nanocomposites, Mech. Mater., 2012, 46, 129–138 CrossRef.
- J. Aguilar, J. Bautista-Quijano and F. Avilés, Influence of carbon nanotube clustering on the electrical conductivity of polymer composite films, eXPRESS Polym. Lett., 2010, 4(5), 292–299 CrossRef CAS.
- R. K. Bayer, et al., Conductive PE-carbon composites by elongation flow injection moulding, J. Mater. Sci., 1988, 23(2), 475–480 CrossRef CAS.
Footnote |
| † Electronic supplementary information (ESI) available. See DOI: https://doi.org/10.1039/d3nr05234f |
| This journal is © The Royal Society of Chemistry 2024 |