 Open Access Article
Insights into the mechanical stability of tetrahydrofuran hydrates from experimental, machine learning, and molecular dynamics perspectives†
Yanwen
Lin
 ab,
Ziyue
Zhou
 a,
Zixuan
Song
a,
Qiao
Shi
a,
Yongchao
Hao
a,
Yuequn
Fu
d,
Tong
Li
a,
Zixuan
Song
a,
Qiao
Shi
a,
Yongchao
Hao
a,
Yuequn
Fu
d,
Tong
Li
 *bc,
Zhisen
Zhang
 a and
Jianyang
Wu
 *ae
*ae
aDepartment of Physics, Research Institute for Biomimetics and Soft Matter, Jiujiang Research Institute and Fujian Provincial Key Laboratory for Soft Functional Materials Research, Xiamen University, Xiamen 361005, PR China. E-mail: tong.li.1@ndsu.edu; jianyang@xmu.edu.cn
bKey Laboratory of Marine Materials and Related Technologies, Ningbo Institute of Materials Technology and Engineering, Chinese Academy of Sciences, Ningbo 315201, PR China
cKey Laboratory of Icing and Anti/De-icing, China Aerodynamics Research and Development Center, Mianyang Sichuan 621000, China
dPoreLab, the Njord Centre, Department of Physics, University of Oslo, Oslo 0371, Norway
eNTNU Nanomechanical Lab, Norwegian University of Science and Technology (NTNU), Trondheim 7491, Norway
First published on 26th February 2024
Abstract
Natural gas hydrates (NGHs) hold immense potential as a future energy resource and for sustainable applications such as gas capture and storage. Due to the challenging formation conditions, however, their mechanical properties remain poorly understood. Herein, the mechanical characteristics of tetrahydrofuran (THF) hydrates, a proxy for methane hydrates, were investigated at different ice contents, strain rates, and temperatures using uniaxial compressive experiments. The results unveil a distinct behavior in the peak strength of THF hydrates with a varying ice content, strain rate and temperature, exhibiting an increase as the strain rate and temperature decrease, in contrast to the peak strength–strain rate relationship observed in polycrystalline ice. Based on the experimental data, four machine learning (ML) models including extreme gradient boosting (XGboost), multilayer perceptron (MLP), gradient boosting decision tree (GBDT) and decision tree (DT) were developed to predict the peak strength. The XGboost model demonstrates superior predictive performance, emphasizing the significant influence of ice content and temperature on the peak strength of hydrates. Furthermore, molecular dynamics (MD) simulations were employed to gain insights into the dissociation and formation processes of clathrate cages, as well as phase transitions and amorphization occurring at grain boundaries (GBs) involving diverse unconventional clathrate cages, including 51265, 4151062, 4151064, 425861 and 425862, with 425861 and 425862 cages being predominant. This study enhances our understanding of the mechanical properties and deformation mechanisms of hydrates and provides a ML-based predictive framework for estimating the compressive strength of hydrates under diverse coupling conditions. The findings have significant implications for stability assessments of NGHs and the exploitation of NGH resources.
1. Introduction
Natural gas hydrates (NGHs) are crystalline substances composed of water molecular cages that trap methane molecules. In nature, NGHs typically form in the seabed and underground permafrost sediments under harsh conditions, including high pressure and low temperature.1–5 NGHs have been recognized as a potential natural gas resource due to their high energy density and low environmental impact. Specifically, one cubic meter of NGHs release about 180 standard cubic meters of methane gas at room temperature and atmospheric pressure.6,7 It is conservatively estimated that the energy resource stored in NGHs is around 2-fold that of conventional fossil fuels.8,9 Recently, NGHs have been increasingly recognized as alternative fuel resources because of their eco-friendly properties,7,10–12 thereby the recovery of natural gas from NGHs has attracted great attention.13–19Understanding the mechanical behaviors of sediment-hosted NGHs and pure NGHs is crucial for geotechnical stability assessments of NGH-bearing sediments, as well as for improving commercial extraction technologies and other hydrate-related applications.20–23 The problem of sand production is currently a key obstacle to the commercial extraction technologies of NGHs. In order to achieve long-term stable commercial exploitation, it is necessary to grasp the changing rules of the mechanical characteristics of NGH-bearing sediments during the exploitation process. As a result, numerous investigations on the mechanical properties of NGH-bearing sediments have been implemented experimentally and theoretically.24–28 Utilizing the tri-axial equipment to impose loading stress, the deviator stress of hydrate-bearing sediment specimens was measured, taking into account factors such as temperature and strain rate, and it was demonstrated that the failure strength of gas hydrate-bearing sediments increases with decreasing temperature and increasing strain rate.29,30 Using uniaxial compressive tests, mechanical properties such as peak strength were determined.31 Similarly, a number of investigations25,27,32–35 on the mechanical behavior of clathrate hydrates have been implemented using numerical simulation methods. For instance, the effects of factors like strain rate, crystal orientation, guest molecules, temperatures and cage occupancy on the mechanical properties of hydrates were examined using molecular dynamics (MD) simulations.25–27,35 Fundamental mechanical parameters like tensile strength, fracture strain, Young's modulus, and failure pattern are influenced by the properties of guest molecules, such as size, shape and polarity.27,32,33
Due to the harsh conditions, such as high pressure and low temperature, required for stabilizing NGHs, conducting experimental measurements on the mechanical properties of NGHs is challenging. To overcome this challenge, laboratory-synthesized tetrahydrofuran (THF) hydrates have been widely used as common analogs to assess the mechanical and thermal properties of clathrate hydrates under atmospheric pressure conditions.36–38 It was reported that THF hydrates exhibit brittle failure under uniaxial compression at a strain rate of 1% per min.39 The compression strength of THF hydrates decreases with decreasing strain rate, indicating different fracture modes and mechanical responses at high and low strain rates.36 The mechanical properties of THF hydrates at −273.15 °C are consistent with those of gas hydrates, suggesting that THF hydrates are suitable for simulating the mechanical properties of NGHs. However, despite the important progress made in studying THF hydrates as a replacement for gas hydrates, their mechanical properties and decomposition mechanism under stress are still largely unknown.
To address this, the present study investigates the effects of ice content, strain rate and temperature on the mechanical properties of THF hydrates using a combination of uniaxial compressive experiments, machine learning (ML) techniques, and MD simulations. Uniaxial compressive experiments were conducted on THF hydrate samples with varying ice contents at different strain rates and temperatures, allowing for the determination and comparison of the compressive strength of the samples. Additionally, four ML models based on the experimental data were developed to predict the compressive peak strength of THF hydrates with different ice contents, providing insights into the influence of various factors on the mechanical behaviors of THF hydrates. Furthermore, MD simulations were employed to investigate the uniaxial mechanical responses and microstructural evolution of polycrystalline THF hydrates at different temperatures, revealing the compressive failure mechanisms and capturing the dynamic changes in the number of clathrate cages and structural transformation of clathrate cages during the compressive process. By combining experimental measurements, ML modeling and MD simulations, this study enhances our understanding of the mechanical behaviors of THF hydrates, which serve as a valuable analog for NGHs, and demonstrates the potential of ML models in predicting the mechanical properties of gas hydrates in complex environments.
2. Methodology
2. 1 Framework and workflow
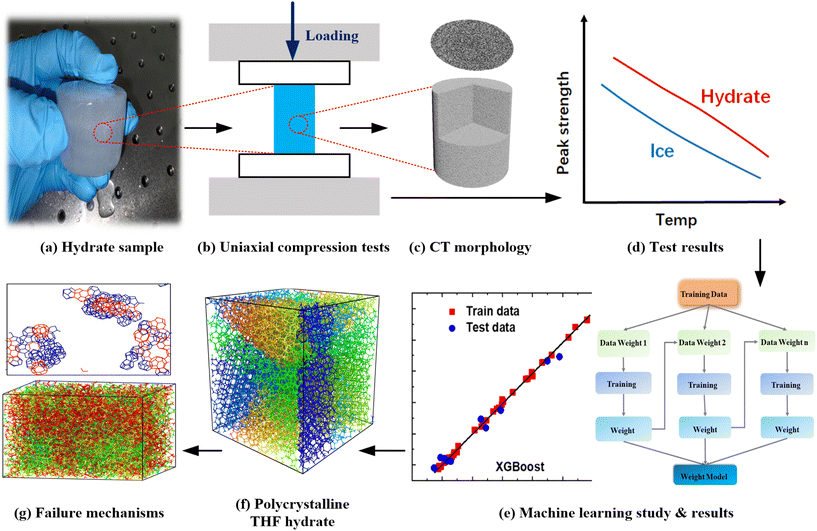
In this study, the compression properties of polycrystalline THF hydrates were investigated using multi-scale methods to gain insights into the mechanical behaviors of hydrate reservoirs. Due to the challenging conditions required for the formation of NGHs, THF hydrate is commonly used as a substitute in laboratory settings to study the mechanical properties, as shown in Fig. 1a. The compressive peak strength of polycrystalline THF hydrates was determined using a universal testing machine, as displayed in Fig. 1b. The morphologies of THF hydrate samples containing different ice contents were tested using computed tomography (CT) technology, as shown in Fig. 1c. The effects of strain rate, temperature and hydrate saturation on the peak strength of THF hydrates were examined and the compressive properties of different samples were compared, as illustrated in Fig. 1d. Based on the experimental results, ML models were employed to predict the compressive peak strength of THF hydrates, as shown in Fig. 1e. This utilization of ML techniques allows for a data-driven approach to understand the relationship between various factors and the mechanical properties of THF hydrates. Furthermore, MD simulations were conducted to investigate the deformation and failure mechanisms of polycrystalline THF hydrates, focusing on the effect of temperature, as depicted in Fig. 1f and g. These MD simulations provide valuable insights into the structural evolution and response of THF hydrates under different temperature conditions, contributing to the safe and efficient extraction of NGHs.2.2 Materials and chemicals
Tetrahydrofuran (THF, ≥99.9%) was purchased from Sinopharm Chemical Reagent Co., Ltd (Shanghai, China). It was used as received without performing any additional purification steps. Acetone (99.5%) and ethanol (99.7%) were purchased from Sinopharm Chemical Reagent Co., Ltd (Shanghai, China). Deionized (DI) water with a resistivity exceeding 15 MΩ cm was utilized in all experiments.2.3 Models and methods
In this study, the XGboost ML model was used as the primary model to predict the compressive peak strength of THF hydrate samples with different ice contents based on the results of uniaxial compressive experiments. Other ensemble ML models, such as multilayer perceptron (MLP) and ensemble models like GBDT were also employed for comparison with the XGboost ML model. The performance of the ML models was evaluated using three metrics of R2 (coefficient of determination), RMSE (root mean square error), and MAE (mean absolute error) that are respectively defined as follows:
 | (1) |
 | (2) |
 | (3) |
3. Results and discussion
3.1 Strain–stress response of polycrystalline ice/THF hydrates
To examine the compressive mechanical properties of polycrystalline ice/THF hydrates, the strain–stress responses of the materials were investigated during the compression process. Fig. 2 illustrates the uniaxial compressive stress–strain responses of polycrystalline ice/THF hydrates at −20 °C with different strain rates (0.01 s−1, 0.001 s−1 and 0.0001 s−1). As is observed, the stress–strain responses of polycrystalline ice/THF hydrates are significantly influenced by the applied strain rate. Both polycrystalline ice and THF hydrates exhibit different deformation responses at different strain rates. At a high compressive strain rate (e.g., 0.01 s−1), brittle failure accompanied by numerous peaks was observed in polycrystalline ice/THF hydrates. This brittle failure is likely due to crack propagation within the samples, resulting in a low peak stress. At a low strain rate (e.g. 0.0001 s−1), however, they exhibit ductile failure.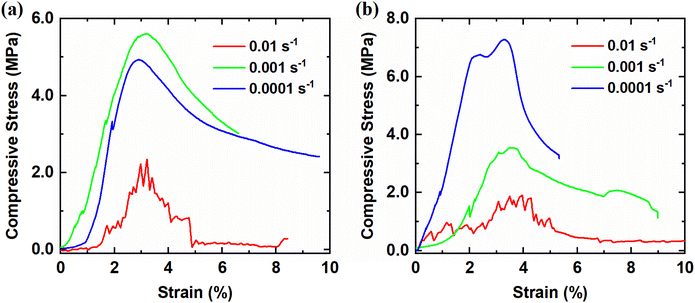 | ||
| Fig. 2 Stress–strain responses of (a) polycrystalline ice and (b) THF hydrates obtained from uniaxial compressive experiments at different strain rates of 0.01 s−1, 0.001 s−1 and 0.0001 s−1. | ||
In terms of the peak strength, it increases when the applied strain rate changes from 0.01 s−1 to 0.001 s−1, while it decreases as the applied strain rate increase from 0.001 s−1 to 0.0001 s−1, suggesting that the compressive maximum stress lies within the range of strain rates corresponding to the brittle-to-ductile transition behavior.49 This is consistent with previous findings49–52 that the compressive maximum stress occurs at a strain rate of approximately 0.001 s−1. In contrast, for polycrystalline THF hydrates, the compressive peak stress increases as the strain rate decreases, which differs from the case of polycrystalline ice. Fig. S2† displays a serious of 3D images of the M0–3 samples obtained using computed tomography (CT) technology at −20 °C. As is observed, the microstructure of the M0–3 samples varies, with the blue block indicating the presence of bubble pores in the crystals after crystallization. The size of the bubble pores increases with the increase of ice content. When compared to previous studies,53–55 hydrate-bearing sediment systems exhibit larger pores within porous media particles, which is different from the microscopic morphologies of ice/THF hydrate solid crystals.
3.2 Compressive peak strength of ice-contained THF hydrates
To investigate the influence of strain rate, temperature and ice content on the peak strength of THF hydrates, the M0–M3 samples were subjected to compression tests at different strain rates and temperatures. Fig. 3 presents the variation of peak strength of the M0–M3 samples with respective to temperatures at different strain rates. Each sample was tested at least 3–5 times to minimize statistical error. The peak strength of the M1–M3 samples was primarily determined from the strain rate, temperature, and ice content. Comparing the M1–M3 samples with the M0 sample at a given strain rate, it is observed that the former exhibits a larger average peak strength, indicating a different internal structure compared to the M0 sample. Overall, there is a decreasing trend in peak strength as the temperature increases for all samples. However, notable differences exist between the M0 and M1–M3 samples in terms of the dependence of peak strength on the strain rate. As shown in Fig. 3a, the average peak strength occurs at a strain rate of 0.001 s−1, which aligns with the strain rate range associated with the transition behavior of brittle–ductile as reported in a previous study.49 This suggests distinct structural deformations during the uniaxial compressive processes at different strain rates. On the other hand, for the M1–M3 samples, the average peak strengths are highly dependent on the strain rate. The values of the average peak strength exhibit a decreasing order of 0.0001 s−1 > 0.001 s−1 > 0.01 s−1, as shown in Fig. 3b–d. By comparison, the average peak strengths of the M1–M3 samples are higher than that of the M0 sample at a given temperature and strain rate. In addition, the average peak strength of the M1–M3 samples is influenced by both the ice content and strain rate. For example, the M1 sample, which contains 50% ice in the hydrates when cooled to low temperatures,56,57 shows a significant dependence on the strain rate. In contrast, the average peak strength of the M2 sample decreases from approximately 5.89/4.03 MPa at −25 °C to 3.58/2.81 MPa at −10 °C at a strain rate of 0.0001 s−1 and 0.001 s−1, respectively. At a strain rate of 0.01 s−1, there is no clear reduction in peak strength for the M0–M3 samples as the temperature increases from −25 °C to −10 °C. This indicates that a high strain rate weakens the effect of temperature on the peak strength for all samples. Intriguingly, in contrast to the compressive characteristics of ice samples, the M1–M3 samples exhibit an inverse relationship where the average peak strength increases as the strain rate decreases. These values of peak strength of the samples are in good agreement with previous studies,36,58 which show higher average peak strength compared to ice.59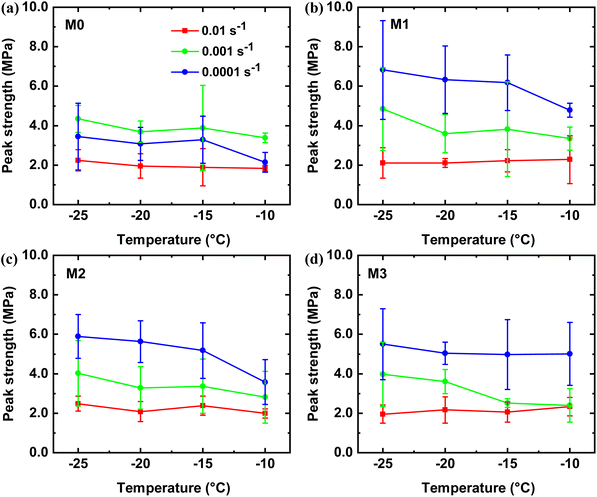 | ||
| Fig. 3 Average peak strengths of (a) M0, (b) M1, (c) M2 and (d) M3 samples obtained from uniaxial compressive experiments at different strain rates and temperatures. | ||
3.3 ML training and predictions
The compressive experiments have shown that the average peak strengths of the M1–M3 samples are influenced by various factors, including strain rate, temperature, and ice content. To predict the average peak strength of THF hydrates, ML studies were conducted using the results of the uniaxial compressive experiments. Three factors that affect the mechanical compressive strength, namely ice content, strain rate and temperature, were used as inputs for ML models. The dataset of the average peak strength of THF hydrates was divided into two parts, with 80% used for training and 20% for testing. The same dataset and testset were used for four ML models to eliminate the impact of data distribution. In the XGboost ML model, the maximum tree depth optimization was set to three to ensure simplicity and improve the accuracy of ML modeling. The performance metrics of the XGboost model and the other three ML models are listed in Table 1. From Table 1, it can be observed that the XGboost ML model demonstrates superior accuracy in predicting the average peak strength. The values of R2, RMSE and MAE for the training set were calculated to be 0.998, 0.067 and 0.051, respectively. Similarly, for the testing set, the values of R2, RMSE and MAE were computed to be 0.974, 0.228 and 0.205, respectively (Fig. 4).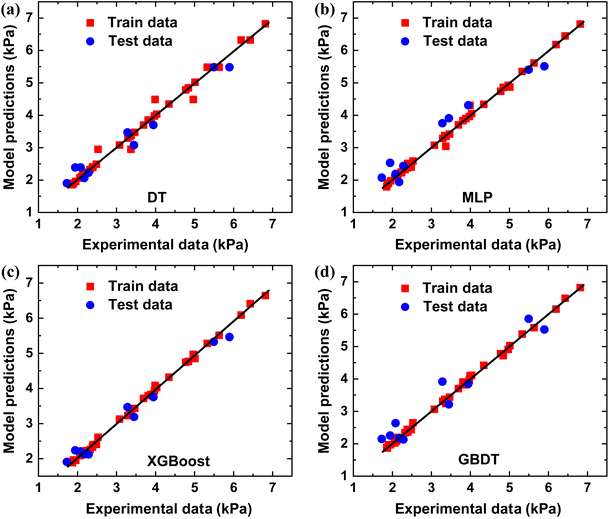 | ||
| Fig. 4 ML models of (a) DT-, (b) MLP-, (c) XGboost- and (d) GBDT-predicted peak strength versus uniaxial compressive experiments for polycrystalline ice/THF hydrates, respectively. | ||
| ML Models | Training set | Testing set | ||||
|---|---|---|---|---|---|---|
| R 2 | RMSE | MAE | R 2 | RMSE | MAE | |
| XGboost | 0.998 | 0.067 | 0.051 | 0.974 | 0.228 | 0.205 |
| MLP | 0.996 | 0.085 | 0.046 | 0.937 | 0.356 | 0.319 |
| DT | 0.988 | 0.155 | 0.064 | 0.963 | 0.272 | 0.232 |
| GBDT | 0.998 | 0.058 | 0.046 | 0.933 | 0.313 | 0.363 |
To further reveal the impact of multiple factors on the average peak strength of ice-containing hydrates, the relative importance of the three features was quantitatively evaluated based on the XGboost ML model. The importance of each feature was ranked based on their score. Table 2 lists the contributions of the three features to the average peak strength of hydrates. It is observed that, compared to the strain rate, the average peak strength of the samples was predominantly determined by the ice content and temperature, which collectively contribute to more than 80% of the prediction. Specifically, the ice content in THF hydrates plays a crucial role in influencing the average peak strength, with the temperature also exerting a significant influence.
| Feature descriptors | Ice content | Temperature | Strain rate |
|---|---|---|---|
| Importance ranking | 46.36% | 35.57% | 18.08% |
3.4 Molecular insights into the compressive properties
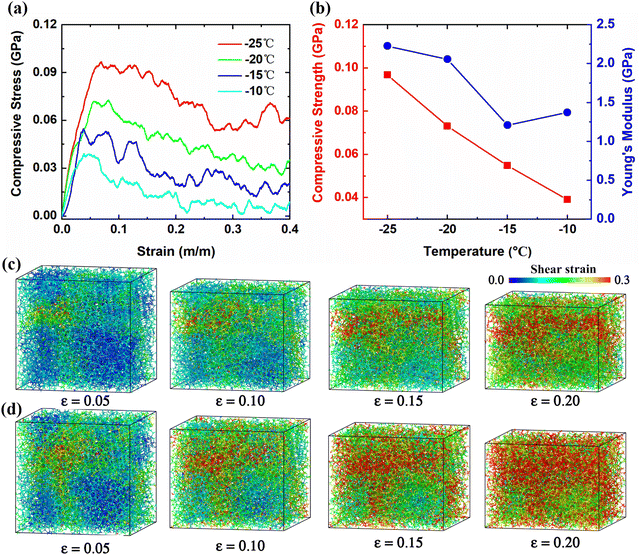
As discussed above, ice content and temperature play crucial roles in the mechanical properties of hydrate. Herein, molecular models of polycrystalline THF hydrates, corresponding to the M4 sample, were constructed to investigate the deformation and failure mechanisms at different temperatures. Fig. 5a shows the compressive stress–strain curves of polycrystalline THF hydrates at temperatures ranging from −25 °C to −10 °C. These stress–strain curves can be roughly divided into three stages for all samples. Stage I corresponds to the initial linear behavior in the loading stress–strain curve, indicating elastic deformation of polycrystalline THF hydrates under initial compression. Stage II is characterized by nonlinear stress–strain curves, where the increase in compressive stress becomes less significant with increasing strain, indicative of strain-induced hardening behaviors. By comparison, there are significant differences in the elastic responses at different temperatures for polycrystalline THF hydrates. As shown in Fig. 5b, the compressive peak strength and Young's modulus of polycrystalline THF hydrates generally decrease with increasing temperature, suggesting a distinct yielding behavior at different temperatures. In the final stage, a rough decreasing trend of compressive stress was observed starting from the critical strains, followed by a large residual stress, indicating the strain-induced ductile failure of polycrystalline THF hydrates.To gain further insights into the structural evolution and strain-induced deformation mechanisms in polycrystalline THF hydrates, snapshots of the molecular structures during the compression process were captured. Fig. 5c and d display a series of snapshots of the polycrystalline THF hydrate structures subjected to different strains at −25 °C and −15 °C, respectively, with the color code based on the values of shear strain. It should be noted that the deformation characteristics of all samples at other temperatures are presented in Fig. 5c and d. As is indicated, at a strain of approximately 0.05, there is a clear indication of high local shear strain in the vicinity of the grain boundaries (GBs), and the region of high shear strain rapidly expands. At a strain of around 0.15, structures with high atomic shear strains undergo destabilization via amorphizations. With a further increase in uniaxial strain, local amorphizations propagate, leading to global destabilization of polycrystalline THF hydrates with gradual shrinkage of hydrate grains and expansion of GBs. Particularly, the amorphization behaviors are more significant at higher temperatures. Multiple local regions with high atomic shear strains were observed in the hydrate samples, and these structures were locally destabilized in multiple positions via amorphization, explaining the softening behavior observed in the curves in Fig. 5a. Therefore, the failure of polycrystalline THF hydrates can be primarily characterized by ductile fracture, as this collapse dose not result in the separation of hydrate samples.
3.5 Plastic deformation by dissociation and formation of clathrate cages
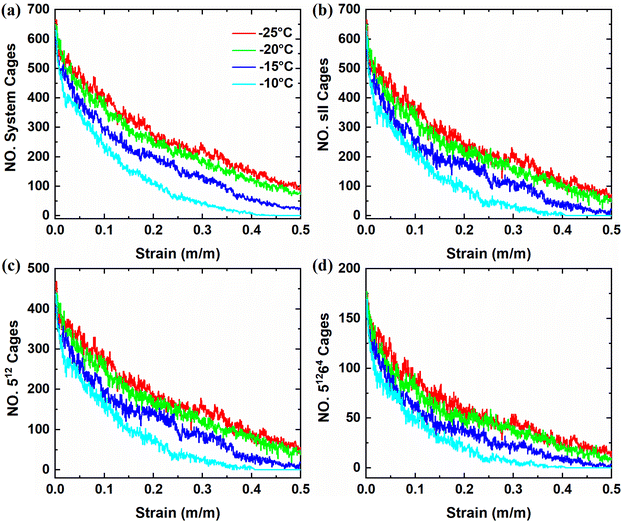
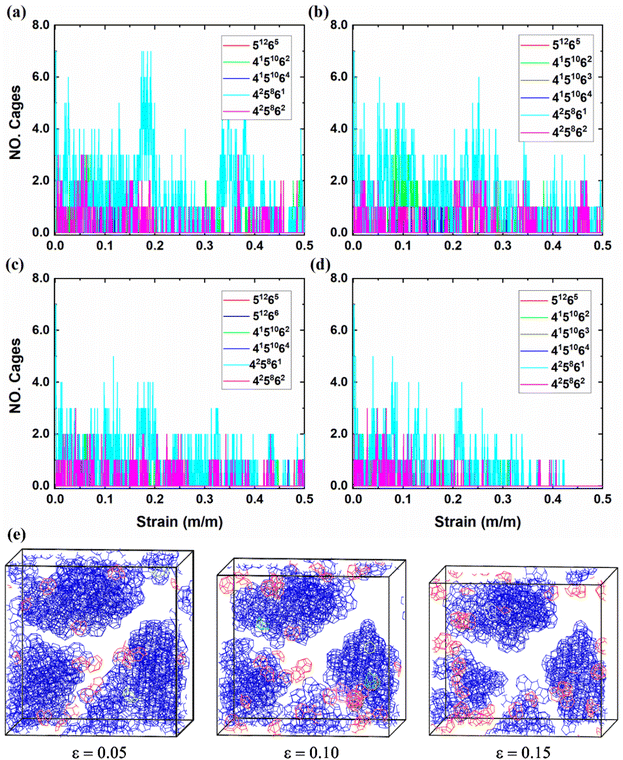
The dynamic changes in the clathrate cages provide valuable insights into the structural stability of polycrystalline THF hydrates under compressive loads. Herein, the dynamic information of conventional clathrate cages was extracted first to examine the microstructural responses of polycrystalline THF hydrates through the HTR algorithm.60 As shown in Fig. 6a, the total number of 512 and 51264 clathrate cages in the polycrystalline THF hydrate systems decreases nonlinearly as the strain increases. Similar to this changing trend, the total number of sII 512 and 51264 clathrate cages in the sII hydrate grains of polycrystals decreases nonlinearly as the strain increases, as shown in Fig. 6b. Lower temperatures contribute to enhanced structural stability and slower descent rate of the cages. Further analysis in Fig. 6c and d reveals that both the sII 512 and 51264 clathrate cages in sII hydrate grains exhibit nonlinear reductions in the number with increasing strain. The reduction in the number of clathrate cages becomes less pronounced at higher strains after failure at different temperatures, suggesting that compressive load can cause the dissociation of clathrate cages in THF hydrates. Moreover, when comparing polycrystalline THF hydrates compressed at low and high temperatures, it is observed that the former has a larger number of cages. This observation can be contributed to the higher stability of polycrystalline THF hydrates at lower temperatures. These findings highlight the importance of clathrate cage dynamics in understanding the structural stability and response of polycrystalline THF hydrates under compressive conditions.To investigate further the microstructural responses and formation of unconventional clathrate cages in polycrystalline THF hydrates during the compressive process, additional types of clathrate cages beyond the conventional 512 and 51264 cages were identified. Previous studies have demonstrated the dynamic transfer of unconventional cages in hydrate systems.61 Consistent with previous findings,62,63 the present study reveals that the compressive load induces the formation of unconventional clathrate cages in polycrystalline THF hydrates. Fig. 7 shows the variations in the number of unconventional cages, including 51265, 4151062, 4151064, 425861, and 425862 clathrate cages, as strain ranges from 0.00 to 0.50 at temperatures of −25 °C, −20 °C, −15 °C and −10 °C, respectively. When polycrystalline THF hydrates are compressed at low temperatures, a significant number of unconventional cages are observed, suggesting that low temperature promotes the formation of clathrate cages. Among the unconventional cages, the 425861 and 425862 cages are easily formed in polycrystalline THF hydrate systems. Fig. 7e shows a set of snapshots capturing the formation clathrate cages under different strains at −25 °C, with the color code indicating the types of cages. It can be observed that the occurrence of 512 and 51264 clathrate cages, which do not belong to sII hydrate grains, as well as the unconventional clathrate cages, is mainly concentrated at the GBs of THF hydrate grains. Moreover, it is identified that the formation of clathrate cages primarily occur in regions with higher shear strain, as shown in Fig. 5. With further increasing strain, the structures are dominated by 512 and 51264 cages surrounding the GBs, as well as the unconventional cages, leading to the formation of amorphous polycrystalline THF hydrates. These findings highlight the occurrence of cage formation in polycrystalline THF hydrates under compressive loads. The presence of unconventional cages and their dynamic behaviors contribute to the understanding of the microstructural responses and stability of THF hydrates during compression.
3.6 Transformation pathways of clathrate cages
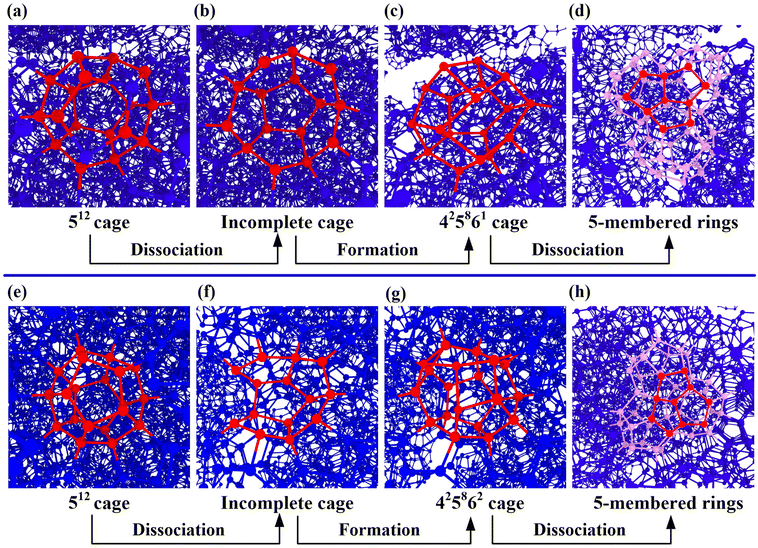
To further provide insights into the molecular-level responses of polycrystalline THF hydrates under deformation, the transformations of clathrate cages of polycrystalline hydrates were investigated. Fig. S3a† shows the relationship between the ratios of hydrate grains in the hydrate systems and strain at different temperatures. It is observed that, at a given strain, the grain occupancy decreases with increasing temperature. During the compressive process, structural transformation of the 512 and 51264 clathrate cages in sII hydrate grains take place. As the strain increases, the hydrate grains progressively shrink, and a variety of 512 and 51264 cages, as well as unconventional cages, were formed in the GBs as discussed above. Fig. S3b† show the variations in the number of phase transitions of the 512 and 51264 cages from hydrate grains to the GBs during the compressive process. When the strain exceeds approximately 0.10, the number of 512 and 51264 cages in the GBs decreases more pronounced, indicating intensified structural instability dominated by amorphization.To in-depth examine the phase transition of polycrystalline THF hydrate during the compression process, the dynamic transformations of clathrate cages were captured. As depicted in Fig. 8, the 512 and 51264 cages undergo transformation into 425861 and 425862 cages, while the 51264 cage changes into 4151065 and 4151066 cages. The simulation system exhibit higher frequencies of transformation between 512/51264 cages and other cages during the compression process at different temperatures, as shown in Table S1.† These cages, especially the 425861 and 425862 cages, are prone to formation and dislocation at the GBs during the compressive process, as shown in Fig. 7e. The dissociation of the 512 cage and the formation process of the 425861 cage are shown in Fig. 9a–d. It can be observed that the main framework of the 512 cage was decomposed during the compressive loads. The local melting in the 512 cage results in the formation of an incomplete broken cage (half of the 512 cage, cup shaped) containing several 5-membered rings (Fig. 9b). For clarity, the free water molecules that do not form a cage are not displayed in the snapshot. The incomplete broken cage transforms into the 425861 cage by capturing free water molecules in the GBs and rearranging its structure. The structure of the 425861 cage is very unstable and prone to decomposition under compressive loads, while the relatively stable 5-membered rings in the 425861 cage are retained as part of the other 512 and 51264 cages (Fig. 9d). Similar to the phase transformation of the 425861 cage, the snapshot of the structural transformation processes of the 425862 cage was captured, as shown in Fig. 9e–h. The structural transformation undergoes a dynamic process of decomposition–formation–decomposition evolution, which differs from the transformation mechanisms involving the insertion/removal and rotation of a pair of water molecules in previous studies.62,64 The unconventional cages typically share 5-membered rings with the 512 and 51264 cages belonging to the hydrate grains, which explains why these unconventional cages are more likely to occur in the GBs during the compressive process. Furthermore, the MD results also show that THF molecules only exist in the cavity of the 51264 cage, while for other unconventional cages and the 512 cage, they have no ability to capture THF as guest molecules in their cavities. These observations provide molecular-level insights into the deformational structural responses of polycrystalline THF hydrates, highlighting the transformation mechanisms of clathrate cages under compressive loads. The occurrence of unconventional cages and their distribution within the GBs contribute to the understanding of the microstructural behavior and stability of THF hydrates during deformation.
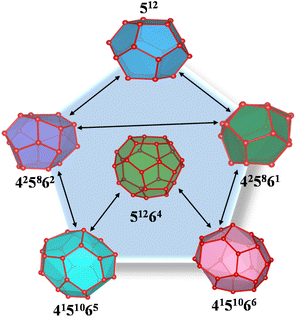 | ||
| Fig. 8 Pathways of structural transformation between clathrate cages in polycrystalline THF hydrate systems during the compressive process. | ||
4. Conclusions
In summary, the mechanical properties of polycrystalline THF hydrates were investigated under various factors, including ice content, strain rate, and temperature, using uniaxial compressive experiments. The results indicate that the average peak strength of the M1–M3 samples is higher than that of the M1 sample, depending on the ice content, strain rate and temperature. The peak strength of the M1–M3 samples increases with decreasing strain rate, which can be attributed to the slow crack propagation observed at low strain rates. This behavior differs from the peak strength–strain rate relationship observed in polycrystalline ice, where the peak strength occurs within the brittle–ductile transition stage at approximately 0.001 s−1.On the basis of the experimental measurement results, a robust ML-assisted method is proposed to characterize the average peak strength of THF hydrates considering coupling factors such as ice content, temperature and strain rate. Four ML models, namely XGboost, MLP, GBDT, and DT, were developed to predict the average peak strength using the data from the uniaxial compressive experiments. Among these models, XGboost demonstrated the best predictive performance. A sensitivity analysis based on the data reveals that ice content and temperature are the most sensitive parameters influencing the average peak strength of THF hydrates.
Furthermore, MD simulations were conducted to investigate the compressive behavior of polycrystalline THF hydrates at different temperatures, providing insights into the ductile-like failure mechanism from a molecular perspective. Interestingly, both uniaxial compressive experiments and MD simulations indicate that the peak strength of polycrystalline THF hydrates increases with decreasing temperature. The study also analyzes the dynamics of clathrate hydrate cages and the structural evolution of polycrystalline THF hydrate systems. This work contributes to a comprehensive understanding of the influence of multi-scale factors on the mechanical properties of THF hydrates. The as-developed ML models based on the mechanical response of THF hydrates can be extended to predict the mechanical properties of gas hydrate-bearing sediments.
Conflicts of interest
There are no conflicts to declare.Acknowledgements
This work was financially supported by the Key Laboratory of Icing and Anti/De-icing of CARDC (Grant No. IADL20210402), the National Natural Science Foundation of China (Grant No. 12172314, 12002350, 11772278 and 11904300), the Jiangxi Provincial Outstanding Young Talents Program (Grant No. 20192BCBL23029), the Fundamental Research Funds for the Central Universities (Xiamen University: Grant No. 20720210025), and the 111 project (B16029). Shaorong Fang and Tianfu Wu from Information and Network Center of Xiamen University are acknowledged for their help with the high-performance computer.References
- Z. R. Chong, S. H. B. Yang, P. Babu, P. Linga and X. S. Li, Appl. Energy, 2016, 162, 1633–1652 CrossRef.
- T. C. Hansen, A. Falenty and W. F. Kuhs, J. Chem. Phys., 2016, 144, 054301 CrossRef CAS PubMed.
- C. A. Koh and E. D. Sloan, AIChE J., 2007, 53, 1636–1643 CrossRef CAS.
- Y. Lin, T. Li, S. Liu, Q. Shi, K. Xu, Z. Zhang and J. Wu, J. Colloid Interface Sci., 2022, 629, 326–335 CrossRef PubMed.
- R. Wang, B. Liao, J. T. Wang, J. S. Sun, Y. D. Wang, J. L. Wang, Q. B. Wang, Y. Z. Qu and R. C. Cheng, Chem. Eng. J., 2023, 451, 138757 CrossRef CAS.
- A. W. Rempel and B. A. Buffett, J. Geophys. Res. Solid Earth, 1997, 102, 10151–10164 CrossRef CAS.
- S. C. Shaibu, C. Sambo, B. Guo and A. Dudun, Adv. Geo-Energy Res., 2021, 5, 318–332 CrossRef.
- M. R. Walsh, S. H. Hancock, S. J. Wilson, S. L. Patil, G. J. Moridis, R. Boswell, T. S. Collett, C. A. Koh and E. D. Sloan, Energy Econ., 2009, 31, 815–823 CrossRef.
- Q. Shi, Y. Lin, Y. Hao, Z. Song, Z. Zhou, Y. Fu, Z. Zhang and J. Wu, Energy, 2023, 282, 128337 CrossRef CAS.
- S. M. Everett, C. J. Rawn, B. C. Chakoumakos, D. J. Keefer, A. Huq and T. J. Phelps, Am. Mineral., 2015, 100, 1203–1208 CrossRef.
- S. M. Everett, C. J. Rawn, D. J. Keffer, D. L. Mull, E. A. Payzant and T. J. Phelps, J. Phys. Chem. A, 2013, 117, 3593–3598 CrossRef CAS PubMed.
- J. Chen, Y. H. Wang, X. M. Lang and S. S. Fan, J. Energy Chem., 2015, 24, 552–558 CrossRef.
- F. L. Ning, Y. B. Yu, S. Kjelstrup, T. J. H. Vlugt and K. Glavatskiy, Energy Environ. Sci., 2012, 5, 6779–6795 RSC.
- W. G. Liu, J. F. Zhao, Y. Luo, Y. C. Song, Y. H. Li, M. J. Yang, Y. Zhang, Y. Liu and D. Y. Wang, Mar. Pet. Geol., 2013, 46, 201–209 CrossRef CAS.
- M. E. Casco, J. Silvestre-Albero, A. J. Ramirez-Cuesta, F. Rey, J. L. Jorda, A. Bansode, A. Urakawa, I. Peral, M. Martinez-Escandell, K. Kaneko and F. Rodriguez-Reinoso, Nat. Commun., 2015, 6, 6432 CrossRef CAS PubMed.
- T. Uchida, S. Takeya, E. M. Chuvilin, R. Ohmura, J. Nagao, V. S. Yakushev, V. A. Istomin, H. Minagawa, T. Ebinuma and H. Narita, J. Geophys. Res.: Solid Earth, 2004, 109, B05206 Search PubMed.
- W. F. Waite, J. C. Santamarina, D. D. Cortes, B. Dugan, D. N. Espinoza, J. Germaine, J. Jang, J. W. Jung, T. J. Kneafsey, H. Shin, K. Soga, W. J. Winters and T. S. Yun, Rev. Geophys., 2009, 47, RG4003 CrossRef.
- S. S. Fan, X. Wang, Y. H. Wang and X. M. Lang, J. Energy Chem., 2017, 26, 655–659 CrossRef.
- D. Seo, S. Lee, S. Moon, Y. Lee and Y. Park, Chem. Eng. J., 2023, 467, 143512 CrossRef CAS.
- C. A. Graves, R. H. James, C. J. Sapart, A. W. Stott, I. C. Wright, C. Berndt, G. K. Westbrook and D. P. Connelly, Geochim. Cosmochim. Acta, 2017, 198, 419–438 CrossRef CAS.
- R. Luff and K. Wallmann, Geochim. Cosmochim. Acta, 2003, 67, 3403–3421 CrossRef CAS.
- A. K. Both, Y. Gao, X. C. Zeng and C. L. Cheung, Nanoscale, 2021, 13, 7447–7470 RSC.
- J. Li, H. Lu and X. Zhou, Nanoscale, 2020, 12, 12801–12808 RSC.
- D. Atig, D. Broseta, J. M. Pereira and R. Brown, Nat. Commun., 2020, 11, 3379 CrossRef CAS PubMed.
- J. Y. Wu, F. L. Ning, T. T. Trinh, S. Kjelstrup, T. J. H. Vlugt, J. Y. He, B. H. Skallerud and Z. L. Zhang, Nat. Commun., 2015, 6, 8743 CrossRef CAS PubMed.
- P. Q. Cao, F. L. Ning, J. Y. Wu, B. X. Cao, T. S. Li, H. A. Sveinsson, Z. C. Liu, T. J. H. Vlugt and M. Hyodo, ACS Appl. Mater. Interfaces, 2020, 12, 14016–14028 CrossRef CAS PubMed.
- Q. Shi, P. Q. Cao, Z. D. Han, F. L. Ning, H. Gong, Y. Xin, Z. S. Zhang and J. Y. Wu, Cryst. Growth Des., 2018, 18, 6729–6741 CrossRef CAS.
- P. Q. Cao, J. L. Sheng, J. Y. Wu and F. L. Ning, Phys. Chem. Chem. Phys., 2021, 23, 3615–3626 RSC.
- Y. H. Li, Y. C. Song, F. Yu, W. G. Liu and J. F. Zhao, China Ocean Eng., 2011, 25, 113–122 CrossRef.
- F. Yu, Y. C. Song, W. G. Liu, Y. H. Li and W. Lam, J. Pet. Sci. Eng., 2011, 77, 183–188 CrossRef CAS.
- E. M. Chuvilin, B. A. Bukhanov, S. I. Grebenkin, V. V. Doroshin and A. V. Iospa, Cold Reg. Sci. Technol., 2018, 153, 101–105 CrossRef.
- Y. Xin, Q. Shi, K. Xu, Z. S. Zhang and J. Y. Wu, Front. Phys., 2021, 16, 33504 CrossRef.
- K. Xu, Y. Lin, T. Li, Y. Fu, Z. Zhang and J. Wu, J. Mol. Liq., 2022, 347, 118391 CrossRef CAS.
- K. Xu, Y. Lin, Q. Shi, T. Li, Z. Zhang and J. Wu, Phys. Chem. Chem. Phys., 2022, 24, 5479–5488 RSC.
- K. Xu, L. Yang, J. Liu, Z. Zhang and J. Wu, Energy Fuels, 2020, 34, 14368–14378 CrossRef CAS.
- B. Ma, J. L. Hayley and J. A. Priest, Cold Reg. Sci. Technol., 2022, 202, 103646 CrossRef.
- T. M. Vlasic, P. D. Servio and A. D. Rey, Ind. Eng. Chem. Res., 2019, 58, 16588–16596 CrossRef CAS.
- D. D. Wang, Z. C. Liu, F. L. Ning, W. Hu, L. Peng, G. W. Hu, Z. Zhang, Q. Luo, X. D. Li, X. F. Dou, L. L. Liu, Y. L. Li and C. L. Liu, J. Nat. Gas Sci. Eng., 2020, 81, 103399 CrossRef CAS.
- M. Kida, J. Yoneda, A. Masui, Y. Konno, Y. Jin and J. Nagao, J. Nat. Gas Sci. Eng., 2021, 96, 104284 CrossRef CAS.
- W. E. Smith, J. A. Priest and J. L. H. Hayley, Can. Geotech. J., 2018, 55, 1691–1701 CrossRef CAS.
- J. Y. Lee, J. C. Santamarina and C. Ruppel, Mar. Pet. Geol., 2008, 25, 884–895 CrossRef CAS.
- J. Y. Lee, J. C. Santamarina and C. Ruppel, Geochem., Geophys., Geosyst., 2010, 11, 1–13 CrossRef.
- Y. Xu, Q. Shi, Z. Zhou, K. Xu, Y. Lin, Y. Li, Z. Zhang and J. Wu, 2D Mater., 2022, 9, 035002 CrossRef.
- J. L. F. Abascal and C. Vega, J. Chem. Phys., 2005, 123, 234505 CrossRef CAS PubMed.
- L. C. Jacobson and V. Molinero, J. Phys. Chem. B, 2010, 114, 7302–7311 CrossRef CAS PubMed.
- T. Yagasaki, M. Matsumoto and H. Tanaka, J. Phys. Chem. C, 2016, 120, 21512–21521 CrossRef CAS.
- S. P. Serbanovic, M. L. Mijajlovic, I. R. Radovic, B. D. Djordjevic, M. L. Kijevcanin, E. M. Djordjevic and A. Z. Tasic, J. Serb. Chem. Soc., 2005, 70, 527–539 CrossRef CAS.
- S. Plimpton, J. Comput. Phys., 1995, 117, 1–19 CrossRef CAS.
- E. M. Schulson, Eng. Fract. Mech., 2001, 68, 1839–1887 CrossRef.
- K. Deng, X. W. Feng, X. J. Tan and Y. H. Hu, Mater. Today Commun., 2020, 24, 101029 CrossRef CAS.
- M. Arakawa and N. Maeno, Cold Reg. Sci. Technol., 1997, 26, 215–229 CrossRef.
- R. S. Potter, J. M. Cammack, C. H. Braithwaite, P. D. Church and S. M. Walley, ICAR, 2020, 351, 113940 CrossRef.
- L. Lei, Y. Seol and K. Jarvis, Geophys. Res. Lett., 2018, 45, 5417–5426 CrossRef.
- Y. H. Li, X. G. Song, P. Wu, X. Sun and Y. C. Song, J. Nat. Gas Sci. Eng., 2021, 95, 104184 CrossRef CAS.
- L. Lei, Y. Seol, J. H. Choi and T. J. Kneafsey, Mar. Pet. Geol., 2019, 104, 451–467 CrossRef CAS.
- Y. A. Dyadin, I. V. Bondaryuk and L. S. Aladko, J. Struct. Chem., 1995, 36, 995–1045 CrossRef.
- H. Sojoudi, M. R. Walsh, K. K. Gleason and G. H. McKinley, Adv. Mater. Interfaces, 2015, 2, 1500003 CrossRef.
- M. Kida, J. Yoneda, A. Masui, Y. Konno, Y. Jin and J. Nagao, J. Nat. Gas Sci. Eng., 2021, 96, 104284 CrossRef CAS.
- W. Durham, L. Stern, S. Kirby and S. Circone, Proceedings of the 5th International Conference on Gas Hydrates, 2005.
- Y. Liu, K. Xu, Y. Xu, J. Liu, J. Wu and Z. Zhang, Nanotechnol. Rev., 2022, 11, 699–711 CrossRef CAS.
- S. Liang and P. G. Kusalik, J. Chem. Phys., 2015, 143, 011102 CrossRef PubMed.
- J. J. Liu, R. Fu, Y. W. Lin, Q. Shi, Y. S. Liu, T. Li, Z. S. Zhang and J. Y. Wu, ACS Sustainable Chem. Eng., 2022, 10, 10339–10350 CrossRef CAS.
- Y. Lin, Y. Liu, K. Xu, T. Li, Z. Zhang and J. Wu, Adv. Geo-Energy Res., 2022, 6, 23–37 CrossRef CAS.
- M. R. Walsh, J. D. Rainey, P. G. Lafond, D. H. Park, G. T. Beckham, M. D. Jones, K. H. Lee, C. A. Koh, E. D. Sloan, D. T. Wu and A. K. Sum, Phys. Chem. Chem. Phys., 2011, 13, 19951–19959 RSC.
Footnote |
| † Electronic supplementary information (ESI) available. See DOI: https://doi.org/10.1039/d3nr04940j |
| This journal is © The Royal Society of Chemistry 2024 |

