
 Open Access Article
 This Open Access Article is licensed under a
 Creative Commons Attribution 3.0 Unported Licence
The effect of dangling o-diphenyl rings on the solid-state emission of quinoxaline-based D–A–D molecules†
Marco S.
Valverde Paredes
and
Dong-Chan
Lee
 *
*
Department of Chemistry & Biochemistry, University of Nevada, Las Vegas, 4505 S. Maryland Parkway, Box 454003, Las Vegas, Nevada 89154-4003, USA. E-mail: Dong-Chan.Lee@unlv.edu
First published on 3rd October 2024
Abstract
In this paper, we prepared four donor (D)–acceptor (A)–donor (D) compounds utilizing thiophene as D and quinoxaline as A to investigate the efficacy of o-diphenyl side group in preventing aggregation caused quenching (ACQ). The phenyl rings were placed on the quinoxaline core (QT-Ph) and further modified at the para position with decyloxy (QT-Ph-OC10), decanoate (QT-Ph-EstC10), and benzoate (QT-Ph-EstPh) substituents. From UV-Vis spectroscopy, it was found that in solution the compounds exhibit similar absorption patterns with λmax around 440 nm with the exception of QT-Ph-OC10 which had a shorter λmax at 407 nm. In solution, all four compounds exhibited high fluorescence quantum yields at ca. 55% with emission maxima following the optical HOMO–LUMO gap trend. In the solid-state, all compounds experienced varying degrees of red-shift in their absorption and emission compared to solution. ACQ of 50–60% was observed for QT-Ph-OC10 and QT-Ph-EstPh in the solid-state. However, QT-Ph and QT-Ph-EstC10 showed significantly diminished ACQ and retained high quantum yields of 46% and 44%, respectively. The optimized geometries generated by theoretical calculations at the B3LYP/6-31G* level revealed that the dihedral angles between structural subunits may play a key role in the different degrees of ACQ. Notably, the dihedral angle between the quinoxaline and phenyl side group was found to be ca. 40°. The ester group in QT-Ph-EstC10 was orthogonally arranged to the phenyl ring which may have prevented any significant ACQ. Both QT-Ph and QT-Ph-EstC10 proved to be excellent organogelators in several polar and nonpolar solvents. Polarized optical microscopy and scanning electron microscopy on dried gels revealed the existence of one-dimensional fibers. Finally, their potential as fluorescent acid sensors was investigated. While all the title compounds showed fast emission quenching upon exposure to trifluoroacetic acid (TFA) vapor in the solid-state, only QT-Ph-EstC10 demonstrated fast emission recovery upon removal of TFA. The reversibility was discussed with electrostatic potential energy map. The current study demonstrates not only the utility of dangling o-diphenyl groups in reducing ACQ, but also feasibility of further modification that can tune photophysical and assembling properties.
Introduction
Development of novel organic solid-state emitters based on small molecules continues to be an attractive topic due to their uses in optoelectronic applications such as organic light-emitting diodes,1–6 organic solid-state lasers,7–12 sensors,13,14 biomedical imaging,15–20etc. Many emissive organic materials suffer from aggregation-caused quenching (ACQ). It is common for an organic fluorophore to be highly emissive in solution. However, once the molecules aggregate, intermolecular interactions, mainly π–π interactions cause a decrease or loss of emission.6,21–25 However, ACQ may be prevented or diminished through incorporating bulky substituents into the molecular structure6,23,24 which can avoid detrimental intermolecular π-orbital overlap. Alternatively, aggregation-induced emission luminogens (AIEgens) could be employed to enhance the emission upon solidification.5,6,22,23,26,27 AIEgens are propeller-like molecular structures that are typically non-emissive in solution but exhibit strong emission upon aggregation due to restricted molecular motions (RIM) in the solid-state.Molecular systems that incorporate electron-donor (D) and acceptor (A) units are commonly used in solid-state emitters. Through the hybridization of energy levels between the D and A units, the HOMO–LUMO energy gap can be tuned. Some of the successful molecular configurations for solid-state emission include D–A,3,5,25,27–31 D–A–D,3–5,17–20,27,32,33 and A–D–A.4,34–37 The advantage of D–A systems is their modularity, being able to modify the electronic properties through different combinations of D and A units.
Triphenylamine (TPA) stands out as a common donor unit in donor–acceptor based solid-state emitters.20,32,33,38–42 TPA is an attractive choice since it also serves as an AIEgen due to its propeller-like structure. However, unlike TPA, not every donor has the ability to prevent ACQ. Fixing TPA as a donor limits electronic property control since further tuning the electronic properties could be achieved only through the modification of the acceptor portion. In order to have more choice of non-AIEgen or non-bulky donors, other structural units that can prevent ACQ need to be developed and incorporated into the emitter. One potential candidate is the o-diphenyl substituent, which has a nonplanar geometry resulting from steric repulsion between the two adjacent phenyl rings. This substituent can easily be incorporated into commonly used N-heterocycle acceptor cores. Although this substituent has been introduced to numerous molecules,43–47 their efficacy in preventing ACQ has not been studied systematically.
In this paper we investigated the effect of side group modification using a D–A–D framework. Thiophene and quinoxaline are chosen as D and A, respectively. Positions 2 and 3 of quinoxaline have been modified with phenyl rings, and the o-diphenyl groups were further modified with alkoxy, alkyl ester, and aromatic ester groups to study their effects on the electronic properties, especially in the solid-state. The photophysical properties of the four title compounds were investigated with UV-vis absorption and fluorescence spectroscopy both in solution and the solid-state. Theoretical calculations were conducted to deduce the optimized geometry to establish structure–property relationships. The self-assembly ability of the title compounds was also studied through organogelation. Furthermore, the acid-sensing capabilities of these molecules were discussed both in solution and the solid-state.
Results and discussion
Synthesis
The molecular structures of D–A–D compounds investigated in this work are depicted in Fig. 1. | ||
| Fig. 1 Structures of the title D–A–D molecules. | ||
These compounds were synthesized through the key condensation reaction between the aromatic o-diamine and the α-diketone intermediates, as described in Scheme S1 in ESI.† For α-diketone intermediate 2, 4,4′-dihydroxybenzil (1) was subjected to a Williamson ether synthesis with 1-bromodecane. Nucleophilic acyl substitution reactions using alkyl and aromatic carbonyl chlorides with compound 1 produced α-diketones 3 and 4. The o-diamine intermediate, 1,2-diamino-3,6-dithien-2-ylbenzene (5), was prepared by the reduction of 4,7-di-2-thienyl-2,1,3-benzothiadiazole which was generated by the Pd-catalyzed Stille coupling between 4,7-dibromo-2,1,3-benzothiadiazole and 2-(tributylstannyl)thiophene. The detailed synthetic procedures and structural characterizations are provided in ESI.†
Optical properties
The absorption and emission properties of the title compounds are summarized in Table 1.
λ
smax![[thin space (1/6-em)]](https://www.rsc.org/images/entities/char_2009.gif) a a |
λ
pmaxb |
E
optgc |
λ
sema |
λ
pemb |
Φ
sFd |
Φ
pFe |
|
|---|---|---|---|---|---|---|---|
| a Solution (in nm). b Powder (in nm). c Solution (in eV). d Quantum yield of solution (%). e Quantum yield of powder (%). Abbreviation: sh, shoulder. | |||||||
| QT-Ph | 435 | 456 | 2.46 | 548 | 567 | 54 | 46 |
| QT-Ph-OC10 | 407 | 416, 466(sh) | 2.50 | 542 | 585 | 54 | 27 |
| QT-Ph-EstC10 | 441 | 446 | 2.44 | 553 | 566 | 55 | 44 |
| QT-Ph-EstPh | 442 | 452 | 2.44 | 552 | 569 | 55 | 22 |
UV-Vis absorption spectra of the title compounds in solution were recorded in chloroform (Fig. 2a). QT-Ph, featuring only the o-diphenyl side group, exhibited λmax at 435 nm. Further introduction of decyloxy to the phenyl ring (QT-Ph-OC10) blue-shifted the λmax to 407 nm. On the other hand, the compounds with ester substituents (QT-Ph-EstC10, and QT-Ph-EstPh), showed λmax at ca. 441 nm with absorption patterns reminiscent of QT-Ph. The optical HOMO–LUMO energy gaps (Eoptg) were estimated using the tangent of the absorption edge. The title compounds displayed similar Eoptg values. The difference between the largest and smallest gap was only 0.06 eV. The largest Eoptg corresponded to QT-Ph-OC10 with a value of 2.50 eV followed by QT-Ph with Eoptg of 2.46 eV. The smallest energy gap was found in both QT-Ph-EstC10 and QT-Ph-EstPh at 2.44 eV.
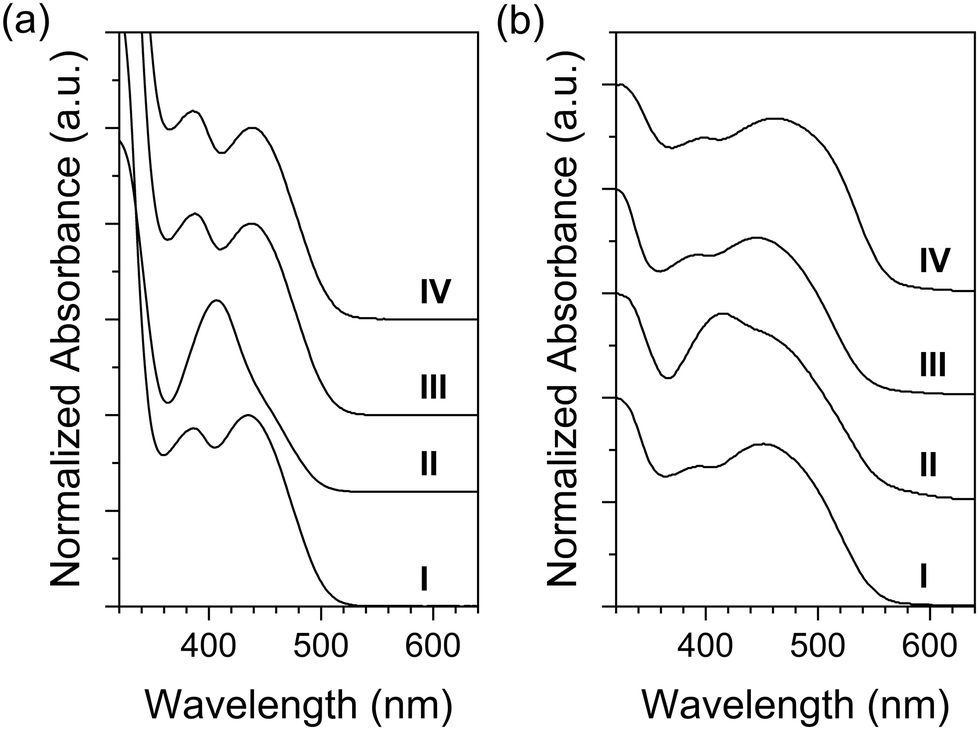 | ||
| Fig. 2 UV-Vis absorption spectra of the title compounds in solution (20 μM) (a) and UV-vis diffuse reflectance spectra of powder (b). (I) QT-Ph, (II) QT-Ph-OC10, (III) QT-Ph-EstC10, and (IV) QT-Ph-EstPh. | ||
The difference in λmax could be attributed to the electronic demand of the substituents on the quinoxaline core. Presumably, the electron-withdrawing ester group in QT-Ph-EstC10 and -EstPh increased the electron-deficiency of quinoxaline which enhanced the intramolecular charge transfer (ICT) between quinoxaline acceptor and thiophene donor. On the other hand, the electron donating ability of the alkoxy substituent in QT-Ph-OC10 may have diminished the electron withdrawing ability of the acceptor core, blue-shifting λmax caused by reduced ICT.48
For solid-state, diffuse-reflectance spectra were recorded from powders. The powders were prepared by precipitation using dichloromethane as a good solvent and methanol as a poor solvent. In general, powder exhibited red-shifted absorption compared to solution. As shown in Fig. 2b, QT-Ph exhibited a red-shift of 21 nm from solution to powder. For the compounds with further functionalization on the phenyl ring, the degree of red-shift was 10 nm for QT-Ph-EstPh and 5 nm for QT-Ph-EstC10. In the case of QT-Ph-OC10, the major peak was red-shifted only by 9 nm, however it was accompanied by a more pronounced shoulder at ca. 466 nm.
The emission spectra were recorded in chloroform solutions as shown in Fig. 3a. The emission maxima (λem's) of QT-Ph, QT-Ph-OC10, QT-Ph-EstC10, and QT-Ph-EstPh were 548, 542, 553, and 552 nm, respectively. The trend in λem as a function of the substituents was very consistent with the Eg from the absorption. For example, the Eg difference of 0.06 eV between QT-Ph-OC10 and QT-Ph-EstC10 corresponds to 13 nm, and the difference in λem's of the two compounds was 11 nm. Notably, the fluorescence quantum yields (Φf) of the title compounds were quite high in solution at ca. 55%.
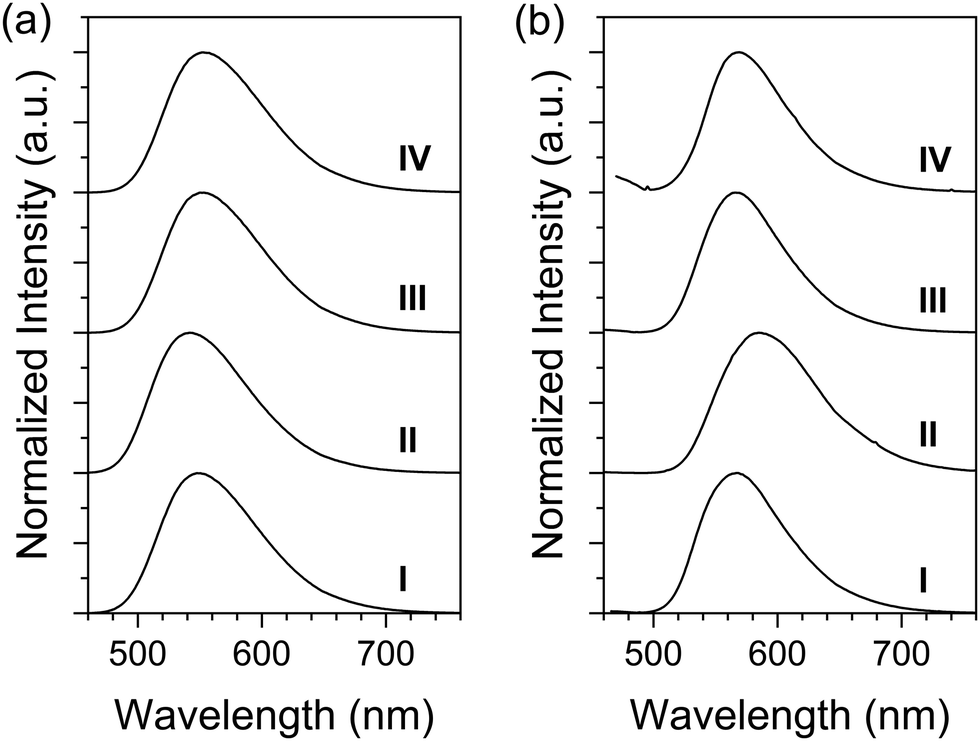 | ||
| Fig. 3 Fluorescence (FL) spectra of the title compounds in solution (a) and as powders (b). Excitation wavelength: λmax in Table 1. Solution concentration: 5 μM. (I) QT-Ph, (II) QT-Ph-OC10, (III) QT-Ph-EstC10, and (IV) QT-Ph-EstPh. | ||
The solid-state emission spectra (Fig. 3b) were recorded from powder samples. Compared to their solutions, the λem's for all the title compounds exhibited a noticeable red-shift in the solid-state. The degree of red-shift was the smallest for QT-Ph-EstC10 (13 nm), followed by QT-Ph (19 nm) and QT-Ph-EstPh (19 nm). The largest red-shift of 43 nm was observed for QT-Ph-OC10. Such a large shift may be the result of more pronounced π–π interactions which was also supported by the increased shoulder at 466 nm in the absorption of powder.
Unlike the Φf's in solution, there were significant variations in the Φf of the powders. The Φf of QT-Ph powder was found to be 46%. Although the FL was quenched by 15% from solution, Φf in the solid-state was still quite high. This result is encouraging as it validates the efficacy of the o-diphenyl side group in preventing ACQ. A higher level of emission quenching was observed from QT-Ph-OC10 and QT-Ph-EstPh with 50–60% ACQ relative to their solutions. Interestingly, QT-Ph-EstC10 exhibited a high solid-state Φf at 44% which was only a 20% decrease from solution. The possible origin of the interesting pattern in the solid-state Φf will be further discussed with optimized molecular geometry deduced by theoretical calculations.
We also conducted FL solvatochromism study in toluene, THF, chloroform, and DCM (Fig. S17, ESI†). The title compounds showed a positive solvatochromism. In general, the emission maxima red-shifted from toluene to DCM by 8–14 nm while the spectral shape was maintained. A similar solvatochromism has been reported from a quinoline–carbazole based D–A system,48 which is indicative of ICT.
As a visual illustration, pictures of the solution and powder emission under a handheld UV lamp (at 365 nm illumination) are presented in Fig. 4. The color and brightness of the emission in solution was consistent with the emission maxima and Φf analysis discussed above. In solution, QT-Ph, -EstC10, and -EstPh showed orange emission, while the emission of QT-Ph-OC10 had a slight green tint. The powders of QT-Ph and QT-Ph-EstC10 emitted distinctively brighter than other compounds. Also, orange emission of QT-Ph-OC10 corresponds to the longer λem of the compound.
 | ||
| Fig. 4 QT-Ph (a) and (e), QT-Ph-OC10 (b) and (f), QT-Ph-EstC10 (c) and (g), and QT-Ph-EstPh (d) and (h) under a hand-held UV lamp (at 365 nm). (a)–(d) Solutions, (e)–(h) powders. | ||
Theoretical calculations
The optimized geometries and frontier molecular orbitals of the four compounds were calculated using density functional theory at the B3LYP/6-31G* level with the Gaussian 09 suite of programs. The orbital diagrams and molecular images were generated using the SPARTAN electronic structure and visualization package. For computational convenience, long alkyl groups were substituted with methoxy (QT-Ph-OC1) and methyl ester (QT-Ph-EstC2) for QT-Ph-OC10 and QT-Ph-EstC10, respectively.The calculated optimized geometry represents the most stable conformation of an isolated molecule, providing valuable insight into the influence of side groups in our quinoxaline-based D–A–D system. Multiple dihedral angles were examined based on the optimized geometry. These dihedral angles include (i) α: the angle between the quinoxaline core and thiophene donor, (ii) β: the angle between the quinoxaline core and phenyl ring, and (iii) γ: the angle between the phenyl ring and alkoxy/ester groups.
The α of all the compounds was consistent at ca. 20° indicating that the donor and acceptor do not adapt a planar geometry (Fig. 5). Meanwhile, β stayed consistent at around 40°. The dangling phenyl side group imposed a significant dihedral angle which could help avoid tight intermolecular packing, and thus reduce ACQ. Such an effect was observed from QT-Ph, with only a 15% decrease in emission from solution to powder. An interesting finding comes from the dihedral angle γ. For QT-Ph-OC1, the phenyl ring and the methoxy group were nearly on the same plane (γ = 0.58°) (Fig. 5b). This should indicate that the OCH2 in QT-Ph-OC10 should be on the same plane as the phenyl ring. On the other hand, the alkylester of QT-Ph-EstC2 adapted a perpendicular placement to the phenyl ring (γ = 89.98°) (Fig. 5c). Although the same ester group was present, QT-Ph-EstPh exhibited γ of 49.96° (Fig. 5d).
 | ||
| Fig. 5 Geometry optimized structures of (a) QT-Ph, (b) QT-Ph-OC1, (c) QT-Ph-EstC2, and (d) QT-Ph-EstPh. | ||
The variation of γ may explain the difference in the solid-state Φf. The alkylester group being perpendicular to the phenyl ring in QT-Ph-EstC10 could further prevent tight π–π stacking, minimizing the emission quenching. For QT-Ph-EstPh, the reduced γ compared to QT-Ph-EstC2 coupled with additional phenyl ring could cause π–π stacking, lowering Φf in the solid-state. Note that the dihedral angle between the ester group and the phenyl ring (δ in Fig. 5d) was revealed to be only 0.73°.
The frontier molecular orbital energies were determined based on the optimized geometries. EHOMO, ELUMO, HOMO–LUMO energy gap (ETheog), and orbital diagrams are presented in Fig. S18 (ESI†). The examination of EHOMO, ELUMO, and orbital diagrams gave us a better understanding on the effect of the side group. The LUMO orbital was localized more on the quinoxaline core while the HOMO orbital spread over thiophene–benzene–thiophene. As a result, alkoxy or ester group on the dangling phenyl ring affected ELUMO more than EHOMO. From QT-Ph to QT-Ph-EstPh to QT-Ph-EstC10, ELUMO was progressively lowered from vacuum. The addition of carbonyl to the phenyl ring made the π-core more electron-deficient. Further introduction of phenyl in QT-Ph-EstPh may have offset the electron withdrawing ability of carbonyl, which may have contributed to the less stabilized ELUMO than that of QT-Ph-EstC10. In the case of QT-Ph-OC10, the electron-donating alkoxy increased both EHOMO and ELUMO. ETheog deduced from ELUMO and EHOMO exhibited a consistent trend with those obtained experimentally from the absorption. The theoretical study clearly revealed how the dangling side group was able to affect the electronic properties of the whole molecule, albeit the remote location to the π-core.
Organogelation and acid-sensing
Organogels form by solvent molecules being trapped in a three-dimensional (3D) network of one-dimensional (1D) fibers of low molecular weight organogelators (LMOGs). LMOGs self-assemble to form 1D fibers, which is driven by intermolecular forces such as hydrogen bonding, van der Waals, and π–π interactions. It has been shown that an aromatic moiety substituted with alkyl side groups with asymmetric geometry can promote organogelation.49–53 Thus, the title compounds may be potential candidates as LMOGs considering their asymmetric nature with side groups. Therefore, we tested their efficacy as LMOGs.To test gelation, the compounds were dissolved in various solvents and gently heated before being allowed to cool to room temperature. Successful gelation was confirmed when no flow was observed upon inverting the vial. The results are summarized in Table S2 (ESI†), with the critical gelation concentration (CGC) in parentheses. QT-Ph and QT-Ph-EstC10 were able to gel in nonpolar hydrocarbon solvents and a few polar solvents including ethanol, propanol, and acetonitrile. However, QT-Ph-OC10 and QT-Ph-EstPh did not gel any solvents tested. The CGC of QT-Ph was lowest in alcohol solvents and highest in ethyl acetate. The CGC in alcohol solvents was 5 mM which corresponds to 0.28 wt%. QT-Ph can be regarded as a supergelator (CGC < 1 wt%)54 in all the gelation solvents. In the case of QT-Ph-EstC10, the CGC fell between 1.2 and 2.4 wt%. Although QT-Ph-EstC10 can be considered as a good gelator (1–10 wt%)54 in all the gelling solvents, its CGC's are close to that of a supergelator.
The morphology of self-assembled structures of QT-Ph and QT-Ph-Est10 were first investigated using optical microscopy. Xerogels (dried gels) were prepared by slow evaporation after dropping ethanol solution onto glass slides. The concentration of the ethanol solutions used were slightly lower than the CGC's (3 mM for QT-Ph and 7 mM for QT-Ph-EstC10) to avoid the formation of an overly thick film for characterization. The gelation on the glass slide was visually confirmed when the small amount of solvent evaporated. As shown in Fig. S19 (ESI†), the existence of entangled 1D fibers in both xerogels was clearly verified. The fibers produced from QT-Ph were thinner and more flexible than those from QT-Ph-EstC10.
We further investigated the fiber morphology of QT-Ph-EstC10 xerogel by field-emission scanning-electron microscopy (FE-SEM). For this study, a xerogel of QT-Ph-EstC10 prepared from ethanol (13 mM) was characterized. As shown in Fig. 6, the SEM images also showed the presence of 1D fibers. These fibers were a very thin flat belt type and intertwined with each other. The fiber width was not uniform at all, however it seemed that smaller width fibers fused together to form fibers with larger width. Optical microscopy and FE-SEM serve as evidence to prove the fiber formation during gelation.
 | ||
| Fig. 6 FE-SEM images of QT-Ph-EstC10 xerogel. Scale bars: (a) 10 μm and (b) 1 μm. Inset: Pictures of DCM solution (left) and EtOH gel (right) under a hand-held UV-lamp (365 nm). | ||
Understanding the molecular packing mode would be helpful to understand the fibrillation, however, attempt to grow a large enough single crystal for X-ray crystallography was unsuccessful due to the compound's tendency to form fibers. To investigate the aggregation behavior of QT-Ph-EstC10, we conducted a concentration dependent 1H NMR spectroscopy. QT-Ph-EstC10 had excellent solubility in CDCl3, and increasing concentration did not cause any proton resonance shift. However, we were able to observe upfield shift in aromatic protons in a CDCl3/CD3OD (1/1 v/v) solvent mixture upon increasing concentration (Fig. 7). All the aromatic protons experienced upfield shift upon increasing concentration. Among others, proton a underwent the largest shift of Δ = −0.10 ppm when the concentration increased from 1 to 20 ppm. Protons d and e upfield-shifted by 0.06 ppm. The smallest shift of Δ = −0.03 ppm was observed for protons b, c, and f.
 | ||
| Fig. 7 1H NMR spectra of QT-Ph-EstC10 at 1, 10, and 20 mM in CDCl3/CD3OD (1/1 v/v). * Solvent peak. | ||
The observed upfield shift of the aromatic protons are caused by electron-shielding by a neighbouring π-surface above (or below) those protons. The highest degree of upfield shift of proton a suggests that the proton is closest to the neighboring π-core at high concentration. This result clearly indicates that there are intermolecular π–π interactions when the molecules approach each other as concentration increases. The same study for QT-Ph was unsuccessful due to precipitation of the compound in the mixed deuterated solvents.
The title compounds possess a quinoxaline core with two imine nitrogen atoms which can function as proton acceptors. Furthermore, QT-Ph and QT-Ph-EstC10 exhibit high quantum yield both in solution and in the solid-state. A high quantum yield is advantageous for the sensitivity of fluorescent sensors. Therefore, we assessed the potential of the title compounds as fluorescence acid sensors. Acid-sensing experiments for the compounds were conducted in both solution and solid-state (the data for QT-Ph-EstPh is presented in ESI†).
UV-Vis and fluorescence spectroscopy were employed to test the acid-sensing in solution. Chloroform solutions of the title compounds were prepared, and varying amounts of trifluoroacetic acid (TFA) was added by keeping the solution concentration constant at 20 μM. For absorption measurements, TFA volume ranged from 10 μL to 100 μL, with an increment of 10 μL. For emission measurements, TFA was added in the following volumes: 1, 5, 10, 20, 30, 40, 50, 60, and 100 μL. All the solutions were rested for 5 minutes after the addition of TFA before spectroscopic measurements were taken. The absorption and emission spectra with respect to TFA amount are shown in Fig. 8.
 | ||
| Fig. 8 Changes in the absorption (a), (c), and (e) and emission (b), (d), and (f) properties of QT-Ph (a) and (b) QT-Ph-OC10 (c) and (d) and QT-Ph-EstC10 (e) and (f) in solution upon the addition of trifluoroacetic acid (TFA). For (a), (c), and (e), TFA was added at an increment of 10 μL up to 100 μL. For (b), (d), and (f), the amount of TFA added were 1, 5, 10, 20, 30, 40, 50, 60, and 100 μL. | ||
QT-Ph-OC10 had the most drastic change to its absorption spectrum (Fig. 8c). It exhibited a colorimetric response with increasing TFA concentration. The absorbance at 407 nm was gradually decreased and a new peak at 480 nm appeared. An isobestic point was found at 439 nm indicating the presence of a new protonated species. The new peak at 480 nm is likely a result of the ICT between the protonated quinoxaline acceptor and the thiophene donor. The increased electron deficiency of the protonated core (stronger acceptor) would result in a CT band at longer wavelength. On the other hand, QT-Ph-EstC10 experienced negligible changes in the absorption pattern (Fig. 8e). The absorption pattern of QT-Ph (Fig. 8a) seems to be in between QT-Ph-OC10 and QT-Ph-EstC10. Although a fully grown peak at longer wavelength like QT-Ph-OC10 did not appear, a tailing centered around 540 nm started to develop with increasing TFA concentration, as a result of ICT.
The emission spectra for QT-Ph, QT-Ph-OC10, and QT-Ph-EstC10 (Fig. 8b, d and f, respectively) all showed a decrease in emission intensity with increasing TFA concentration. When 1 μL (180 eq.) of TFA was added, there was a 6, 20, and 9% decrease in emission intensity for QT-Ph, QT-Ph-OC10, and QT-Ph-EstC10, respectively. At 20 μL (3600 eq.), all the compounds experienced ca. 70% decrease in emission intensity (68% for QT-Ph and 74% for QT-Ph-OC10 and -EstC10). It should be noted that QT-Ph-OC10 experienced greater quenching in comparison until ca. 70% quenching was reached. While a decrease in emission intensity was observed for QT-Ph-OC10, there was absence of a new emission peak from the protonated species. This suggests that the protonated species is non-emissive. Although these compounds have potential for acid-sensing, the sensitivity in solution was quite poor.
To further investigate the acid-sensing results, the electrostatic potentials were computationally generated using the previously mentioned theoretical method/basis set. The electrostatic potentials of QT-Ph, QT-Ph-OC1, and QT-Ph-EstC2 are shown in Fig. 9. The surface potentials are color-coded: blue indicates the most positive surface potential, followed by green, yellow, and finally red, signifying the most negative surface potential.
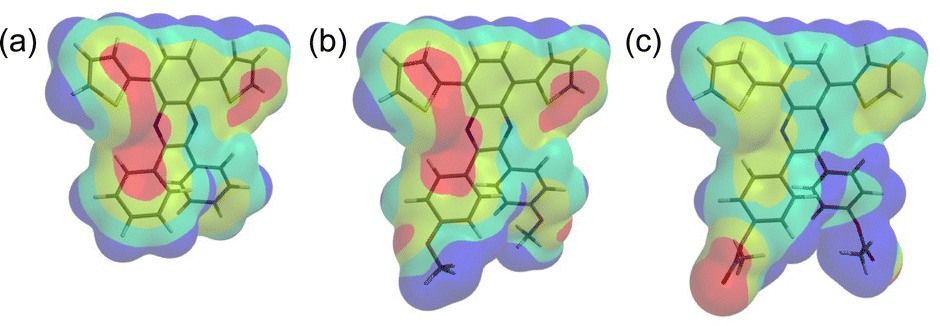 | ||
| Fig. 9 Computed electrostatic potential on the 0.001 a.u. molecular surface of QT-Ph (a), QT-Ph-OC1 (b) and QT-Ph-EstC2 (c). Color ranges for QT-Ph (kJ mol−1): blue, more positive than 22; green, between 22 and −23; yellow, between −23 and −69; red, more negative than −69. Color ranges for QT-Ph-OC1 (kJ mol−1): blue, more positive than 24; green, between 24 and −25; yellow, between −25 and −74; red, more negative than −74. Color ranges for QT-Ph-EstC2 (kJ mol−1): blue, more positive than 35; green, between 35 and −30; yellow, between −30 and −96; red, more negative than −96. | ||
Both QT-Ph and QT-Ph-OC1 have several regions of strong negative surface potential, with the central one being the imine nitrogen. In comparison, QT-Ph-EstC2 has a strong negative surface potential associated with the carbonyl oxygen of the ester group. It is clear from the electrostatic potential maps that QT-Ph and QT-Ph-OC1 have higher electron density on the imine nitrogen compared to QT-Ph-EstC2. When examining the area corresponding to the lone pair of imine nitrogen, the values for QT-Ph, QT-Ph-OC1, and QT-Ph-EstC2 were −109.2, −121.8, and −79.2 kJ mol−1, respectively. QT-Ph-OC1 has the highest electron density on the imine nitrogen which can be attributed to the electron-donating oxygen on the alkoxy side group through resonance. This is not the case with QT-Ph-EstC2, in which the carbonyl group offsets the electron donating ability of the oxygen next to the phenyl ring. QT-Ph, with no additional side group, falls in between the electron donating alkoxy and the electron withdrawing ester. Consequently, the imine nitrogen in QT-Ph-OC10 becomes more basic, which results in a stronger interaction with the protonic acid compared to QT-Ph and QT-Ph-EstC10. The stronger protonation of quinoxaline in QT-Ph-OC10 consequently makes it a stronger electron acceptor core which enhances ICT48,55 between thiophene and quinoxaline. This interaction causes the emergence of red shifted absorbance, triggering the colorimetric response in solution.
To test the solid-state acid-sensing abilities of QT-Ph, QT-Ph-OC10, and QT-Ph-EstC10, paper-based sensors were prepared by dip-coating filter paper strips with their concentrated solutions (5 mM). The paper sensors were placed inside of the vial saturated with TFA vapor for 1–3 seconds before removing them. As shown in Fig. 10, the emission of all three were quenched completely within 3 seconds after exposure to TFA vapor. QT-Ph was particularly fast in the emission quenching (1 s). Upon removal from the TFA environment, the restoration of emission was quite different for the three compounds. Only QT-Ph-EstC10 restored its emission 5 seconds after the removal. On the other hand, QT-Ph and QT-Ph-OC10 failed to recover the emission even after 10 seconds. We believe that the observed difference in the recovery of emission is originated from the basicity of imine N discussed above. The least basic imine N in QT-Ph-EstC10 may have induced weak acid–base interaction, which allowed for the fast emission recovery, making QT-Ph-EstC10 a reusable FL solid sensor.
 | ||
| Fig. 10 Solid-state acid sensing experiment with QT-Ph (a), QT-Ph-OC10 (b), and QT-Ph-EstC10 (c) coated filter paper strips under 365 nm illumination. aTotal elapsed time after removal. | ||
For QT-Ph-EstPh, the change in the absorption upon the addition of TFA was reminiscent of QT-Ph-EstC10. Also, the emission quenching in solution and as a paper sensor was very similar to the other compounds (Fig. S20, ESI†). It should be noted that the fluorescence recovery like QT-Ph-EstC10 was not observed.
Conclusions
In this work, we synthesized four D–A–D molecules with thiophene as the donor and quinoxaline as the acceptor, and examined how the modification of the quinoxaline core with different phenyl ring substituents influenced their photophysical properties. In solution, the title compounds exhibited similar absorption patterns with the exception of alkoxy substituted QT-Ph-OC10 which had a shorter λmax. The emission maxima were in agreement with the calculated optical HOMO–LUMO energy gaps and all four compounds had high quantum yields in solution (ca. 55%). However, significant differences were observed in the solid-state, as all compounds experienced a red-shift in both absorption and emission. Notably, QT-Ph and QT-Ph-EstC10 exhibited high solid-state quantum yields of 46% and 44%, respectively, with less than 20% ACQ from solution. However, QT-Ph-OC10 and QT-Ph-EstPh experienced 50–60% ACQ. Optimized geometries from theoretical calculations revealed a significant dihedral angle of 40° between the quinoxaline core and phenyl rings which could prevent π–π stacking. Interestingly, the phenyl rings with alkyl ester of QT-Ph-EstC10 was completely perpendicular to each other. This was not the case with other compounds. Alkoxy in QT-Ph-OC10 was nearly planar to the phenyl ring and phenyl ester in QT-Ph-EstPh had a dihedral angle of ca. 50° with respect to the phenyl ring. Clearly, the dihedral angle between structural subunits affected the solid-state quantum yield significantly. QT-Ph and QT-Ph-EstC10 demonstrated excellent organogelation ability in nonpolar and polar solvents, as a result of fibrillation. The efficacy of the title compounds as acid-sensors in solution was shown to have poor sensitivity. However, in the solid-state, each compound exhibited excellent response as a fluorescence paper sensor. While fast FL quenching upon exposure to TFA vapor was consistent with the title compounds, only QT-Ph-EstC10 displayed fast emission recovery, presumably as a result of weaker acid binding to the less electron-rich imine N, which was verified by electrostatic potential map. It is interesting that such a small structural variation remote to the acceptor core can affect photophysical, assembly, and acid-sensing properties.With this work, we verified the effectiveness of the dangling o-diphenyl groups in suppressing ACQ. We also demonstrated the feasibility of additional functionalization and their entailing photophysical properties. This work will broaden the choice of side groups that enables solid-state emission of organic fluorophores.
Data availability
The data supporting this article have been included as part of the ESI.†Conflicts of interest
There are no conflicts to declareAcknowledgements
The authors greatly acknowledge Mr Jung Jae Koh at the University of Nevada Las Vegas for his help with Mass Spectrometry.Notes and references
- L. S. Hung and C. H. Chen, Mater. Sci. Eng., R, 2002, 39, 143–222 CrossRef.
- X.-H. Zhu, J. Peng, Y. Cao and J. Roncali, Chem. Soc. Rev., 2011, 40, 3509–3524 RSC.
- Y. Tao, K. Yuan, T. Chen, P. Xu, H. Li, R. Chen, C. Zheng, L. Zhang and W. Huang, Adv. Mater., 2014, 26, 7931–7958 CrossRef CAS PubMed.
- A. Zampetti, A. Minotto and F. Cacialli, Adv. Funct. Mater., 2019, 29, 1807623 CrossRef.
- L. Tu, Y. Xie, Z. Li and B. Tang, SmartMat, 2021, 2, 326–346 CrossRef CAS.
- M. Shimizu and T. Hiyama, Chem. – Asian J., 2010, 5, 1516–1531 CrossRef CAS PubMed.
- I. D. W. Samuel and G. A. Turnbull, Chem. Rev., 2007, 107, 1272–1295 CrossRef CAS PubMed.
- F. Gao, Q. Liao, Z.-Z. Xu, Y.-H. Yue, Q. Wang, H.-L. Zhang and H.-B. Fu, Angew. Chem., Int. Ed., 2010, 49, 732–735 CrossRef CAS PubMed.
- C. Zhang, C.-L. Zou, Y. Yan, R. Hao, F.-W. Sun, Z.-F. Han, Y. S. Zhao and J. Yao, J. Am. Chem. Soc., 2011, 133, 7276–7279 CrossRef CAS.
- Y. Jiang, Y.-Y. Liu, X. Liu, H. Lin, K. Gao, W.-Y. Lai and W. Huang, Chem. Soc. Rev., 2020, 49, 5885–5944 RSC.
- Z. Man, J. Bao, Z. Xu, Z. Lv, Q. Liao, J. Yao and H. Fu, Adv. Funct. Mater., 2022, 32, 2207282 CrossRef CAS.
- K. Lupinska, M. Durko-Maciag, C. Andraud, Y. Bretonnière, P. Hanczyc, P. Fita, P. Szulim, J. Mysliwiec and L. Sznitko, J. Mater. Chem. C, 2023, 11, 4937–4945 RSC.
- Z. Ning, Z. Chen, Q. Zhang, Y. Yan, S. Qian, Y. Cao and H. Tian, Adv. Funct. Mater., 2007, 17, 3799–3807 CrossRef CAS.
- L. Zang, Y. Che and J. S. Moore, Acc. Chem. Res., 2008, 41, 1596–1608 CrossRef CAS.
- G. Niu, R. Zhang, J. P. C. Kwong, J. W. Y. Lam, C. Chen, J. Wang, Y. Chen, X. Feng, R. T. K. Kwok, H. H.-Y. Sung, I. D. Williams, M. R. J. Elsegood, J. Qu, C. Ma, K. S. Wong, X. Yu and B. Z. Tang, Chem. Mater., 2018, 30, 4778–4787 CrossRef CAS.
- G. Niu, R. Zhang, Y. Gu, J. Wang, C. Ma, R. T. K. Kwok, J. W. Y. Lam, H. H.-Y. Sung, I. D. Williams, K. S. Wong, X. Yu and B. Z. Tang, Biomaterials, 2019, 208, 72–82 CrossRef CAS.
- S. Liu, C. Chen, Y. Li, H. Zhang, J. Liu, R. Wang, S. T. H. Wong, J. W. Y. Lam, D. Ding and B. Z. Tang, Adv. Funct. Mater., 2020, 30, 1908125 CrossRef CAS.
- Y. Li, Y. Liu, Q. Li, X. Zeng, T. Tian, W. Zhou, Y. Cui, X. Wang, X. Cheng, Q. Ding, X. Wang, J. Wu, H. Deng, Y. Li, X. Meng, Z. Deng, X. Hong and Y. Xiao, Chem. Sci., 2020, 11, 2621–2626 RSC.
- Y. Li, Z. Cai, S. Liu, H. Zhang, S. T. H. Wong, J. W. Y. Lam, R. T. K. Kwok, J. Qian and B. Z. Tang, Nat. Commun., 2020, 11, 1255 CrossRef CAS PubMed.
- J. Wang, Y. Liu, M. Morsch, Y. Lu, P. Shangguan, L. Han, Z. Wang, X. Chen, C. Song, S. Liu, B. Shi and B. Z. Tang, Adv. Mater., 2022, 34, 2106082 CrossRef CAS.
- D. T. McQuade, J. Kim and T. M. Swager, J. Am. Chem. Soc., 2000, 122, 5885–5886 CrossRef CAS.
- J. Mei, N. L. C. Leung, R. T. K. Kwok, J. W. Y. Lam and B. Z. Tang, Chem. Rev., 2015, 115, 11718–11940 CrossRef CAS.
- M. K. Bera, P. Pal and S. Malik, J. Mater. Chem. C, 2020, 8, 788–802 RSC.
- M. Stolte, T. Schembri, J. Süβ, D. Schmidt, A.-M. Krause, M. O. Vysotsky and F. Würthner, Chem. Mater., 2020, 32, 6222–6236 CrossRef CAS.
- F. Yu, H. Zhao, Y. Li, G. Xia and H. Wang, Mater. Chem. Front., 2022, 6, 155–162 RSC.
- Y. Hong, J. W. Y. Lam and B. Z. Tang, Chem. Commun., 2009, 4332–4353 RSC.
- Q. Zhao and J. Z. Sun, J. Mater. Chem. C, 2016, 4, 10588–10609 RSC.
- E. Ishow, A. Brosseau, G. Clavier, K. Nakatani, P. Tauc, C. Fiorini-Debuisschert, S. Neveu, O. Sandre and A. Léaustic, Chem. Mater., 2008, 20, 6597–6599 CrossRef CAS.
- S. Kumar, P. Singh, P. Kumar, R. Srivastava, S. K. Pal and S. Ghosh, J. Phys. Chem. C, 2016, 120, 12723–12733 CrossRef CAS.
- A. Singh, C.-K. Lim, Y.-D. Lee, J.-H. Maeng, S. Lee, J. Koh and S. Kim, ACS Appl. Mater. Interfaces, 2013, 5, 8881–8888 CrossRef CAS PubMed.
- Y. Yu, H. Xing, D. Liu, M. Zhao, H. H.-Y. Sung, I. D. Williams, J. W. Y. Lam, G. Xie, Z. Zhao and B. Z. Tang, Angew. Chem., Int. Ed., 2022, 61, e202204279 CrossRef CAS PubMed.
- T. Liu, L. Zhu, C. Zhong, G. Xie, S. Gong, J. Fang, D. Ma and C. Yang, Adv. Funct. Mater., 2017, 27, 1606384 CrossRef.
- J. Kumsampao, C. Chaiwai, P. Chasing, T. Chawanpunyawat, S. Namuangruk, T. Sudyoadsuk and V. Promarak, Chem. – Asian J., 2020, 15, 3029–3036 CrossRef CAS PubMed.
- M. Shimizu, R. Kaki, Y. Takeda, T. Hiyama, N. Nagai, H. Yamagishi and H. Furutani, Angew. Chem., Int. Ed., 2012, 51, 4095–4099 CrossRef CAS.
- Y. Gong, Y. Zhang, W. Z. Yuan, J. Z. Sun and Y. Zhang, J. Phys. Chem. C, 2014, 118, 10998–11005 CrossRef CAS.
- L. Yao, S. Zhang, R. Wang, W. Li, F. Shen, B. Yang and Y. Ma, Angew. Chem., Int. Ed., 2014, 53, 2119–2123 CrossRef CAS.
- H. Wang, J.-X. Chen, Y.-Z. Shi, X. Zhang, L. Zhou, X.-Y. Hao, J. Yu, K. Wang and X.-H. Zhang, Adv. Mater., 2024, 36, 2307725 CrossRef CAS.
- R. Hu, E. Lager, A. Aguilar-Aguilar, J. Liu, J. W. Lam, H. H. Sung, I. D. Williams, Y. Zhong, K. S. Wong and E. Peña-Cabrera, J. Phys. Chem. C, 2009, 113, 15845–15853 CrossRef CAS.
- Y.-L. Zhang, Q. Ran, Q. Wang, Y. Liu, C. Hänisch, S. Reineke, J. Fan and L.-S. Liao, Adv. Mater., 2019, 31, 1902368 CrossRef CAS.
- B. Zhao, H. Wang, C. Han, P. Ma, Z. Li, P. Chang and H. Xu, Angew. Chem., Int. Ed., 2020, 59, 19042–19047 CrossRef CAS.
- U. Balijapalli, R. Nagata, N. Yamada, H. Nakanotani, M. Tanaka, A. D'Aléo, V. Placide, M. Mamada, Y. Tsuchiya and C. Adachi, Angew. Chem., Int. Ed., 2021, 60, 8477–8482 CrossRef CAS PubMed.
- T. Yang, J. Liang, Y. Cui, Z. Li, X. Peng, S. J. Su, Y. Wang and C. Li, Adv. Opt. Mater., 2023, 11, 2201191 CrossRef CAS.
- D. Gedefaw, M. Prosa, M. Bolognesi, M. Seri and M. R. Andersson, Adv. Energy Mater., 2017, 7, 1700575 CrossRef.
- C. Yin, G. Wen, C. Liu, B. Yang, S. Lin, J. Huang, P. Zhao, S. H. D. Wong, K. Zhang, X. Chen, G. Li, X. Jiang, J. Huang, K. Pu, L. Wang and L. Bian, ACS Nano, 2018, 12, 12201–12211 CrossRef CAS PubMed.
- S. Xu, G. Xiong, X.-Y. Zhang, K. Huang, D.-B. Qin and B. Zhao, Cryst. Growth Des., 2023, 23, 4214–4221 CrossRef CAS.
- S. Kothavale, S. C. Kim, K. Cheong, S. Zeng, Y. Wang and J. Y. Lee, Adv. Mater., 2023, 35, 2208602 CrossRef CAS.
- S. De and G. Das, J. Photochem. Photobiol., A, 2023, 443, 114884 CrossRef CAS.
- S. A. Jenekhe, L. Lu and M. M. Alam, Macromolecules, 2001, 34, 7315–7324 CrossRef CAS.
- M. Llusar, G. Monrós, C. Roux, J. L. Pozzo and C. Sanchez, J. Mater. Chem., 2003, 13, 2505–2514 RSC.
- F. Placin, J.-P. Desvergne, C. Belin, T. Buffeteau, B. Desbat, L. Ducasse and J.-C. Lassègues, Langmuir, 2003, 19, 4563–4572 CrossRef CAS.
- A. Del Guerzo, A. G. L. Olive, J. Reichwagen, H. Hopf and J.-P. Desvergne, J. Am. Chem. Soc., 2005, 127, 17984–17985 CrossRef CAS PubMed.
- J. Reichwagen, H. Hopf, A. Del Guerzo, C. Belin, H. Bouas-Laurent and J.-P. Desvergne, Org. Lett., 2005, 7, 971–974 CrossRef CAS PubMed.
- C. Giansante, G. Raffy, C. Schäfer, H. Rahma, M.-T. Kao, A. G. L. Olive and A. Del Guerzo, J. Am. Chem. Soc., 2011, 133, 316–325 CrossRef CAS.
- J. Rubio-Magnieto and B. Escuder, in Molecular Gels: Structure and Dynamics, ed. R. G. Weiss, Royal Society of Chemistry, Croydon, 2018, ch. 5, pp. 129–166 Search PubMed.
- A. S. Shetty, E. B. Liu, R. J. Lachicotte and S. A. Jenekhe, Chem. Mater., 1999, 11, 2292–2295 CrossRef CAS.
Footnote |
| † Electronic supplementary information (ESI) available: Detailed synthetic procedures and NMR (1H and 13C) and mass-spectrometry characterizations, absolute quantum yield data, FL emission spectra in different solvents, coordinates of optimized structures, frontier molecular orbital diagrams with HOMO and LUMO energy levels, optical micrographs of xerogels of QT-Ph and QT-Ph-EstC10, gelation properties, acid-sensing properties of QT-Ph-EstPh. See DOI: https://doi.org/10.1039/d4nj03678f |
| This journal is © The Royal Society of Chemistry and the Centre National de la Recherche Scientifique 2024 |