DOI:
10.1039/D4NA00329B
(Paper)
Nanoscale Adv., 2024,
6, 5055-5068
Design and development of symmetric aromatic bischalcogenide-based photocatalysts for water treatment application: a concise study of diphenyl diselenide polypyrrole nanocatalysis†
Received
19th April 2024
, Accepted 2nd August 2024
First published on 16th August 2024
Abstract
Dopant engineering can be a very selective approach in designing hybrid materials. Incorporating the required functionality in a dopant effectively modulates its properties towards aimed applications. Consequently, this work through a comparative study envisaged the incorporation of chalcogenides (S, Se, and Te) in a biphenyl motif based on the analysis of major photocatalytic descriptors. Bischalcogenides as tuned dopants have been impressive in enhancing the surface area, increasing crystallinity and facilitating band gap shifts towards better light harvesting. In addition, the chalcogen effect was observed to induce preferential ion migration, leading to effective charge separation and attenuated recombination rates. Photocatalytic descriptors evaluated from electrochemical impedance spectroscopy and photoluminescence data corroborated the chalcogen effect in the observed trend (Ph)2 < (PhS)2 < (PhSe)2 < (PhTe)2. The diphenyl diselenide polypyrrole nanocomposite emerged to be better among the studied systems. (PhSe)2/PPY was characterized and comprehensively evaluated for its photocatalytic activity towards varied dye classes and the colorless isoniazid antibiotic under environmentally viable conditions. Its calculated band potential values and scavenger experiments indicate OH˙ and O2˙− as dominant species in its photocatalytic activity. Control experiments confirmed photocatalytic degradation over photolysis as the dye decolouration mechanism. Taken together, (PhSe)2/PPY emerges as a good propensity photocatalyst worthy of real time customization for wastewater treatment on a pilot scale.
1. Introduction
The growing population and concomitant industrial demands have progressively added to the troubles of the biosphere through environmental pollution. The plethora of toxic pollutants in industrial effluents contributes to the contamination of almost all segments of the environment with the most serious burden on the water bodies. Water contaminants in the form of textile dyes, heavy metal ions, agricultural chemicals and antibiotics cause aesthetic concerns and a serious threat to environmental ecology and human health. The organic dyes discharged into the water bodies from escalating textile industry effluents have posed a grave concern among environmental and water treatment researchers. Most of these dyes are non-biodegradable and carcinogenic in nature, demanding their facile and benign degradation to non-toxic and environmentally viable forms.1 Among the methodologies explored for water treatment applications, heterogeneous photocatalysis using smartly designed nanomaterials stands out as a promising low-cost, eco-friendly, and long-term sustainable technology.2,3 Several recent studies have focused on the photocatalytic activity of composites for the degradation of contaminants 4–9 and hydrogen production.10,11 Despite the greater prospects of photocatalysis, photocorrosion, charge density, absorption coefficient, and optical conductivity are the key challenges to circumvent while designing newer high performance water treatment photocatalysts. Hybrid composite materials 12 of inorganic semiconductors and conducting polymers have attracted great attention owing to the heterostructure formation between two semiconductor species enhancing charge separation, carrier mobility and attenuated recombination rate. In addition to its easy synthesis, potential stability, and characteristic band gap, polypyrrole exhibits visible light absorption, making it a suitable polymer matrix for photocatalytic degradation of environmental contaminants.13–15
In continuation of our interests in photoredox catalysis for synthetic and water treatment applications, 16–20 we envisaged hitherto unknown symmetric aromatic bischalcogenides as novel photoactive dopants in the polypyrrole matrix towards the development of high performance photocatalysts for water treatment application. For a systematic study, the photocatalytic descriptors (band gap, charge density, charge separation, and photo corrosion rate) of parent biphenyl (Ph)2 and three of its bis-chalcogenide derivatives {(PhS)2, (PhSe)2 and (PhTe)2} were evaluated using the standard methods of optoelectronic analysis and electrochemical impedance spectroscopy. The analysis of evaluated photocatalytic descriptors highlighted the chalcogenide effect in the trend (Ph)2 < (PhS)2 < (PhSe)2 < (PhTe)2. The enhanced photocatalytic parameters in the case of (PhTe)2 are limited by its elevated cost and toxic properties for a real-time application, paving the way to (PhSe)2 as the second desirable dopant. Selenium as a metalloid combines the electrical properties of a metal and the covalent binding ability of a non-metal. As a low electropositive semi-metal with accessible d orbitals, Se is capable of bringing Se⋯N type of supra molecular interactions.21,22 In addition, Se compounds are known to be visible light active systems having been tested for opto-electronic applications and lithium selenium batteries. 23,24 Selenium, in the form of symmetric aromatic diselenide (PhSe)2, adds further tuning of its desirable properties and enhances its possibilities of supra interaction via π–π stacking type of non-covalent interactions. Thus, the choice of using (PhSe)2 as a dopant in polypyrrole was based on three rationales: its good photocatalytic parameters among screened bis chalcogenide systems, stronger Se⋯N supra interaction between the (PhSe)2 dopant and nitrogen atom of the pyrrole ring and pi–pi stacking interactions of (PhSe)2 aromatic rings with the pyrrole rings of the polymer. The stabilizing nature of these non-covalent interactions was seen to influence the electronic as well as ordering effect in the pristine polymer. The synthesized (PhSe)2/PPY nanocomposite depicted superior photocatalytic parameters over the pristine polypyrrole as well as free dopant, predicting good photocatalytic activity. The photocatalytic activity of the (PhSe)2/PPY nanocomposite was customized for different dye classes and also the colorless isoniazid antibiotic. The (PhSe)2/PPY nanocomposite showed good photocatalytic efficacy under environmentally viable conditions for a triarylmethane dye (malachite green), a xanthene dye (rhodamine-B), an azo dye (methyl orange) and a thiazine dye (methylene blue) and isoniazid antibiotic. The synthesized photocatalyst showed selectivity towards cationic dyes due to its negative surface charge under experimental conditions. The (PhSe)2/PPY photocatalyst's stability, recyclability, and active radical species involved in the photocatalytic mechanism were established through control experiments. The observations of band potentials, Bode analysis, photoluminescence (PL), and photocurrent measurements indicate heterostructure formation between (PhSe)2 and PPY as a plausible reason for the enhanced photocatalytic activity.
2. Experimental methods
2.1. Materials
Pyrrole (Himedia, India; CAS no. 109-97-7) was distilled and stored at −5 °C prior to use. Diphenyl diselenide [(PhSe)2, Sigma Aldrich, India; CAS no. 1666-13-3], anhydrous ferric chloride (FeCl3, Fisher Scientific, India; CAS no. 7705-08-0), and chloroform (CHCl3, Fisher Scientific, India; CAS no. 67-66-3) were of analytical reagent grade and were utilized without further processing. Malachite green (CAS: 569-64-2), rhodamine B (CAS: 81-88-9), methyl orange (CAS: 547-58-0), and methylene blue (CAS: 61-73-4) were procured from Fisher Scientific, India, while isoniazid (CAS: 54-85-3) was obtained from Merck, India. Tetracycline hydrochloride (CAS: 64-75-5), and bisphenol A (CAS: 80-05-7) were purchased from SRL, India, and Sigma Aldrich, India, respectively. Nitro blue tetrazolium (NBT, CAS: 298-83-9) was purchased from CDH, India.
2.2. Synthesis of the diphenyl-diselenide/polypyrrole photocatalyst
The diphenyl diselenide/polypyrrole (PhSe)2/PPY photocatalyst has been prepared by in situ chemical oxidative polymerization in CHCl3 as previously reported.25 A uniform dispersion was obtained from 1.0 g of (PhSe)2 in a 0.3 M pyrrole solution made in CHCl3. A 0.6 M solution of FeCl3 in CHCl3 was then added dropwise to the mixture while stirring at room temperature. The reaction mixture immediately turned black in colour, signalling the polymerization of pyrrole monomers (Scheme S1†). The reaction mixture was kept stirring for 24 hours, and the obtained black-coloured precipitate of the PPY/(PhSe)2 material was collected over filtration, thoroughly washed with CHCl3, and dried in an oven at around 50 °C, until a constant weight.
2.3. Characterization analysis
Structural analysis was performed by powder X-ray diffraction (PXRD) using a PW 3050 diffractometer (Cu-Kα radiation, λ = 1.5418 Å). Fourier-Transform Infrared spectroscopy (FTIR) was performed on a PerkinElmer RX-1 FTIR spectrophotometer in the range 4000–500 cm−1. The particle size and morphology of the synthesized nanocomposite were evaluated by Scanning Transmission Electron Microscopy (STEM, Hitachi H-9500). N2 gas adsorption–desorption isotherms were obtained at 77 K using a Quantachrome AutosorbiQ Station 1. Before taking measurements, the samples were subjected to vacuum degassing at a temperature of 200 °C for a duration of 3 hours. The specific surface area and pore size distribution were calculated using a multi-point BET method and the Non-Local Density Functional Theory (NLDFT) equilibrium model. The zeta potential of the photocatalyst particles was determined using a Zetasizer Nano ZS. The optical properties and band gap of the synthesized samples were determined spectrophotometrically using the UV-Diffuse Reflectance Spectroscopy (UV-DRS) method over a double beam UV-visible spectrophotometer (PC1650). The photoluminescence (PL) studies were carried out using an RF-5301PC spectrofluorophotometer. Total Organic Carbon (TOC) analysis was carried out on a Shimadzu TOC Analyser (TOC-L). Electrochemical experiments (Mott–Schottky analysis, Nyquist plots, and photocurrent measurements) were carried out on a Bio-Logic SAS potentiostat (Model SP 150) using a three electrode system.
2.4. Electrochemical measurements
A three-electrode system having glassy carbon as the working electrode, Ag/AgCl as the reference electrode, and a platinum wire as the counter electrode was used for electrochemical impedance spectroscopy (EIS) and Mott–Schottky measurements with 0.1 M KNO3 as the supporting electrolyte. The working electrodes were obtained by drop casting an already prepared ink of the sample on the glassy carbon surface. The sample ink was prepared by dispersing 3 mg of the powder sample in 0.3 mL ethanol to which Nafion (10 μL) was added as a binder, followed by ultrasonication for 30 min to obtain a uniform sample ink before actual drop casting. Post drop casting electrodes were kept for drying in open air for 6 h before being used for electrochemical measurements. For the photocurrent experiments, ITO glass was used as the working electrode, and a solar simulator of 1 sun (1000 W m−2) luminosity was used for irradiation of the working electrode.
2.5. Photocatalytic activity assessment
The photocatalytic activity of the (PhSe)2/PPY nanocomposite was evaluated against a variety of textile dyes including Malachite Green (MG), Rhodamine B (RhB), Methyl Orange (MO), and Methylene Blue (MB) and other persistent contaminants such as isoniazid, tetracycline (TC) and bisphenol A (BPA). To mimic the natural sunlight, a 450 W visible light lamp was used as an irradiation source. In these experiments, 100 mL of 20 ppm dye solution was taken in a glass beaker. An aeration pump was used to purge air into the dye solution so as to saturate it with O2. After O2 saturation, 20 mg of (PhSe)2/PPY photocatalyst was dispersed in the dye solution under dark conditions for at least half an hour so that adsorption–desorption equilibrium can be achieved. While irradiating the dye solution, 2 mL aliquots were periodically sampled and analyzed for assessing the leftover dye concentrations using Beer–Lambert's law. While monitoring the decrease in absorbance with irradiation, the efficiency of the photocatalyst was calculated by using the following relation:| |  | (1) |
where C0 is the initial concentration of the dye and Ct is the concentration of the dye after a particular irradiation time.
The Langmuir–Hinshelwood kinetic model was used to understand the pseudo first-order kinetics involved in the degradation process and described by the equation
| |  | (2) |
where ‘
k’ is the apparent first-order rate constant (min
−1) for the reaction.
2.6. Superoxide radical quenching and quantification experiments
The reactive oxygen species generated during the photocatalytic activity were detected using different radical scavengers such as 1,4-benzoquinone (BQ), tert-butyl alcohol (TBA), and ammonium oxalate (AO) for scavenging the superoxide radical, hydroxyl radical and holes, respectively. The scavengers of 2 mM each were added to MG dye using 20 mg of (PhSe)2/PPY nanocomposite (20 ppm, 100 mL). The superoxide as a reactive radical in photocatalysis by the (PhSe)2/PPY nanocomposite was confirmed using superoxide radical selective nitro blue tetrazolium (NBT) degradation over a UV-visible spectrophotometer.19 The measurements were conducted using 20 ppm (20 mL) of NBT in Millipore water with the addition of 5 mg of photocatalyst.
3. Results and discussion
Incorporating a customized dopant into its perfect polymer matrix produces a composite material with distinct properties required for aimed applications. Towards this endeavor, the effect of biphenyl (Ph)2 and its three bischalcogenide derivatives diphenyl disulfide (PhS)2, diphenyl diselenide (PhSe)2, and diphenyl ditelluride (PhTe)2 as dopants in the polypyrrole matrix on the optoelectronic and photocatalytic properties has been evaluated. Prior to composite formation, a comparative analysis of photocatalytic activity descriptors of dopants was made using diffuse reflectance UV-visible spectroscopy (DR-UV), photoluminescence, and electrochemical impedance spectroscopy (EIS). The observed band gap values (Fig. 1(a)) indicated their progressive shifting to the visible region upon incorporation of a heavier chalcogen, implying better light harvesting ability from (Ph)2 < (PhS)2 < (PhSe)2 < (PhTe)2. The emission band at 315 nm due to π* → π transition in the photoluminescence (PL) spectrum of (Ph)2 shows an increasing bathochromic shift to 325 nm, 363 nm and 366 nm for (PhS)2, (PhSe)2 and (PhTe)2, respectively. The observed luminescence quenching can be attributed to the considerable deviation from coplanarity between the two phenyl rings post incorporation of chalcogen atoms. In addition the PL intensity got progressively reduced with heavier chalcogen atoms (S, Se and Te) (Fig. 1(b)), indicating extended exciton lifetime and reduced recombination rate. The chalcogen effect on attenuated recombination rate was further confirmed by EIS measurements using Nyquist impedance and Bode phase analysis (Fig. 1(c and d)). (PhTe)2 with the lowest band gap value and a reduced rate of recombination can be used as a desirable dopant in the polypyrrole matrix for high performance photocatalytic activity. The valuable photocatalytic parameters of (PhTe)2 are limited by its elevated cost and toxic properties for a real-time application, paving the way to (PhSe)2 as a second desirable dopant of the series. Thus, this work explored (PhSe)2 as a biocompatible organometallic dopant 26 with good photocatalytic descriptors. Moreover, (PhSe)2 dopant allows fostering Se⋯N and pi⋯pi stacking type supramolecular interactions capable of producing an ordered arrangement in the polypyrrole chains. (PhSe)2 modulation of electronic attributes in (PhSe)2/PPY via heterostructure formation has been utilized in effective photocatalytic degradation of persistent contaminants.
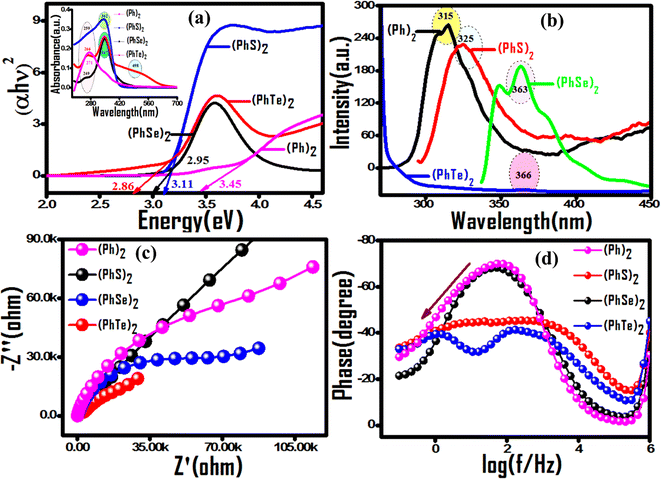 |
| | Fig. 1 Comparative evaluation of photocatalytic descriptors of symmetric aromatic bischalcogenide dopants. (a) Tauc plots with UV-vis diffuse reflectance spectra in the inset. (b) Progressive hypochromic and bathochromic spectral shifting of photoluminescence peaks with heavier chalcogen atoms (S, Se and Te). (c) Nyquist and (d) Bode phase plots from EIS analysis corroborating photoluminescence results. | |
3.1. Chemical and structural features of the (PhSe)2/PPY nanocomposite
The chemical nature of the synthesized (PhSe)2/PPY nanocomposite was investigated by FTIR analysis. The comparative FTIR spectra of (PhSe)2, PPY and (PhSe)2/PPY (Fig. S1†) confirmed composite formation. The FTIR spectrum of (PhSe)2 exhibited characteristic peaks at 1632 and 1574 cm−1 associated with the phenyl groups. FTIR peaks at 1460, 1015, 911 and 732, and 680 cm−1 are owing to aromatic C![[double bond, length as m-dash]](https://www.rsc.org/images/entities/char_e001.gif) C vibration, aromatic C–H stretching in the plane, aromatic C–H out of plane vibrations, and aromatic C
C vibration, aromatic C–H stretching in the plane, aromatic C–H out of plane vibrations, and aromatic C![[double bond, length as m-dash]](https://www.rsc.org/images/entities/char_e001.gif) C out of plane vibration mode, respectively.27 The FTIR spectrum of PPY was marked by peaks at 1547 and 1471 cm−1, signaling the presence of a pyrrole ring. Furthermore C–N stretching is observed at 1187 cm−1 and the characteristic peak at 3404 cm−1 is assigned to N–H stretching frequency.28–30 The characteristic peaks of PPY and (PhSe)2 with minor shifts observed in the FTIR spectrum of the (PhSe)2/PPY composite confirmed the incorporation of (PhSe)2 in the PPY matrix. The observed FTIR results also suggest restricted modes of vibration in the case of the (PhSe)2/PPY composite as compared to pristine PPY and (PhSe)2. This may be due to the initial adsorption of pyrrole monomer units over (PhSe)2 particles prompted by the N⋯Se type interactions of the pyrrole nitrogen atom and Se atoms, during the composite synthesis. The subsequent polymerization process thus leads to constricted growth, which corroborates spectral shifting and predicts property modulation effects on composite formation. The powder X-ray diffraction (PXRD) analysis was performed for determining the crystallinity and particle size of the synthesized materials. The comparative PXRD patterns of (PhSe)2, PPY, and (PhSe)2/PPY are depicted in Fig. S2.† The amorphous nature of PPY was observed from the absence of any peak. The (PhSe)2/PPY nanocomposite showed a diffraction pattern with well-defined and sharp peaks with low FWHM, indicating the crystalline nature of the composite. The crystalline nature of the nanocomposite was attributed to the presence of orthorhombic (PhSe)2 crystals,31 with the following primitive lattice parameters: a = 23.9988, b = 8.2231, c = 5.6499 and α = β = γ = 90°. The observed results indicate the molecular interaction of (PhSe)2 with PPY chains, modulated via N⋯Se interactions, enabling a more compact configuration of polymer chains than pristine PPY (Scheme 1). This results in an ordered array of PPY chains, which besides increasing the crystallinity also facilitates the flow of charge carriers along the polymer matrix. Scherrer's eqn (3) (ref. 32) was used to calculate the crystallite size utilizing the most prominent diffraction peak centered at 2θ = 14.5° for (PhSe)2 and 2θ = 22.4° for the composite.
C out of plane vibration mode, respectively.27 The FTIR spectrum of PPY was marked by peaks at 1547 and 1471 cm−1, signaling the presence of a pyrrole ring. Furthermore C–N stretching is observed at 1187 cm−1 and the characteristic peak at 3404 cm−1 is assigned to N–H stretching frequency.28–30 The characteristic peaks of PPY and (PhSe)2 with minor shifts observed in the FTIR spectrum of the (PhSe)2/PPY composite confirmed the incorporation of (PhSe)2 in the PPY matrix. The observed FTIR results also suggest restricted modes of vibration in the case of the (PhSe)2/PPY composite as compared to pristine PPY and (PhSe)2. This may be due to the initial adsorption of pyrrole monomer units over (PhSe)2 particles prompted by the N⋯Se type interactions of the pyrrole nitrogen atom and Se atoms, during the composite synthesis. The subsequent polymerization process thus leads to constricted growth, which corroborates spectral shifting and predicts property modulation effects on composite formation. The powder X-ray diffraction (PXRD) analysis was performed for determining the crystallinity and particle size of the synthesized materials. The comparative PXRD patterns of (PhSe)2, PPY, and (PhSe)2/PPY are depicted in Fig. S2.† The amorphous nature of PPY was observed from the absence of any peak. The (PhSe)2/PPY nanocomposite showed a diffraction pattern with well-defined and sharp peaks with low FWHM, indicating the crystalline nature of the composite. The crystalline nature of the nanocomposite was attributed to the presence of orthorhombic (PhSe)2 crystals,31 with the following primitive lattice parameters: a = 23.9988, b = 8.2231, c = 5.6499 and α = β = γ = 90°. The observed results indicate the molecular interaction of (PhSe)2 with PPY chains, modulated via N⋯Se interactions, enabling a more compact configuration of polymer chains than pristine PPY (Scheme 1). This results in an ordered array of PPY chains, which besides increasing the crystallinity also facilitates the flow of charge carriers along the polymer matrix. Scherrer's eqn (3) (ref. 32) was used to calculate the crystallite size utilizing the most prominent diffraction peak centered at 2θ = 14.5° for (PhSe)2 and 2θ = 22.4° for the composite.| |  | (3) |
where K = 0.9 is the shape factor, λ is the wavelength of the X-ray, θ is the diffraction angle and β is the full width at half maximum (FWHM). The average crystallite size obtained was 2.7 nm and 7.8 nm for (PhSe)2 and the (PhSe)2/PPY composite, respectively. The observed particle size confirmed the synthesized composite to be a nanocomposite.
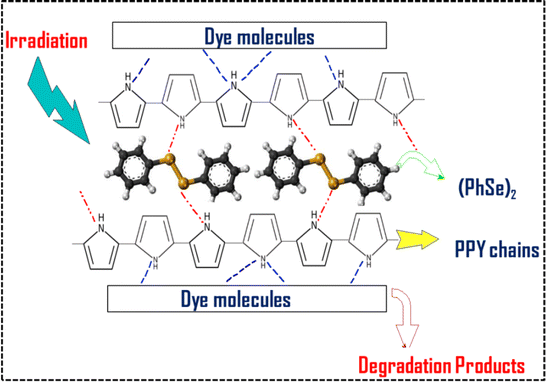 |
| | Scheme 1 Schematic representation of supra interactions between the (PhSe)2 dopant and the PPY matrix within the (PhSe)2/PPY nanocomposite and with contaminant dye molecules. | |
The morphology and shape of PPY and the PPY/(PhSe)2 nanocomposite were characterized by FE-SEM and STEM analysis (Fig. 2). The pristine polypyrrole was seen as a smooth sheet like structure (Fig. 2(a)). The (PhSe)2/PPY nanocomposite sample shows tubular (PhSe)2 nanorods embedded within the polypyrrole matrix (Fig. 2(b)). STEM micrographs exhibit a network configuration, where (PhSe)2 particles are evenly distributed throughout the polypyrrole matrix (Fig. 2(c and d)). The average particle size of the (PhSe)2/PPY nanocomposite calculated from the histogram plot using ImageJ software was around 13.2 nm (inset of Fig. 2(d)).
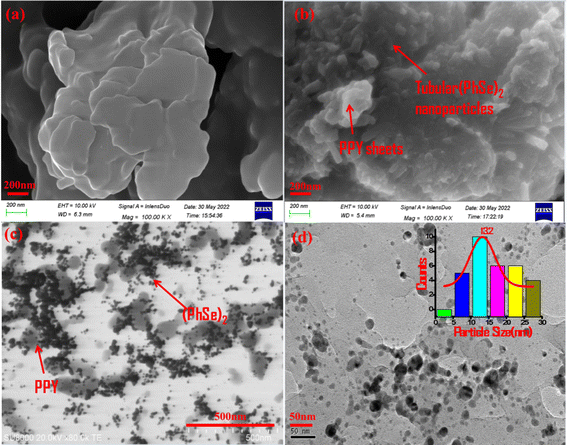 |
| | Fig. 2 SEM images of (a) PPY and (b) (PhSe)2/PPY nanocomposites and (c and d) STEM image of the (PhSe)2/PPY nanocomposite exhibiting evenly distributed (PhSe)2 nanorods in the PPY matrix. The inset of (d) shows the histogram plot for particle size calculation. | |
3.2. Optical properties of the (PhSe)2/PPY nanocomposite
Prior to their utilization as photocatalysts, the UV-visible spectra and Tauc plots of PPY, (PhSe)2, and (PhSe)2/PPY nanocomposite were investigated (Fig. 3(a and b)). (PhSe)2 exhibited two absorption peaks around 244 nm and 327 nm, which were ascribed to the π–π* transition of the aromatic rings and Se (4p)–n–π*(aromatic) transition, respectively.33 The absorption spectrum of PPY exhibits characteristic bands at 282 nm, 337 nm, and 507 nm, which have been ascribed to the π–π* and n–π* transitions. 34,35 In the (PhSe)2/PPY nanocomposite, the bands corresponding to PPY got shifted to 277 nm, 341 nm, and 509 nm, respectively. The observed spectral shifts can be corroborated by the development of N⋯Se non covalent interactions between the PPY matrix and (PhSe)2 dopant nanoparticles. To assess the influence of chalcogen effect on the optical properties of the synthesized materials, energy levels and optical band gaps were calculated. Tauc plots for band gap calculations were obtained using the Kubelka–Munk function F(R) (eqn (4)):| |  | (4) |
where ν is the frequency of light, A is the proportionality constant, F(R) is the Kubelka–Munk function and Eg is the optical band gap energy (eV). The value of n is dependent on the type of optical transition (n = 1 for direct transition and n = 4 for indirect transition).29 The indirect transition (n = 4) has been considered to calculate the band gap of (PhSe)2, PPY, and the (PhSe)2/PPY nanocomposite.
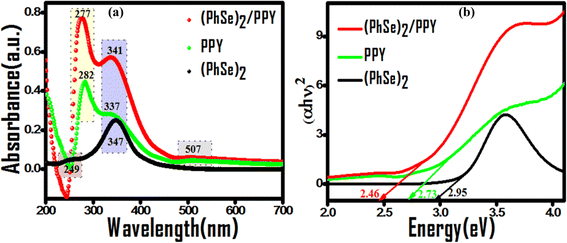 |
| | Fig. 3 Comparative absorption profiles of (PhSe)2, PPY, and (PhSe)2/PPY nanocomposites: (a) peak shifting on nanocomposite formation and (b) corresponding Tauc plots for band gap evaluation. | |
The calculated band gap values of 2.95, 2.73, and 2.46 eV for (PhSe)2, PPY, and (PhSe)2/PPY nanocomposite, respectively, indicate better light harvesting of the nanocomposite over its pristine polymer, enhancing its propensity towards good photocatalytic efficacy and real-time viability.36
In addition to band gap values, other important descriptors of optoelectronic devices such as extinction coefficient (k), absorption coefficient (α), refractive index (n), optical conductivity (σopt), and dielectric constant of (PhSe)2, PPY, and (PhSe)2/PPy nanocomposite were also evaluated. The extinction coefficient (k) and refractive index (n) were calculated by using eqn (5) and (6) (ref. 37 and 38)
| |  | (6) |
where
Ts is the % transmission coefficient.
The optical conductivity was estimated from the relation σopt = αnc/4π, where α is the absorption coefficient, n is the refractive index, σopt denotes the optical conductivity and c is the velocity of light.37 The complex dielectric constant (real and imaginary) was calculated from the refractive index and extinction coefficient using eqn (7) and (8) (ref. 37)
The calculated values of these optical descriptors are summarised in Table 1. Data entries in Table 1 indicate that these parameters exhibit higher values in the UV region for the (PhSe)2/PPY nanocomposite compared to pure components, predicting its potential in designing optical devices. The rise in refractive index value on incorporation of (PhSe)2 in the PPY matrix indicates the possibility of enhanced photon absorption by the nanocomposite. The raised σopt value of the (PhSe)2/PPY nanocomposite suggests improved charge transfer capabilities compared to pristine constituents, which was further corroborated by electrochemical impedance spectroscopy (EIS) studies.
Table 1 Comparative optical descriptors of (PhSe)2, PPY and (PhSe)2/PPY nanocomposites
| Material |
α
|
n
|
k
|
ε
i
|
ε
r
|
σ
opt (s−1) |
| (PhSe)2 |
1.1 × 10⁻⁸ |
1.7 × 10⁻² |
3.0 × 10⁻⁷ |
6.2 × 10⁻⁸ |
2.8 × 10⁻⁴ |
4.0 × 10⁻³ |
| PPY |
1.0 × 10⁻⁷ |
4.3 × 10⁻² |
2.3 × 10⁻⁶ |
9.7 × 10⁻⁸ |
1.7 × 10⁻³ |
1.0 × 10⁻¹ |
| (PhSe)2/PPY |
1.8 × 10⁻⁷ |
9.0 × 10⁻² |
3.9 × 10⁻⁶ |
2.1 × 10⁻⁷ |
8.0 × 10⁻³ |
3.8 × 10⁻¹ |
3.3. Photocatalytic propensity of the (PhSe)2/PPY nanocomposite for persistent contaminants
The photocatalytic propensity of the (PhSe)2/PPY nanocomposite was evaluated towards a series of cationic dyes (MG and RhB), anionic dyes (MB and MO) and antibiotics as modular persistent contaminants. The comparative photocatalytic propensity was evaluated under a set of optimized conditions like photocatalyst amount, contaminant dye concentration, pH of the test sample, lamp power and irradiation time of test solutions. The control experiment without any added photocatalyst was conducted to scrutinize photocatalytic degradation over photosensitization. No significant decomposition of MG dye in the absence of an added photocatalyst up to 120 min of visible light irradiation confirmed photocatalytic degradation over simple photolysis (Fig. S3(c)†). In addition, photodegradation of the colorless isoniazid antibiotic highlights the propensity of the (PhSe)2/PPY nanocomposite towards the degradation of diverse contaminants.
3.3.1. Optimizing the operating conditions of (PhSe)2/PPY nanocomposite photocatalysis.
The operating condition and contaminant concentrations of wastewater samples vary significantly, posing a challenge to their treatment under real time environmentally viable conditions. Customizing operating conditions is highly desirable towards the good efficacy of any photocatalytic process. For this, different concentrations of MG and RhB dyes (ranging from 20 to 50 mg L−1) were chosen to the investigate initial contaminant concentration effect on photocatalytic efficiency with 20 mg of photocatalyst dose at natural pH. As seen from Fig. 4, complete degradation of dyes at their 20 mg L−1 concentration occurs within a short duration of 8 min for MG and 40 min for RhB dye. On increasing the dye concentration to 50 mg L−1, complete degradation of MG dye and 80% degradation of RhB were achieved in 60 min (Table S1†). The observed decrease in photocatalytic activity at higher dye concentrations can be due to poor light penetration effects. Thus, for effective photocatalytic contaminant degradation the pollutant concentration was optimized between 20 mg L−1 and 50 mg L−1 for 20 mg of photocatalyst at neutral pH.
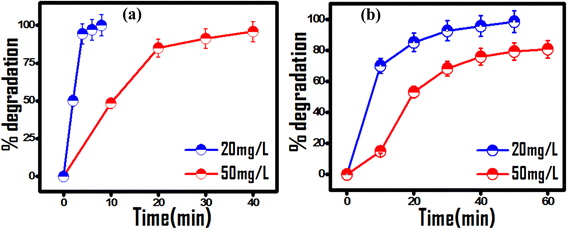 |
| | Fig. 4 Effect of the initial dye concentration on the photocatalytic activity of 20 mg (PhSe)2/PPY photocatalyst under visible light at pH 7: (a) MG and (b) RhB dye. | |
The effect of (PhSe)2/PPY dosage on its photocatalytic propensity towards 20 mg L−1 each of MG and RhB dyes was examined at pH 7. Upon increasing the (PhSe)2/PPY photocatalyst dosage from 5 to 20 mg to the dye sample (100 mL), a significant increase in photodegradation was observed within the same irradiation time. The degradation efficiency increased with the photocatalyst dosage up to 20 mg/100 mL (Fig. S3, S4, S6(a and b) and Table S1†), which can be attributed to the increased number of active sites.39 Beyond the photocatalyst dosage of 20 mg L−1, the photocatalytic activity decreased possibly due to scattering and blocking of light from densely dispersed photocatalyst particles. The pH change of MG dye solution from neutral to acidic condition attenuated the dye degradation activity (Fig. S5†). The effect of pH change was evaluated through zeta potential measurements of the (PhSe)2/PPY nanocomposite. The surface charge got decreased from −19.408 mV to −14.282 mV under neutral to acidic pH change. This indicates partial adsorption of H+ ions over the photocatalyst surface repelling cationic MG and RhB dyes, leading to comparatively poor degradation under acidic conditions.40 In addition, at lower pH, positive holes are the predominant reactive species, which electrostatically repel cationic dye molecules from the photocatalyst, resulting in lowered photocatalytic activity. In contrast, at higher pH, hydroxyl ions interact with holes, resulting in the production of potent hydroxyl radicals for enhanced degradation;41 however, these conditions are unrealistic for environmental remediation. Thus, for our photocatalytic system, operating conditions were optimized at 20 mg L−1 contaminant concentration, 20 mg photocatalyst dosage for 100 mL test sample under neutral pH and 25 °C. The optimized conditions of photocatalytic activity (neutral pH, 25 °C, and 20 mg L−1 contaminant concentration) are realistic and environmentally viable treatment conditions.
3.4. Photocatalytic activity of the (PhSe)2/PPY photocatalyst
The predicted photocatalytic propensity of the (PhSe)2/PPY nanocomposite under optimized conditions was evaluated against MG and RhB as cationic dyes and MB and MO as anionic dyes, and tetracycline (TC) and bisphenol A (BPA) as modular persistent water contaminants. The corresponding dye degradation profiles are presented in Fig. S6.† Due to the structure reactivity response, a varied level of photocatalytic degradation efficiency was observed for selected contaminants. Owing to the negative surface charge cationic dyes were easy to degrade over anionic dyes (MB and MO reached 92.3% and 51.3% degradation post 60 minutes of irradiation). Similarly, 50% and 35% degradation of TC and BPA, respectively, were observed in the selected time. The degradation experiments followed first-order kinetics, and the cationic dyes underwent faster degradation over anionic dyes, suggesting negative surface potential enhanced selectivity towards cationic dyes (Fig. 5(a)). The recyclability of the photocatalyst was evaluated to check its utility for subsequent cycles. After five consecutive cycles, the rate of photocatalytic degradation had a negligible decrease, suggesting the good recyclability of the photocatalyst for real time application (Fig. 5(b)). The photocatalytic degradation of selected contaminants by the (PhSe)2/PPY nanocomposite was compared to that by closely related PPy based composites. It was found that the synthesized (PhSe)2/PPY showed substantive results towards contaminant degradation (Table 2). The cost-effectiveness, simple synthesis and photocatalytic activity under environmentally viable conditions (298 K, pH 7) make (PhSe)2/PPY suitable for wastewater treatment applications towards diverse contaminants.
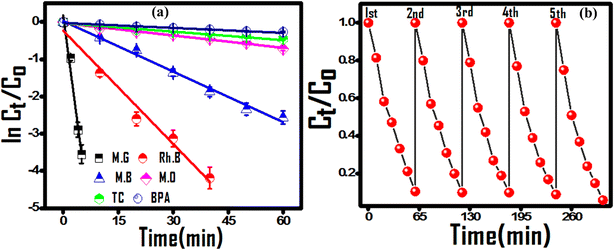 |
| | Fig. 5 (a) Kinetic plots for the degradation of selected contaminants and (b) successive cycles of MG dye degradation for the reusability test. | |
Table 2 Comparison of photodegradation efficacy and first-order rate constants of (PhSe)2/PPY catalyzed reactions with related nanomaterials against selected contaminants
| Materials |
Dyes |
Rate constant k (min−1) |
Degradation (%) |
Irradiation time (min) |
References |
| (PhSe)2/PPY |
MG |
7.40 × 10⁻¹ |
97.1 |
5 |
Present system |
| RhB |
1.04 × 10⁻¹ |
98.5 |
40 |
| MB |
4.49 × 10⁻² |
92.3 |
60 |
| MO |
1.10 × 10⁻² |
51.3 |
60 |
| TC |
0.80 × 10⁻² |
50 |
100 |
| BPA |
0.45 × 10⁻² |
35 |
100 |
| BiOBr-Ag-PPy |
MG |
|
97 |
60 |
42
|
| Composite film of ZnO–Ag nanoparticles/PPY (30%) |
RhB |
2.96 × 10⁻² |
99 |
120 |
14
|
1![[thin space (1/6-em)]](https://www.rsc.org/images/entities/char_2009.gif) : :![[thin space (1/6-em)]](https://www.rsc.org/images/entities/char_2009.gif) 100 PPy/TiO2 100 PPy/TiO2 |
RhB |
|
97 |
480 |
43
|
| Ppy/CdS/rGO |
RhB |
3.62 × 10⁻² |
99 |
180 |
29
|
| PPy/TiO2 |
MB |
|
90 |
90 |
44
|
| 5% Ppy-BiOI composite |
TC |
|
61 |
|
|
| BPA |
|
50 |
300 |
45
|
| RhB |
|
83 |
|
|
| PPy/g-C3N4 |
RhB |
|
74 |
120 |
46
|
| Ppy/Ag (10 wt%) |
MB |
1.50 × 10⁻² |
90 |
180 |
47
|
| PPy/Fe3O4/halloysite nano-clay Ag/Co nanocomposite |
MB |
|
70 |
90 |
48
|
| ZnO/PPy/CNTs (ZPC) |
TC |
|
91 |
240 |
49
|
| Polypyrrole/K-birnessite nanohybrids |
BPA |
2.20 × 10⁻² |
90 |
120 |
50
|
3.5. Photocatalytic interface provided by the (PhSe)2/PPY nanocomposite
The photodegradation efficacy is a function of catalyst surface area, its charge separation and exciton recombination rate. The porous nature and surface area of the nanocomposite were evaluated using BET adsorption isotherms and compared to those of pristine PPy (Fig. 6). The adsorption isotherm exhibits a combined type-II and IV behaviour for both PPY and (PhSe)2/PPY, which is indicative of its mesoporous structure according to IUPAC convention.51 The specific surface area and pore volume of the samples were determined using multipoint BET and NLDFT (Non-Local Density Functional Theory) models and the obtained values are 21.7 m2 g−1 and 50.2 m2 g−1 with a pore volume of 0.08 cm3 g−1 and 0.17 cm3 g−1 for PPY and (PhSe)2/PPY nanocomposite, respectively. This implies that incorporating (PhSe)2 nanoparticles into the PPY matrix enhances its surface area, and porosity. Both PPY and (PhSe)2/PPY possess a mesoporous structure as revealed from pore size distribution plots with diameters in the range of 2–15 nm (inset of Fig. 6). The observed surface attributes of the (PhSe)2/PPY nanocomposite are advantageous for its efficient photocatalytic activity.
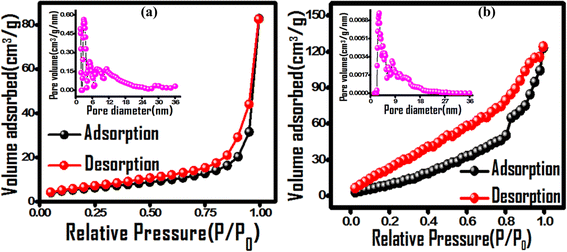 |
| | Fig. 6 Nitrogen adsorption–desorption isotherms of (a) PPY and (b) (PhSe)2/PPy nanocomposites with the insets of corresponding pore size distribution curves. | |
The encapsulation of (PhSe)2 particles in PPY chains via N (lone pair)-Se (vacant d-orbital) and pi–pi stacking interaction enables their compact arrangement for polymer ordering. The PPY chain ordering (Scheme 1) corroborates the observed charge separation, higher thermal stability and can be advantageous towards adsorptive as well as photocatalytic propensity for water treatment application. The polymer ordering configuration besides increasing proximal interface contact between (PhSe)2 particles and PPY chains also increases the mobility of charge carriers along the PPY chains. This hypothesis of charge supra-interaction induced polymer chain ordering was probed by electrochemical impedance spectroscopy (EIS) (Fig. 7). The inset of Fig. 7(a) is the equivalent circuit model obtained using the Z fit method by using EC-LabV10.19 software. The best fitted curves of Nyquist plots consist of solution resistance (R1), charge transfer resistance (R3), double layer capacitance (C3), and Warburg impedance (W3). The diameter of the semicircle portion attained from the parallel combination of a resistor (R3) and a capacitor (C3) gives the charge transfer resistance (Rct) between the electrode and electrolyte, which is an important parameter for assessing and comparing the photocatalytic performance of synthesized materials. The fitted parameters are displayed in Table 3. The smallest arc diameter with a lower Rct value of the (PhSe)2/PPY photocatalyst (Table 3) revealed lower impedance compared to its pristine polypyrrole and (PhSe)2 components, indicating higher charge carrier mobility and good conductivity at the electrode/electrolyte interface (Fig. 7(a)). From EIS results, the higher photocatalytic activity of the (PhSe)2/PPY nanocomposite can be attributed to the lowest recombination rate of electron hole pairs. The predicted results were further confirmed by Bode analysis, photoluminescence (PL) and photocurrent measurements (Fig. 7(b–d)).
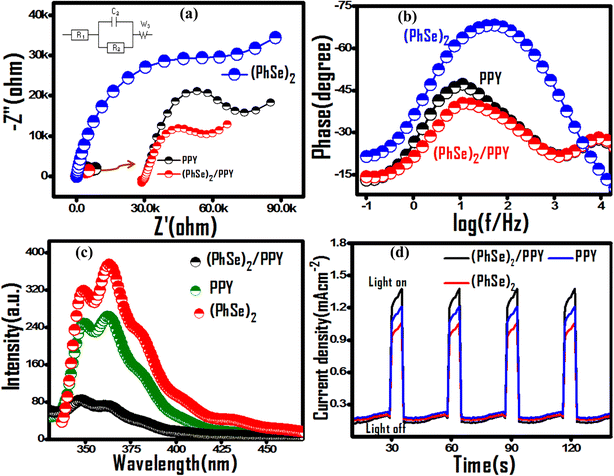 |
| | Fig. 7 Comparative EIS evaluation of pristine PPY, (PhSe)2 and PPY/(PhSe)2 nanocomposite using (a) Nyquist plots, the inset shows the equivalent circuit model used for fitting EIS data, (b) Bode phase curves in the presence of 0.1 M KNO3 electrolyte, (c) PL spectra and (d) transient photocurrent response for PPY, (PhSe)2 and (PhSe)2/PPY nanocomposite. | |
Table 3 EIS parameters of (PhSe)2, PPY and (PhSe)2/PPY calculated using Z – fit analysis and carrier lifetime obtained from Bode phase plots
| Equivalent circuit elements |
Unit |
(PhSe)2 |
PPY |
(PhSe)2/PPY |
|
R
1, solution resistance |
kΩ |
0.43 |
0.28 |
0.25 |
|
R
3, charge transfer resistance |
kΩ |
45.25 |
4.58 |
2.80 |
| Carrier life time τe |
s |
0.003 |
0.013 |
0.016 |
From the Bode phase analysis, the carrier lifetime (τe) of synthesized materials was calculated according to the equation given below.52
The calculated τe values of (PhSe)2, PPY, and (PhSe)2/PPY nanocomposite are summarised in Table 3. The results indicate that the (PhSe)2/PPY nanocomposite displayed a higher carrier lifetime than the pure constituents. This suggests the formation of a heterostructure between (PhSe)2 and PPY that significantly extends the lifetime of charge carriers and consequently attenuates photo corrosion for higher photocatalytic activity. In addition, shifting of the maximum frequency to a lower value upon nanocomposite formation in Bode phase plots (Fig. 7(b)) further confirms the prolonged carrier lifetime of the (PhSe)2/PPY nanocomposite.53
Photoluminescence (PL) measurements were performed to assess the effect of nanocomposite formation upon the recombination rate of the charge carriers. As shown in Fig. 7(c), (PhSe)2 exhibited an emission band at 363 nm, which is related to the π–π* transition of the aromatic ring.54 Post nanocomposite formation with PPY, a significant decrease in luminescence intensity corroborates its lower rate of recombination as compared to its pure components, indicating superior photocatalytic efficacy.
The production and separation of charge carriers was further examined by performing photocurrent experiments under dark and visible light conditions for several ON/OFF cycles as depicted in Fig. 7(d). It is clear from Fig. 7(d) that there is an improvement in photocurrent upon light irradiation and after that, the current reaches back to its dark state when the light source is cut off. The nanocomposite showed higher photocurrent response than the pure constituents, suggesting that the charge carriers are efficiently separated between PPY and (PhSe)2 and hence recombination is greatly inhibited, which is in accordance with EIS and PL results. The plots also indicate that these samples are quite stable against photo-corrosion as the photocurrent response doesn't deteriorate even after four ON–OFF cycles.
3.6. Photocatalytic mechanism of the (PhSe)2/PPY nanocomposite
To identify the predominant reactive species of photocatalytic dye degradation, control experiments in the presence of radical and hole scavengers, tert-butyl alcohol (hydroxyl radical scavenger), 1,4-benzoquinone (superoxide radical scavenger), and ammonium oxalate (hole scavenger), were carried out. 55 A significant decrease in dye degradation activity was observed in the cases of benzoquinone and tert-butyl alcohol additives, indicating the predominance of hydroxyl and superoxide radicals in the degradation mechanism (Fig. 8(a)). The generation and predominance of the superoxide radical was further confirmed spectrophotometrically using superoxide radical selective nitroblue tetrazolium (NBT) assay (Fig. 8(b)). A significant reduction in NBT concentration by the photocatalyst was observed with a rate constant of 0.003 min−1, which substantiates the involvement of superoxide radicals in the photocatalytic process.
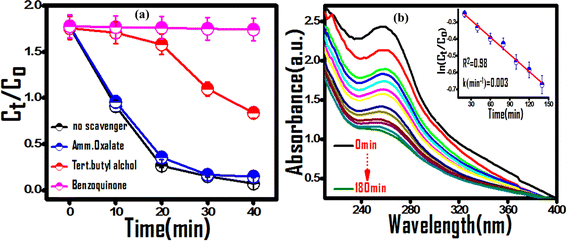 |
| | Fig. 8 (a) Effect of exciton scavengers on the photodegradation of MG dye over the (PhSe)2/PPy nanocomposite. (b) Superoxide radical selective NBT assay confirming the predominant reactive species. | |
Based on the EIS/Mott–Schottky analysis (flat band potentials) and scavenger experiment results the plausible mechanism for the photocatalytic activity can be proposed (Scheme 2). The Z-scheme based plausible mechanism corroborates the experimental observations of efficient charge carrier separation and band potentials capable of generating superoxide and hydroxyl radicals.56 Mott–Schottky calculated flat band potentials revealed the conduction band potentials to be −0.70 eV and −0.53 eV (vs. Ag/AgCl) (Fig. S7†), respectively, corresponding to −0.49 and −0.32 eV vs. NHE, respectively. The valence band potential of PPY and (PhSe)2 was calculated to be 2.24 and 2.63 eV vs. NHE, respectively, according to eqn (10)
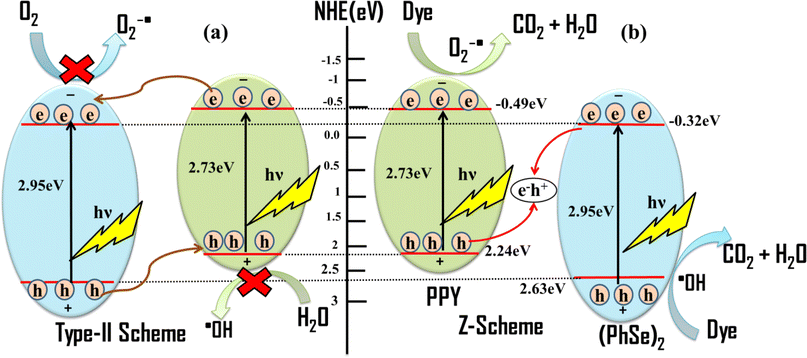 |
| | Scheme 2 The possible mechanisms of photocatalytic activity of the (PhSe)2/PPY photocatalyst: (a) type-II heterojunction system and (b) Z-scheme system. | |
Upon light irradiation of the (PhSe)2/PPY photocatalyst, excitation of both PPY and (PhSe)2 occurs, generating electrons and holes in their corresponding conduction and valence bands. If the type-II heterojunction is considered as the interface between PPY and (PhSe)2, the photogenerated electrons in the conduction band (CB) of PPY will migrate to the conduction band (CB) of (PhSe)2 due to the favourable band potential at their interface (Scheme 2). However, the valence band (VB) potential of (PhSe)2 is 2.63 eV vs. NHE, which, being more positive than that of PPY (VB = 2.24 eV vs. NHE), does not allow holes to migrate from (PhSe)2 to PPY, enabling the separation of charge carriers. However, the observed potential of electrons in the conduction band of (PhSe)2 cannot produce experimentally predominant superoxide radicals. Similarly, the accumulated holes in the valence band (VB) of PPY have inadequate band potential to generate ˙OH (2.38 eV vs. NHE). Thus, the proposed heterojunction based mechanism can account for the effective charge separation but does not explain the formation of ˙O2− and ˙OH as experimentally determined predominant species. The Z-scheme based mechanism of photocatalysis shown in Scheme 2, where the electrons in the conduction band of (PhSe)2 recombine with the holes in the valence band of PPY, can explain the experimental observations.57 The Z-scheme based mechanism facilitates the transfer of photo generated carriers, accounting for their observed charge separation and attenuated recombination rate. In addition, under this mechanism, the observed CB and VB potentials can lead to the production of (O2˙− and OH˙) species, thereby corroborating the experimental results of NBT and TOC analysis of observed mineralization of pollutants to carbon dioxide.58
3.7. Degradation products and potential for mineralization
The total organic carbon (TOC) analysis was carried out to assess the mineralization capability of the (PhSe)2/PPY photocatalyst on MG dye under visible light irradiation (Fig. S8(a)†). The TOC value used to evaluate the mineralisation of the MG dye exhibited a significant decrease with irradiation time, suggesting the mineralisation of the dye to CO2 and H2O.59 The TOC concentrations before and after MG photodegradation showed a 84.9% reduction in TOC over 60 minutes of irradiation time (Table 4), confirming the mineralization performance of the photocatalyst during MG photo degradation.
Table 4 TOC analysis of photocatalytic mineralization of MG dye using (PhSe)2/PPY
| Irradiation time (min) |
TOC value (mg dm−3) |
Mineralization of dye (%) |
| 0 |
12.93 |
0 |
| 30 |
7.03 |
45.62 |
| 60 |
1.94 |
84.99 |
The MG degradation pathway was investigated using UV-visible spectrophotometry over increasing irradiation times (Fig. S8(b)†). A gradual blue shift in absorption maximum wavelength of MG dye was observed with increasing irradiation time, indicating the de-methylation of the MG dye framework.60,61 The corresponding detailed pathway of MG photo-degradation is presented in Scheme S2 (ESI file).† To overrule the dominance of dye-sensitized photocatalysis by the (PhSe)2/PPY nanocomposite, a non-dye, colourless antibiotic compound (Isoniazid) was also subjected to photocatalytic degradation. The large demand and manufacture of isoniazid have led to its accumulation in water bodies, which raises the need for its removal to prevent antibiotic resistance.62 UV-visible investigation revealed that the (PhSe)2/PPY nanocomposite had a significant activity towards degradation of the isoniazid antibiotic, following first-order kinetics, and enabling mineralization up to 65% of isoniazid within 1 h of irradiation (Fig. S9(a and b)†).
4. Conclusion
This work envisages the concept of dopant engineering as a newer approach towards the development of hybrid materials. Consequently, photocatalytic descriptors of symmetric aromatic biphenyl and three of its bis chalcogenide derivatives were evaluated for their utilization as dopants in the development of high performance photocatalysts for wastewater treatment application. The (PhSe)2 was envisaged as a photocatalytic lead derivative from the control experiments of optoelectronic analysis and electron impedance spectroscopy data. (PhSe)2 as a dopant in polypyrrole was conceptualized based on its good photocatalytic parameters among the screened bis chalcogenide systems and additionally due to the chances of its stronger Se⋯N and pi–pi stacking supra-interactions with the pyrrole rings of the polymer. The stabilizing nature of these non-covalent interactions induced an ordering effect and modulated the electronic attributes of the pristine polymer. The heterostructure formation of the (PhSe)2/PPY nanocomposite improved its photocatalytic activity over the pristine polypyrrole as well as the free dopant. The (PhSe)2/PPY nanocomposite photocatalyst was optimized for the degradation of diverse dye classes and also a colorless antibiotic. The photocatalytic efficacy towards persistent contaminants tetracycline and bisphenol A, cationic dyes (due to negative surface charge), and colorless isoniazid antibiotic was optimized under environmentally viable conditions for a real-time application. The photocatalyst stability, recyclability, and active radical species involved in the photocatalytic mechanism were established through the corresponding control experiments. The heterostructure formation and its influence on higher charge mobility and attenuated photo-corrosion were corroborated by Nyquist plots, Bode analysis, photoluminescence (PL), and photocurrent measurements and can be ascribed as a plausible reason for the enhanced photocatalytic activity of the (PhSe)2/PPY nanocomposite. The observed results encourage the practical utilization of the (PhSe)2/PPY nanocomposite as a potent photocatalyst towards degradation of diverse persistent contaminants for real time water treatment application.
Data availability
No primary research results, software or code has been included and no new data were generated or analysed as part of this review.
Author contributions
Tabee Jan: experimentation, data curation, investigation, methodology, and original draft. Shabnam Raheem: methodology, analysis of specified segments editing and review. Masood Ahmad Rizvi: conceptualization/design of the research work, data analysis, project administration, supervision, resources, reviewing/editing. All authors have read and agreed to the final version of the manuscript.
Conflicts of interest
The authors declare that they have no conflict of interest and no competing financial interest.
Acknowledgements
We express our gratitude to the SERB, Government of India, New Delhi, for the provision of resources through DST-SERB SURE Programme (SUR/2022/004046) to support research activity. MAR wishes to thank Professor G. R. Desiraju the Managing Trustee of Crystallography in India Trust for the financial assistance towards restoration of scientific equipment used in this work.
References
- R. Al-Tohamy, S. S. Ali, F. Li, K. M. Okasha, Y. A.-G. Mahmoud, T. Elsamahy, H. Jiao, Y. Fu and J. Sun, Ecotoxicol. Environ. Saf., 2022, 231, 113160 CrossRef CAS PubMed.
- C. M. Friend and B. Xu, Acc. Chem. Res., 2017, 50, 517–521 CrossRef CAS PubMed.
- B. M. Pirzada, Pushpendra, R. K. Kunchala and B. S. Naidu, ACS Omega, 2019, 4, 2618–2629 CrossRef CAS PubMed.
- F. Zhang, Y.-H. Li, J.-Yu. Li, Z.-R. Tang and Y.-J. Xu, Environ. Pollut., 2019, 253, 365–376 CrossRef CAS PubMed.
- L. Zhang, Y. Meng, B. Xie, Z. Ni and S. Xia, Mol. Catal., 2023, 548, 113431 CrossRef CAS.
- F.-K. Shang, Y.-H. Li, M.-Y. Qi, Z.-R. Tang and Y.-J. Xu, Catal. Today, 2023, 410, 85–101 CrossRef CAS.
- W. Tang, H. Ye, Y. Xie, P. Chen, L. Luo and Y. Zhang, Chem. Eng. J., 2023, 478, 147350 CrossRef CAS.
- P. Akhter, S. Nawaz, I. Shafiq, A. Nazir, S. Shafique, F. Jamil, Y.-K. Park and M. Hussain, Mol. Catal., 2023, 535, 112896 CrossRef CAS.
- V. Zorzi, A. Bertini, A. Robertson, A. Berardinelli, L. Palmisano and F. Parrino, Mol. Catal., 2023, 551, 113616 CrossRef CAS.
- Y. Wang, T. Gao, R. Li, Y. Chen, W. Luo, Y. Wu, Y. Xie, Y. Wang and Y. Zhang, Fuel, 2024, 368, 131621 CrossRef CAS.
- R. Li, T. Gao, Y. Wang, Y. Chen, W. Luo, Y. Wu, Y. Xie, Y. Wang and Y. Zhang, Int. J. Hydrogen Energy, 2024, 63, 1116–1127 CrossRef CAS.
- C. Janáky and K. Rajeshwar, Prog. Polym. Sci., 2015, 43, 96–135 CrossRef.
- F. Mohamed, M. R. Abukhadra and M. Shaban, Sci. Total Environ., 2018, 640, 352–363 CrossRef PubMed.
- V. E. Podasca, T. Buruiana and E. C. Buruiana, J. Photochem. Photobiol., A, 2019, 371, 188–195 CrossRef CAS.
- M. Abinaya, R. Rajakumaran, S.-M. Chen, R. Karthik and V. Muthuraj, ACS Appl. Mater. Interfaces, 2019, 11, 38321–38335 CrossRef CAS PubMed.
- N. Chalotra, I. H. Shah, S. Raheem, M. A. Rizvi and B. A. Shah, J. Org. Chem., 2021, 86, 16770–16784 CrossRef CAS PubMed.
- S. Kumar, J. Kumar, T. Naqvi, S. Raheem, M. A. Rizvi and B. A. Shah, ChemPhotoChem, 2022, 6, e202200255 CrossRef.
- M. A. Ganie, M. A. Rizvi, S. Raheem and B. A. Shah, Chem. Commun., 2022, 58, 8508–8511 RSC.
- T. Jan, S. Raheem, S. V. Sawant, T. V. Manolikar, S. S. Sakate, S. K. Pardeshi, R. M. Jagtap and M. A. Rizvi, New J. Chem., 2024, 48, 5040 RSC.
- Z. ul haq, I. Nazir, A. Qureashi, F. A. Ganaie, A. Bashir, K. Fatima, W. A. Shah and M. A. Rizvi, New J. Chem., 2023, 47, 21067 RSC.
- E. R. T. Tiekink, Coord. Chem. Rev., 2021, 443, 214031 CrossRef CAS.
- E. R. T. Tiekink, CrystEngComm, 2023, 25, 9 RSC.
- H. Xiang, N. Deng, H. Zhao, X. Wang, L. Wei, M. Wang, B. Cheng and W. Kang, J. Energy Chem., 2020, 58, 523–556 CrossRef.
- N. Deng, Y. Feng, G. Wang, X. Wang, L. Wang, Q. Li, L. Zhang, W. Kang, B. Cheng and Y. Liu, J. Chem. Eng., 2020, 401, 125976 CrossRef CAS.
- T. Jan, S. K. Moosvi, M. H. Najar, G. M. Peerzada and M. A. Rizvi, J. Mater. Sci.: Mater. Electron., 2022, 33, 8179–8192 CrossRef CAS.
- S. Raheem, Richu, A. Kumar, G. M. Peerzada and M. A. Rizvi, J. Mol. Liq., 2023, 390, 122941 CrossRef CAS.
- O. dos, R. A. Junior, E. Antônio, R. M. Mainardes and N. M. Khalil, J. Trace Elem. Med. Biol., 2017, 39, 176–185 CrossRef PubMed.
- T. Jan, M. A. Rizvi, S. K. Moosvi, M. H. Najar, S. Husain Mir and G. M. Peerzada, ACS Omega, 2021, 6, 7413–7421 CrossRef CAS PubMed.
- N. Ahmad, S. Sultana, S. Sabir and M. Z. Khan, J. Photochem. Photobiol., A, 2020, 386, 112129 CrossRef CAS.
- M. A. Rizvi, S. K. Moosvi, T. Jan, S. Bashir, P. Kumar, W. D. Roos and H. C. Swart, Polymer, 2019, 163, 1–12 CrossRef CAS.
- R. Marsh, Acta Crystallogr., 1952, 5, 458–462 CrossRef CAS.
- D. M. Smilgies, J. Appl. Crystallogr., 2009, 42, 1030–1034 CrossRef CAS PubMed.
- G. T. S. T. da Silva, F. S. Michels, R. G. Silveira, A. R. L. Caires and G. A. Casagrande, J. Mol. Struct., 2019, 1185, 21–26 CrossRef CAS.
- U. Abaci, H. Y. Guney and U. Kadiroglu, Electrochim. Acta, 2013, 96, 214–224 CrossRef CAS.
- J. Hazarika and A. Kumar, Phys. B, 2016, 481, 268–279 CrossRef CAS.
- B. M. Pirzada, O. Mehraj, S. A. Bhat and S. Sabir, J. Environ. Chem. Eng., 2018, 6, 3204–3212 CrossRef CAS.
- R. Gherbi, Y. Bessekhouad and M. Trari, J. Phys. Chem. Solids, 2016, 89, 69–77 CrossRef CAS.
- M. A. Ditta, M. A. Farrukh, S. Ali and N. Younas, Russ. J. Appl. Chem., 2017, 90, 151–159 CrossRef CAS.
- Y. Li, Z. Wang, H. Zhao, X. Huang and M. Yang, J. Colloid Interface Sci., 2019, 557, 709–721 CrossRef CAS PubMed.
- N. Daneshvar, D. Salari and A. R. Khataee, J. Photochem. Photobiol., A, 2003, 157, 111–116 CrossRef CAS.
- S. Khuntia, S. K. Majumder and P. Ghosh, Chem. Eng. Res. Des., 2015, 98, 231–239 CrossRef CAS.
- X. Liu and L. Cai, Appl. Surf. Sci., 2018, 445, 242–254 CrossRef CAS.
- F. Gao, X. Hou, A. Wang, G. Chu, W. Wu, J. Chen and H. Zou, Particuology, 2016, 26, 73–78 CrossRef CAS.
- N. M. Dimitrijevic, S. Tepavcevic, Y. Liu, T. Rajh, S. C. Silver and D. M. Tiede, J. Phys. Chem. C, 2013, 117, 15540–15544 CrossRef CAS.
- J. Xu, Y. Hu, C. Zeng, Y. Zhang and H. Huang, J. Colloid Interface Sci., 2017, 505, 719–727 CrossRef CAS PubMed.
- S. Hu, L. Ma, H. Wang, L. Zhang, Y. Zhao and G. Wu, RSC Adv., 2015, 5, 31947–31953 RSC.
- V. S. Punnakkal, B. Jos and E. I. Anila, Mater. Lett., 2021, 298, 130014 CrossRef CAS.
- M. Rouhi, M. Babamoradi, Z. Hajizadeh and A. M. S. T. Maleki, Optik, 2020, 212, 164721 CrossRef CAS.
- P. Y. Lv, Z. Gong, Z. Ren, Y. Guan, J. Wu and P. K. Lv, ChemistrySelect, 2023, 8, e202204762 CrossRef.
- J. Zia, M. Ajeer and U. Riaz, J. Environ. Sci., 2019, 79, 161–173 CrossRef CAS PubMed.
- M. Thommes, K. Kaneko, A. V. Neimark, J. P. Olivier, F. Rodriguez-Reinoso, J. Rouquerol and K. S. Sing, Pure Appl. Chem., 2015, 87, 1051–1069 CrossRef CAS.
- Y. Wang, W. Tian, L. Chen, F. Cao, J. Guo and L. Li, ACS Appl. Mater. Interfaces, 2017, 9, 40235–40243 CrossRef CAS PubMed.
- J. Mu, H. Miao, E. Liu, J. Feng, F. Teng, D. Zhang, Y. Kou, Y. Jin, J. Fan and X. Hu, Nanoscale, 2018, 10, 11881–11893 RSC.
- S. Raheem, Richu, T. Jan, M. Mustafa, G. M. Peerzada, A. Kumar and M. A. Rizvi, Phys. Chem. Liq., 2023, 61(6), 421–432 CrossRef CAS.
- H.-Y. Ma, L. Zhao, L.-H. Guo, H. Zhang, F.-J. Chen and W.-C. Yu, J. Hazard. Mater., 2019, 369, 719–726 CrossRef CAS PubMed.
- Y. Lin, S. Wu, X. Li, X. Wu, C. Yang, G. Zeng, Y. Peng, Q. Zhou and L. Lu, Appl. Catal., B, 2018, 227, 557–570 CrossRef CAS.
- J. Jia, X. Du, Q. Zhang, E. Liu and J. Fan, Appl. Surf. Sci., 2019, 492, 527–539 CrossRef CAS.
- L. Guo, J. Zhang, X. Zhang, R. Wang, Y. Jia and H. Long, Mol. Catal., 2023, 550, 113603 CrossRef CAS.
- M. A. Rauf, L. Ali, M. S. A. Y. Sadig, S. S. Ashraf and S. Hisaindee, Desalin. Water Treat., 2016, 57, 8336–8342 CrossRef.
- Y. Xie, K. Wu, F. Chen, J. He and J. Zhao, Rev. Chem. Intermed., 2001, 27, 237–248 CrossRef CAS.
- C. C. Chen, C. S. Lu, Y. C. Chung and J. L. Jan, J. Hazard. Mater., 2007, 141, 520–528 CrossRef CAS PubMed.
- K. Nejumal, M. P. Rayaroth, D. Dineep, U. K. Aravind and C. T. Aravindakumar, Mater. Today:
Proc., 2020, 33, 1424–1428 CAS.
|
| This journal is © The Royal Society of Chemistry 2024 |
Click here to see how this site uses Cookies. View our privacy policy here.  Open Access Article
 ,
Shabnam
Raheem
 and
Masood Ahmad
Rizvi
 *
*


![[double bond, length as m-dash]](https://www.rsc.org/images/entities/char_e001.gif) C vibration, aromatic C–H stretching in the plane, aromatic C–H out of plane vibrations, and aromatic C
C vibration, aromatic C–H stretching in the plane, aromatic C–H out of plane vibrations, and aromatic C![[double bond, length as m-dash]](https://www.rsc.org/images/entities/char_e001.gif) C out of plane vibration mode, respectively.27 The FTIR spectrum of PPY was marked by peaks at 1547 and 1471 cm−1, signaling the presence of a pyrrole ring. Furthermore C–N stretching is observed at 1187 cm−1 and the characteristic peak at 3404 cm−1 is assigned to N–H stretching frequency.28–30 The characteristic peaks of PPY and (PhSe)2 with minor shifts observed in the FTIR spectrum of the (PhSe)2/PPY composite confirmed the incorporation of (PhSe)2 in the PPY matrix. The observed FTIR results also suggest restricted modes of vibration in the case of the (PhSe)2/PPY composite as compared to pristine PPY and (PhSe)2. This may be due to the initial adsorption of pyrrole monomer units over (PhSe)2 particles prompted by the N⋯Se type interactions of the pyrrole nitrogen atom and Se atoms, during the composite synthesis. The subsequent polymerization process thus leads to constricted growth, which corroborates spectral shifting and predicts property modulation effects on composite formation. The powder X-ray diffraction (PXRD) analysis was performed for determining the crystallinity and particle size of the synthesized materials. The comparative PXRD patterns of (PhSe)2, PPY, and (PhSe)2/PPY are depicted in Fig. S2.† The amorphous nature of PPY was observed from the absence of any peak. The (PhSe)2/PPY nanocomposite showed a diffraction pattern with well-defined and sharp peaks with low FWHM, indicating the crystalline nature of the composite. The crystalline nature of the nanocomposite was attributed to the presence of orthorhombic (PhSe)2 crystals,31 with the following primitive lattice parameters: a = 23.9988, b = 8.2231, c = 5.6499 and α = β = γ = 90°. The observed results indicate the molecular interaction of (PhSe)2 with PPY chains, modulated via N⋯Se interactions, enabling a more compact configuration of polymer chains than pristine PPY (Scheme 1). This results in an ordered array of PPY chains, which besides increasing the crystallinity also facilitates the flow of charge carriers along the polymer matrix. Scherrer's eqn (3) (ref. 32) was used to calculate the crystallite size utilizing the most prominent diffraction peak centered at 2θ = 14.5° for (PhSe)2 and 2θ = 22.4° for the composite.
C out of plane vibration mode, respectively.27 The FTIR spectrum of PPY was marked by peaks at 1547 and 1471 cm−1, signaling the presence of a pyrrole ring. Furthermore C–N stretching is observed at 1187 cm−1 and the characteristic peak at 3404 cm−1 is assigned to N–H stretching frequency.28–30 The characteristic peaks of PPY and (PhSe)2 with minor shifts observed in the FTIR spectrum of the (PhSe)2/PPY composite confirmed the incorporation of (PhSe)2 in the PPY matrix. The observed FTIR results also suggest restricted modes of vibration in the case of the (PhSe)2/PPY composite as compared to pristine PPY and (PhSe)2. This may be due to the initial adsorption of pyrrole monomer units over (PhSe)2 particles prompted by the N⋯Se type interactions of the pyrrole nitrogen atom and Se atoms, during the composite synthesis. The subsequent polymerization process thus leads to constricted growth, which corroborates spectral shifting and predicts property modulation effects on composite formation. The powder X-ray diffraction (PXRD) analysis was performed for determining the crystallinity and particle size of the synthesized materials. The comparative PXRD patterns of (PhSe)2, PPY, and (PhSe)2/PPY are depicted in Fig. S2.† The amorphous nature of PPY was observed from the absence of any peak. The (PhSe)2/PPY nanocomposite showed a diffraction pattern with well-defined and sharp peaks with low FWHM, indicating the crystalline nature of the composite. The crystalline nature of the nanocomposite was attributed to the presence of orthorhombic (PhSe)2 crystals,31 with the following primitive lattice parameters: a = 23.9988, b = 8.2231, c = 5.6499 and α = β = γ = 90°. The observed results indicate the molecular interaction of (PhSe)2 with PPY chains, modulated via N⋯Se interactions, enabling a more compact configuration of polymer chains than pristine PPY (Scheme 1). This results in an ordered array of PPY chains, which besides increasing the crystallinity also facilitates the flow of charge carriers along the polymer matrix. Scherrer's eqn (3) (ref. 32) was used to calculate the crystallite size utilizing the most prominent diffraction peak centered at 2θ = 14.5° for (PhSe)2 and 2θ = 22.4° for the composite.


![[thin space (1/6-em)]](https://www.rsc.org/images/entities/char_2009.gif) :
:![[thin space (1/6-em)]](https://www.rsc.org/images/entities/char_2009.gif) 100 PPy/TiO2
100 PPy/TiO2


