 Open Access Article
Cellular uptake and viability switching in the properties of lipid coated carbon quantum dots for potential bioimaging and therapeutics†
Sweny
Jain‡
a,
Nidhi
Sahu‡
b,
Dhiraj
Bhatia
 *a and
Pankaj
Yadav
*a
aDepartment of Biological Sciences and Engineering, Indian Institute of Technology Gandhinagar, Palaj, Gujarat 382355, India. E-mail: dhiraj.bhatia@iitgn.ac.in; yadav_pankaj@iitgn.ac.in
bDepartment of Bioengineering and Biotechnology, Birla Institute of Technology, Mesra Ranchi, Jharkhand-835 215, India
First published on 7th August 2024
Abstract
Carbon quantum dots derived from mango leaves exhibited red fluorescence. These negatively charged particles underwent coating with the positively charged lipid molecule N-[1-(2,3-dioleyloxy)propyl]-N,N,N-trimethylammonium chloride (DOTMA). However, the bioconjugate displayed reduced uptake compared to the standalone mQDs in cancer cells (SUM 159A), and increased uptake in case of non-cancerous (RPE-1) cells. Upon in vitro testing, the bioconjugate demonstrated a mitigating effect on the individual toxicity of both DOTMA and mQDs in SUM-159 (cancerous cells). Conversely, it exhibited a proliferative effect on RPE-1 (normal cells).
1. Introduction
Carbon quantum dots (CQDs) are particles that exist in zero dimensions; they are nano-sized semiconductor crystals generally with a size below 10 nanometers.1,2 Quantum dots (QDs) exhibit distinctive optical characteristics, including a narrow emission peak, a broad excitation spectrum, and robust resistance to photobleaching.3 These unique optical properties have drawn considerable attention, especially in the realm of biomedical applications.4,5 They are a type of carbon-based fluorescent nanomaterial. The attributes of CQDs have been harnessed for applications in the field of nanomedicine, specifically in gene therapy, drug delivery, photothermal and radiotherapy, diagnostic techniques, biosensing, the development of fluorescent nanoprobes for bioimaging, and bactericidal activities.6,7 These materials have attracted growing interest in recent years, primarily because of their exceptional qualities, including environment-friendliness, cost-effectiveness, and optical fluorescence along with low toxicity, photostability, biocompatibility, extensive surface area, high electrical conductivity, and abundant surface functional groups.8,9Lipids are pivotal to biological systems, as fundamental structural and functional components of cellular membranes. Predominantly constituting the phospholipid bilayer, these amphipathic molecules create a dynamic, semi-permeable barrier that regulates the selective exchange of ions, nutrients, and signaling molecules between the intracellular and extracellular environments. Lipids, particularly phospholipids, cholesterol, and glycolipids, contribute to membrane fluidity, asymmetry, and membrane protein functionality.10
Beyond structural roles, lipids significantly enhance cellular uptake mechanisms. The fluidic nature of the lipid bilayer, driven by van der Waals forces among the acyl chains of fatty acids, facilitates lateral and transverse diffusion of lipid molecules and associated bioactive compounds across the membrane.11,12 This intrinsic property is harnessed in biomedical applications, wherein lipid-based nanocarriers, such as liposomes and lipid nanoparticles, are employed to encapsulate and deliver therapeutic agents—including small molecule drugs, nucleic acids, and proteins—into cells with high efficiency.13 Lipids enable the encapsulation of hydrophilic molecules within their aqueous core and hydrophobic molecules within the lipid bilayer, thus protecting the cargo from enzymatic degradation and improving its bioavailability. By combining biocompatibility with effective cellular internalization, lipids play an indispensable role in advancing targeted drug delivery systems and enhancing therapeutic outcomes.14,15
Cationic-surface L-SPIOs (superparamagnetic iron oxide nanoparticles) with an average size of 46 nm were found to exhibit enhanced cellular uptake in HeLa, PC-3, and Neuro-2a cells. In vivo imaging in Balb/c mice injected with CT-26 tumor cells loaded with SPIOs allowed for tracking of tumor growth using optical and MR images.16 A study exploring lipid–polymer hybrid nanoparticles composed of PLGA coated with DOTMA and loaded with mRNA-mCherry demonstrated their significantly higher transfection efficiency (80%) compared to chitosan-PLGA NPs (5%) in vitro. Translation of mCherry protein within DCs was evaluated.17 In other research, silica nanoparticles were double coated with PG and DOPC and were compared to uncoated nanoparticles for cellular uptake and adsorption on hybrid bilayer membranes. The lipid-coated nanoparticles showed reduced aggregation, leading to smaller structures compared to uncoated nanoparticles.18 Further, cationic magneto liposomes with iron oxide cores and enveloped in a bilayer containing cationic lipids were studied for toxicity. Higher doses of cationic lipid were found to potentially limit uptake efficiency due to increased electrostatic attraction to the cell membrane.19
In recent times, the drug delivery community has shown significant interest in green synthesis of nanoparticles because they are biocompatible and environmentally friendly. The mango leaf quantum dots have been used in bioimaging and drug delivery while exhibiting low cytotoxicity compared to heavy metal QDs.1,20 In addition, the mango leaf has antioxidant and anti-inflammatory properties which provided added benefits in quantum dots.21 Surface modifying the lipid-coated nanoparticles due to their outstanding biocompatibility, effective permeation enhancement, and scalability allows a broad range of applications. However, the uptake of cationic lipid-coated nanoparticles is influenced by various factors, including the lipid's properties, surface decoration, size, and physicochemical attributes of liposome formulations. These elements collectively impact the potential release of cationic lipids from the nanoparticle and its subsequent movement toward the cell plasma membrane.19,22
In our study, we introduce novel red-emitting carbon dots, mQDs, derived from mango leaves, with an emission wavelength of 670 nm and a size of 10.1 nm. These mQDs were decorated with a small cationic lipid, N-[1-(2,3-dioleyloxy)propyl]-N,N,N-trimethylammonium chloride (DOTMA), forming a bioconjugate, mQDs![[thin space (1/6-em)]](https://www.rsc.org/images/entities/char_2009.gif) :
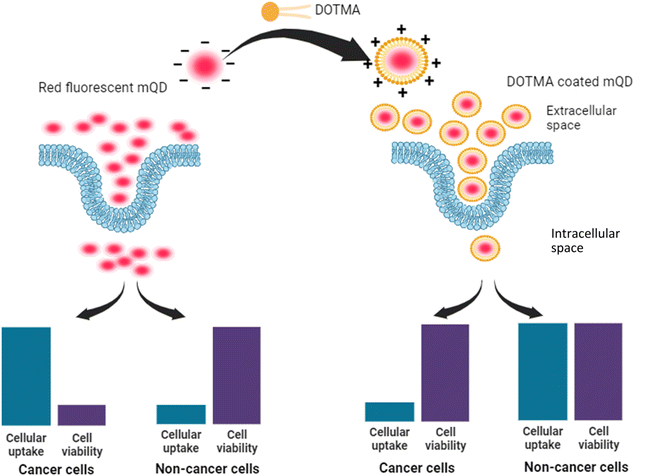
:![[thin space (1/6-em)]](https://www.rsc.org/images/entities/char_2009.gif) DOTMA, which exhibited enhanced fluorescence intensity, photostability, and reduced cytotoxicity compared to standalone mQDs and DOTMA. Our findings highlight the bioconjugate's potential for bioimaging, offering brighter signals and improved biocompatibility for precise cellular imaging in in vitro studies. Cellular internalization assays and viability assessments revealed decreased uptake in cancer (SUM159A) and increased uptake in retinal pigment epithelial (RPE-1) cells, demonstrating the bioconjugate's promising utility in cellular imaging and potential therapeutic applications (Fig. 1).
DOTMA, which exhibited enhanced fluorescence intensity, photostability, and reduced cytotoxicity compared to standalone mQDs and DOTMA. Our findings highlight the bioconjugate's potential for bioimaging, offering brighter signals and improved biocompatibility for precise cellular imaging in in vitro studies. Cellular internalization assays and viability assessments revealed decreased uptake in cancer (SUM159A) and increased uptake in retinal pigment epithelial (RPE-1) cells, demonstrating the bioconjugate's promising utility in cellular imaging and potential therapeutic applications (Fig. 1).
2. Materials and methods
2.1. Materials
Mango leaves were obtained from mango trees at the IIT Gandhinagar campus. Silicon oil was purchased from X-chemicals and ethanol (>99.9%) from Changshu Hongsheng Fine Chemicals Co. Ltd. The filter of 0.22 micrometer was purchased from Merck, and deionized water was obtained from a Merck Millipore system. Cationic lipid N-[1-(2,3-dioleyloxy)propyl]-N,N,N-trimethylammonium chloride (DOTMA) was purchased from Avanti Polar Lipids. Phalloidin was purchased from Sigma Aldrich. The cell culture dishes, dimethyl sulfoxide (DMSO) and rhodamine B were purchased from Himedia. DMEM (Dulbecco's modified Eagle's medium), Ham's F12 media, FBS (fetal bovine serum), and trypsin–EDTA (0.25%) were obtained from Gibco. All the purchased chemicals were of analytical grade and did not need further purification.2.2. Methods
![[thin space (1/6-em)]](https://www.rsc.org/images/entities/char_2009.gif) :
:![[thin space (1/6-em)]](https://www.rsc.org/images/entities/char_2009.gif) 10 (w/v) and kept stirring for 4 hours. This mixture was then centrifuged at 10
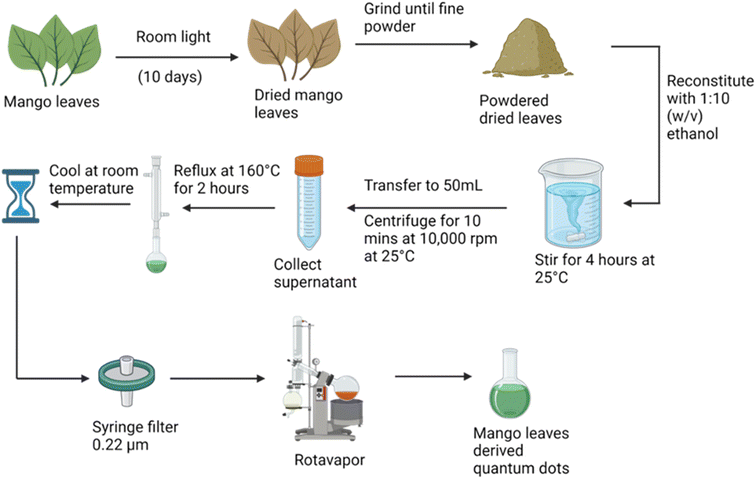
10 (w/v) and kept stirring for 4 hours. This mixture was then centrifuged at 10![[thin space (1/6-em)]](https://www.rsc.org/images/entities/char_2009.gif) 000 rpm for 10 minutes at 25 °C. The supernatant was then refluxed for 2 hours at 160 °C. Once the solution had cooled, mQDs were obtained. Next the solvent was removed using a rotary evaporator. The mQDs were further characterized and functionalised with DOTMA to study their effects in vitro.
000 rpm for 10 minutes at 25 °C. The supernatant was then refluxed for 2 hours at 160 °C. Once the solution had cooled, mQDs were obtained. Next the solvent was removed using a rotary evaporator. The mQDs were further characterized and functionalised with DOTMA to study their effects in vitro.
For AFM sample preparation mica sheets were peeled freshly and 5 μL of samples (1![[thin space (1/6-em)]](https://www.rsc.org/images/entities/char_2009.gif) :
:![[thin space (1/6-em)]](https://www.rsc.org/images/entities/char_2009.gif) 0.25–1
0.25–1![[thin space (1/6-em)]](https://www.rsc.org/images/entities/char_2009.gif) :
:![[thin space (1/6-em)]](https://www.rsc.org/images/entities/char_2009.gif) 10) having a concentration of 100 μg mL−1 were dropped. The sheet containing samples were then placed in a desiccator for drying overnight. Finally, the AFM imaging was done in tapping mode using a Bruker AFM instrument.
10) having a concentration of 100 μg mL−1 were dropped. The sheet containing samples were then placed in a desiccator for drying overnight. Finally, the AFM imaging was done in tapping mode using a Bruker AFM instrument.
FTIR spectra of all the concentrations of mQD![[thin space (1/6-em)]](https://www.rsc.org/images/entities/char_2009.gif) :
:![[thin space (1/6-em)]](https://www.rsc.org/images/entities/char_2009.gif) DOTMA were recorded from 450 cm−1 to 4000 cm−1 using a Spectrum Two spectrometer from PerkinElmer in ATR mode. Further, analysis of the powder was done to obtain the XRD diffraction pattern using a Bruker-D8 Discover with a speed of 0.2 min−1 from 5° to 90°.
DOTMA were recorded from 450 cm−1 to 4000 cm−1 using a Spectrum Two spectrometer from PerkinElmer in ATR mode. Further, analysis of the powder was done to obtain the XRD diffraction pattern using a Bruker-D8 Discover with a speed of 0.2 min−1 from 5° to 90°.
A Malvern Panalytical Zetasizer Nano ZS was utilized to conduct Dynamic Light Scattering (DLS) for the solution-based size characterization of mQDs and mQDs![[thin space (1/6-em)]](https://www.rsc.org/images/entities/char_2009.gif) :
:![[thin space (1/6-em)]](https://www.rsc.org/images/entities/char_2009.gif) DOTMA. Subsequently, the obtained data was plotted using a Gaussian fit in the OriginPro software.
DOTMA. Subsequently, the obtained data was plotted using a Gaussian fit in the OriginPro software.
The photostability of mQDs was analysed by incubating the samples for a duration of 10 days. Fluorescence intensity readings at 670 nm were taken every day following excitation with 400 nm light. The relative fluorescence intensity was plotted by normalizing each fluorescence intensity measurement against the maximum fluorescence intensity recorded.
These mQDs and mQD![[thin space (1/6-em)]](https://www.rsc.org/images/entities/char_2009.gif) :
:![[thin space (1/6-em)]](https://www.rsc.org/images/entities/char_2009.gif) DOTMA conjugates were then dissolved in the serum free media to assess the cellular uptake and cellular uptake of these particles in a breast cancer cell line (SUM-159A) and healthy cells (RPE-1).
DOTMA conjugates were then dissolved in the serum free media to assess the cellular uptake and cellular uptake of these particles in a breast cancer cell line (SUM-159A) and healthy cells (RPE-1).
![[thin space (1/6-em)]](https://www.rsc.org/images/entities/char_2009.gif) :
:![[thin space (1/6-em)]](https://www.rsc.org/images/entities/char_2009.gif) DOTMA to assess their cellular internalization. Different combinations of mQD–DOTMA (mQD
DOTMA to assess their cellular internalization. Different combinations of mQD–DOTMA (mQD![[thin space (1/6-em)]](https://www.rsc.org/images/entities/char_2009.gif) :
:![[thin space (1/6-em)]](https://www.rsc.org/images/entities/char_2009.gif) DOTMA; 1
DOTMA; 1![[thin space (1/6-em)]](https://www.rsc.org/images/entities/char_2009.gif) :
:![[thin space (1/6-em)]](https://www.rsc.org/images/entities/char_2009.gif) 0.25, 1
0.25, 1![[thin space (1/6-em)]](https://www.rsc.org/images/entities/char_2009.gif) :
:![[thin space (1/6-em)]](https://www.rsc.org/images/entities/char_2009.gif) 0.5, 1
0.5, 1![[thin space (1/6-em)]](https://www.rsc.org/images/entities/char_2009.gif) :
:![[thin space (1/6-em)]](https://www.rsc.org/images/entities/char_2009.gif) 1, 1
1, 1![[thin space (1/6-em)]](https://www.rsc.org/images/entities/char_2009.gif) :
:![[thin space (1/6-em)]](https://www.rsc.org/images/entities/char_2009.gif) 2, 1
2, 1![[thin space (1/6-em)]](https://www.rsc.org/images/entities/char_2009.gif) :
:![[thin space (1/6-em)]](https://www.rsc.org/images/entities/char_2009.gif) 5, and 1
5, and 1![[thin space (1/6-em)]](https://www.rsc.org/images/entities/char_2009.gif) :
:![[thin space (1/6-em)]](https://www.rsc.org/images/entities/char_2009.gif) 10) were used for cell treatment. The treated cells were fixed for 15 min at 37 °C with 4% paraformaldehyde and rinsed three times with 1× PBS. The cells were then permeabilized with 0.1% Triton-X100 and stained with 0.1% phalloidin to visualize the actin filaments. Then the cells were washed three times with 1× PBS and mounted onto the slides with Mowiol and DAPI to stain the nucleus.
10) were used for cell treatment. The treated cells were fixed for 15 min at 37 °C with 4% paraformaldehyde and rinsed three times with 1× PBS. The cells were then permeabilized with 0.1% Triton-X100 and stained with 0.1% phalloidin to visualize the actin filaments. Then the cells were washed three times with 1× PBS and mounted onto the slides with Mowiol and DAPI to stain the nucleus.
![[thin space (1/6-em)]](https://www.rsc.org/images/entities/char_2009.gif) :
:![[thin space (1/6-em)]](https://www.rsc.org/images/entities/char_2009.gif) 0.5, 1
0.5, 1![[thin space (1/6-em)]](https://www.rsc.org/images/entities/char_2009.gif) :
:![[thin space (1/6-em)]](https://www.rsc.org/images/entities/char_2009.gif) 1, 1
1, 1![[thin space (1/6-em)]](https://www.rsc.org/images/entities/char_2009.gif) :
:![[thin space (1/6-em)]](https://www.rsc.org/images/entities/char_2009.gif) 2, 1
2, 1![[thin space (1/6-em)]](https://www.rsc.org/images/entities/char_2009.gif) :
:![[thin space (1/6-em)]](https://www.rsc.org/images/entities/char_2009.gif) 5, and 1
5, and 1![[thin space (1/6-em)]](https://www.rsc.org/images/entities/char_2009.gif) :
:![[thin space (1/6-em)]](https://www.rsc.org/images/entities/char_2009.gif) 10) at varied concentrations (100 μg mL−1, 200 μg mL−1, and 300 μg mL−1). Then they were incubated at 37 °C for 24 h. Untreated cells served as a control. After incubation, a 0.5 mg mL−1 3-(4,5-dimethylthiazol-2-yl)-2,5-diphenyltetrazolium bromide (MTT) solution was added to each well and incubated at 37 °C for 4 h. The solution was removed and replaced with dimethyl sulfoxide (DMSO) in each well and incubated in the dark for 15 min to dissolve the formazan crystal. A multiwell microplate reader was used to measure absorbance at 570 nm. The experiment was conducted in triplicate, with normalization to the corresponding well containing DMSO. The untreated mQDs well served as the control to determine the % cell viability of each well. The cell viability percentage was calculated using the following formula:
10) at varied concentrations (100 μg mL−1, 200 μg mL−1, and 300 μg mL−1). Then they were incubated at 37 °C for 24 h. Untreated cells served as a control. After incubation, a 0.5 mg mL−1 3-(4,5-dimethylthiazol-2-yl)-2,5-diphenyltetrazolium bromide (MTT) solution was added to each well and incubated at 37 °C for 4 h. The solution was removed and replaced with dimethyl sulfoxide (DMSO) in each well and incubated in the dark for 15 min to dissolve the formazan crystal. A multiwell microplate reader was used to measure absorbance at 570 nm. The experiment was conducted in triplicate, with normalization to the corresponding well containing DMSO. The untreated mQDs well served as the control to determine the % cell viability of each well. The cell viability percentage was calculated using the following formula:
Cell viability (%) = Absorbance of the sample/Absorbance of the control × 100.
3. Results
3.1. Characterization of mQDs and mQDs![[thin space (1/6-em)]](https://www.rsc.org/images/entities/h3_char_2009.gif) :
:![[thin space (1/6-em)]](https://www.rsc.org/images/entities/h3_char_2009.gif) DOTMA
DOTMA
Red fluorescence carbon quantum dots were obtained using mango leaf powder. Freshly plucked mango leaves were dried in room light. The dried mango leaves were stirred with ethanol in a 1![[thin space (1/6-em)]](https://www.rsc.org/images/entities/char_2009.gif) :
:![[thin space (1/6-em)]](https://www.rsc.org/images/entities/char_2009.gif) 10 (weight/volume) ratio. The supernatant was then refluxed at 160 °C for 2 hours, and then filtered using a 0.22 μm filter. Quantum dots were formed. To obtain their powder a rotavapor was used as illustrated in Fig. 2.
10 (weight/volume) ratio. The supernatant was then refluxed at 160 °C for 2 hours, and then filtered using a 0.22 μm filter. Quantum dots were formed. To obtain their powder a rotavapor was used as illustrated in Fig. 2.
The mQDs thus formed have an inherent negative charge, which prompted us to conjugate it electrostatically with the positively charged small lipid molecule N-[1-(2,3-dioleyloxy)propyl]-N,N,N-trimethylammonium chloride (DOTMA). The mQDs and DOTMA were mixed in the following ratios: 1![[thin space (1/6-em)]](https://www.rsc.org/images/entities/char_2009.gif) :
:![[thin space (1/6-em)]](https://www.rsc.org/images/entities/char_2009.gif) 0.25, 1
0.25, 1![[thin space (1/6-em)]](https://www.rsc.org/images/entities/char_2009.gif) :
:![[thin space (1/6-em)]](https://www.rsc.org/images/entities/char_2009.gif) 0.5, 1
0.5, 1![[thin space (1/6-em)]](https://www.rsc.org/images/entities/char_2009.gif) :
:![[thin space (1/6-em)]](https://www.rsc.org/images/entities/char_2009.gif) 1, 1
1, 1![[thin space (1/6-em)]](https://www.rsc.org/images/entities/char_2009.gif) :
:![[thin space (1/6-em)]](https://www.rsc.org/images/entities/char_2009.gif) 2, 1
2, 1![[thin space (1/6-em)]](https://www.rsc.org/images/entities/char_2009.gif) :
:![[thin space (1/6-em)]](https://www.rsc.org/images/entities/char_2009.gif) 5 and 1
5 and 1![[thin space (1/6-em)]](https://www.rsc.org/images/entities/char_2009.gif) :
:![[thin space (1/6-em)]](https://www.rsc.org/images/entities/char_2009.gif) 10, with water as the solvent. Next, characterization studies were carried out for the mQDs and the bioconjugates.
10, with water as the solvent. Next, characterization studies were carried out for the mQDs and the bioconjugates.
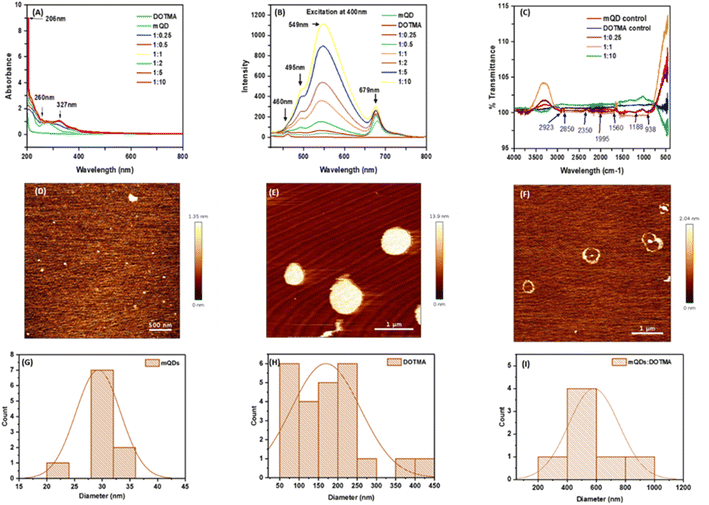
To characterize the quantum dots thus formed the optical properties were analyzed using UV spectra and fluorescence spectra. In UV spectra, for DOTMA there were no peaks observed, whereas peaks were observed in case of mQDs at 206 nm (–OH group) and 260 nm (flavonoids), and the mQD![[thin space (1/6-em)]](https://www.rsc.org/images/entities/char_2009.gif) :
:![[thin space (1/6-em)]](https://www.rsc.org/images/entities/char_2009.gif) DOTMA conjugate displayed both the peaks of mQDs and another peak at 327 nm as shown in Fig. 3(A). Further, for fluorescence spectra the 400 nm wavelength was chosen as it gave the maximum intensity. Fluorescence spectra of DOTMA showed a peak at 460 nm, and both mQDs and the mQD
DOTMA conjugate displayed both the peaks of mQDs and another peak at 327 nm as shown in Fig. 3(A). Further, for fluorescence spectra the 400 nm wavelength was chosen as it gave the maximum intensity. Fluorescence spectra of DOTMA showed a peak at 460 nm, and both mQDs and the mQD![[thin space (1/6-em)]](https://www.rsc.org/images/entities/char_2009.gif) :
:![[thin space (1/6-em)]](https://www.rsc.org/images/entities/char_2009.gif) DOTMA conjugate displayed peaks at 460 nm, 495 nm, 549 nm and 679 nm upon excitation at 400 nm as shown in Fig. 3(B). As the DOTMA concentration increased the fluorescence intensity of the sample increased (Fig. 3(B)). Hence, we observed the presence of DOTMA not only enhanced the fluorescence of mQDs but also increased the photostability of mQDs (ESI Fig. 1†). Next to understand the functional groups present on our quantum dots we performed FTIR, and the spectra show the presence of different functional groups present on the surface of mQDs: 2923 cm−1 for alkanes and acidic groups; 2850 cm−1 for aldehyde, alkanes, and acidic groups; 1560 cm−1 for nitro compounds; 1188 cm−1 for anhydride (acyl), amines, alcohol (alkoxy), and esters; and 938 cm−1 for alkenes (sp2 C–H), as shown in Fig. 3(C).
DOTMA conjugate displayed peaks at 460 nm, 495 nm, 549 nm and 679 nm upon excitation at 400 nm as shown in Fig. 3(B). As the DOTMA concentration increased the fluorescence intensity of the sample increased (Fig. 3(B)). Hence, we observed the presence of DOTMA not only enhanced the fluorescence of mQDs but also increased the photostability of mQDs (ESI Fig. 1†). Next to understand the functional groups present on our quantum dots we performed FTIR, and the spectra show the presence of different functional groups present on the surface of mQDs: 2923 cm−1 for alkanes and acidic groups; 2850 cm−1 for aldehyde, alkanes, and acidic groups; 1560 cm−1 for nitro compounds; 1188 cm−1 for anhydride (acyl), amines, alcohol (alkoxy), and esters; and 938 cm−1 for alkenes (sp2 C–H), as shown in Fig. 3(C).
To analyze the size and morphology of the quantum dots Atomic Force Microscopy (AFM) and Dynamic Light Scattering (DLS) were performed for both mQDs and mQD![[thin space (1/6-em)]](https://www.rsc.org/images/entities/char_2009.gif) :
:![[thin space (1/6-em)]](https://www.rsc.org/images/entities/char_2009.gif) DOTMA conjugates. The quasi-spherical morphology and topography of mQDs and DOTMA were observed with a size of about 30 nm and 179 nm, respectively (Fig. 3(D,E,G and H)). The ring-like structure of the DOTMA coating around the mQD can be observed in case of the conjugate and was about 580 nm (Fig. 3(F) and (I)).
DOTMA conjugates. The quasi-spherical morphology and topography of mQDs and DOTMA were observed with a size of about 30 nm and 179 nm, respectively (Fig. 3(D,E,G and H)). The ring-like structure of the DOTMA coating around the mQD can be observed in case of the conjugate and was about 580 nm (Fig. 3(F) and (I)).
mQDs and DOTMA were mixed in water as a solvent and the following ratios were made: 1![[thin space (1/6-em)]](https://www.rsc.org/images/entities/char_2009.gif) :
:![[thin space (1/6-em)]](https://www.rsc.org/images/entities/char_2009.gif) 0.25, 1
0.25, 1![[thin space (1/6-em)]](https://www.rsc.org/images/entities/char_2009.gif) :
:![[thin space (1/6-em)]](https://www.rsc.org/images/entities/char_2009.gif) 0.5, 1
0.5, 1![[thin space (1/6-em)]](https://www.rsc.org/images/entities/char_2009.gif) :
:![[thin space (1/6-em)]](https://www.rsc.org/images/entities/char_2009.gif) 0.75, 1
0.75, 1![[thin space (1/6-em)]](https://www.rsc.org/images/entities/char_2009.gif) :
:![[thin space (1/6-em)]](https://www.rsc.org/images/entities/char_2009.gif) 1, 1
1, 1![[thin space (1/6-em)]](https://www.rsc.org/images/entities/char_2009.gif) :
:![[thin space (1/6-em)]](https://www.rsc.org/images/entities/char_2009.gif) 2, 1
2, 1![[thin space (1/6-em)]](https://www.rsc.org/images/entities/char_2009.gif) :
:![[thin space (1/6-em)]](https://www.rsc.org/images/entities/char_2009.gif) 5, 1
5, 1![[thin space (1/6-em)]](https://www.rsc.org/images/entities/char_2009.gif) :
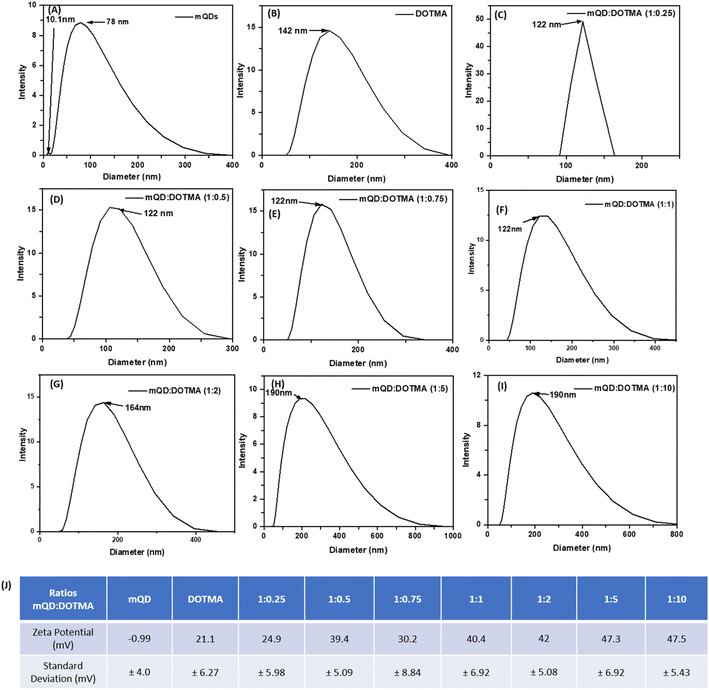
:![[thin space (1/6-em)]](https://www.rsc.org/images/entities/char_2009.gif) 10. The hydrodynamic size and zeta potential were assessed following the conjugation of mQDs with DOTMA as shown in Fig. 4(A–I). The hydrodynamic size of mQDs and DOTMA alone in water as solvent was measured to be 10.1 nm and 142 nm, respectively. The hydrodynamic radius of mQDs
10. The hydrodynamic size and zeta potential were assessed following the conjugation of mQDs with DOTMA as shown in Fig. 4(A–I). The hydrodynamic size of mQDs and DOTMA alone in water as solvent was measured to be 10.1 nm and 142 nm, respectively. The hydrodynamic radius of mQDs![[thin space (1/6-em)]](https://www.rsc.org/images/entities/char_2009.gif) :
:![[thin space (1/6-em)]](https://www.rsc.org/images/entities/char_2009.gif) DOTMA (1
DOTMA (1![[thin space (1/6-em)]](https://www.rsc.org/images/entities/char_2009.gif) :
:![[thin space (1/6-em)]](https://www.rsc.org/images/entities/char_2009.gif) 0.25, 1
0.25, 1![[thin space (1/6-em)]](https://www.rsc.org/images/entities/char_2009.gif) :
:![[thin space (1/6-em)]](https://www.rsc.org/images/entities/char_2009.gif) 0.5, 1
0.5, 1![[thin space (1/6-em)]](https://www.rsc.org/images/entities/char_2009.gif) :
:![[thin space (1/6-em)]](https://www.rsc.org/images/entities/char_2009.gif) 0.75, 1
0.75, 1![[thin space (1/6-em)]](https://www.rsc.org/images/entities/char_2009.gif) :
:![[thin space (1/6-em)]](https://www.rsc.org/images/entities/char_2009.gif) 1, 1
1, 1![[thin space (1/6-em)]](https://www.rsc.org/images/entities/char_2009.gif) :
:![[thin space (1/6-em)]](https://www.rsc.org/images/entities/char_2009.gif) 2, 1
2, 1![[thin space (1/6-em)]](https://www.rsc.org/images/entities/char_2009.gif) :
:![[thin space (1/6-em)]](https://www.rsc.org/images/entities/char_2009.gif) 5, 1
5, 1![[thin space (1/6-em)]](https://www.rsc.org/images/entities/char_2009.gif) :
:![[thin space (1/6-em)]](https://www.rsc.org/images/entities/char_2009.gif) 10) in water was measured to be 122 nm, 122 nm, 122 nm, 122 nm, 164 nm, 190 nm, and 190 nm respectively. The size of the conjugates 1
10) in water was measured to be 122 nm, 122 nm, 122 nm, 122 nm, 164 nm, 190 nm, and 190 nm respectively. The size of the conjugates 1![[thin space (1/6-em)]](https://www.rsc.org/images/entities/char_2009.gif) :
:![[thin space (1/6-em)]](https://www.rsc.org/images/entities/char_2009.gif) 0.25, 1
0.25, 1![[thin space (1/6-em)]](https://www.rsc.org/images/entities/char_2009.gif) :
:![[thin space (1/6-em)]](https://www.rsc.org/images/entities/char_2009.gif) 0.5, 1
0.5, 1![[thin space (1/6-em)]](https://www.rsc.org/images/entities/char_2009.gif) :
:![[thin space (1/6-em)]](https://www.rsc.org/images/entities/char_2009.gif) 0.75 and 1
0.75 and 1![[thin space (1/6-em)]](https://www.rsc.org/images/entities/char_2009.gif) :
:![[thin space (1/6-em)]](https://www.rsc.org/images/entities/char_2009.gif) 1 showed a similar size as the mQD surface is not yet saturated with the lipid layer of DOTMA and the lipid layer/coating is still forming. As the concentration increases further the size of the bioconjugate increases with an increase in concentration of DOTMA as a new lipid layer is formed. A similar trend is observed in 1
1 showed a similar size as the mQD surface is not yet saturated with the lipid layer of DOTMA and the lipid layer/coating is still forming. As the concentration increases further the size of the bioconjugate increases with an increase in concentration of DOTMA as a new lipid layer is formed. A similar trend is observed in 1![[thin space (1/6-em)]](https://www.rsc.org/images/entities/char_2009.gif) :
:![[thin space (1/6-em)]](https://www.rsc.org/images/entities/char_2009.gif) 2, 1
2, 1![[thin space (1/6-em)]](https://www.rsc.org/images/entities/char_2009.gif) :
:![[thin space (1/6-em)]](https://www.rsc.org/images/entities/char_2009.gif) 5 and 1
5 and 1![[thin space (1/6-em)]](https://www.rsc.org/images/entities/char_2009.gif) :
:![[thin space (1/6-em)]](https://www.rsc.org/images/entities/char_2009.gif) 10 ratios where the size of the bioconjugate is approximately 164 nm, 190 nm and 190 nm as the surface gets saturated with DOTMA. Another saturation is observed in ratios 1
10 ratios where the size of the bioconjugate is approximately 164 nm, 190 nm and 190 nm as the surface gets saturated with DOTMA. Another saturation is observed in ratios 1![[thin space (1/6-em)]](https://www.rsc.org/images/entities/char_2009.gif) :
:![[thin space (1/6-em)]](https://www.rsc.org/images/entities/char_2009.gif) 5 and 1
5 and 1![[thin space (1/6-em)]](https://www.rsc.org/images/entities/char_2009.gif) :
:![[thin space (1/6-em)]](https://www.rsc.org/images/entities/char_2009.gif) 10, as even on increasing the concentration to double the amount the hydrodynamic radius remains the same. The zeta potential of our negatively charged mQD molecule is −0.99 mV and that of positively charged DOTMA is 21.1 mV. We can observe an increase in the positive charge in the conjugates as the concentration of DOTMA increases as shown in Fig. 4(J).
10, as even on increasing the concentration to double the amount the hydrodynamic radius remains the same. The zeta potential of our negatively charged mQD molecule is −0.99 mV and that of positively charged DOTMA is 21.1 mV. We can observe an increase in the positive charge in the conjugates as the concentration of DOTMA increases as shown in Fig. 4(J).
3.2. Cytotoxic study of mQDs and mQDs![[thin space (1/6-em)]](https://www.rsc.org/images/entities/h3_char_2009.gif) :
:![[thin space (1/6-em)]](https://www.rsc.org/images/entities/h3_char_2009.gif) DOTMA
DOTMA
To investigate the cell-specific responses to mQDs and mQD![[thin space (1/6-em)]](https://www.rsc.org/images/entities/char_2009.gif) :
:![[thin space (1/6-em)]](https://www.rsc.org/images/entities/char_2009.gif) DOTMA, we conducted 3-[4,5-dimethylthiazol-2-yl]-2,5-diphenyltetrazolium bromide (MTT) assays on RPE1 epithelial cells and SUM159A breast cancer cells. The assay was done with increasing concentrations of mQDs (100, 200, 300 μg mL−1) and 1
DOTMA, we conducted 3-[4,5-dimethylthiazol-2-yl]-2,5-diphenyltetrazolium bromide (MTT) assays on RPE1 epithelial cells and SUM159A breast cancer cells. The assay was done with increasing concentrations of mQDs (100, 200, 300 μg mL−1) and 1![[thin space (1/6-em)]](https://www.rsc.org/images/entities/char_2009.gif) :
:![[thin space (1/6-em)]](https://www.rsc.org/images/entities/char_2009.gif) 0.5, 1
0.5, 1![[thin space (1/6-em)]](https://www.rsc.org/images/entities/char_2009.gif) :
:![[thin space (1/6-em)]](https://www.rsc.org/images/entities/char_2009.gif) 1, 1
1, 1![[thin space (1/6-em)]](https://www.rsc.org/images/entities/char_2009.gif) :
:![[thin space (1/6-em)]](https://www.rsc.org/images/entities/char_2009.gif) 2, 1
2, 1![[thin space (1/6-em)]](https://www.rsc.org/images/entities/char_2009.gif) :
:![[thin space (1/6-em)]](https://www.rsc.org/images/entities/char_2009.gif) 5, and 1
5, and 1![[thin space (1/6-em)]](https://www.rsc.org/images/entities/char_2009.gif) :
:![[thin space (1/6-em)]](https://www.rsc.org/images/entities/char_2009.gif) 10 ratios of mQD
10 ratios of mQD![[thin space (1/6-em)]](https://www.rsc.org/images/entities/char_2009.gif) :
:![[thin space (1/6-em)]](https://www.rsc.org/images/entities/char_2009.gif) DOTMA (100, 200, and 300 μg mL−1) were administered to the cells. After a 24 hour incubation period, we calculated the percentage viability for both the cell types.
DOTMA (100, 200, and 300 μg mL−1) were administered to the cells. After a 24 hour incubation period, we calculated the percentage viability for both the cell types.
The SUM-159A cells with mQDs alone at concentrations of 100, 200, and 300 μg mL−1 showed cell viability of 12%, 16%, and 33% respectively. For SUM-159A cells with DOTMA alone at concentrations of 100, 200, and 300 μg mL−1 the corresponding values were 18%, 8%, and 8% respectively. This established that in SUM-159 cells mQDs alone and DOTMA alone are toxic to the cells and hence the cell viability has decreased significantly. For ratios 1![[thin space (1/6-em)]](https://www.rsc.org/images/entities/char_2009.gif) :
:![[thin space (1/6-em)]](https://www.rsc.org/images/entities/char_2009.gif) 0.5, 1
0.5, 1![[thin space (1/6-em)]](https://www.rsc.org/images/entities/char_2009.gif) :
:![[thin space (1/6-em)]](https://www.rsc.org/images/entities/char_2009.gif) 1, 1
1, 1![[thin space (1/6-em)]](https://www.rsc.org/images/entities/char_2009.gif) :
:![[thin space (1/6-em)]](https://www.rsc.org/images/entities/char_2009.gif) 2, 1
2, 1![[thin space (1/6-em)]](https://www.rsc.org/images/entities/char_2009.gif) :
:![[thin space (1/6-em)]](https://www.rsc.org/images/entities/char_2009.gif) 5 and 1
5 and 1![[thin space (1/6-em)]](https://www.rsc.org/images/entities/char_2009.gif) :
:![[thin space (1/6-em)]](https://www.rsc.org/images/entities/char_2009.gif) 10 concentrations 100, 200 and 300 μg mL−1 were taken. The cell viability for ratio 1
10 concentrations 100, 200 and 300 μg mL−1 were taken. The cell viability for ratio 1![[thin space (1/6-em)]](https://www.rsc.org/images/entities/char_2009.gif) :
:![[thin space (1/6-em)]](https://www.rsc.org/images/entities/char_2009.gif) 0.5 is 38%, 104%, and 104% respectively. The cell viability for ratio 1
0.5 is 38%, 104%, and 104% respectively. The cell viability for ratio 1![[thin space (1/6-em)]](https://www.rsc.org/images/entities/char_2009.gif) :
:![[thin space (1/6-em)]](https://www.rsc.org/images/entities/char_2009.gif) 1 is 64%, 53%, and 68% respectively. The cell viability for 1
1 is 64%, 53%, and 68% respectively. The cell viability for 1![[thin space (1/6-em)]](https://www.rsc.org/images/entities/char_2009.gif) :
:![[thin space (1/6-em)]](https://www.rsc.org/images/entities/char_2009.gif) 2 is 23%, 47%, and 68% respectively. The cell viability for 1
2 is 23%, 47%, and 68% respectively. The cell viability for 1![[thin space (1/6-em)]](https://www.rsc.org/images/entities/char_2009.gif) :
:![[thin space (1/6-em)]](https://www.rsc.org/images/entities/char_2009.gif) 5 is 26%, 30%, and 27% respectively. And for ratio 1
5 is 26%, 30%, and 27% respectively. And for ratio 1![[thin space (1/6-em)]](https://www.rsc.org/images/entities/char_2009.gif) :
:![[thin space (1/6-em)]](https://www.rsc.org/images/entities/char_2009.gif) 10 cell viability is 38%, 22%, and 21% respectively. Hence, we can see that the 1
10 cell viability is 38%, 22%, and 21% respectively. Hence, we can see that the 1![[thin space (1/6-em)]](https://www.rsc.org/images/entities/char_2009.gif) :
:![[thin space (1/6-em)]](https://www.rsc.org/images/entities/char_2009.gif) 0.5 ratio of mQD
0.5 ratio of mQD![[thin space (1/6-em)]](https://www.rsc.org/images/entities/char_2009.gif) :
:![[thin space (1/6-em)]](https://www.rsc.org/images/entities/char_2009.gif) DOTMA at 200 and 300 μg mL−1 concentrations is not toxic to the cell and can be further explored as a potential molecule for bioimaging purposes.
DOTMA at 200 and 300 μg mL−1 concentrations is not toxic to the cell and can be further explored as a potential molecule for bioimaging purposes.
Further with respect to RPE cells, mQDs alone at 100, 200, and 300 μg mL−1 showed cell viability of 71%, 80%, and 60%. For DOTMA alone the cell viability is 33%, 37%, and 42%. These findings suggest that DOTMA when given alone to the cells is toxic. For ratios 1![[thin space (1/6-em)]](https://www.rsc.org/images/entities/char_2009.gif) :
:![[thin space (1/6-em)]](https://www.rsc.org/images/entities/char_2009.gif) 0.5, 1
0.5, 1![[thin space (1/6-em)]](https://www.rsc.org/images/entities/char_2009.gif) :
:![[thin space (1/6-em)]](https://www.rsc.org/images/entities/char_2009.gif) 1, 1
1, 1![[thin space (1/6-em)]](https://www.rsc.org/images/entities/char_2009.gif) :
:![[thin space (1/6-em)]](https://www.rsc.org/images/entities/char_2009.gif) 2, 1
2, 1![[thin space (1/6-em)]](https://www.rsc.org/images/entities/char_2009.gif) :
:![[thin space (1/6-em)]](https://www.rsc.org/images/entities/char_2009.gif) 5 and 1
5 and 1![[thin space (1/6-em)]](https://www.rsc.org/images/entities/char_2009.gif) :
:![[thin space (1/6-em)]](https://www.rsc.org/images/entities/char_2009.gif) 10 concentrations 100, 200 and 300 μg mL−1 were taken. The cell viability for ratio 1
10 concentrations 100, 200 and 300 μg mL−1 were taken. The cell viability for ratio 1![[thin space (1/6-em)]](https://www.rsc.org/images/entities/char_2009.gif) :
:![[thin space (1/6-em)]](https://www.rsc.org/images/entities/char_2009.gif) 0.5 is 150%, 252%, and 292% respectively. The cell viability for ratio 1
0.5 is 150%, 252%, and 292% respectively. The cell viability for ratio 1![[thin space (1/6-em)]](https://www.rsc.org/images/entities/char_2009.gif) :
:![[thin space (1/6-em)]](https://www.rsc.org/images/entities/char_2009.gif) 1 is 226%, 284%, and 370% respectively. The cell viability for 1
1 is 226%, 284%, and 370% respectively. The cell viability for 1![[thin space (1/6-em)]](https://www.rsc.org/images/entities/char_2009.gif) :
:![[thin space (1/6-em)]](https://www.rsc.org/images/entities/char_2009.gif) 2 is 227%, 315%, and 353% respectively. The cell viability for 1
2 is 227%, 315%, and 353% respectively. The cell viability for 1![[thin space (1/6-em)]](https://www.rsc.org/images/entities/char_2009.gif) :
:![[thin space (1/6-em)]](https://www.rsc.org/images/entities/char_2009.gif) 5 is 83%, 111%, and 164% respectively. And for ratio 1
5 is 83%, 111%, and 164% respectively. And for ratio 1![[thin space (1/6-em)]](https://www.rsc.org/images/entities/char_2009.gif) :
:![[thin space (1/6-em)]](https://www.rsc.org/images/entities/char_2009.gif) 10 cell viability is 123%, 139%, and 92% respectively. We can see that when mQDs are conjugated with DOTMA they quench the cytotoxic effect and further lead to cell proliferation as seen in Fig. 5.
10 cell viability is 123%, 139%, and 92% respectively. We can see that when mQDs are conjugated with DOTMA they quench the cytotoxic effect and further lead to cell proliferation as seen in Fig. 5.
3.3. Cellular uptake of mQDs and mQDs![[thin space (1/6-em)]](https://www.rsc.org/images/entities/h3_char_2009.gif) :
:![[thin space (1/6-em)]](https://www.rsc.org/images/entities/h3_char_2009.gif) DOTMA
DOTMA
After characterization, these mQDs and mQD![[thin space (1/6-em)]](https://www.rsc.org/images/entities/char_2009.gif) :
:![[thin space (1/6-em)]](https://www.rsc.org/images/entities/char_2009.gif) DOTMA conjugates were employed to examine their impact on cell lines. Their effects were assessed on SUM-159A cancerous cells, considering previous reports indicating the anti-cancer properties of mQDs. Fluorescence signals emitted by mQDs, alongside standard markers like DAPI (for the nucleus), aided in visualizing cellular morphology and physiology. Based on the toxicity studies, two experiments were designed to validate our results. Two types of cells were taken for the study, namely cancer cells (SUM159A) and non-cancerous epithelial cells (RPE-1). The cells were seeded and later treated with mQDs and mQDs
DOTMA conjugates were employed to examine their impact on cell lines. Their effects were assessed on SUM-159A cancerous cells, considering previous reports indicating the anti-cancer properties of mQDs. Fluorescence signals emitted by mQDs, alongside standard markers like DAPI (for the nucleus), aided in visualizing cellular morphology and physiology. Based on the toxicity studies, two experiments were designed to validate our results. Two types of cells were taken for the study, namely cancer cells (SUM159A) and non-cancerous epithelial cells (RPE-1). The cells were seeded and later treated with mQDs and mQDs![[thin space (1/6-em)]](https://www.rsc.org/images/entities/char_2009.gif) :
:![[thin space (1/6-em)]](https://www.rsc.org/images/entities/char_2009.gif) DOTMA to observe the effect.
DOTMA to observe the effect.
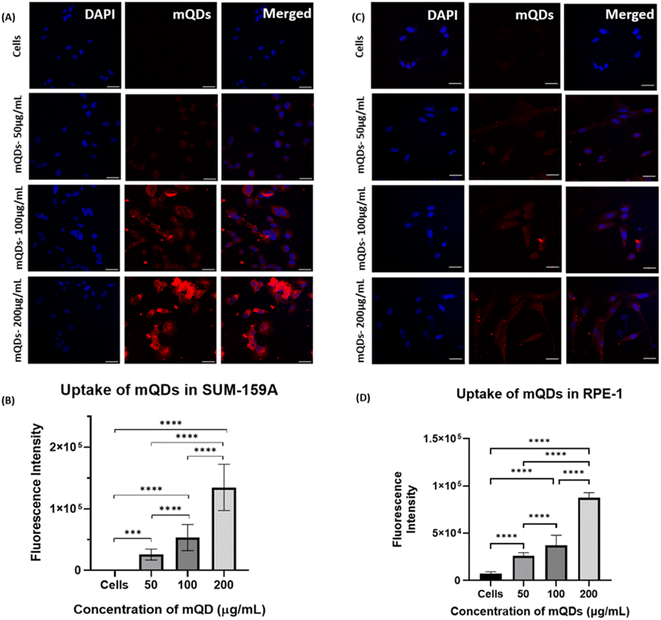
In the case of both cancer cells and epithelial cells, there was an increase in uptake at concentrations of 100 and 200 μg mL−1 of mQDs compared to 50 μg mL−1 and control. Thus, the cellular uptake studies were performed with 100 μg mL−1 and 200 μg mL−1 concentrations as shown in Fig. 6.
Further uptake studies for mQD![[thin space (1/6-em)]](https://www.rsc.org/images/entities/char_2009.gif) :
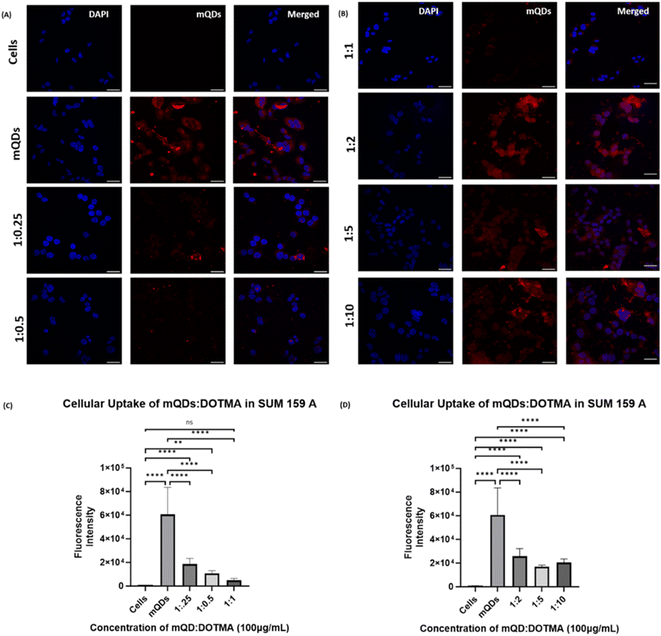
:![[thin space (1/6-em)]](https://www.rsc.org/images/entities/char_2009.gif) DOTMA conjugates were done both in SUM-159 and RPE-1 cells using concentrations of 100 μg mL−1 and 200 μg mL−1. The uptake of bioconjugates as compared to mQDs when provided alone was less in both the cell lines. This could be due to the highly positive charge on the conjugates and the increase in size, which might lead to a decrease in the uptake. Upon comparing the ratios in SUM-159A cancerous cells, we can observe that in case of 100 μg mL−1 concentration, a 1
DOTMA conjugates were done both in SUM-159 and RPE-1 cells using concentrations of 100 μg mL−1 and 200 μg mL−1. The uptake of bioconjugates as compared to mQDs when provided alone was less in both the cell lines. This could be due to the highly positive charge on the conjugates and the increase in size, which might lead to a decrease in the uptake. Upon comparing the ratios in SUM-159A cancerous cells, we can observe that in case of 100 μg mL−1 concentration, a 1![[thin space (1/6-em)]](https://www.rsc.org/images/entities/char_2009.gif) :
:![[thin space (1/6-em)]](https://www.rsc.org/images/entities/char_2009.gif) 2 ratio has relatively higher uptake as compared to others as shown in Fig. 7. A similar trend was observed in case of 200 μg mL−1 where the mQD
2 ratio has relatively higher uptake as compared to others as shown in Fig. 7. A similar trend was observed in case of 200 μg mL−1 where the mQD![[thin space (1/6-em)]](https://www.rsc.org/images/entities/char_2009.gif) :
:![[thin space (1/6-em)]](https://www.rsc.org/images/entities/char_2009.gif) DOTMA bioconjugate's fluorescence intensity was lower indicating lower uptake of the molecule in the cytoplasm as shown in ESI Fig. S2.† Comparing the ratios, we found comparably higher uptake of both 1
DOTMA bioconjugate's fluorescence intensity was lower indicating lower uptake of the molecule in the cytoplasm as shown in ESI Fig. S2.† Comparing the ratios, we found comparably higher uptake of both 1![[thin space (1/6-em)]](https://www.rsc.org/images/entities/char_2009.gif) :
:![[thin space (1/6-em)]](https://www.rsc.org/images/entities/char_2009.gif) 2 and 1
2 and 1![[thin space (1/6-em)]](https://www.rsc.org/images/entities/char_2009.gif) :
:![[thin space (1/6-em)]](https://www.rsc.org/images/entities/char_2009.gif) 10 ratios.
10 ratios.
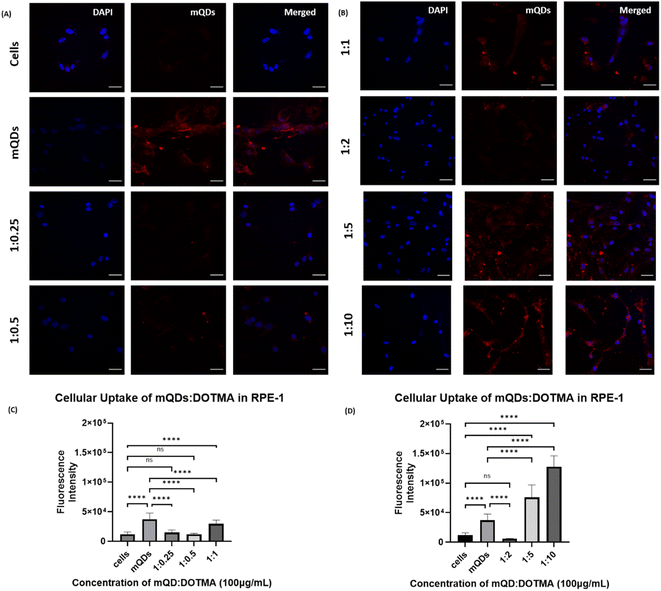
In the case of non-cancerous epithelial cells RPE-1, the uptake of the mQD![[thin space (1/6-em)]](https://www.rsc.org/images/entities/char_2009.gif) :
:![[thin space (1/6-em)]](https://www.rsc.org/images/entities/char_2009.gif) DOTMA conjugate is relatively lower than only mQDs which can be due to the increase in size and positive charge on the bioconjugate. When the cells are treated with 100 μg mL−1 concentration of mQD
DOTMA conjugate is relatively lower than only mQDs which can be due to the increase in size and positive charge on the bioconjugate. When the cells are treated with 100 μg mL−1 concentration of mQD![[thin space (1/6-em)]](https://www.rsc.org/images/entities/char_2009.gif) :
:![[thin space (1/6-em)]](https://www.rsc.org/images/entities/char_2009.gif) DOTMA, there was an increase in fluorescence intensity in 1
DOTMA, there was an increase in fluorescence intensity in 1![[thin space (1/6-em)]](https://www.rsc.org/images/entities/char_2009.gif) :
:![[thin space (1/6-em)]](https://www.rsc.org/images/entities/char_2009.gif) 5 and 1
5 and 1![[thin space (1/6-em)]](https://www.rsc.org/images/entities/char_2009.gif) :
:![[thin space (1/6-em)]](https://www.rsc.org/images/entities/char_2009.gif) 10 which indicates an increase in cellular uptake as shown in Fig. 8. And when the cells were treated with 200 μg mL−1 concentration of mQD
10 which indicates an increase in cellular uptake as shown in Fig. 8. And when the cells were treated with 200 μg mL−1 concentration of mQD![[thin space (1/6-em)]](https://www.rsc.org/images/entities/char_2009.gif) :
:![[thin space (1/6-em)]](https://www.rsc.org/images/entities/char_2009.gif) DOTMA, similar results were obtained (ESI Fig. S3†).
DOTMA, similar results were obtained (ESI Fig. S3†).
4. Conclusions and discussion
In this study, we have successfully synthesized red-emitting carbon quantum dots (mQDs) via a green synthesis approach, offering a sustainable and environmentally friendly method for producing versatile fluorescent probes (Fig. 2). These negatively charged mQDs were subsequently conjugated with a small cationic lipid molecule, DOTMA, through electrostatic interaction, resulting in the formation of bioconjugates with various mQD![[thin space (1/6-em)]](https://www.rsc.org/images/entities/char_2009.gif) :
:![[thin space (1/6-em)]](https://www.rsc.org/images/entities/char_2009.gif) DOTMA ratios – 1
DOTMA ratios – 1![[thin space (1/6-em)]](https://www.rsc.org/images/entities/char_2009.gif) :
:![[thin space (1/6-em)]](https://www.rsc.org/images/entities/char_2009.gif) 0.25, 1
0.25, 1![[thin space (1/6-em)]](https://www.rsc.org/images/entities/char_2009.gif) :
:![[thin space (1/6-em)]](https://www.rsc.org/images/entities/char_2009.gif) 0.5, 1
0.5, 1![[thin space (1/6-em)]](https://www.rsc.org/images/entities/char_2009.gif) :
:![[thin space (1/6-em)]](https://www.rsc.org/images/entities/char_2009.gif) 0.75, 1
0.75, 1![[thin space (1/6-em)]](https://www.rsc.org/images/entities/char_2009.gif) :
:![[thin space (1/6-em)]](https://www.rsc.org/images/entities/char_2009.gif) 1, 1
1, 1![[thin space (1/6-em)]](https://www.rsc.org/images/entities/char_2009.gif) :
:![[thin space (1/6-em)]](https://www.rsc.org/images/entities/char_2009.gif) 2, 1
2, 1![[thin space (1/6-em)]](https://www.rsc.org/images/entities/char_2009.gif) :
:![[thin space (1/6-em)]](https://www.rsc.org/images/entities/char_2009.gif) 5, 1
5, 1![[thin space (1/6-em)]](https://www.rsc.org/images/entities/char_2009.gif) :
:![[thin space (1/6-em)]](https://www.rsc.org/images/entities/char_2009.gif) 10. Later, characterization analyses were carried out to confirm the conjugation and understand the properties of the biconjugate, including dynamic light scattering for size and zeta potential, UV-Vis spectroscopy, FTIR, fluorescence spectroscopy, and atomic force microscopy (AFM), which revealed the conjugation of mQDs with DOTMA (Fig. 3 and 4). The biconjugate thus formed showed a significant increase in fluorescence intensity and photostability compared to standalone mQDs (Fig. 3B and ESI Fig. 1†). The AFM images also confirmed the successful conjugation of DOTMA with mQDs, showing distinct morphology changes, such as ring-like formation, consistent with the formation of the bioconjugate (Fig. 3F).
10. Later, characterization analyses were carried out to confirm the conjugation and understand the properties of the biconjugate, including dynamic light scattering for size and zeta potential, UV-Vis spectroscopy, FTIR, fluorescence spectroscopy, and atomic force microscopy (AFM), which revealed the conjugation of mQDs with DOTMA (Fig. 3 and 4). The biconjugate thus formed showed a significant increase in fluorescence intensity and photostability compared to standalone mQDs (Fig. 3B and ESI Fig. 1†). The AFM images also confirmed the successful conjugation of DOTMA with mQDs, showing distinct morphology changes, such as ring-like formation, consistent with the formation of the bioconjugate (Fig. 3F).
Next, we studied the effect of this biconjugate in vitro in cancerous cells (SUM-159A) and epithelial cells (RPE-1). Interestingly, our cellular uptake studies using fluorescence microscopy demonstrated that the uptake of the mQDs![[thin space (1/6-em)]](https://www.rsc.org/images/entities/char_2009.gif) :
:![[thin space (1/6-em)]](https://www.rsc.org/images/entities/char_2009.gif) DOTMA bioconjugate in SUM-159 (cancerous cells) was lower than that of mQDs alone (Fig. 7 and ESI Fig. S2†). This reduced uptake can be attributed to the increased size and zeta potential of the bioconjugates, which may hinder their cellular internalization23 (Fig. 9). However, mQD
DOTMA bioconjugate in SUM-159 (cancerous cells) was lower than that of mQDs alone (Fig. 7 and ESI Fig. S2†). This reduced uptake can be attributed to the increased size and zeta potential of the bioconjugates, which may hinder their cellular internalization23 (Fig. 9). However, mQD![[thin space (1/6-em)]](https://www.rsc.org/images/entities/char_2009.gif) :
:![[thin space (1/6-em)]](https://www.rsc.org/images/entities/char_2009.gif) DOTMA bioconjugates with specific ratios showed higher uptake in RPE-1 cells, suggesting a potential dose-dependent effect on cellular internalization. Upon comparing different ratios of mQD
DOTMA bioconjugates with specific ratios showed higher uptake in RPE-1 cells, suggesting a potential dose-dependent effect on cellular internalization. Upon comparing different ratios of mQD![[thin space (1/6-em)]](https://www.rsc.org/images/entities/char_2009.gif) :
:![[thin space (1/6-em)]](https://www.rsc.org/images/entities/char_2009.gif) DOTMA, we found that in SUM-159A, the 1
DOTMA, we found that in SUM-159A, the 1![[thin space (1/6-em)]](https://www.rsc.org/images/entities/char_2009.gif) :
:![[thin space (1/6-em)]](https://www.rsc.org/images/entities/char_2009.gif) 2 and 1
2 and 1![[thin space (1/6-em)]](https://www.rsc.org/images/entities/char_2009.gif) :
:![[thin space (1/6-em)]](https://www.rsc.org/images/entities/char_2009.gif) 10 ratios exhibited relatively higher uptake compared to others at both the concentrations of 100 and 200 μg mL−1, as depicted in Fig. 7. Similarly, for RPE-1 the fluorescence intensity of the mQD
10 ratios exhibited relatively higher uptake compared to others at both the concentrations of 100 and 200 μg mL−1, as depicted in Fig. 7. Similarly, for RPE-1 the fluorescence intensity of the mQD![[thin space (1/6-em)]](https://www.rsc.org/images/entities/char_2009.gif) :
:![[thin space (1/6-em)]](https://www.rsc.org/images/entities/char_2009.gif) DOTMA conjugates of ratios 1
DOTMA conjugates of ratios 1![[thin space (1/6-em)]](https://www.rsc.org/images/entities/char_2009.gif) :
:![[thin space (1/6-em)]](https://www.rsc.org/images/entities/char_2009.gif) 5 and 1
5 and 1![[thin space (1/6-em)]](https://www.rsc.org/images/entities/char_2009.gif) :
:![[thin space (1/6-em)]](https://www.rsc.org/images/entities/char_2009.gif) 10 is higher than that of mQDs at both the concentrations of 100 and 200 μg mL−1, indicating increased cytoplasmic uptake, as illustrated in Fig. 8 and ESI Fig. S2.†
10 is higher than that of mQDs at both the concentrations of 100 and 200 μg mL−1, indicating increased cytoplasmic uptake, as illustrated in Fig. 8 and ESI Fig. S2.†
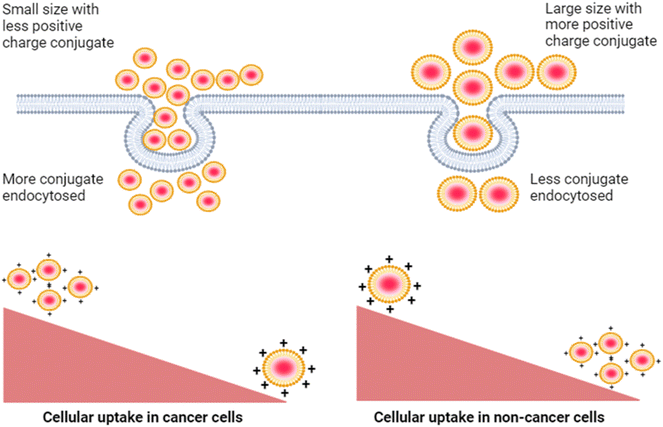 | ||
| Fig. 9 Decreased cellular uptake of the mQD–DOTMA bioconjugate in cancer cells as compared to non-cancer cells due to increased size and zeta potential of the bioconjugate. | ||
Furthermore, cytotoxicity assays revealed that while both mQDs and DOTMA alone exhibited toxicity across all tested concentrations (100, 200, and 300 μg mL−1) in SUM-159A and RPE-1 cells,24 some ratios of the mQD![[thin space (1/6-em)]](https://www.rsc.org/images/entities/char_2009.gif) :
:![[thin space (1/6-em)]](https://www.rsc.org/images/entities/char_2009.gif) DOTMA bioconjugate showed quenching of cytotoxicity of individual molecules and maintained high cell viability. In SUM-159A 1
DOTMA bioconjugate showed quenching of cytotoxicity of individual molecules and maintained high cell viability. In SUM-159A 1![[thin space (1/6-em)]](https://www.rsc.org/images/entities/char_2009.gif) :
:![[thin space (1/6-em)]](https://www.rsc.org/images/entities/char_2009.gif) 0.5 at concentrations of 200 and 300 μg mL−1 showed cell viability of 104% and 104% respectively. In RPE cells these bioconjugates have increased the cell viability. The maximum cell viability was observed in 1
0.5 at concentrations of 200 and 300 μg mL−1 showed cell viability of 104% and 104% respectively. In RPE cells these bioconjugates have increased the cell viability. The maximum cell viability was observed in 1![[thin space (1/6-em)]](https://www.rsc.org/images/entities/char_2009.gif) :
:![[thin space (1/6-em)]](https://www.rsc.org/images/entities/char_2009.gif) 2 at 100 μg mL−1 (cell viability 227%), 1
2 at 100 μg mL−1 (cell viability 227%), 1![[thin space (1/6-em)]](https://www.rsc.org/images/entities/char_2009.gif) :
:![[thin space (1/6-em)]](https://www.rsc.org/images/entities/char_2009.gif) 2 at 200 μg mL−1 (cell viability 315%) and 1
2 at 200 μg mL−1 (cell viability 315%) and 1![[thin space (1/6-em)]](https://www.rsc.org/images/entities/char_2009.gif) :
:![[thin space (1/6-em)]](https://www.rsc.org/images/entities/char_2009.gif) 1 at 300 μg mL−1 (cell viability 370%). This indicates the potential of these bioconjugates to mitigate cytotoxic effects which can be further explored in bioimaging and potential therapeutics (Fig. 5).
1 at 300 μg mL−1 (cell viability 370%). This indicates the potential of these bioconjugates to mitigate cytotoxic effects which can be further explored in bioimaging and potential therapeutics (Fig. 5).
The versatility of mQD![[thin space (1/6-em)]](https://www.rsc.org/images/entities/char_2009.gif) :
:![[thin space (1/6-em)]](https://www.rsc.org/images/entities/char_2009.gif) DOTMA bioconjugates opens up numerous possibilities for biomedical applications, including targeted drug delivery, cellular imaging, and therapeutics. The enhanced fluorescence intensity and photostability make them ideal candidates for sensitive and prolonged imaging of cellular processes. Furthermore, the ability to modulate cytotoxicity through ratio optimization underscores their potential as safe and effective drug delivery systems.
DOTMA bioconjugates opens up numerous possibilities for biomedical applications, including targeted drug delivery, cellular imaging, and therapeutics. The enhanced fluorescence intensity and photostability make them ideal candidates for sensitive and prolonged imaging of cellular processes. Furthermore, the ability to modulate cytotoxicity through ratio optimization underscores their potential as safe and effective drug delivery systems.
In conclusion, the mQD![[thin space (1/6-em)]](https://www.rsc.org/images/entities/char_2009.gif) :
:![[thin space (1/6-em)]](https://www.rsc.org/images/entities/char_2009.gif) DOTMA bioconjugates represent a promising platform for a wide range of biomedical applications, offering enhanced fluorescence properties, tunable cytotoxicity, and potential therapeutic benefits. Future studies should focus on further optimizing the bioconjugate ratios, investigating their efficacy in vivo, and exploring additional characterization techniques to fully realize their translational potential in biomedical research and clinical practice. This shows that the bioconjugate is not toxic and can be used in therapeutics.
DOTMA bioconjugates represent a promising platform for a wide range of biomedical applications, offering enhanced fluorescence properties, tunable cytotoxicity, and potential therapeutic benefits. Future studies should focus on further optimizing the bioconjugate ratios, investigating their efficacy in vivo, and exploring additional characterization techniques to fully realize their translational potential in biomedical research and clinical practice. This shows that the bioconjugate is not toxic and can be used in therapeutics.
Data availability
The data is available on request from the authors.Author contributions
DB and PY conceptualized the idea. Sweny and Nidhi conducted the cellular uptake study, cell viability assay, data analysis, data plotting and manuscript writing. PY helped in mQD synthesis, conjugation, confocal microscopy, UV-Vis and fluorescence spectroscopy, DLS and AFM analysis.Conflicts of interest
There are no conflicts to declare.Acknowledgements
The authors sincerely thank all the members of the D. B. group for critically reading the manuscript and for their valuable feedback. P. Y. thanks IITGN-MHRD, GoI, for the PhD fellowship; P. Y. acknowledges the Director's fellowship from IITGN for additional fellowship. D. B. thanks SERB, GoI for the Ramanujan Fellowship, DST-Nidhi Prayas for the start-up grant, and Gujcost-DST, GSBTM, BRNS-BARC, and HEFA-GoI, MoES for STARS for research grants. D. B. is a member of the Indian National Young Academy of Sciences (INYAS). CIF at IIT Gandhinagar for confocal and AFM facility, Prof. Chinmay Ghoroi and the CRTDH lab in the Chemical Engineering department at IITGN for fluorescence studies, and the DLS and FTIR facility in the Materials Science department at IITGN are acknowledged.References
- M. Kumar, V. Saurabh, M. Tomar, M. Hasan, S. Changan and M. Sasi, et al., Mango (Mangifera indica L.) Leaves: Nutritional Composition, Phytochemical Profile, and Health-Promoting Bioactivities, Antioxidants, 2021, 10(2), 299 CrossRef CAS PubMed.
- P. Yadav, D. Benner, R. Varshney, K. Kansara, K. Shah and L. Dahle, et al., Dopamine-Functionalized, Red Carbon Quantum Dots for In Vivo Bioimaging, Cancer Therapeutics, and Neuronal Differentiation, ACS Appl. Bio Mater., 2024, 7(6), 3915–3931 CrossRef CAS PubMed.
- S. Kargozar, S. J. Hoseini, P. B. Milan, S. Hooshmand, H. Kim and M. Mozafari, Quantum Dots: A Review from Concept to Clinic, Biotechnol. J., 2020, 15(12), 2000117 CrossRef CAS PubMed.
- A. V. Longo, A. Sciortino, M. Cannas and F. Messina, UV photobleaching of carbon nanodots investigated by in situ optical methods, Phys. Chem. Chem. Phys., 2020, 22(24), 13398–13407 RSC.
- J. F. Galloway, A. Winter, H. L. Kwan, J. Ho Park, C. M. Dvoracek and P. Devreotes, et al., Quantitative characterization of the lipid encapsulation of quantum dots for biomedical applications, Nanomed. Nanotechnol. Biol. Med., 2012, 8(7), 1190–1199 CrossRef CAS PubMed.
- P. K. Yadav, S. Chandra, V. Kumar, D. Kumar and S. H. Hasan, Carbon Quantum Dots: Synthesis, Structure, Properties, and Catalytic Applications for Organic Synthesis, Catalysts, 2023, 13(2), 422 CrossRef CAS.
- P. Devi, S. Saini and K. H. Kim, The advanced role of carbon quantum dots in nanomedical applications, Biosens. Bioelectron., 2019, 141, 111158 CrossRef CAS PubMed.
- M. Pourmadadi, E. Rahmani, M. Rajabzadeh-Khosroshahi, A. Samadi, R. Behzadmehr and A. Rahdar, et al., Properties and application of carbon quantum dots (CQDs) in biosensors for disease detection: A comprehensive review, J. Drug Delivery Sci. Technol., 2023, 80, 104156 CrossRef CAS.
- L. Tian, Z. Li, P. Wang, X. Zhai, X. Wang and T. Li, Carbon quantum dots for advanced electrocatalysis, J. Energy Chem., 2021, 55, 279–294 CrossRef CAS.
- L. Cui, X. Ren, M. Sun, H. Liu and L. Xia, Carbon Dots: Synthesis, Properties and Applications, Nanomaterials, 2021, 11(12), 3419 CrossRef CAS PubMed.
- E. Muro, G. E. Atilla-Gokcumen and U. S. Eggert, Lipids in cell biology: how can we understand them better?, Molecular Biology of the Cell, ed. W. Bement. 2014, vol. 25, 12, pp. 1819–1823, Available from: https://www.ncbi.nlm.nih.gov/pmc/articles/PMC4055261/ Search PubMed.
- T. Harayama and H. Riezman, Understanding the diversity of membrane lipid composition, Nat. Rev. Mol. Cell Biol., 2018, 19(5), 281–296 CrossRef CAS PubMed.
- J. Park, J. Choi, D. D. Kim, S. Lee, B. Lee and Y. Lee, et al., Bioactive Lipids and Their Derivatives in Biomedical Applications, Biomol. Ther., 2021, 29(5), 465–482 CrossRef CAS PubMed . https://www.biomolther.org/journal/view.html?uid=1353%26vmd=Full.
- A. Luchini and G. Vitiello, Understanding the Nano-bio Interfaces: Lipid-Coatings for Inorganic Nanoparticles as Promising Strategy for Biomedical Applications, Front. Chem., 2019, 7 DOI:10.3389/fchem.2019.00343.
- Y. Jiang, W. Li, Z. Wang and J. Lu, Lipid-Based Nanotechnology: Liposome, Pharmaceutics, 2023, 16(1), 34–44 CrossRef PubMed . https://www.ncbi.nlm.nih.gov/pmc/articles/PMC10820119/.
- R. Singh, P. Yadav, N. Hema and D. D. Bhatia, Cationic lipid modification of DNA tetrahedral nanocages enhances their cellular uptake, Nanoscale, 2023, 15(3), 1099–1108 RSC.
- H. C. Huang, P. Y. Chang, K. Chang, C. Y. Chen, C. W. Lin and J. H. Chen, et al., Formulation of novel lipid-coated magnetic nanoparticles as the probe for in vivo imaging, J. Biomed. Sci., 2009, 16(1), 86 CrossRef PubMed.
- H. Yasar, A. Biehl, C. De Rossi, M. Koch, X. Murgia and B. Loretz, et al., Kinetics of mRNA delivery and protein translation in dendritic cells using lipid-coated PLGA nanoparticles, J. Nanobiotechnol., 2018, 16(1), 72 CrossRef PubMed.
- D. B. Tada, E. Suraniti, L. M. Rossi, C. A. P. Leite, C. S. Oliveira and T. C. Tumolo, et al., Effect of Lipid Coating on the Interaction Between Silica Nanoparticles and Membranes, J. Biomed. Nanotechnol., 2014, 10(3), 519–528 CrossRef CAS PubMed . https://pubmed.ncbi.nlm.nih.gov/24730247/.
- S. J. H. Soenen, A. R. Brisson and M. De Cuyper, Addressing the problem of cationic lipid-mediated toxicity: The magnetoliposome model, Biomaterials, 2009, 30(22), 3691–3701 CrossRef CAS PubMed.
- X. Lin and T. Chen, A Review of in vivo Toxicity of Quantum Dots in Animal Models, Int. J. Nanomed., 2023, 18, 8143–8168 CrossRef CAS PubMed.
- J. Qi, J. Zhuang, Y. Lu, X. Dong, W. Zhao and W. Wu, In vivo fate of lipid-based nanoparticles, Drug Discovery Today, 2017, 22(1), 166–172 CrossRef CAS PubMed . https://pubmed.ncbi.nlm.nih.gov/27713035/.
- C. He, Y. Hu, L. Yin, C. Tang and C. Yin, Effects of particle size and surface charge on cellular uptake and biodistribution of polymeric nanoparticles, Biomaterials, 2010, 31(13), 3657–3666 CrossRef CAS PubMed.
- E. Winter, C. Dal Pizzol, C. Locatelli and T. B. Crezkynski-Pasa, Development and Evaluation of Lipid Nanoparticles for Drug Delivery: Study of Toxicity In, Vitro and In Vivo, J. Nanosci. Nanotechnol., 2016, 16(2), 1321–1330 CrossRef CAS PubMed . https://pubmed.ncbi.nlm.nih.gov/27433582/.
Footnotes |
| † Electronic supplementary information (ESI) available. See DOI: https://doi.org/10.1039/d4na00306c |
| ‡ These authors contributed equally. |
| This journal is © The Royal Society of Chemistry 2024 |

