
 Open Access Article
 This Open Access Article is licensed under a Creative Commons Attribution-Non Commercial 3.0 Unported Licence
A deeper insight into the evaluation of water-in-oil amicroemulsion templated samarium sulfide nanospheres: exploring its role in pickering emulsion formulation for photocatalytic dye degradation and synthesis of PANI@Sm2S3 nanocomposites†
Sk Mehebub
Rahaman
a,
Nargis
Khatun
a,
Prashanta
Pal
b,
Trishna
Mandal
a,
Arnab
Patra
a,
Mahasweta
Nandi
 b and
Bidyut
Saha
*a
b and
Bidyut
Saha
*a
aColloid Chemistry Laboratory, Department of Chemistry, The University of Burdwan, Golapbag, Burdwan-713104, West Bengal, India. E-mail: bsaha@chem.buruniv.ac.in; Tel: +91 9476341691
bIntegrated Science Education and Research Centre, Siksha Bhavana, Visva-Bharati University, Santiniketan-731235, India
First published on 12th February 2024
Abstract
This study examines the effectiveness of W/O microemulsion-mediated Sm2S3 nanospheres in pickering emulsion-based crystal violet (CV) dye degradation and PANI@Sm2S3 nanocomposite synthesis. The evaluation of nanospheres inside the core of reverse micelles was performed through DLS, TEM and FESEM analyses. The formation of nanospheres involve two phases: a nucleation phase (5–30 min) and growth phase (30–120 min). Through in situ hydrophobization of negatively charged (with a zeta value of −4.47 mV at neutral pH) Sm2S3 nanoparticles (0.1 wt%) with a suitable amount of a cationic CTAB surfactant, a stable O/W pickering emulsion was developed. 0.1 wt% Sm2S3in situ hydrophobized with 2.7 mM CTAB offered a stable pickering emulsion with a diameter of 23 μm after 1 day of storage. This pickering emulsion improves the local concentration of CV by efficiently encapsulating dye molecules inside the core of emulsion droplets. Therefore, dye molecules get numerous opportunities to interact with the Sm2S3 photocatalyst and efficiently degrade. The pickering emulsion stabilised by 0.1 wt% of Sm2S3 nanoparticles in situ hydrophobized with 2.7 mM of CTAB results in almost 100% degradation. Moreover, using only solid Sm2S3 (having wt% of 0.025 or 0.075) as a pickering stabiliser, new PANI@Sm2S3 spherical nanocomposites were synthesised via pickering emulsion polymerization. The formation of PANI@Sm2S3 composites was identified via UV-vis, IR, and 1H-NMR investigations. The analysis of FESEM images showed that the amount of nanoparticles used in the dispersion (for 0.025 wt%, 35 nm and 0.075 wt%, 29 nm) strongly influences the size and shape of the composites.
1. Introduction
Pickering emulsions are mainly stabilised by nanoparticles, while conventional emulsions are mostly stabilised by surfactants or amphiphilic polymers.1,2 Generally, after adsorbing to the oil–water interface, surfactant or amphiphilic polymer molecules reduce the interfacial tension in conventional emulsions.3–5 Conversely, pickering emulsions, which are produced by the adsorption of nanoparticles to the oil–water interface, prevent the droplets from aggregating and improve the emulsions' stability.1,2,6,7 It is interesting to note that few of the nanoparticles can be employed to produce stable pickering emulsions.8,9 However, a great number of hydrophilic nanoparticles alone could not provide stability to the emulsion.10,11 Therefore, the hydrophobization of these employed nanoparticles is required for endowing them with an amphiphilic nature.10–14 In practise, as the possibility of hydrophobization increased, nanoparticles became increasingly amphiphilic. In this study, we used hydrophilic nanoparticles of samarium sulfide (Sm2S3) to produce a stable pickering emulsion. However, the addition of a surfactant via in situ hydrophobization further improves the stability of emulsion droplets. The way in which ionic surfactants interact with oppositely charged particles has been extensively studied in the last few decades.12–15 Ionic surfactants basically adsorb themselves on the surfaces of quite hydrophilic or surface-inactive particles via in situ hydrophobization, imparting them with a hydrophobic character.15,16 By electrostatically adsorbing to particles, ionic surfactants actually form a hydrophobic monolayer and impart an amphiphilic nature.17,18 Following that, these particles effectively adsorbed on the oil–water interface, inhibiting droplet coalescence and enhancing emulsion stability. By changing the composition and concentration of the employed surfactants, it is possible to alter the amphiphilic nature of nanoparticles and cause the Pickering emulsion to change from O/W to W/O.2A key component in the preparation of pickering emulsions is the use of commercially accessible, conventional inorganic nanoparticles (such as Al2O3, TiO2, or SiO2). Xu et al. investigated the alteration from a Pickering to an oil-in-dispersion emulsion using Al2O3 nanoparticles.2 Yu et al. investigated the effects of using bola-type selenium surfactant in conjunction with Al2O3 nanoparticles to prepare the pickering emulsion.19 Using silica nanoparticles, Li et al. developed a pickering emulsion with redox and pH responsive properties.17 Xie et al. employed a pH-switchable, salt-resistant pickering emulsion, stabilised by mesoporous silica nanoparticles in situ hydrophobized with CTAB.6 In a different study, Liu et al. used conventional silica nanoparticles to prepare a pH-responsive pickering emulsion.18 Pickering emulsion stabilised by commercial TiO2 nanoparticles in the form of rutile and anatase has been developed by Demina et al.20 Moreover, Fessi et al. developed pickering emulsions of fluorinated TiO2 to enhance the photocatalytic degradation efficiency of nitrobenzene.21 Adaptable nanocellulose-anatase TiO2 hybrid nanoparticle-based pickering emulsions were developed by Voisin et al. to aid in the photocatalytic degradation of both organic and aqueous dyes.22 Consequently, it can be concluded from this thorough review of previous reports that no previous research has explored the formation of Pickering emulsions using microemulsion-mediated (typically W/O microemulsions, also known as reverse micelles) size and shape-controlled non-conventional nanoparticles in place of such commercially available conventional nanoparticles. This current study therefore presents a novel application of microemulsion-based nanoparticles in the challenging field of pickering emulsion preparation.
Nowadays, a wide variety of processes can be used to produce monodispersed nanoparticles, such as sol–gel, co-precipitation, hydrothermal synthesis, and sonochemical methods.23–25 However, particle size and shape cannot be controlled when using these methods. On the contrary, the primary benefit of employing a microemulsion technique is its practicable ability to regulate the size and shape of the nanomaterials; as a result, nowadays, microemulsion scaffolds are primarily used in the synthesis of nanomaterials.23–27 In earlier studies, we examined the effects of surfactant and cosurfactant hydrophobicity on the formation (with a special focus on size and shape) of lanthanum sulfide and cerium tetrafluoride nanoparticles.25,28 Therefore, in this study, we employed Tween 80 (as surfactant) and 1-butanol (as cosurfactant) to prepare the microemulsion template (Tween 80/1-butanol/water/toluene) to produce Sm2S3 nanoparticles. Afterwards, it was employed to produce a pickering emulsion, which is subsequently utilised in additional potential fields. The use of metal sulphur nanoparticles in the formation of pickering emulsions has been rarely reported before. In order to stabilise the O/W pickering emulsion, Huang et al. hydrophobized the lead sulfide nanoparticles using oleic acid and cinnamic acid.29 Zinc sulfide nanoparticles were used by Roy et al. in the formulation of pickering emulsion (containing tea tree essential oil) for use in active packaging applications.30
Similar to conventional emulsion, pickering emulsion is also essential for a variety of uses, including drug delivery, controlled release, emulsion polymerization, food industry product formulation and protection, petroleum industry oil drilling, biphasic enzyme catalysis, interfacial catalysis, and also wastewater treatment.1,2,10,31–33 The purpose of the current work is to evaluate the effectiveness of Sm2S3-based pickering emulsion on photocatalytic crystal violet (CV) dye degradation and aniline polymerization to polyaniline (PANI). In a photocatalytic dye degradation process, the degradation of nearly all organic substrates is made possible by the formation of highly oxidising active oxygen species at the semiconductor surface through light-induced redox reactions.21,34 Few studies have been reported on the use of pickering emulsion in the enhancement of photocatalytic degradation of organic pollutants.21 The kinetics of the photocatalytic reaction in normal aqueous media are hindered since hydrophobic organic pollutants adsorb poorly onto the hydrophilic surface of the photocatalyst. This problem is resolved by the introduction of pickering emulsion where solid photocatalyst particles (sometimes in situ hydrophobized with surfactant) acts as emulsion stabilizers. The employment of a pickering emulsion increases the contact between the photocatalyst and the pollutant through the reduction of size of oily droplets. In other words, because of the increased availability of active sites, emulsion droplets function as microreactors that effectively facilitate photocatalytic degradation. Moreover, the majority of the photocatalyst used in heterogeneous photocatalysis to degrade organic contaminants in pickering emulsions is TiO2. Fessi et al. used a Pickering emulsion stabilised with TiO2 to photocatalytically degrade 1-methylnaphthalene.21 In another works, Fessi et al. used fluorinated TiO2 to stabilise pickering emulsion for photocatalytic nitrobenzene degradation and 1-methylnaphthalene.35,36 Ag3PO4@palygorskite, a distinct kind of nanocomposites, was used by Han et al. to efficiently photodegrade alkane by forming an in situ pickering emulsion.37 Herein, we employed Sm2S3 nanospheres (in situ hydrophobized with CTAB)-based pickering emulsion for the photocatalytic degradation of CV.
Typically, surfactants are employed as emulsifiers in emulsion polymerizations to stabilise the emulsion systems. However, they also need to take an extra challenging step of removing the surfactants following the polymerization.38 Pickering emulsion polymerization uses only solid particles as a stabiliser, in contrast to conventional emulsion polymerization methods.38,39 Therefore, the stabiliser is not removed from the resulting polymer-solid particle composite by a separate process. Usually, a solid hydrophilic inorganic substance is typically used as the stabiliser in the pickering emulsion polymerization process.38–40 In water, the used solid particles tend to encircle the hydrophobic monomer, developing a pickering emulsion with droplets of polymerized monomer.38,41 Previous research revealed that the organic–inorganic composite materials developed through the pickering method have core–shell structures, consisting of polymer cores and inorganic shells.41,42 In our present polymerization processes, PANI@Sm2S3 nanocomposites were developed employing surfactants-free O/W pickering emulsion, stabilised only by hydrophilic Sm2S3 nanospheres. These polymerization techniques are recent additions in polymer science, and there are few previous reports available for pickering emulsion polymerization of aniline. Polyaniline/zinc-ferrite composite was developed by Kim et al. using the pickering emulsion polymerization method.38 In a similar manner, Wang et al. used pickering emulsion polymerization to synthesise polyaniline@MnO2/graphene ternary hybrid hollow spheres.39 Consequently, the current pickering emulsions based on Sm2S3 nanoparticles show promise for use in the synthesis of PANI@Sm2S3 nanocomposites and the degradation of CV. This therefore opens the door for the utilization of microemulsion-mediated nanoparticles in a crucial branch of emulsions, i.e., pickering emulsions, and explores its role in different applied fields.
2. Experimental section
2.1. Materials
Samarium nitrate (99%, AR, SRL-India), sodium sulfide (99%, AR, SRL-India), Tween 80 (AR, SRL-India), cetyltrimethyl ammonium bromide (CTAB) (99%, AR, HiMedia), 1-butanol (99%, AR, SRL-India), toluene (MERCK-India), crystal violet dye (88%, AR, LOBA CHEMIE), potassium persulfate (99%, AR, Merck-India), aniline (99%, AR, SRL-INDIA) HCl (Fisher Scientific). Throughout the studies, distilled water (Millipore, India) was utilised to make all the aqueous solutions.2.2. Preparation of Sm2S3 nanoparticles in W/O microemulsion scaffolds
The Sm2S3 nanoparticles were prepared using the reverse micellar method. The W/O microemulsion preparation process is described below.Tween 80 and toluene were poured into a dry beaker at a pre-set [water]/[surfactant] (W0) ratio, i.e., at W0 = 10. After that, the mixture was sonicated for 30 s in a digital ultrasonic cleaner (MC-109 SPL). Cosurfactants (1-butanol) was then added slowly to the turbid and viscous solution and swirled continuously to get the best transparency. The system was then allowed enough time to establish equilibrium; once it had disappeared, turbidity could not be re-established. The amount of 1-butanol required for preparing a stable microemulsion was then determined. The entire process concluded at W0 = 10 and 303 K fixed temperature. Therefore, for W0 = 10, toluene, water, Tween 80, and 1-butanol have respective volume percentages of 55.24, 1.10, 7.21, and 36.45, respectively.
Now, to produce Sm2S3 nanoparticles, a W/O microemulsion containing toluene as the organic phase, Tween 80 as the surfactant, and 1-butanol as the cosurfactant was mixed with a 1 M aqueous solution of Sm3+ and S2−. In other words, microemulsion I normally contained a 1 M solution of samarium nitrate, whereas microemulsion II often contained a 1 M solution of sodium sulfide. The two microemulsion solutions were completely mixed and stirred for 2 h using a magnetic stirrer. After a specified period of time (5, 15, 30, 60, 90, and 120 min), centrifugation was used to separate the required product from the organic phase and surfactant. The centrifugation was conducted at a speed of 4000 rpm for 15 min. Acetone was used to clean the synthesised nanoparticles before allowing it to air dry naturally.
2.3. Characterization of Sm2S3 nanoparticles
Powder X-ray diffraction (PXRD) on a Bruker D8 Advance diffractometer with Ni-filtered Cu Kα radiation was used to evaluate the crystallographic information on the synthesised Sm2S3 nanoparticles.FTIR spectrum data were taken between 400 and 4000 cm−1 using a KBr pellet method on a Shimadzu IRAffinity-1S FT-IR spectrophotometer.
The surface area was measured by the Brunauer–Emmett–Teller (BET) method through the N2 adsorption/desorption isotherms, which were acquired on a Quantachrome Instruments at 77 K temperature.
At various time intervals (5, 15, 30, 60 and 120 min), the droplet size of nanoparticles produced from microemulsion media of W0 = 10 was measured using dynamic light scattering (DLS) (Malvern Zetasizer Nano ZS). The required amount of the colloidal solution containing the synthesised nanoparticles was introduced into a quartz cell, and the test temperature was maintained at 30 °C.
A Zeiss EM 912 U equipment was used to conduct transmission electron measurements (TEM) at a 120 kV acceleration voltage. Before being placed on copper grids, the solid Sm2S3 nanoparticles were first dispersed in ethanol. A copper grid was positioned on a filter paper at the bottom of a Petri dish to prevent the aggregation of nanoparticles.
To examine the microstructure of the synthesised Sm2S3 nanoparticles, a field emission scanning electron microscope (FESEM) (Zeiss Gemini SEM 450) was used. FESEM images can be used to determine the size and shape of the particles produced by a microemulsion medium of W0 = 10.
2.4. Preparation of Sm2S3-stabilised pickering emulsion
A 5 mL glass vial (1 dram homoeopathy glass vials) was filled with a certain amount of Sm2S3 nanoparticles by weight, and then 2 mL of pure water was added. Concentrations of Sm2S3 nanoparticles were presented as wt%, and four different concentrations (0.025, 0.05, 0.075 and 0.1 wt%) were taken. It was then dispersed through high ultrasonication (MC-109 SPL) for 5 min. Thereafter, 2 mL of toluene (served as oil phase) was added to the dispersion and sonicated for 5 min, followed by handshaking to emulsify it.A digital camera was employed to take photographs of the prepared emulsion. The emulsion type was determined through the drop test method by immersing a drop of emulsion into a large excess of water or toluene. The micromorphology of the emulsion droplets was examined through optical microscopy (Weswox-FM2000).
2.5. Photocatalytic degradation of crystal violet in the Sm2S3-stabilised pickering emulsion
In the degradation process of CV in the pickering emulsion, Sm2S3 served as a photocatalyst. But due to the least stability of the prepared emulsion, only the Sm2S3-stabilised pickering emulsion is not sufficient in efficient photocatalytic degradation. The employed nanoparticles (0.1 wt%) were in situ hydrophobized with different concentrations of CTAB (0.6, 1.3, 2.0 and 2.7 mM). Thereafter, the identical procedure stated just earlier was followed.Zeta potential facilitated the adsorption of CTAB onto the surface of nanoparticles. Sonication (MC-109 SPL) was used for 2 min to disperse 0.1 wt% nanoparticles in an aqueous CTAB solution. After that, the dispersions were left standing at room temperature for 24 h to reach equilibrium. The zeta potentials of the colloidal dispersions were then measured with a Anton Paar Litesizer 500 instrument.
An adequate amount of CV was dissolved completely in distilled water to produce a 0.01 M stock solution for the photocatalytic degradation of CV. The solution was kept at room temperature in a dark place. A Shimadzu 1800 UV-vis spectrophotometer was used to measure the absorbance of CV. Degradation investigations were carried out in sunlight and for subsequent studies, the distinctive absorbance peak at 592 nm was chosen. The absorbance of a specific volume of CV solution was measured on a regular basis, and the collected volume was subsequently added back into the degradation medium.
CV degradation was carried out into a 4 mL pickering emulsion, stabilised by 0.1 wt% Sm2S3, in situ hydrophobized with 0.6, 1.3, 2.0 and 2.7 mM CTAB. 4 mL of CV with a concentration of 5 × 10⁻⁵ M was then added into the pickering emulsion. The mixture was thereafter stirred (using magnetic stirrer of model REMI) under sunlight exposure to ensure the degradation of CV. The degradation process was considered to be finished when the CV solution turned colourless. After completion, the amphiphilic nanoparticles were recovered from the solution by centrifugation (using HERMLE Labortechnik GmbH) at 4000 rpm for 10 min. It was then dried under hot air oven and the particle was reused in pickering emulsion formation and subsequent photocatalytic degradation. In all these experiments, neutral pH (∼6.16) was maintained.
The percentage of CV degradation was measured through the following formula.
 | (1) |
Moreover, the effect of CV concentration on degradation was also examined by varying the concentration of dye from 2.5 × 10⁻⁵ to 10 × 10−5 (M).
Under the optimised condition of pickering emulsion (0.1 wt% of nanoparticles, in situ hydrophobized with 2.7 mM CTAB) and CV concentration (5 × 10⁻⁵ (M)), a repetition of experiments was carried out for the further investigation of the reusability of pickering emulsion.
Using the absorbance of the dye solution measured after different time intervals, a kinetic experiment for CV degradation was conducted. The Langmuir–Hinshelwood model was applied to the experimental results.
2.6. Synthesis of PANI@Sm2S3 composites in pickering emulsion
The water phase (2 mL) was an aqueous dispersion of varying wt% (0.025 and 0.075) of Sm2S3, while the oil phase (2 mL) was toluene-containing aniline. To produce a Pickering emulsion, the two phases were combined and homogenised for 2 min at 500 rpm using a homogenizer. The prepared emulsion was submerged in ice water for about half an hour. Similarly, in separate systems, a certain amount of potassium persulfate (potassium persulfate/aniline = 1![[thin space (1/6-em)]](https://www.rsc.org/images/entities/char_2009.gif) :1) was immersed in a 1 mol L−1 HCl solution and left in an ice bath for half an hour. Thereafter, potassium persulfate solution was added subsequently in to the emulsion. To assure the complete polymerization of aniline, the mixture was stirred at an ice water bath for 6 h. The necessary product was separated using centrifugation at a speed of 4000 rpm for 15 min.
:1) was immersed in a 1 mol L−1 HCl solution and left in an ice bath for half an hour. Thereafter, potassium persulfate solution was added subsequently in to the emulsion. To assure the complete polymerization of aniline, the mixture was stirred at an ice water bath for 6 h. The necessary product was separated using centrifugation at a speed of 4000 rpm for 15 min.
For comparison, another set of polymerisation was carried out by the direct addition of acidic potassium persulfate to aniline instead of the introduction of Sm2S3-stabilised pickering emulsion.
2.7. Characterization of PANI@ Sm2S3 composites
The UV-vis spectra of the PANI@Sm2S3 composites were recorded on a Shimadzu 1800 UV-vis spectrophotometer, within the range of 200–800 nm. A Shimadzu FTIR-8400S spectrophotometer was utilised to acquire the FTIR spectrum data within the range of 400 and 4000 cm−1. Spectroscopic grade KBr was used to prepare the samples in pellet form. Using a Bruker ASCEND-400 MHz spectrophotometer, 1H NMR measurements were performed to identify the evaluation of PANI@Sm2S3 composites. Using field emission scanning electron microscopy (Zeiss Gemini SEM 450), the morphology of PANI@Sm2S3 was ascertained.3. Results and discussion
3.1. Characterization of Sm2S3 nanoparticles
Characteristics of Sm2S3 nanoparticles are described using PXRD analysis, and for this, X-ray diffraction was applied to the sample made using a microemulsion template. Fig. S1† displays the findings. The peaks in the PXRD spectrum match with the planes (103), (013), (105) and (212) of orthorhombic crystalline Sm2S3 (having JCPDS No. 44–1259).43–45The functional groups of synthesised Sm2S3 nanoparticles were identified via FTIR analysis. Several transmission peaks of nanomaterials between 400 and 4000 cm−1 are shown in Fig. S2.† Due to the OH− symmetric stretching vibrations, a peak is apparent in the spectrum at a wavelength of 3390 cm−1. In Sm2S3 nanocomposites, the two strong and narrow absorption bands at 632 cm−1 and 846 cm−1 are attributed to the pairing mode between Sm–S stretching of tetrahedral and octahedral sites, respectively.43 O–H molecules that have been adsorbed on the surface are thought to be the cause of the band at 1639 cm−1. Consequently, the synthesis of nanomaterials containing Sm2S3 is confirmed by all of the characteristic bands.
The specific surface area was determined using Brunauer–Emmett–Teller (BET) gas adsorption experiments. Fig. S3† shows the nitrogen adsorption–desorption curve of Sm2S3 nanospheres and the corresponding pore size distribution. The nitrogen isotherm has a small hysteresis loop and is categorised as a type IV isotherm.43 It suggests the existence of pores on the nanomaterials. The BET surface area of Sm2S3 nanospheres is estimated to be 27.665 m2 g−1 based on the N2-sorption isotherm.
3.2. Analysing the DLS findings
As determined by the DLS particle size analyser, Fig. 1 shows the in situ particle size distribution (PSD) of the nanoparticles, synthesised from the core of microemulsions (of W0 = 10) at various times. For determining the size of reverse micelles and their direct impacts on the size of the resulting nanoparticles, prepared inside their core, DLS techniques are particularly effective.24–26 The in situ growth mechanism of Sm2S3 nanoparticles is therefore examined using DLS measurements. After collecting an aliquot of the colloidal solution from the reaction medium, in situ DLS experiment was carried out.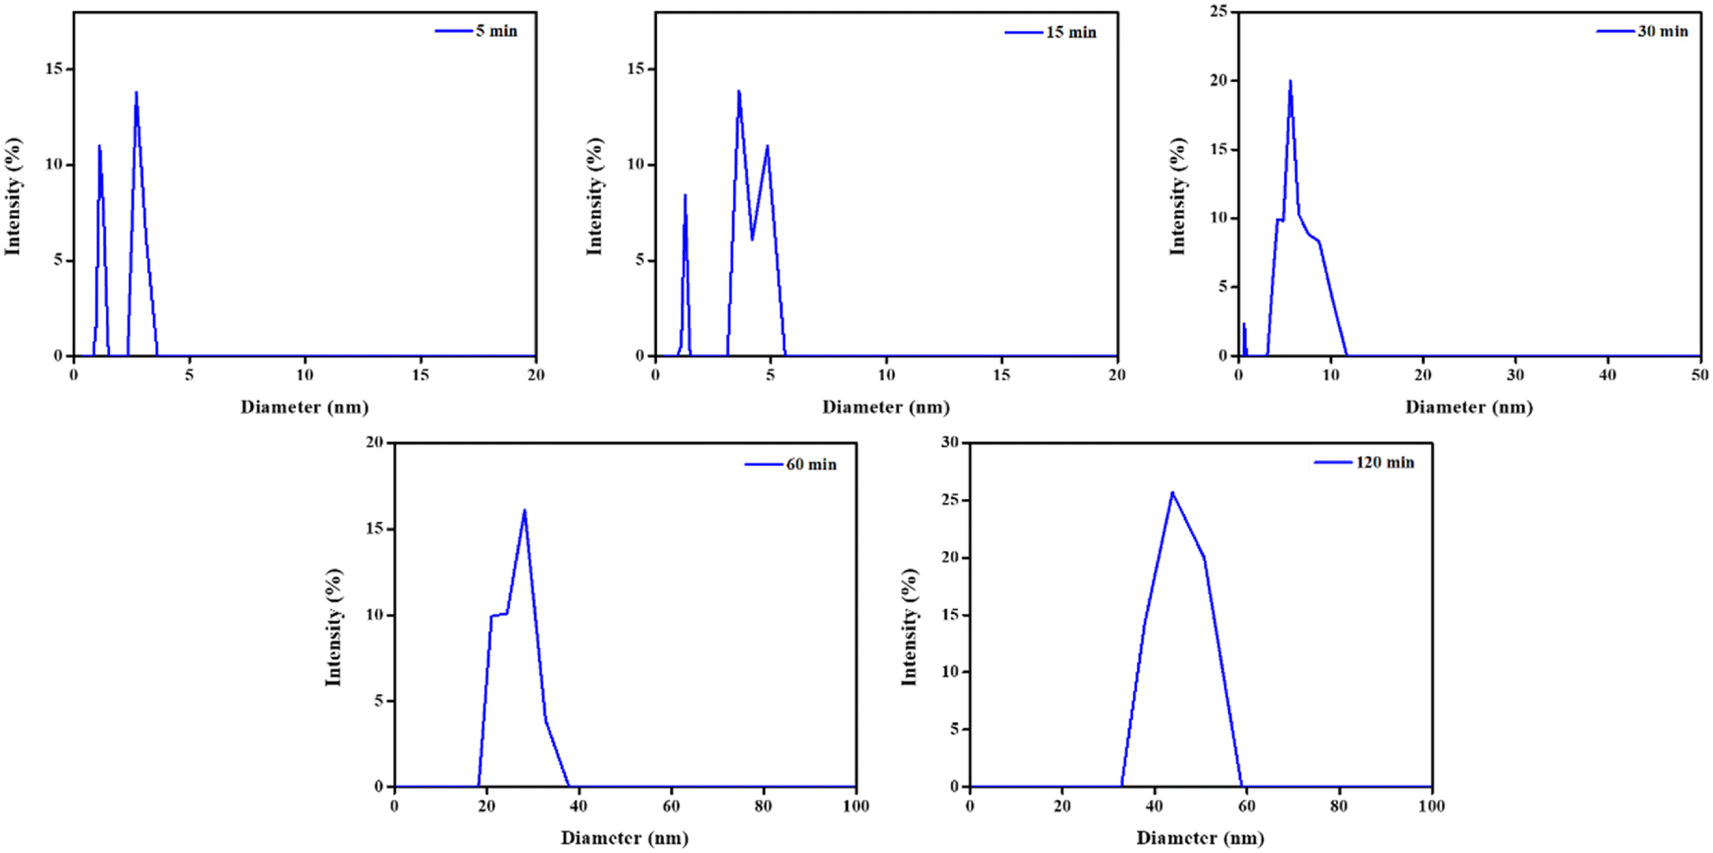 | ||
| Fig. 1 Particle size distribution (PSD) patterns of Sm2S3 nanoparticles synthesised from the reverse micellar media of Tween 80/1-butanol/toluene/Sm2S3 at various time intervals. | ||
After 5 min of reaction time, Sm2S3 nanoparticles with an average size of 2.0 nm are observed, suggesting the presence of solubilized reactant ions or the so-formed spherical nanocomposites. Up to 30 min (5.89 nm) into the reaction, no such detectable increase in the particle size is found, suggesting that the first 5 to 30 min of the reaction are a phase of early nucleation for this microemulsion-based reaction system.3,23,26 Therefore, at the early nucleation stage (5–30 min), droplets begin to collide and form an intermediate encounter complex known as a transient dimer.23,25,26 Due to this transient dimer's short lifetime and the need for quicker time scale technologies, DLS is unable to detect it. As the reaction progresses, the microemulsion droplets carrying the newly synthesised particles and the microemulsion containing the active reactants coalesce with much higher probability. Consequently, larger dimension nanoparticles become evident. Actually, the drop diameter expands during the coalescence of two microemulsion droplets, allowing nanoparticles more space to grow and forming a larger Sm2S3 nanostructures. Thus, according to DLS instrumentation, the average particle size increases to 25.89 nm after 60 min of the reaction and keeps growing up to 120 min (44.67 nm) of the reaction. The DLS plots thus exhibits two primary droplet zones with distinctive size distributions through which nanostructures are produced.
(a) Droplets consist small-sized nanostructures formed at the early nucleation phase (5–30 min of the reaction).
(b) Droplets having comparatively higher dimension nanostructures formed at the growing phase (30–120 min of the reaction).
3.4. Examining the TEM images
In order to support the results obtained from DLS, the product, taken after centrifugation (at various times of the reaction), is subjected to TEM studies. Fig. 2 displays the results.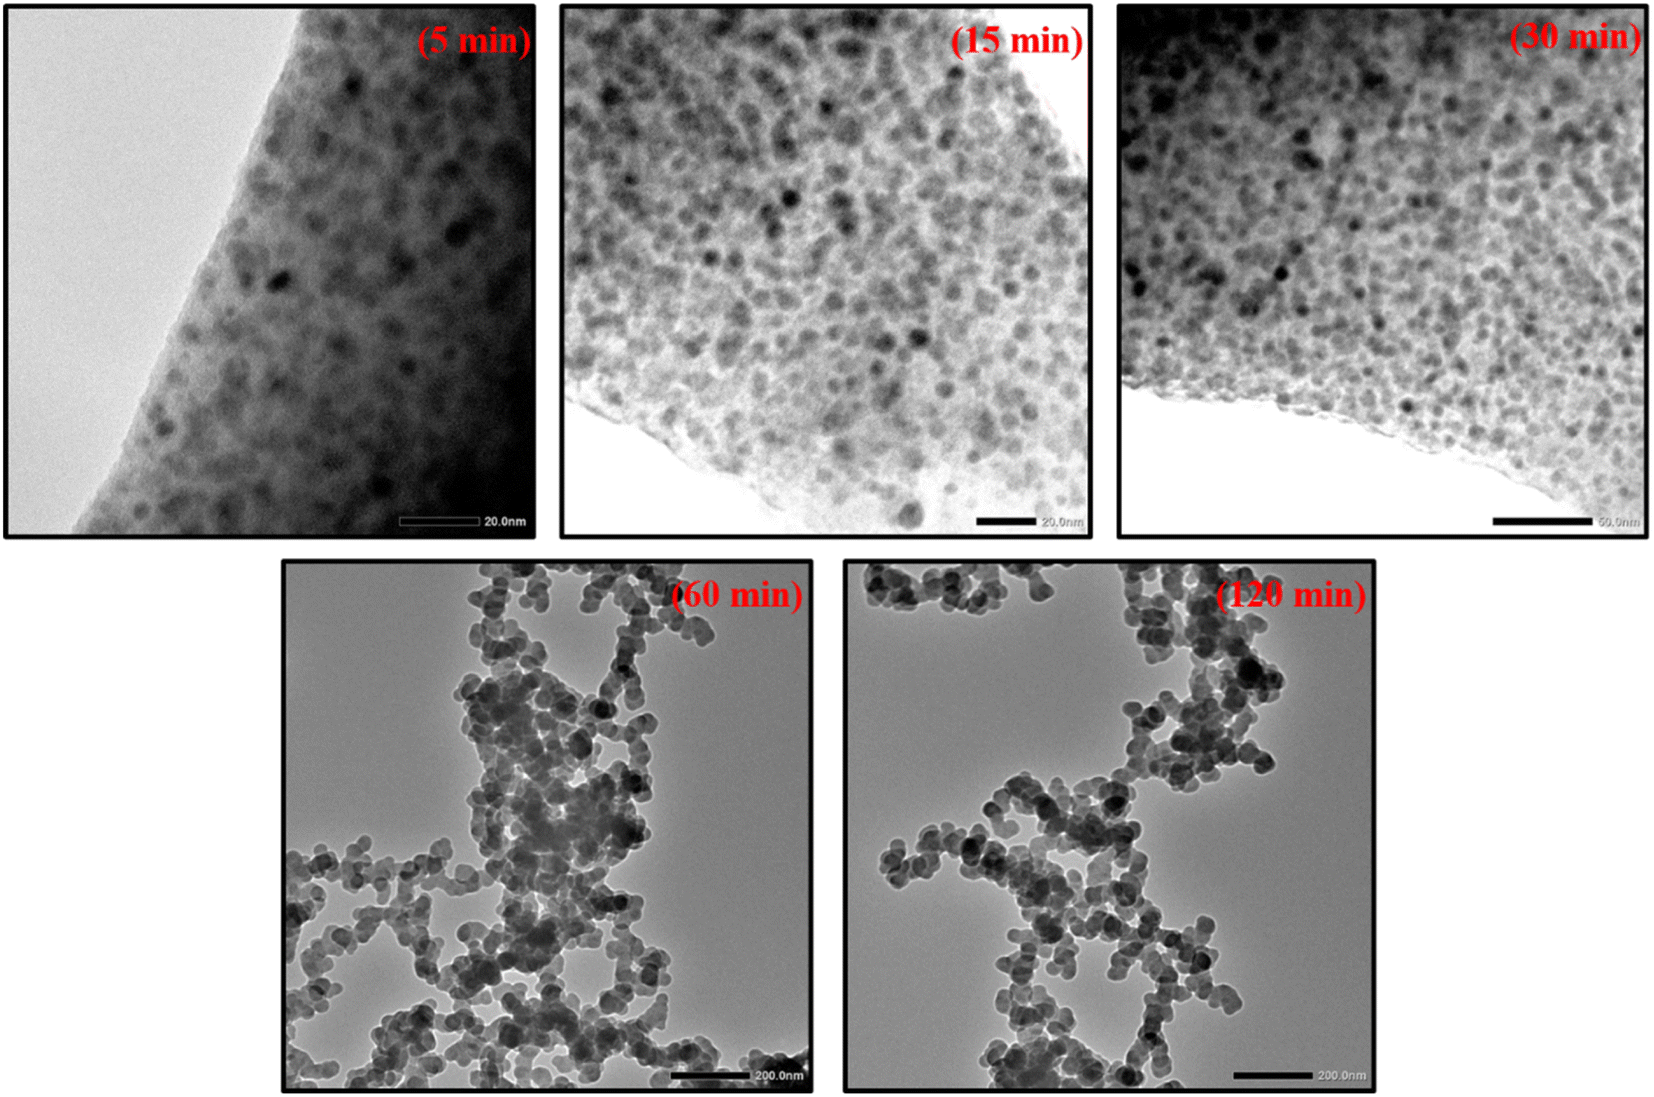 | ||
| Fig. 2 TEM images of Sm2S3 nanoparticles, synthesised from reverse micellar media of Tween 80/1-butanol/toluene/Sm2S3 at various time intervals. | ||
TEM images at any stage of the process indicate that the synthesised nanoparticles have a spherical shape. The results of DLS are further supported by the TEM images, showing that the size of the nanospheres increases progressively as the reaction proceed. TEM images taken at 5 min (3.16 nm) into the reaction suggests that the particles just started to form through nucleation.3,23,26 Up to 30 min (6.41 nm) into the reaction, no dramatic increase in particle size is seen. Hence, the initial nucleation stage is expected to be between 5 and 30 min. This results show that the reverse micelles have a significant extent of surface film rigidity at the initial stage and are less prone to aggregate, leading to a slow rise in particle size.25,28,46–48 However, TEM images taken at 60 min (34.78 nm) of the reactions show that the sizes of nanospheres increased dramatically during this 30–60 min timeframe, indicating that the reaction has now reached its growth phase (as also supported by DLS).23,26 The size of the nanospheres continued to increase up to 120 min (46.31 nm) into the reaction, at which point it reached its maximum dimension. The emergence of the diffuse phase boundary through micelle–micelle interaction and a decline in the rigidity of the surface film is suggested by the rapid increase in the particle size.25,28,46–48 Consequently, there is an enhanced probability of aggregation of resulting nanospheres inside the reverse micellar core to produce larger nanospheres. It is therefore concluded by the analysis of DLS data and TEM microstructures that the formation of Sm2S3 nanospheres occurs in two stages: the nucleation stage (5–30 min) and the growth phase (30–120 min) (as shown in Fig. 3). Table S1† shows the average diameter of the particles resulting from the DLS plots and TEM microstructural analysis.
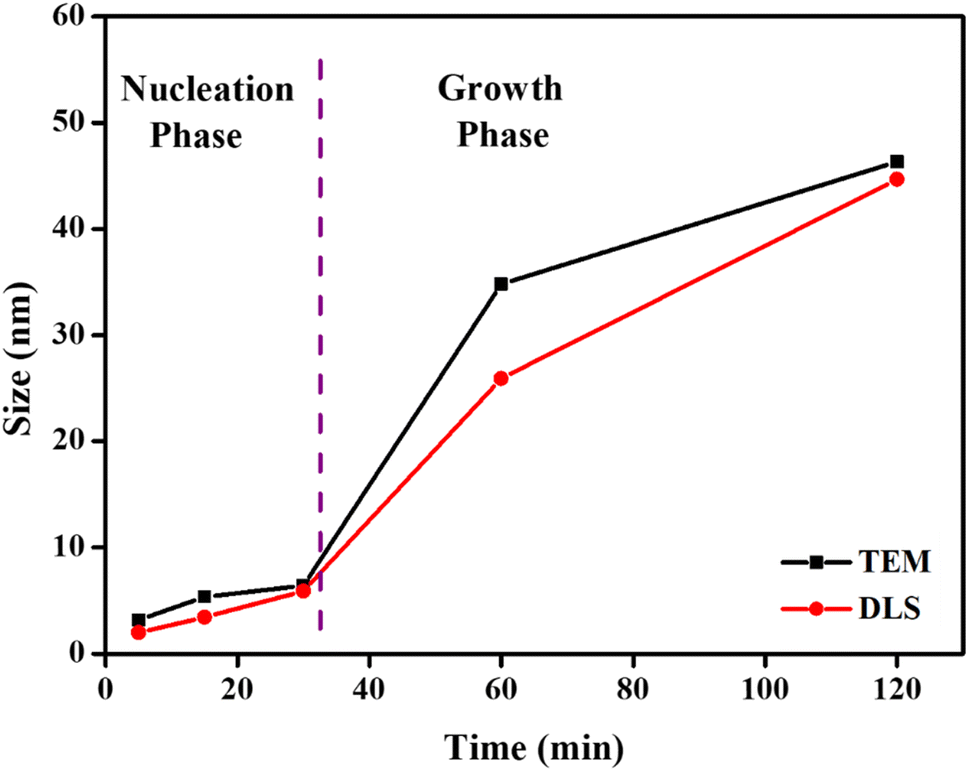 | ||
| Fig. 3 Illustration of the variation of average diameter of Sm2S3 nanospheres synthesised from the microemulsion medium of Tween 80/1-butanol/toluene/Sm2S3. | ||
3.5. Examining the FESEM images
Now, in addition to the TEM findings, FESEM images support the formation of spherical shapes with varying sizes of nanoparticles obtained at different time intervals (5, 15, 30, 60, and 120 min) for Tween 80/1-butanol/toluene/Sm2S3 micellar systems (Fig. 4). FESEM microstructural analysis also proved that the size of nanospheres gradually increases with the progression of the reaction. According to the FESEM images acquired at 5 and 15 min of the reaction, it is concluded that the particles are just beginning to form by nucleation with a very small particle diameter. The particle size does not significantly increase during the first 30 min of the process. The initial nucleation stage is therefore anticipated to exist at 5 to 30 min. However, the FESEM images taken at 60 min into the reaction reveal that the size of the nanospheres markedly increased throughout this 30 to 60 min time period, indicating that the reaction has now entered its growth phase (as also supported by DLS and TEM). Up until 120 min into the reaction, the size of the nanospheres kept growing, and a dramatic rise in particle size is finally noticed. Therefore, the idea that the formation of Sm2S3 nanospheres proceeds in two stages, the nucleation stage (5–30 min) and the growth phase (30–120 min), is further validated by the FESEM microstructural study.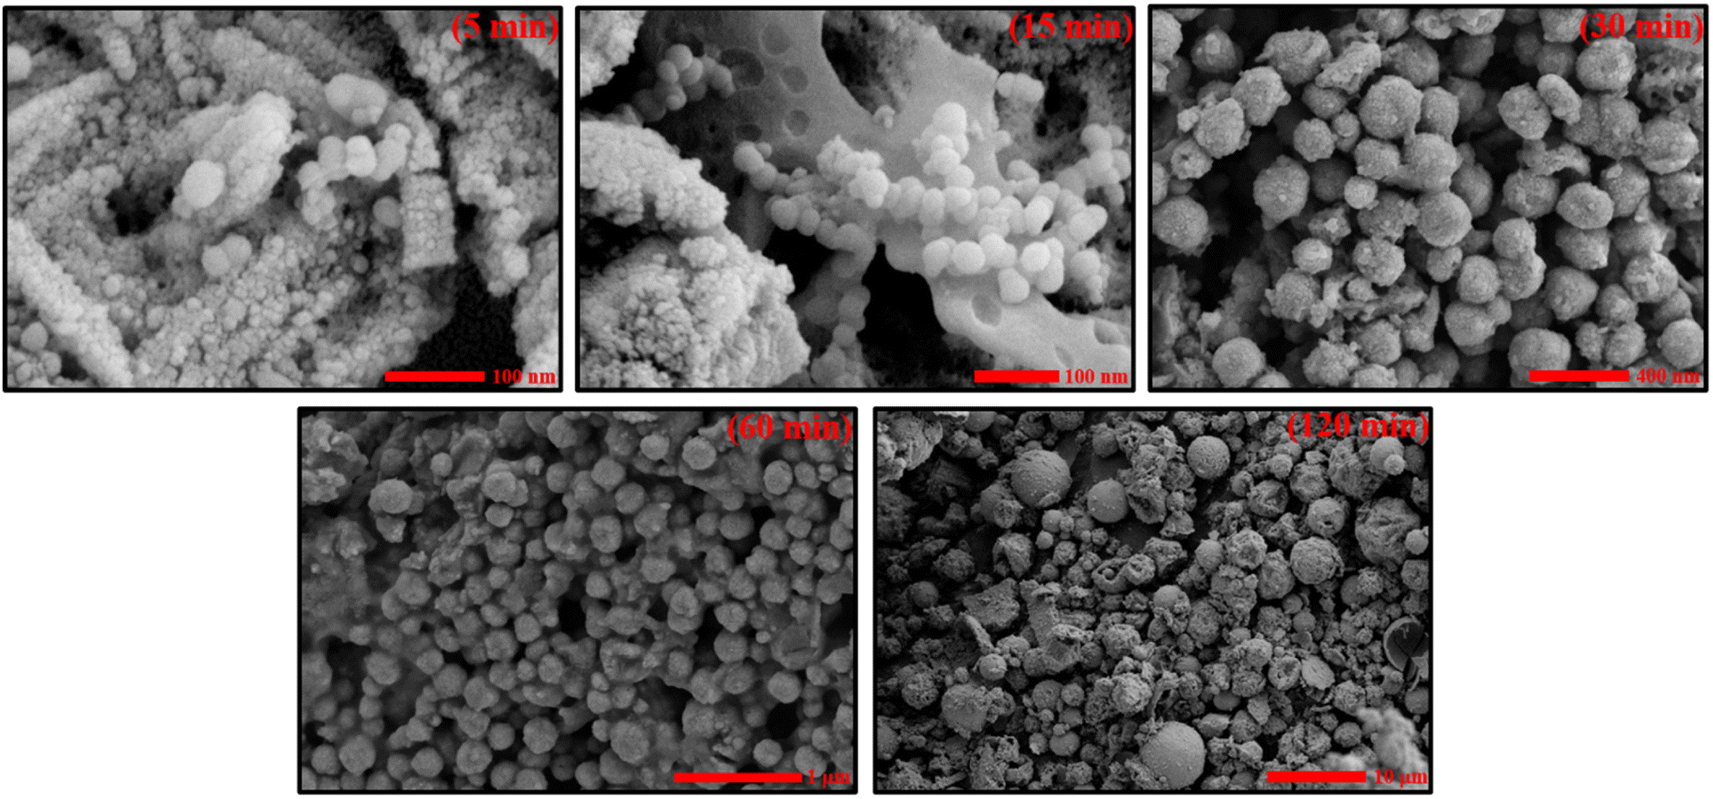 | ||
| Fig. 4 FESEM images of Sm2S3 nanospheres synthesised from reverse micellar media of Tween 80/1-butanol/toluene/Sm2S3 at various time intervals. | ||
3.6. Effect of Sm2S3-based pickering emulsion on the photocatalytic degradation of crystal violet (CV) dye
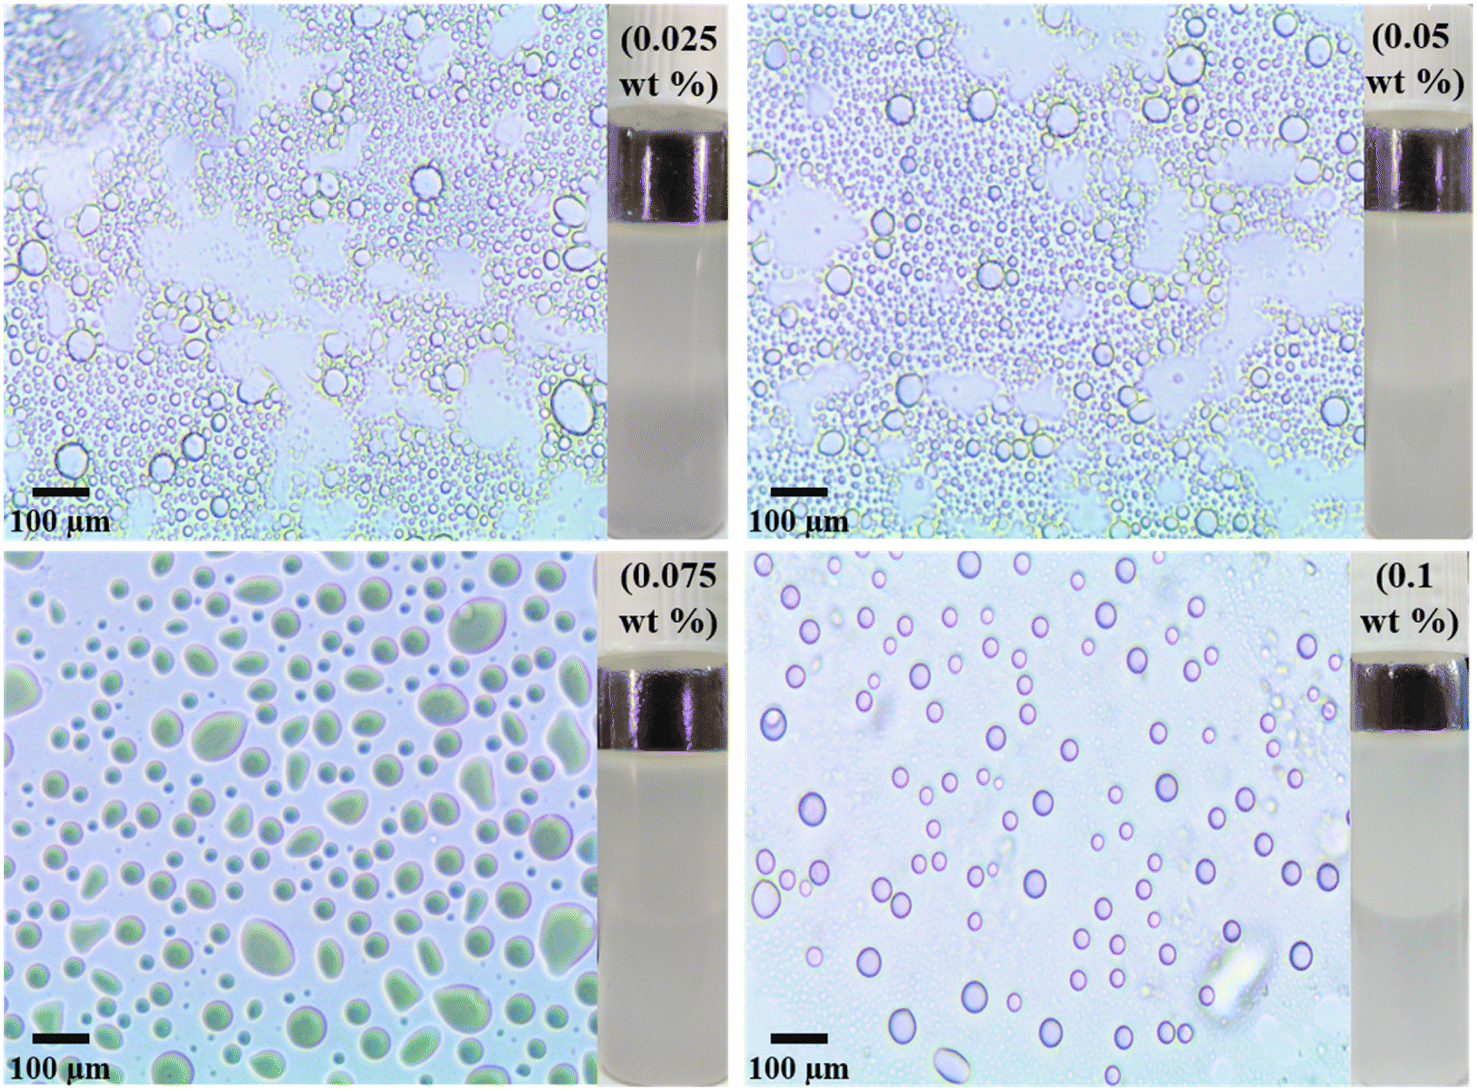 | ||
| Fig. 5 Optical micrographs along with digital images of pickering emulsion formed by different wt% Sm2S3 nanoparticles taken after 1 h. | ||
| wt% of Sm2S3 | Average diameter of emulsion droplets (μm) |
|---|---|
| 0.025 | 52 |
| 0.05 | 50 |
| 0.075 | 46 |
| 0.1 | 32 |
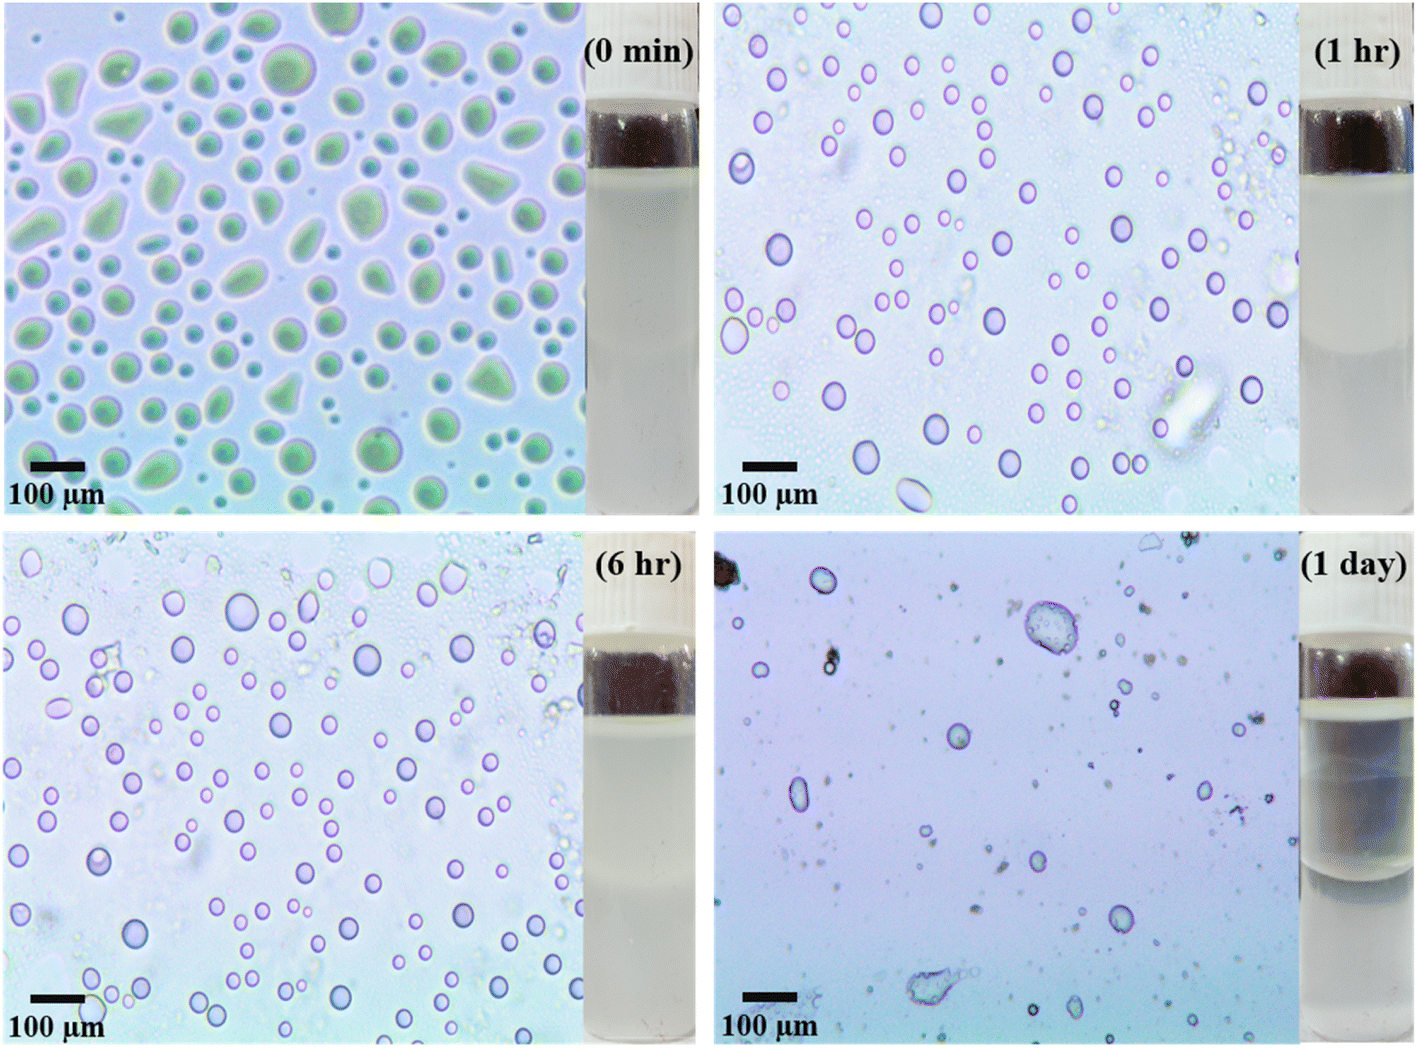 | ||
| Fig. 6 Optical micrographs along with digital images of pickering emulsion formed by 0.1 wt% Sm2S3 nanoparticles at different time intervals. | ||
| Time | Average diameter of emulsion droplets (μm) |
|---|---|
| 0 min | 36 |
| 1 h | 32 |
| 6 h | 37 |
| 1 day | 55 |
Sm2S3 nanoparticles are in situ hydrophobized with an adequate amount of CTAB, a cationic surfactant. From Fig. 7, it is seen that the employed nanoparticles at neutral pH exhibits a negative surface with a zeta potential of −4.47 mV. Eventually, at neutral pH, the positively charged CTAB will become electrostatically adsorbed onto the surface of nanoparticles and imparts them an amphiphilic nature through in situ hydrophobization.6,15,49 More accurately, with the increasing concentration of CTAB (up to 1.3 mM), the zeta value increased dramatically from −4.47 mV to 13.06 mV. But, thereafter, no such tremendous rise in positive zeta value was observed (15.06 mV at 2.7 mM CTAB). This final outcome suggests monolayer adsorption on the surface of nanoparticles.17
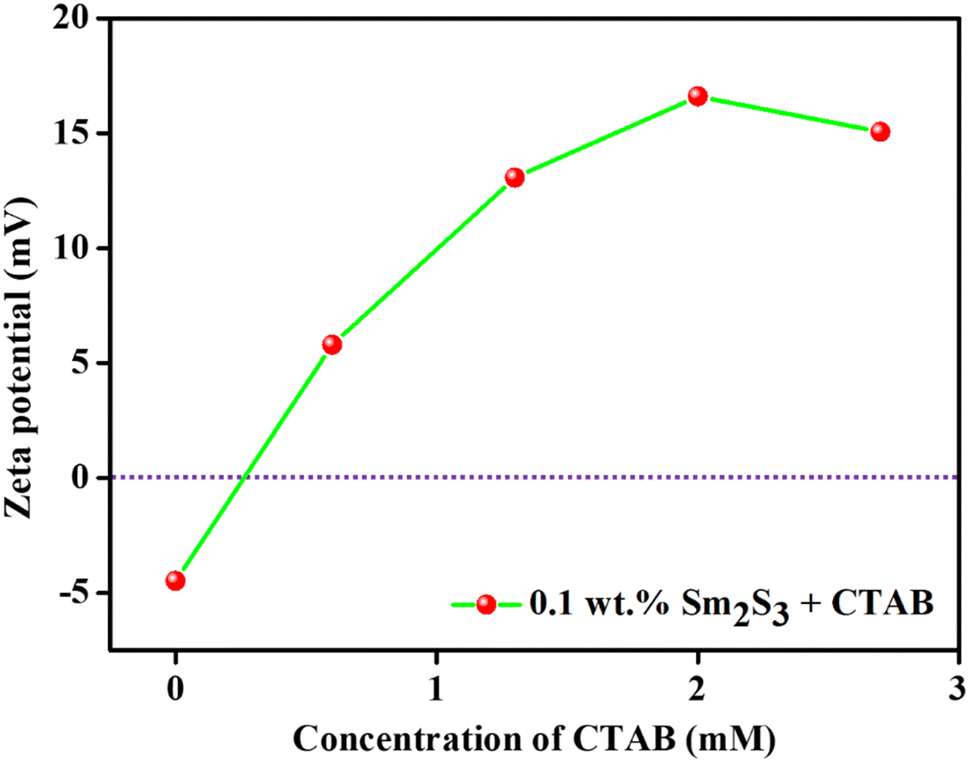 | ||
| Fig. 7 Effect of concentration of CTAB on the surface charge of 0.1 wt% Sm2S3 nanoparticles in pure water (i.e., at pH 6.16). | ||
After the addition of trace amount of CTAB, the emulsifying behaviour of nanoparticles was improved and provided a comparatively more stable O/W pickering emulsion (Fig. 8). Digital images of the pickering emulsion after different time intervals are shown in Fig. S5.† Consequently, with the increasing concentration of CTAB from 0.6 to 2.7 mM, the diameter of emulsion droplets is further decreased from 24 to 17 μm (Fig. 9) after 1 h of storage. Not only that, unlike surfactant-free nanoparticles-mediated pickering emulsion, this newly modified amphiphilic particles provided an exceptional stability to the emulsion droplets even after 1 day of storage. It is therefore interestingly observed that the day after preparation, there are no effective changes detected for the pickering emulsion with 2.0 (1 h: 18 μm and 1 day: 26 μm) and 2.7 mM (1 h: 17 μm and 1 day: 23 μm) of CTAB. Since the nanoparticles became more amphiphilic through CTAB adsorption, it thereby provides higher surface film rigidity and is able to increase the local concentration of CV within the non-polar core.21,35,36 Eventually, hydrophobic dye molecules get a sufficient chance to interact with Sm2S3 and efficiently degraded by photocatalytic reduction.21,50
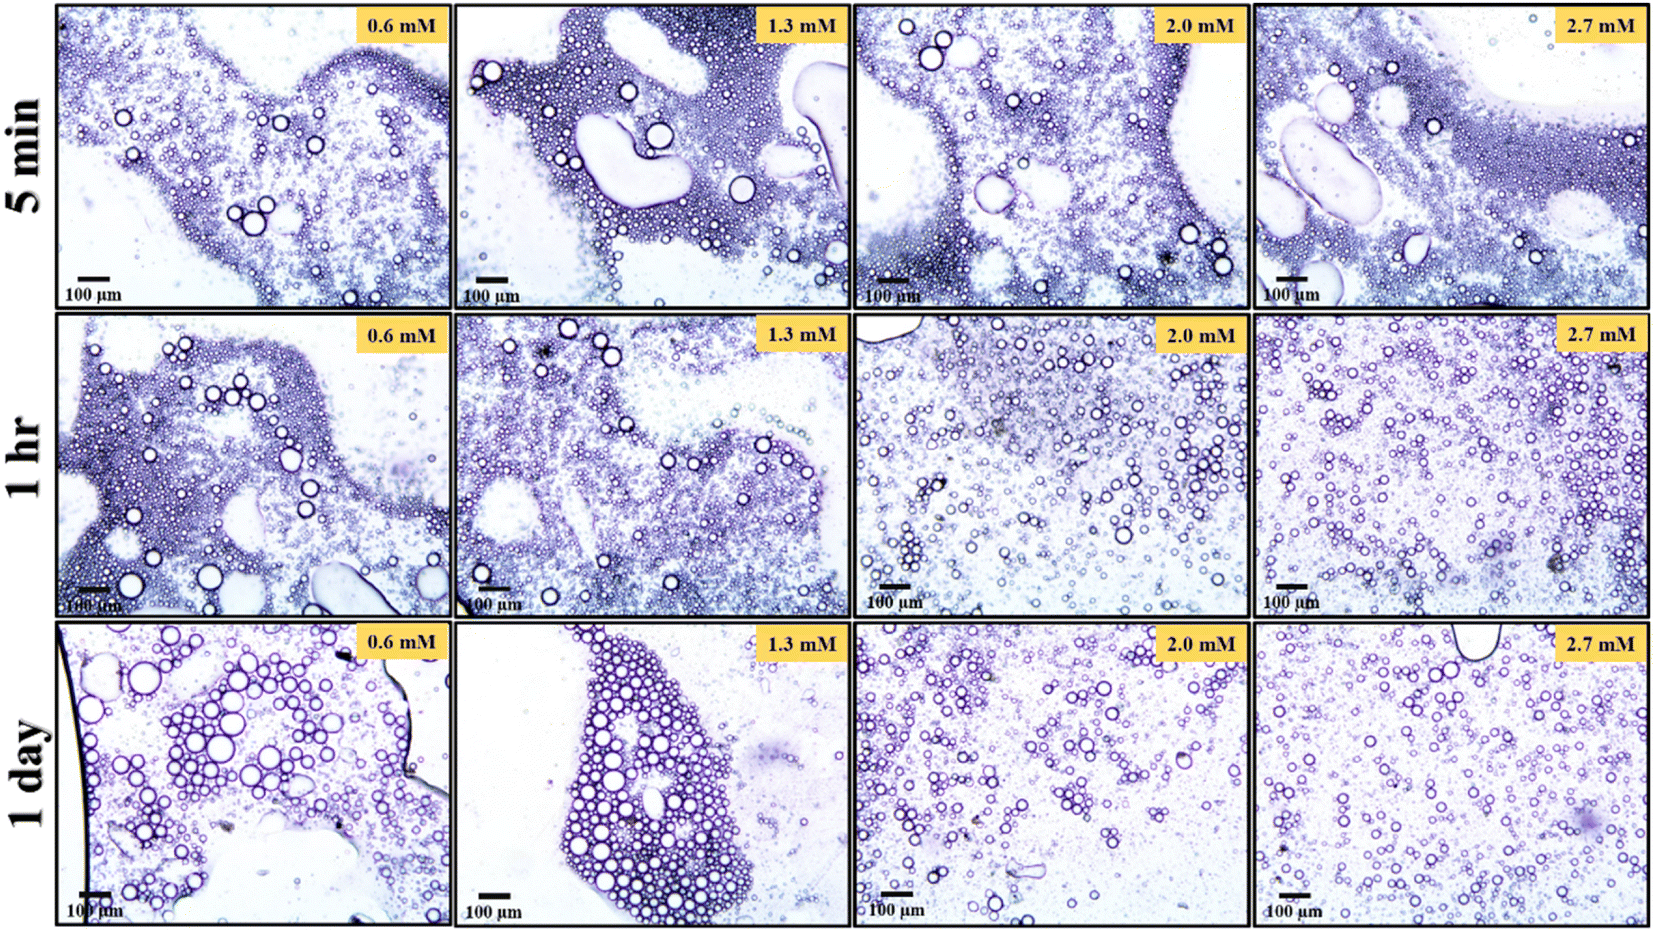 | ||
| Fig. 8 Optical micrographs of pickering emulsion formed by 0.1 wt% Sm2S3 nanoparticles, in situ hydrophobized with 0.6 mM, 1.3 mM, 2.0 mM and 2.7 mM CTAB at different time intervals. | ||
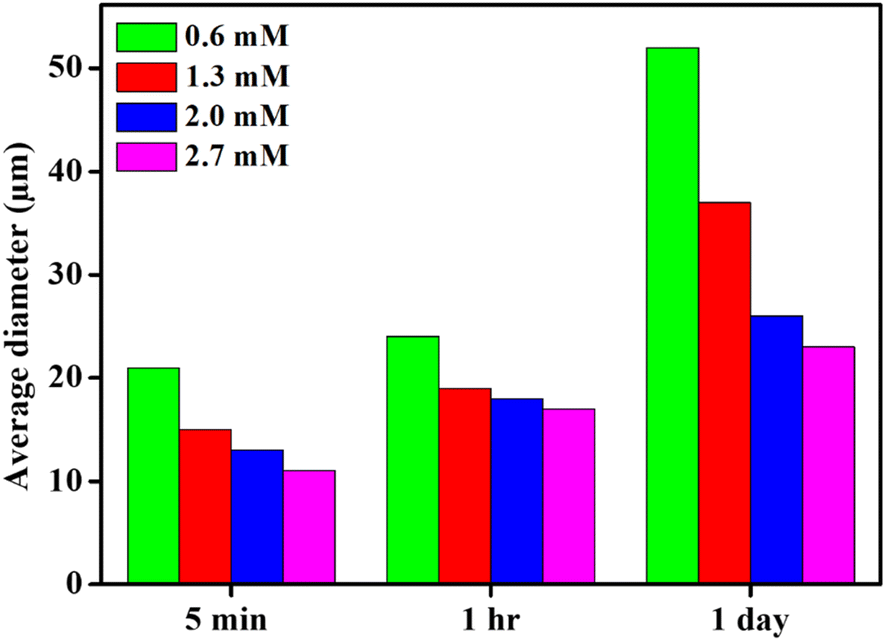 | ||
| Fig. 9 Variation of droplet diameter of pickering emulsion formed by 0.1 wt% Sm2S3 nanoparticles, in situ hydrophobized with 0.6 mM, 1.3 mM, 2.0 mM and 2.7 mM CTAB at different time intervals. | ||
The photocatalytic degradation of CV was examined through the decrease in the absorbance at 592 nm after the subsequent addition of amphiphilic nanoparticles under sunlight irradiation.51 The degradation study was carried out at neutral condition (pH ∼6.16) and examining the effect of CTAB concentration and initial concentration of CV. Throughout the study, 0.1 wt% of nanoparticles were employed; as stated earlier, this maximum concentration of nanoparticles results in a most stable pickering emulsion upon in situ hydrophobization by CTAB (Fig. 8).
The effect of amount of CTAB on the photocatalytic degradation of CV is shown in Fig. 10. Due to this study, four different CTAB solutions with concentrations of 0.6, 1.3, 2.0 and 2.7 mM were employed. In all these studies, the concentrations of CV were adjusted to 5 × 10⁻⁵ (M). For 0.6 mM of CTAB, 72% dye degradation was achieved within 900 s under sunlight exposure. But by a progressive increase in the concentration of CTAB, the degradation efficacy increased dramatically. Almost 100% degradation within just 30 s of exposure of sunlight is achieved by uplifting the concentration of CTAB to 2.7 mM. The degradation efficiency after certain time intervals at different CTAB concentrations is represented in Fig. S6.† It is already established from Fig. 8 that with increasing CTAB concentration, the Pickering emulsion started to get sufficient stability over a long period; therefore, dye molecules are efficiently encapsulated within the core of the emulsion droplets and the local concentration of the dye is increased.50,52–55 Consequently, dye molecules get a sufficient chance to interact with the photocatalyst and participate in effective photocatalytic degradation under sunlight exposure.21,50,52
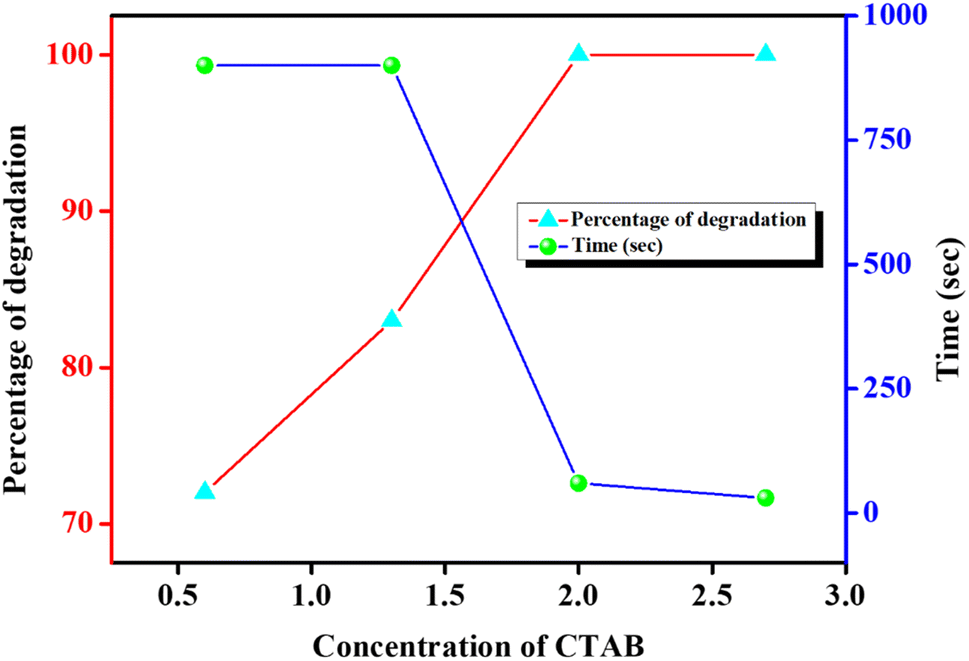 | ||
| Fig. 10 Effect of CTAB concentration on photocatalytic CV (having fixed concentration of 5 × 10⁻⁵ (M)) degradation and corresponding time requirement. | ||
The effect of initial CV concentration on photocatalytic degradation was also examined at a fixed concentration of Sm2S3 (0.1 wt%) and CTAB (2.7 mM) and is represented in Fig. 11. Five different dye concentrations in the range of 2.5 × 10⁻⁵ to 10 × 10−5 (M) was employed and it was observed that with increasing concentration, the degradation efficacy decreased by elevating the required time. For a CV concentration of 2.5 × 10⁻⁵ M CV, almost 99.87% of degradation is achieved within just 40 s of exposure to sunlight. But the degradation efficiency is slightly diminished to 95.91% by raising the requisite time to 900 s for the CV concentration of 10 × 10−5 M. Moreover, for the complete photocatalytic deterioration of CV with 10 × 10−5 M concentration, almost 2760 s is required (Fig. S7†). At very low concentration of CV, almost all the dye molecules interact with the surface of the photocatalyst (Sm2S3) that are already triggered by sunlight. But by increasing the CV concentrations, dye molecules themselves started to cover a larger portion of the surface of the photocatalyst. It may therefore obstruct the surface of the catalyst to activate by the exposure of sunlight.21,50,56,57 This eventually inhibits the formation of ˙OH radicals, which is employed to oxidise and degrade the dye molecules.21,52,58
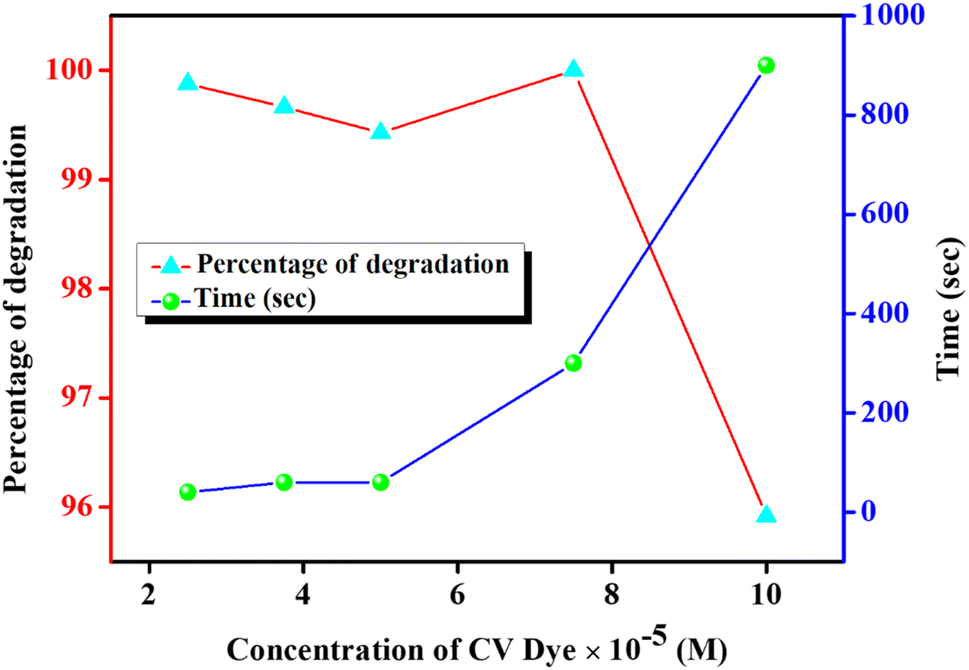 | ||
| Fig. 11 Effect of initial concentration of CV on photocatalytic degradation in the pickering emulsion template (having a fixed concentration of CTAB (2.7 mM) and Sm2S3 (0.1 wt%)) with corresponding time requirement. | ||
The ability of repeated utilisation of a photocatalyst is a critical factor from the stand point of cost-effective industrial use. The pickering emulsion based on Sm2S3 (0.1 wt%, in situ hydrophobized with CTAB (2.7 mM)) can be employed for three times in photocatalytic CV degradation (as shown in Fig. 12). The nanoparticles modified with CTAB were recovered through centrifugation, dried over time, and employed again in pickering emulsion preparation, which is thereafter involved in the next photocatalytic CV degradation. In the 2nd cycle, photocatalytic degradation was decreased to 87.5% within 210 s. But in the 3rd repeat cycle, the degradation efficiency was dramatically decreased to 56.6% after 3600 s. Since the efficacy of degradation was almost reduced to 50%, just after the 3rd cycle, no further repetitions were done.
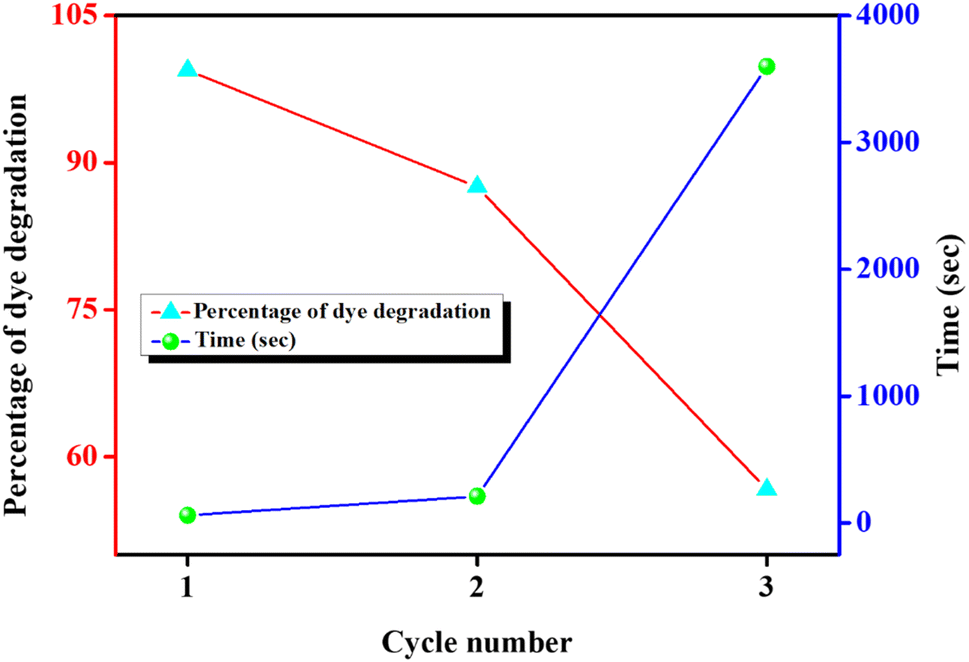 | ||
| Fig. 12 Reusability of the pickering emulsion (based with Sm2S3 (0.1 wt%) in situ hydrophobized with CTAB (2.7 mM)) in photocatalytic CV degradation. | ||
Eqn (2)–(7) describe the sequence of reactions that are believed to be involved in the CV degradation process in the pickering emulsion (Fig. 13). The amphiphilic Sm2S3 nanoparticles are present in the oil–water interface and increase the local concentration of dye molecules inside the emulsion droplets. The electrons in Sm2S3 absorb photons, which causes the formation of hole pair inside the nanoparticles.34,59,60
| SmF3 + hυ(UV) → SmF3*(eCB− + hυB+) | (2) |
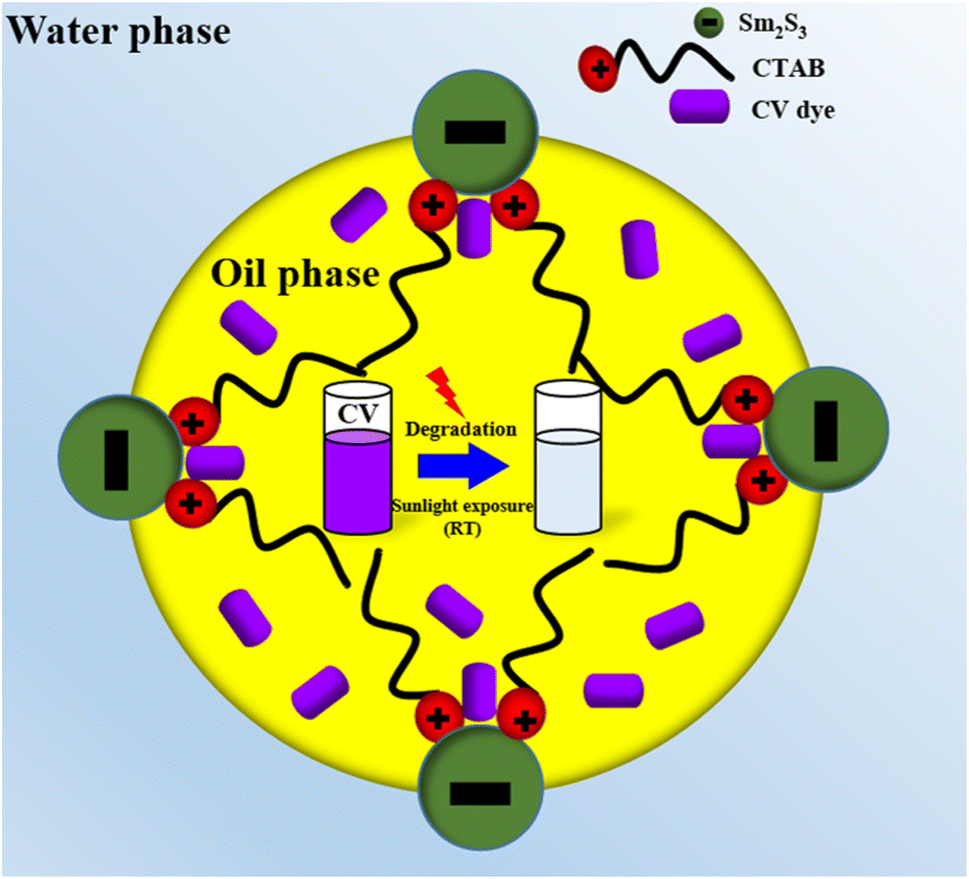 | ||
| Fig. 13 Schematic representation of the photocatalytic degradation of CV in the pickering emulsion. | ||
As demonstrated in eqn (2), photogenerated holes (hυB+) immediately oxidise the dye to reactive intermediates. In an alternative mechanisms, oxygen and water molecules are adsorbed on the surface of the photocatalyst (Sm2S3). Superoxide ions (˙O2−) and unstable hydroxyl radicals (˙OH) are produced when these molecules (O2 and H2O) interact with photoexcited electrons (eCB−) and electron–hole pairs (hυB+), respectively (eqn (4) and (5)).34,59 The CV is then oxidised into inorganic compounds by interacting with these ionic or radical species (eqn (6) and (7)).
| hυB+ + CV → CV+ → oxidation of CV | (3) |
| O2 + eCB− → ˙O2− | (4) |
| H2O + hυB+ → ˙OH + H+ | (5) |
| ˙O2− + CV dye → CO2 +H2O | (6) |
| ˙OH + CV dye → CO2 +H2O | (7) |
The experimental results are subjected to the Langmuir–Hinshelwood kinetic model.59,61 The kinetics of heterogeneous catalytic reactions are dealt with in this model. The degradation of CV in the pickering emulsion (stabilised by Sm2S3 nanoparticles, in situ hydrophobized with CTAB) by sunlight exposure follow the pseudo first order kinetics.
 | (8) |
Upon integration of the above eqn (8),
 | (9) |
According to Beer's law, the concentration is proportionate to the absorbance of CV at 592 nm in the UV-vis spectra. The −ln( ) varies linearly with exposure time (t) (as presented in Fig. S8†), indicating that the photocatalytic degradation of CV in the Pickering emulsion followed pseudo first order reaction kinetics. Table 3 summarises the pseudo first order rate constants that are obtained by the linear fit of the −ln(
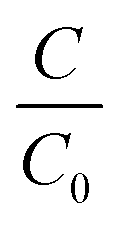 ) versus time curves.
| wt% of samarium sulfide | CTAB concentration (mM) | CV dye concentration × 10−5 (M) | Rate constant (s−1) |
|---|---|---|---|
| 0.1 | 0.6 | 5 | 0.0011 |
| 1.3 | 0.0015 | ||
| 2.0 | 0.057 | ||
| 2.7 | 0.086 | ||
| 2.7 | 2.5 | 0.167 | |
| 3.75 | 0.113 | ||
| 5.0 | 0.086 | ||
| 7.5 | 0.015 | ||
| 10.0 | 0.0009 |
3.7. Characterisation of PANI@Sm2S3 nanocomposites
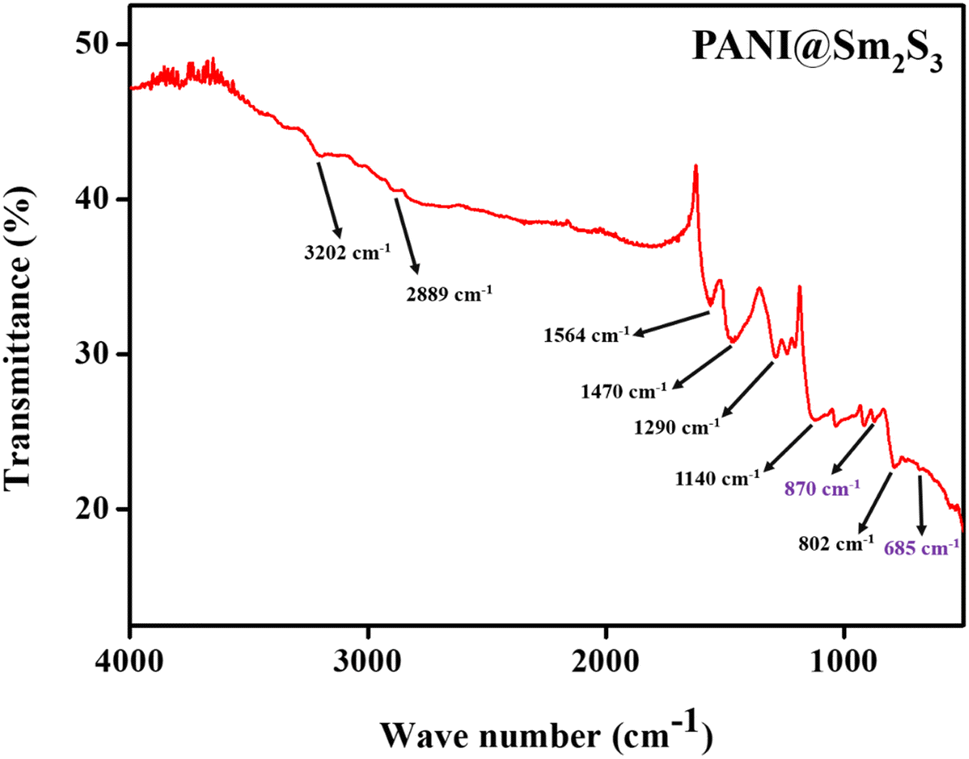
With the assistance of a stable pickering emulsion (stabilised by reverse micellar mediated Sm2S3 nanospheres), the polymerisation of aniline at the toluene/water interface was induced by the addition of the oxidant potassium persulfate. Upon the addition of an oxidant, the colour of the emulsion systems gradually turns into dark green, which is a clear indication of the formation of PANI@Sm2S3 composites.39 For the further support of the synthesised composites, UV, IR and 1H NMR instrumentational analyses were performed. The effect of the employed Sm2S3 on the size and shape of PANI@Sm2S3 composites was further examined through FESEM microstructural analysis.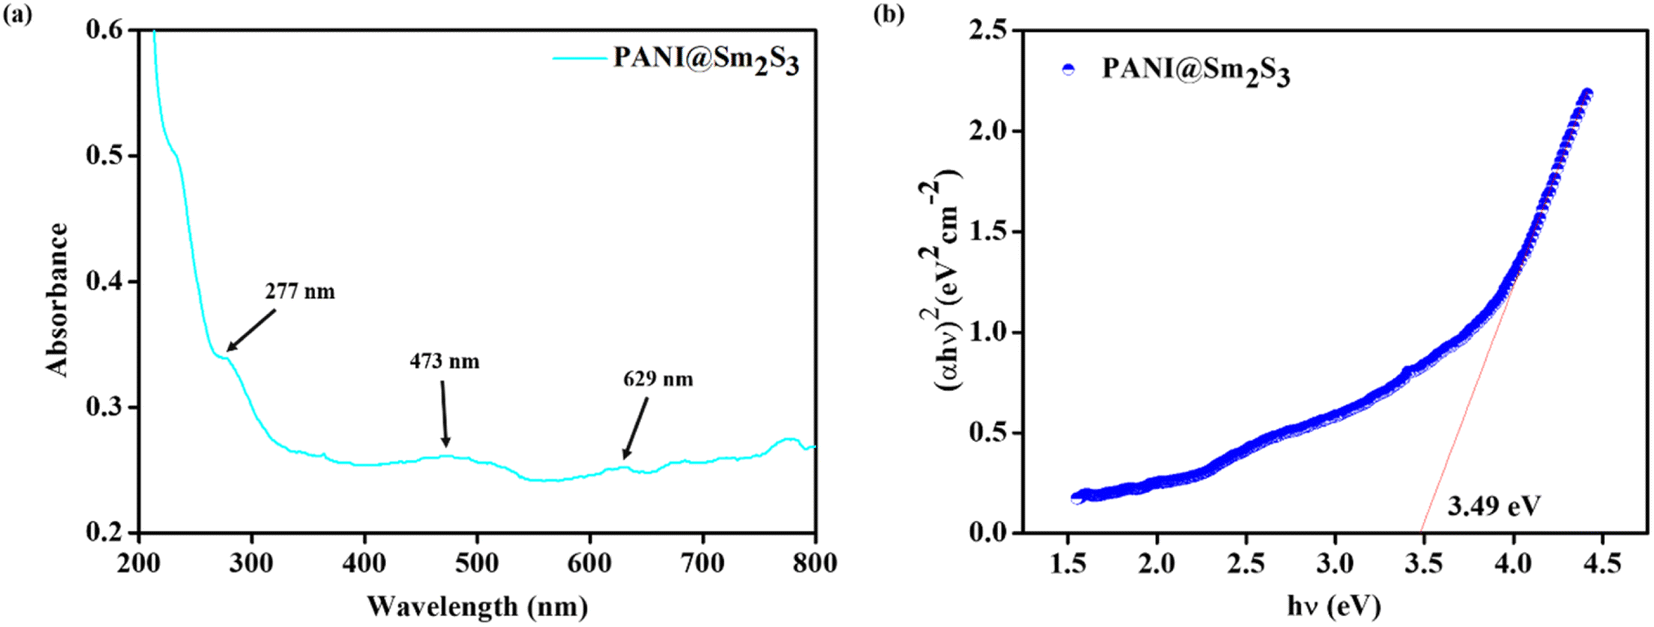 | ||
| Fig. 14 (a) UV-vis absorbance spectra and (b) energy band gap calculation plot for PANI@Sm2S3 composites. | ||
The absorption coefficient (α), which is calculated as a function of incident photon energy hυ, can be used to determine the optical band gap Eg.62,63 It is generally represented by the following relation.
| αhυ = B (hυ − Eg)m | (10) |
By extrapolating the linear part of the plot (αhυ)2versus hυ to αhυ = 0, the optical band gap values for PANI@Sm2S3 are calculated. It is represented in Fig. 14(b) and found to be 3.49 eV for PANI@Sm2S3 composites. These results are quite similar to those that Sasikumar et al., where PANI@TiO2 nanocomposites were employed.62 For the production of excited carriers and an increase in conductivity, this narrow band-gap would be more advantageous.
 | ||
| Fig. 15 FTIR spectrum of PANI@Sm2S3 composites. | ||
| Band position (cm−1) of PANI@Sm2S3 | Assignment |
|---|---|
| 802 | Para substituted |
| 1140 | Benzenoid rings |
| 1290 | C–N stretching |
| 1470 | C![[double bond, length as m-dash]](https://www.rsc.org/images/entities/char_e001.gif) C stretching (aromatic ring) C stretching (aromatic ring) |
| 1564 | Quinoid rings |
| 2889 | C–H stretching (aromatic ring) |
| 3202 | N–H stretching |
 | ||
| Fig. 16 1H-NMR spectrum (in CDCl3 solvent) of PANI@Sm2S3 composites. | ||
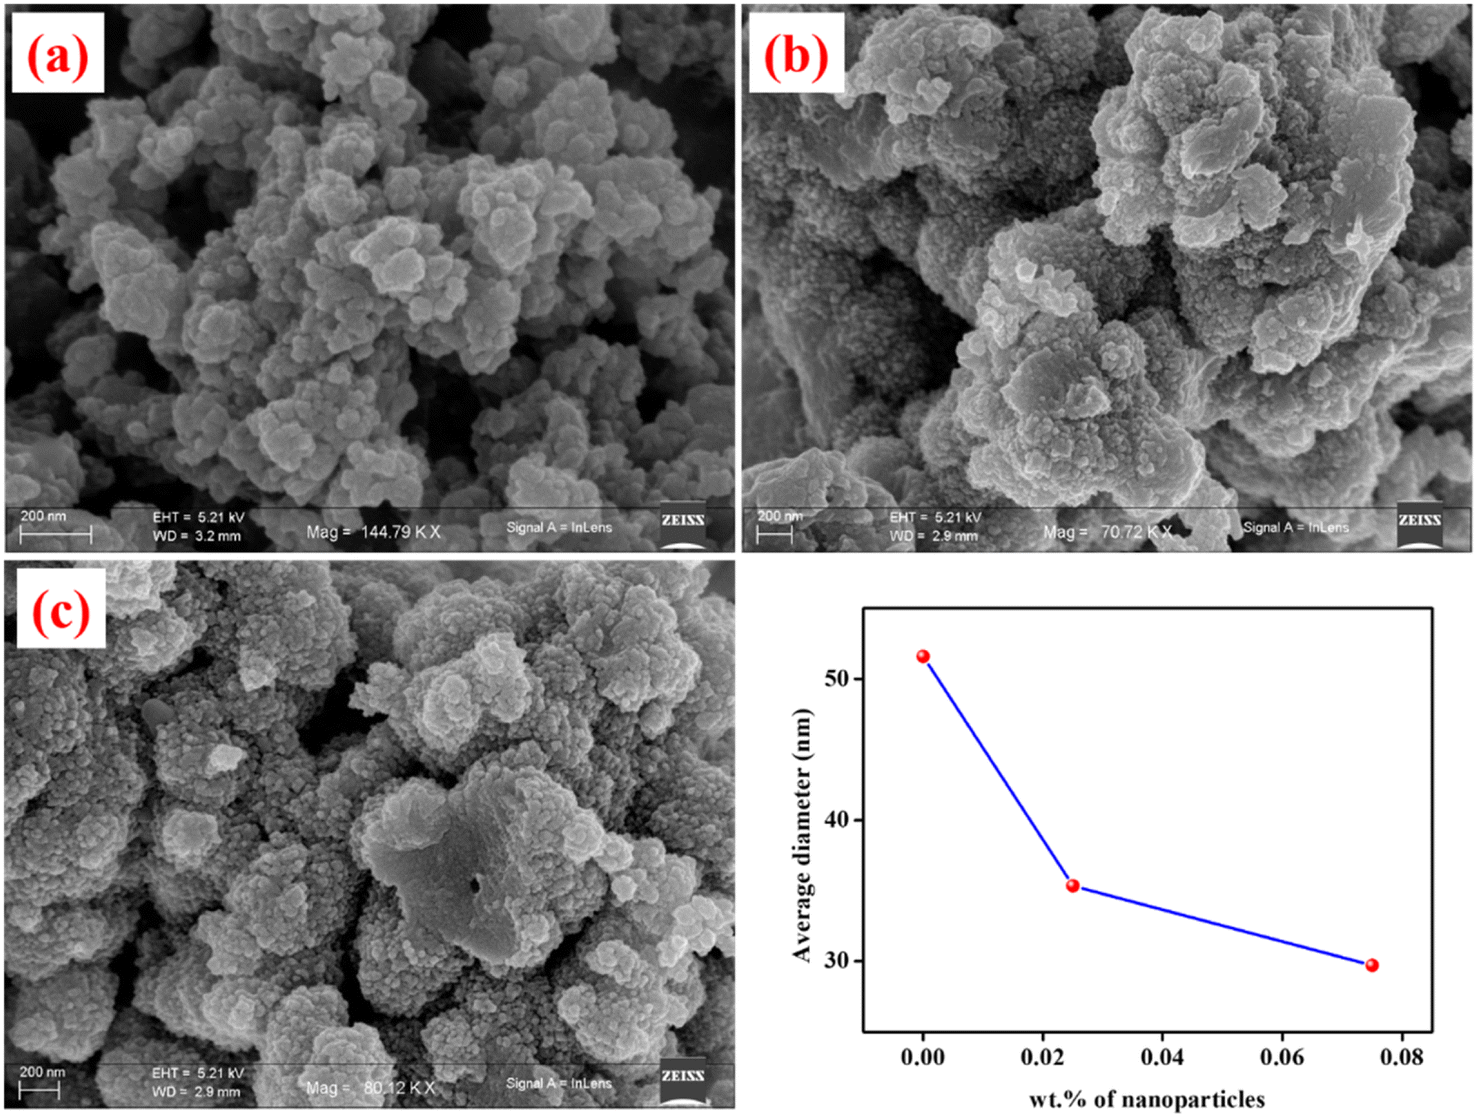 | ||
| Fig. 17 FESEM images of PANI@Sm2S3 composites having different wt% of Sm2S3 in aqueous phase (a) 0, (b) 0.025 and (c) 0.075. | ||
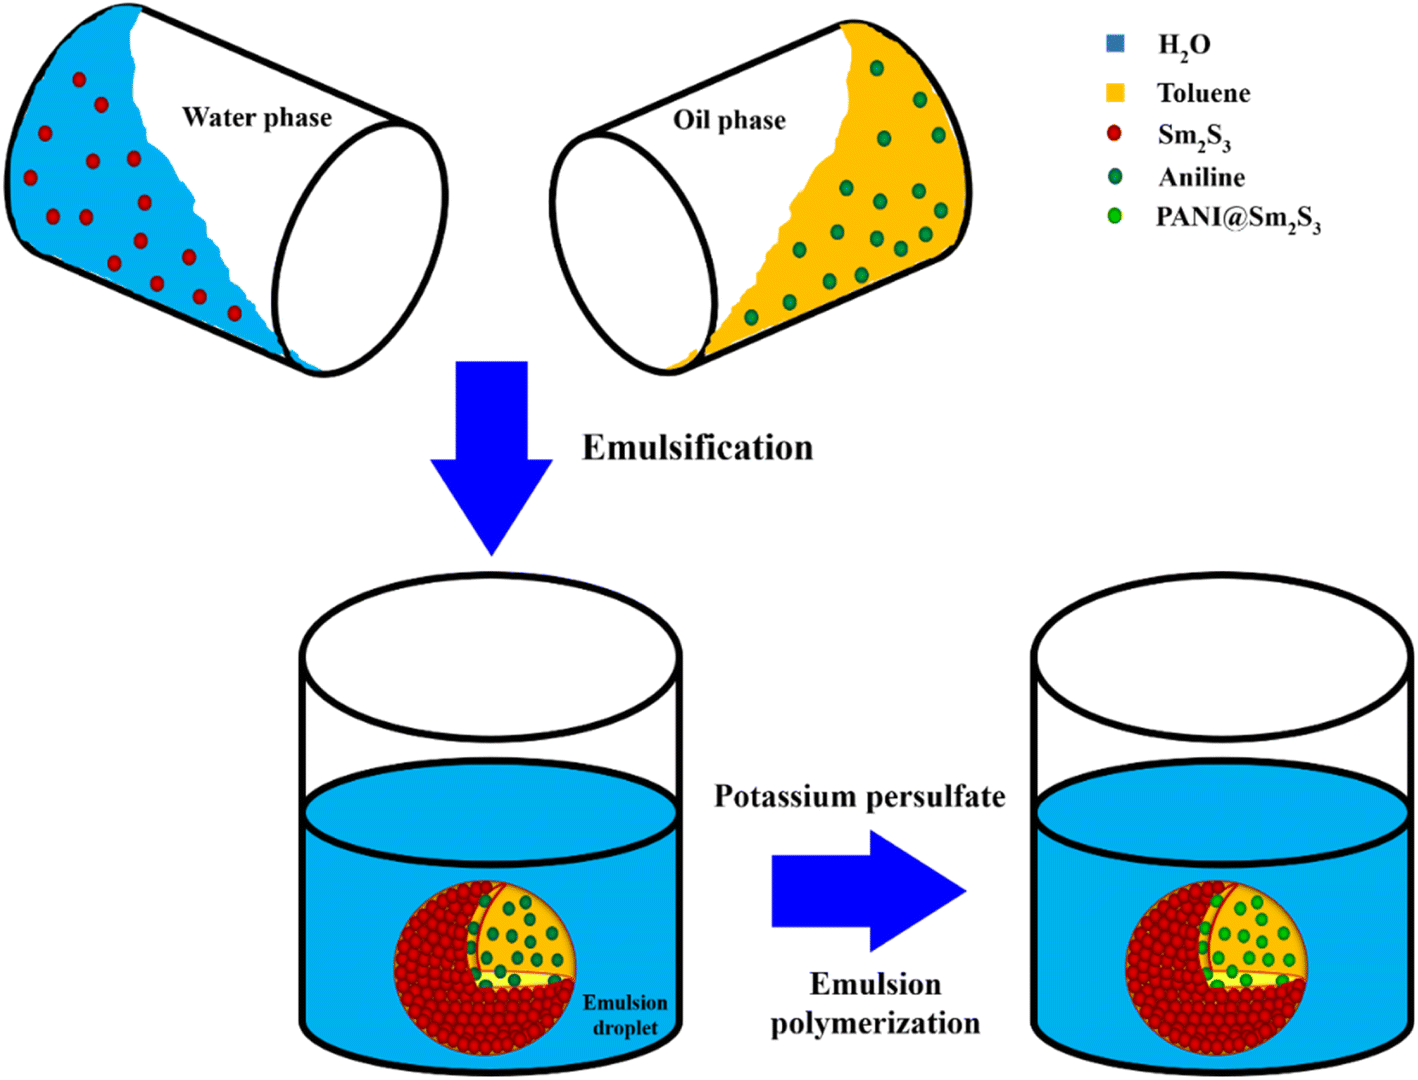 | ||
| Fig. 18 Schematic representation of the synthesis of PANI@Sm2S3 nanocomposites through Pickering emulsion polymerisation. | ||
4. Conclusion
The current study involves the evaluation of W/O microemulsion-mediated Sm2S3 nanoparticles and its subsequent employment in Pickering emulsion-based CV degradation and PANI@Sm2S3 nanocomposites synthesis. The evaluation of nanospheres inside the core of reverse micelles was done through DLS, TEM and FESEM instrumentations. According to DLS studies, the formation of nanostructures involves two phases: nucleation phase (5–30 min of the reaction) and growth phase (30–120 min of the reaction). The two phases of the evolution of nanospheres have been established by microstructural analysis using TEM and FESEM. Although the synthesised nanospheres play a role in the formation of O/W pickering emulsions, only Sm2S3-stabilised pickering emulsion is insufficient for photocatalytic CV degradation. Most effective O/W pickering emulsions have been developed through the in situ hydrophobization of negatively-charged Sm2S3 nanoparticles (0.1 wt%) by an appropriate quantity of a cationic CTAB surfactant. The local concentration of the dye is enhanced by the stable pickering emulsion, which effectively encapsulated the dye molecules within the core of emulsion droplets. As a result, dye molecules have an adequate opportunity to interact with Sm2S3, the photocatalyst, and degrade effectively. Under optimal conditions, pickering emulsion stabilised by 0.1 wt% of Sm2S3 nanoparticles in situ hydrophobized with 2.7 mM of CTAB results in almost 100% degradation of CV within just 30 s. According to the Langmuir–Hinshelwood kinetic model, the kinetics of heterogeneous catalytic reactions of CV degradation followed the pseudo first order kinetics. Moreover, under optimal conditions, this Pickering emulsion can be successfully employed for three repetitions. Novel PANI@Sm2S3 spherical nanocomposites are synthesised through Pickering emulsion polymerisation employing only solid Sm2S3 as a pickering stabiliser. UV, IR and 1H-NMR investigations revealed the formation of PANI@Sm2S3 composites within the core of the emulsion droplets. The analysis of FESEM images revealed that the size and shape of the composites strongly depends on the amount of wt% nanoparticles (for 0.025 wt% 35 nm and 0.075 wt% 29 nm) employed in the dispersion. The introduction of the Sm2S3-stabilised pickering emulsion well-engineered the shape and size of the polyaniline, while in the absence of nanoparticles, only agglomerated particles with largely deviated spherical symmetry are observed. Therefore, reverse micellar-mediated synthesised Sm2S3 nanospheres participate in pickering emulsion formation, which act as a scaffold for photocatalytic CV degradation as well as the emulsion polymerisation of aniline.Conflicts of interest
There are no conflicts to declare.Acknowledgements
S. M. R. acknowledges UGC, govt. of India for UGC Maulana Azad National Fellowship. S. M. R., N. K., T. M. and B. S. thankfully acknowledge Department of Chemistry, Visva-Bharati University, West Bengal, for Powder X-ray diffraction facility. Authors also acknowledge the DST-FIST Program of Integrated Science Education and Research Centre, Visva-Bharati, and the DST-PURSE Project, Visva-Bharati, for providing IR, BET and FESEM instrumental facilities.References
- S. Yu, M. Lv, G. Lu, C. Cai, J. Jiang and Z. Cui, Langmuir, 2021, 37, 10683–10691 CrossRef CAS PubMed.
- M. Xu, W. Zhang, J. Jiang, X. Pei, H. Zhu, Z. Cui and B. P. Binks, Langmuir, 2020, 36, 15543–15551 CrossRef CAS PubMed.
- S. M. Rahaman, M. Chakraborty, T. Mandal, S. Kundu, S. Dhibar, D. Kumar, S. M. Ibrahim, M. Chakravarty and B. Saha, J. Mol. Liq., 2023, 370, 121204 CrossRef.
- S. Kundu, P. Karmakar, S. M. Rahaman, M. Mitra, S. Rajwar, S. Dhibar, M. Layek, P. Sar and B. Saha, New J. Chem., 2023, 47, 4364–4373 RSC.
- B. Chowdhury, S. M. Rahaman, A. Ghosh, K. Mahali, P. Sar and B. Saha, J. Mol. Liq., 2022, 368, 120817 CrossRef CAS.
- D. Xie, Y. Jiang, Y. Zhang and B. Song, Langmuir, 2021, 37, 5846–5853 CrossRef CAS PubMed.
- L. Xue, H. Li, X. Pei, Z. Cui and B. Song, Langmuir, 2022, 38, 14109–14117 CrossRef CAS PubMed.
- G. Chen, Z. Yi, X. Chen, X. Ma, W. Su and X. Li, ACS Appl. Nano Mater., 2021, 4, 652–665 CrossRef CAS.
- M.-L. Song, H.-Y. Yu, L.-M. Chen, J. Zhu, Y.-Y. Wang, J. Yao, Z. Zou and K. C. Tam, ACS Sustainable Chem. Eng., 2019, 7, 6969–6980 CrossRef CAS.
- C. Wang, H. Chi, F. Zhang, X. Wang, J. Wang, H. Zhang, Y. Liu, X. Huang, Y. Bai, K. Xu and P. Wang, Chem. Sci., 2022, 13, 8766 RSC.
- Y. Zhu, T. Fu, K. Liu, Q. Lin, X. Pei, J. Jiang, Z. Cui and B. P. Binks, Langmuir, 2017, 33, 5724–5733 CrossRef CAS PubMed.
- L. Liu, X. Pu, Y. Zhou, X. Wu, D. Luo and Z. Ren, Energy Fuels, 2020, 34, 1317–1328 CrossRef CAS.
- W. Xue, H. Yang and Z. Du, Langmuir, 2017, 33, 10283–10290 CrossRef CAS PubMed.
- M.-L. Song, H.-Y. Yu, L.-M. Chen, J. Zhu, Y.-Y. Wang, J. Yao, Z. Zou and K. C. Tam, ACS Sustainable Chem. Eng., 2019, 7, 6969–6980 CrossRef CAS.
- P. Zhu, F. Wang, Y. Ding, S. Zhang, C. Gao, P. Liu and M. Yang, Langmuir, 2021, 37, 4082–4090 CrossRef CAS PubMed.
- Z.-G. Cui, C.-F. Cui, Y. Zhu and B. P. Binks, Langmuir, 2012, 28, 314–320 CrossRef PubMed.
- X. Li, P. Zhu, X. Lv, G. Yan and H. Lu, Langmuir, 2020, 36, 14288–14295 CrossRef CAS PubMed.
- K. Liu, J. Jiang, Z. Cui and B. P. Binks, Langmuir, 2017, 33, 2296–2305 CrossRef CAS PubMed.
- S. Yu, H. Zhang, J. Jiang, Z. Cui, W. Xia and B. P. Binks, Green Chem., 2020, 22, 5470–5475 RSC.
- P. A. Demina and T. V. Bukreeva, Nanotechnol. Russ., 2018, 13, 425–429 CrossRef CAS.
- N. Fessi, M. F. Nsib, Y. Chevalier, C. Guillard, F. Dappozze, A. Houas, L. Palmisano and F. Parrino, Langmuir, 2019, 35, 2129–2136 CrossRef CAS PubMed.
- H. Voisin, X. Falourd, C. Rivard and I. Capron, JCIS Open, 2021, 3, 100014 CrossRef.
- S. Sharma and A. K. Ganguli, J. Phys. Chem. B, 2014, 118, 4122–4131 CrossRef CAS PubMed.
- A. Rajapantulu and R. Bandyopadhyaya, Langmuir, 2021, 37, 6623–6631 CrossRef CAS PubMed.
- S. M. Rahaman, A. Bardhan, T. Mandal, M. Chakraborty, K. Karmakar, S. Dhibar, S. Sharma, M. Chakravarty, S. M. Ibrahim and B. Saha, New J. Chem., 2023, 47, 10309–10321 RSC.
- S. Sharma, N. Pal, P. K. Chowdhury, S. Sen and A. K. Ganguli, J. Am. Chem. Soc., 2012, 134, 19677–19684 CrossRef CAS PubMed.
- S. M. Rahaman, M. Chakraborty, S. Kundu, S. Dhibar, D. Kumar, S. M. Ibrahim, M. Chakravarty and B. Saha, J. Hazard. Mater., 2023, 11, 100348 CrossRef CAS.
- S. M. Rahaman, A. Bardhan, T. Mandal, M. Chakraborty, N. Khatun, M. Layek, S. Sharma, M. Chakravarty, R. Saha and B. Saha, J. Mol. Liq., 2023, 391, 123333 CrossRef.
- Z. Huang, J. T. Koubek, A. Sellinger and M. C. Beard, ACS Appl. Nano Mater., 2022, 5, 3183–3187 CrossRef CAS.
- S. Roy and J.-W. Rhim, Int. J. Biol. Macromol., 2021, 193, 2038–2046 CrossRef CAS PubMed.
- E. B. Ko and J.-Y. Kim, Food Hydrocolloids, 2021, 120, 106984 CrossRef CAS.
- Q. Ruan, J. Guo, Z. Wan, J. Ren and X. Yang, Food Hydrocolloids, 2017, 70, 219–228 CrossRef CAS.
- Y. Chen, W. Wei, Y. Zhu, J. Luo, R. Liu and X. Liu, ACS Appl. Mater. Interfaces, 2020, 12, 4821–4832 CrossRef CAS PubMed.
- Y. Hanifehpour, B. Soltani, A. R. Amani-Ghadim, B. Hedayati, B. Khomami and S. W. Joo, Mater. Res. Bull., 2016, 76, 411–421 CrossRef CAS.
- N. Fessi, M. F. Nsib, Y. Chevalier, C. Guillard, F. Dappozze, A. Houas, L. Palmisano and F. Parrino, Langmuir, 2020, 36, 13545–13554 CrossRef CAS PubMed.
- N. Fessi, M. F. Nsib, L. Cardenas, C. Guillard, F. Dappozze, A. Houas, F. Parrino, L. Palmisano, G. Ledoux, D. Amans and Y. Chevalier, J. Phys. Chem. C, 2020, 124(21), 11456–11468 CrossRef CAS.
- C. Han, Y. Li, W. Wang, Y. Hou and D. Chen, Sci. Total Environ., 2020, 704, 135356 CrossRef CAS PubMed.
- J. N. Kim, Y. Z. Dong and H. J. Choi, ACS Omega, 2020, 5, 7675–7682 CrossRef CAS PubMed.
- Y. Wang, B. Hu, J. Luo, Y. Gu and X. Liu, ACS Appl. Energy Mater., 2021, 4, 7721–7730 CrossRef CAS.
- G. Yin, Z. Zheng, H. Wang, Q. Du and H. Zhang, J. Colloid Interface Sci., 2013, 394, 192–198 CrossRef CAS PubMed.
- B. P. Binks, Curr. Opin. Colloid Interface Sci., 2002, 7, 21–41 CrossRef CAS.
- S. A. F. Bon and P. J. Colver, Langmuir, 2007, 23, 8316–8322 CrossRef CAS PubMed.
- T. T. Ghogarea, V. C. Lokhandeb, T. Jib, U. M. Patila and C. D. Lokhandea, Surf. Interfaces, 2020, 19, 100507 CrossRef.
- V. S. Kumbhar, A. C. Lokhande, N. S. Gaikwad and C. D. Lokhande, Mater. Sci. Semicond. Process., 2015, 33, 136–139 CrossRef CAS.
- C. M. Marin, L. Wang, J. R. Brewer, W.-N. Mei and C. L. Cheung, J. Alloys Compd., 2013, 563, 293–299 CrossRef CAS.
- Sunaina, S. K. Mehta, A. K. Ganguli and S. Vaidya, J. Mol. Liq., 2021, 326, 115302 CrossRef CAS.
- Sunaina, V. Sethi, S. K. Mehta, A. K. Ganguli and S. Vaidya, Phys. Chem. Chem. Phys., 2019, 21, 336–348 RSC.
- T. Wang and K.-F. Aguey-Zinsou, Energy Technol., 2019, 7, 1801159 CrossRef.
- D. Xie, Y. Jiang, K. Li, X. Yang and Y. Zhang, ACS Omega, 2022, 7, 29153–29160 CrossRef CAS PubMed.
- M. F. Nsib, A. Maayoufi, N. Moussa, N. Tarhouni, A. Massouri, A. Houas and Y. Chevalier, J. Photochem. Photobiol., A, 2013, 251, 10–17 CrossRef CAS.
- M. F. Sanakousar, C. C. Vidyasagar, V. M. Jiménez-Pérez, B. K. Jayanna, D. Mounesh, A. H. Shridhar and K. Prakash, J. Hazard. Mater., 2021, 2, 100004 CrossRef CAS.
- W. Wu, S. Gao, W. Tu, J. Chen and P. Zhang, Particuology, 2010, 8, 453–457 CrossRef CAS.
- Y. Liu, L. Zong, C. Zhang, W. Liu, A. Fakhri and V. K. Gupta, Surf. Interfaces, 2021, 26, 101292 CrossRef CAS.
- A. Bahadoran, Q. Liu, B. Liu, J. Gu, D. Zhang, A. Fakhri and V. K. Gupta, J. Photochem. Photobiol., A, 2021, 416, 113316 CrossRef CAS.
- A. A. Mahdi, R. A. Obeid, K. Abdullah, S. Mohammed, A. J. Kadhim, M. F. Ramadan, B. M. Hussien, A. Alkahtani, F. A. Ali, A. G. Alkhathami, L. Al-Fatolahi and A. Fakhri, Surf. Interfaces, 2023, 40, 102970 CrossRef CAS.
- Y. Chen, A. Jihad, F. Hussam, S. H. Z. Al-Abdeen, J. M. Hussein, Z. H. Adhab, Z. H. A. Alzahraa, I. Ahmad, L. Fatolahi and B. J. Janani, Surf. Interfaces, 2023, 38, 102830 CrossRef CAS.
- A. Syed, A. M. Elgorban, A. H. Bahkali, R. Eswaramoorthy, M. Verma, R. S. Varma and B. J. Janani, J. Taiwan Inst. Chem. Eng., 2023, 149, 105004 CrossRef CAS.
- K. Muzammil, M. Zaid, U. Abdul-Reda Hussein, M. H. Abduljabbar, S. S. Jalal, M. A. A. Najm, M. Y. Alshahrani, A. F. Almulla, A. Alsaalamy, R. F. Amer and B. J. Janani, Mater. Sci. Semicond. Process., 2023, 168, 107847 CrossRef CAS.
- Z. Kalaycıoğlu, B. Ö. Uysal, Ö. Pekcan and F. B. Erim, ACS Omega, 2023, 8(14), 13004–13015 CrossRef PubMed.
- E. Kusmierek, Catalysts, 2020, 10, 1435 CrossRef CAS.
- F. Zheng and Z. Zhu, ACS Appl. Nano Mater., 2018, 1, 1141–1149 CrossRef CAS.
- M. Sasikumar and N. P. Subiramaniyam, J. Mater. Sci.: Mater. Electron., 2018, 29, 7099–7106 CrossRef CAS.
- M. Shaban, M. Rabial, W. Fathallah, N. Abd El-Mawgoud, A. Mahmoud, H. Hussien and O. Said, J. Polym. Environ., 2018, 26, 434–442 CrossRef CAS.
- N. K. Jangid, N. P. S. Chauhan and P. B. Punjabi, J. Macromol. Sci., Part A, 2015, 52, 95–104 CrossRef CAS.
- A. G. Mustafin, L. R. Latypova, A. N. Andriianova, I. N. Mullagaliev, S. M. Salikhov, R. B. Salikhov and G. S. Usmanova, RSC Adv., 2021, 11, 21006 RSC.
Footnote |
| † Electronic supplementary information (ESI) available. See DOI: https://doi.org/10.1039/d3na01067h |
| This journal is © The Royal Society of Chemistry 2024 |