
 Open Access Article
 This Open Access Article is licensed under a Creative Commons Attribution-Non Commercial 3.0 Unported Licence
Impact of organic phosphates on the structure and composition of short-range ordered iron nanophases†
Zhengzheng
Chen
 *ab,
Jeffrey Paulo H.
Perez
*a,
Glen J.
Smales
c,
Roberts
Blukis‡
a,
Brian R.
Pauw
c,
Jessica A.
Stammeier
a,
Jörg
Radnik
c,
Andrew J.
Smith
d and
Liane G.
Benning
ab
*ab,
Jeffrey Paulo H.
Perez
*a,
Glen J.
Smales
c,
Roberts
Blukis‡
a,
Brian R.
Pauw
c,
Jessica A.
Stammeier
a,
Jörg
Radnik
c,
Andrew J.
Smith
d and
Liane G.
Benning
ab
aGFZ German Research Center for Geosciences, Telegrafenberg, 14473 Potsdam, Germany. E-mail: zhchen@gfz-potsdam.de; jpperez@gfz-potsdam.de
bDepartment of Earth Sciences, Freie Universität Berlin, Malteserstraße 74-100, 12249 Berlin, Germany
cBundesanstalt für Materialforschung und-prüfung (BAM), Unter den Eichen 87, 12205 Berlin, Germany
dDiamond Light Source, Harwell Science and Innovation Campus, Didcot, Oxfordshire OX11 0DE, UK
First published on 11th April 2024
Abstract
Organic phosphates (OP) are important nutrient components for living cells in natural environments, where they readily interact with ubiquitous iron phases such as hydrous ferric oxide, ferrihydrite (FHY). FHY partakes in many key bio(geo)chemical reactions including iron-mediated carbon storage in soils, or iron-storage in living organisms. However, it is still unknown how OP affects the formation, structure and properties of FHY. Here, we document how β-glycerophosphate (GP), a model OP ligand, affects the structure and properties of GP–FHY nanoparticles synthesized by coprecipitation at variable nominal molar P/Fe ratios (0.01 to 0.5). All GP–FHY precipitates were characterized by a maximum solid P/Fe ratio of 0.22, irrespective of the nominal P/Fe ratio. With increasing nominal P/Fe ratio, the specific surface area of the GP–FHY precipitates decreased sharply from 290 to 3 m2 g−1, accompanied by the collapse of their pore structure. The Fe–P local bonding environment gradually transitioned from a bidentate binuclear geometry at low P/Fe ratios to monodentate mononuclear geometry at high P/Fe ratios. This transition was accompanied by a decrease in coordination number of edge-sharing Fe polyhedra, and the loss of the corner-sharing Fe polyhedra. We show that Fe(III) polymerization is impeded by GP, and that the GP–FHY structure is highly dependent on the P/Fe ratio. We discuss the role that natural OP-bearing Fe(III) nanophases have in biogeochemical reactions between Fe–P and C species in aquatic systems.
Introduction
Ferrihydrite (FHY), a nanocrystalline Fe(III) oxyhydroxide, is not only ubiquitous in soils and sediments,1,2 but also in living cells as in the core of ferritin proteins.3,4 FHY is formed through hydrolysis of Fe(III) (monomers), undergoing olation and oxolation to form Fe oligomers and clusters. This leads to the nucleation of these 2–5 nm sized nanoparticles that grow and ultimately coagulate to poorly ordered aggregates.2,5,6 Although the exact structure of FHY is still debated, the most used model is based on a core–shell structure with an Fe13 core and a water-rich/Fe-depleted surface layer.6–11 The nanocrystalline nature of FHY results in a high surface area, and in turn, high reactivity with both organic matter (OM)12–14 and inorganic anions (e.g., sulfate, phosphate, arsenate) through adsorption and/or coprecipitation.15–18 In contrast to adsorption, coprecipitation with OM or anions alters the structure and properties of FHY such as specific surface area (SSA),13,19 particle size15 and local ordering.20,21The impact of OM on the formation and properties of FHY has been widely studied with regard to molecular weights of OM,19 and the number/position of different functional groups on the OM compounds (e.g., carboxyl or phenolic groups).20,22 Recent work by ThomasArrigo et al.19 showed that, at similar C/Fe molar ratios, coprecipitation with low molecular weight OM, such as citric acid, can impede FHY nanocrystal growth, reducing the particle sizes and SSA. In addition, it has been shown that specific functional groups of OM (i.e., exopolymeric substances22 or hydroxybenzoic acids20) can effectively inhibit FHY precipitation, leading to the formation of mononuclear organic Fe species,22 and/or decrease SSA and change porosity due to the OM blockage of surface sites and pores.20 On the other hand, small FHY nanoparticles (<10 nm) form at high OM levels (C/Fe > 10), facilitating the transport of associated OM and oxyanions (e.g., organic phosphates) in natural environments.23 Similarly, organic phosphates (OP) can also impose completely distinct morphological changes on the FHY coprecipitates. For example, phosphatidylcholine-coprecipitated FHY resulted in a dramatic decrease in SSA (ca. 10–130 times smaller) and pore volume compared to inositol hexaphosphate.24
When FHY is coprecipitated in the presence of inorganic phosphate17,25–27 at a nominal molar P/Fe ratio < 0.55, the resulting solids retained the same P/Fe ratio; however, when the phosphate concentration was higher (nominal P/Fe ratios > 0.55), the coprecipitates always had solid P/Fe ratios in the range of 0.5–0.6,17,28 and Fe(III)–PO4 complex formation preceded the hydrolysis and polymerization of Fe to oxyhydroxides.26,27,29 However, to the best of our knowledge, very few studies addressed the interactions between OP and iron (oxyhydr)oxides (cf. Ruttenberg & Sulak,30 Chen et al.31), or evaluated the mechanisms controlling iron(III) coprecipitation (i.e., local structural differences) in the presence of phospholipids. Furthermore, to date, the differences imposed by OP on the structure and composition of FHY particles, particularly in terms of steric hindrance and electrostatic repulsion of organic moieties are still unknown, despite the fact that in natural environments such complex P-containing OM moieties will invariably change the properties and reactivity of any forming FHY.
To address this gap, we used β-glycerophosphate (GP) as a model phospholipid compound in this study because it is a common hydrolysis product of RNA and phospholipids in soils.32 With the aim of obtaining a more comprehensive understanding of the role that phospholipids play in the formation of Fe(III) nanoparticulate phases, we synthesized FHY in the presence of GP at varying nominal molar P/Fe ratios between 0.01 and 0.5, comparable to what is found in nature.23,33,34 The morphological, compositional and local structural changes of the resulting coprecipitates have been analyzed using conventional laboratory and synchrotron-based X-ray techniques, including inductively coupled plasma optical emission spectrometry (ICP-OES), nitrogen gas sorption analysis, Fourier transform infrared spectroscopy (FTIR), small-angle X-ray scattering (SAXS) and X-ray absorption spectroscopy (XAS). Our results reveal that the structure of the formed GP–FHY nanoparticles was sensitive to varying nominal P/Fe ratios, and this has implications for their stability and mobility in natural waters.
Results and discussion
Structure, composition and surface properties of coprecipitates
All coprecipitates (Table 1) were nanocrystalline as evidenced by the typical 2-line FHY X-ray diffraction pattern showing two broad reflections (Fig. S1†). These two reflections broadened further in the coprecipitates formed at nominal P/Fe ratios of 0.2 and higher. The position of the first reflection at ∼2.7 Å slightly differed from the typical 2.6 Å reflection observed in FHY,2 indicating that a higher GP content could have resulted in a more disordered structure. Plots of surface charge (point of zero charge, PZC) versus pH for the GP–FHY coprecipitates and pure FHY are shown in Fig. S2,† where pure FHY exhibited a PZC of ∼7.1, lower than most reported values of 7.8–7.9,35,37 which may be due to the different solution condition (e.g., electrolyte solution). All GP–FHY coprecipitates exhibited a far lower PZC value (Table 1), and only the GP–FHY coprecipitate at ratio of 0.01 with PZC of ∼4.9 showed a similar trend to FHY, while further increases in GP content (P/Fe ratios from 0.05 to 0.5) had the little effect on the PZC (∼4) of the coprecipitates. This could indicate full surface coverage and/or further incorporation of GP in the structure as shown for other OM–FHY systems.24,36| Molar P/Fe ratioa | Contents (mg g−1) | Chemical formula | PZCe | ||||||
|---|---|---|---|---|---|---|---|---|---|
| Nominal | Unwashedb | Washedb | Fea | Pa | Cc | Hc | Od | ||
| a Determined by ICP-OES analysis. b Values in parentheses represent analytical uncertainty (<5% relative) in the final digit, based on replicate measurements of quality control solutions analyzed together with the samples (Table S1). No significant differences were observed between the Milli-Q water washed and unwashed samples, indicating that little to no GP was adsorbed. c Obtained from elemental analysis (C, H). d Calculated by difference (i.e., total minus the weight percentages of Fe, P, C and O). e Values in parentheses represent standard deviation in the final digits of three repeated measurements. Note that “n.d.” refers to “not determined”. | |||||||||
| 0 | 0 | 0 | 566 | 0 | 0 | 18 | 416 | FeO0.8(OH)1.8 | 7.0 (1) |
| 0.01 | 0.012 (1) | 0.010 (1) | 481 | 3 | 8 | 17 | 490 | FeO1.6(OH)1.8[(C3H7O2)0.03(PO4)0.01] | 4.9 (3) |
| 0.05 | 0.051 (4) | 0.052 (2) | 506 | 15 | 20 | 20 | 438 | FeO0.9(OH)1.8[(C3H7O2)0.06(PO4)0.05] | 4.3 (1) |
| 0.10 | 0.10 (1) | 0.10 (1) | 491 | 28 | 40 | 21 | 421 | FeO0.9(OH)1.5[(C3H7O2)0.13(PO4)0.10] | 4.2 (1) |
| 0.15 | 0.14 (1) | 0.16 (1) | 448 | 39 | 46 | 24 | 443 | FeO0.6(OH)1.9[(C3H7O2)0.16(PO4)0.16] | n.d. |
| 0.20 | 0.18 (1) | 0.19 (1) | 434 | 45 | 53 | 26 | 442 | FeO0.5(OH)1.9[(C3H7O2)0.19(PO4)0.19] | n.d. |
| 0.30 | 0.22 (2) | 0.21 (1) | 418 | 49 | 61 | 27 | 443 | FeO0.4(OH)2.0[(C3H7O2)0.23(PO4)0.21] | 4.3 (2) |
| 0.36 | 0.22 (2) | 0.21 (1) | 421 | 50 | 57 | 27 | 444 | FeO0.3(OH)2.1[(C3H7O2)0.21(PO4)0.21] | n.d. |
| 0.40 | 0.23 (3) | 0.21 (1) | 409 | 47 | 54 | 26 | 464 | FeO0.6(OH)2.1[(C3H7O2)0.20(PO4)0.21] | n.d. |
| 0.42 | 0.22 (3) | 0.23 (1) | 404 | 52 | 64 | 29 | 451 | FeO0.3(OH)2.2[(C3H7O2)0.25(PO4)0.23] | n.d. |
| 0.50 | 0.22 (4) | 0.22 (1) | 416 | 50 | 54 | 28 | 452 | FeO0.2(OH)2.3[(C3H7O2)0.20(PO4)0.22] | 4.0 (1) |
To assess if some of the GP was adsorbed to the precipitated solids, we evaluated the difference between the P/Fe ratios of ‘unwashed’ and ‘washed’ coprecipitates to be negligible (Fig. 1a and Table 1), suggesting that GP was structurally incorporated in the Fe(III) hydroxide precipitates and not adsorbed. This result was also supported by data from our batch adsorption experiments (Fig. S3†), where we documented that the maximum solid P/Fe ratio attained for GP-adsorbed FHY was only 0.07. This value is almost 4 times lower than the reported maximum adsorption capacity of FHY for inorganic PO43− (P/Fe = 0.26).38 Therefore, the contribution of surface adsorbed GP to the final P/Fe ratios of the GP–FHY coprecipitates is expected to be negligible. In addition, the measured P/Fe ratios increased linearly with the nominal ratios at the beginning, with almost no aqueous Fe3+ and GP detected in the supernatant (Fig. 1a and b). However, above a nominal P/Fe ratio of 0.3, the solids exhibited a maximum P/Fe ratio of 0.22. This was mirrored in the increase in residual aqueous [GP] and [Fe3+] in the supernatant, ranging from 0.43 to 1.8 mM and 0.03 to 1.7 mM, respectively. This latter observation is notable because at neutral pH, a solution with such high aqueous [Fe3+] should be supersaturated with respect to FHY, and should therefore precipitate,2 which did not happen in our experiments. Similarly, studies on Fe(III)–arsenic (As) coprecipitates39,40 showed increase in dissolved [Fe3+] in the presence of As(V) (nominal As/Fe = 1) due to the formation of Fe(III)–As(V) complexes, which were soluble in the supernatant. Hence, we suggest that the observed increased residual aqueous [GP] and [Fe3+] in our experiments could be attributed to the formation of soluble Fe(III)–GP complexes, capable of passing through a 0.22 µm filter, which was used to separate the coprecipitates from the supernatant solutions. In order to confirm the presence of Fe(III)–GP complexes, we could use Flow Field Flow Fractionation (FIFFF) in future studies for better separation of the complexes. As the nominal ratio increased from 0.4 to 0.5, the molar ratio of complexes increased from 1![[thin space (1/6-em)]](https://www.rsc.org/images/entities/char_2009.gif) :2 to 1:1 (Fig. 1b). Nevertheless, we also observed a slight increase in dissolved [Fe3+] in the adsorption experiments (Fig. 1b and S3a†). However, this was more notable only at nominal P/Fe ratios ≥ 0.5 (about 3% molar Fe(III) was dissolved), and thus the contribution of ligand-induced dissolution for the formation of the complexes is very minor.16,41 Combined with elemental analysis, all chemical compositions of the coprecipitates as well as the calculated theoretical chemical formulas and listed in the Table 1. The chemical formula for GP-free FHY in our work is comparable to the chemical formula Fe5HO8·4H2O, which was proposed by Towe & Bradley.42 Our X-ray photoelectron spectroscopic (XPS) data revealed that as the GP loading increased, the proportion of –OH groups also increased with a decrease in deprotonated Fe–O− (Fig. 2 and Table S2†). This is caused by the increase of organic oxygen (Oorganic) and –OH for GP–FHY coprecipitates with ratios of 0.05 and 0.5, whose OH + Oorganic/Ooxide was 0.83 and 2.86, respectively. Boily et al.43 suggested that FHY has an OH/O− ratio of 1.1 at particle sizes of ∼3 nm, and that smaller particle sizes exhibit larger OH/O− ratios, accompanied by the introduction of vacancies in the core Fe1 site and increase in –OH density. Therefore, GP incorporation may contribute to the higher disorder and smaller FHY particles as seen from the high OH/O− ratio of coprecipitates with P/Fe ratio of 0.5.
:2 to 1:1 (Fig. 1b). Nevertheless, we also observed a slight increase in dissolved [Fe3+] in the adsorption experiments (Fig. 1b and S3a†). However, this was more notable only at nominal P/Fe ratios ≥ 0.5 (about 3% molar Fe(III) was dissolved), and thus the contribution of ligand-induced dissolution for the formation of the complexes is very minor.16,41 Combined with elemental analysis, all chemical compositions of the coprecipitates as well as the calculated theoretical chemical formulas and listed in the Table 1. The chemical formula for GP-free FHY in our work is comparable to the chemical formula Fe5HO8·4H2O, which was proposed by Towe & Bradley.42 Our X-ray photoelectron spectroscopic (XPS) data revealed that as the GP loading increased, the proportion of –OH groups also increased with a decrease in deprotonated Fe–O− (Fig. 2 and Table S2†). This is caused by the increase of organic oxygen (Oorganic) and –OH for GP–FHY coprecipitates with ratios of 0.05 and 0.5, whose OH + Oorganic/Ooxide was 0.83 and 2.86, respectively. Boily et al.43 suggested that FHY has an OH/O− ratio of 1.1 at particle sizes of ∼3 nm, and that smaller particle sizes exhibit larger OH/O− ratios, accompanied by the introduction of vacancies in the core Fe1 site and increase in –OH density. Therefore, GP incorporation may contribute to the higher disorder and smaller FHY particles as seen from the high OH/O− ratio of coprecipitates with P/Fe ratio of 0.5.
 | ||
| Fig. 1 (a) Measured molar P/Fe ratios in the coprecipitates versus nominal P/Fe molar ratios. (b) [β-Glycerophosphate]aq (GP, upside down triangles) and [Fe3+]aq (circles) in the supernatant following adsorption (pink) and coprecipitation (blue) experiments. Error bars in the adsorption data are standard deviation based on three replicates, while the others are based on analytical errors (see Table S1†). Change in the (c) specific surface area and (d) pore volume of the coprecipitates with nominal increasing P/Fe ratio compared to the surface area of the adsorption experiment (upside down triangles). The pore size distributions of the coprecipitates are shown in the inset in (d). Grey dashed lines in (a) to (d) are drawn to guide the eyes. | ||
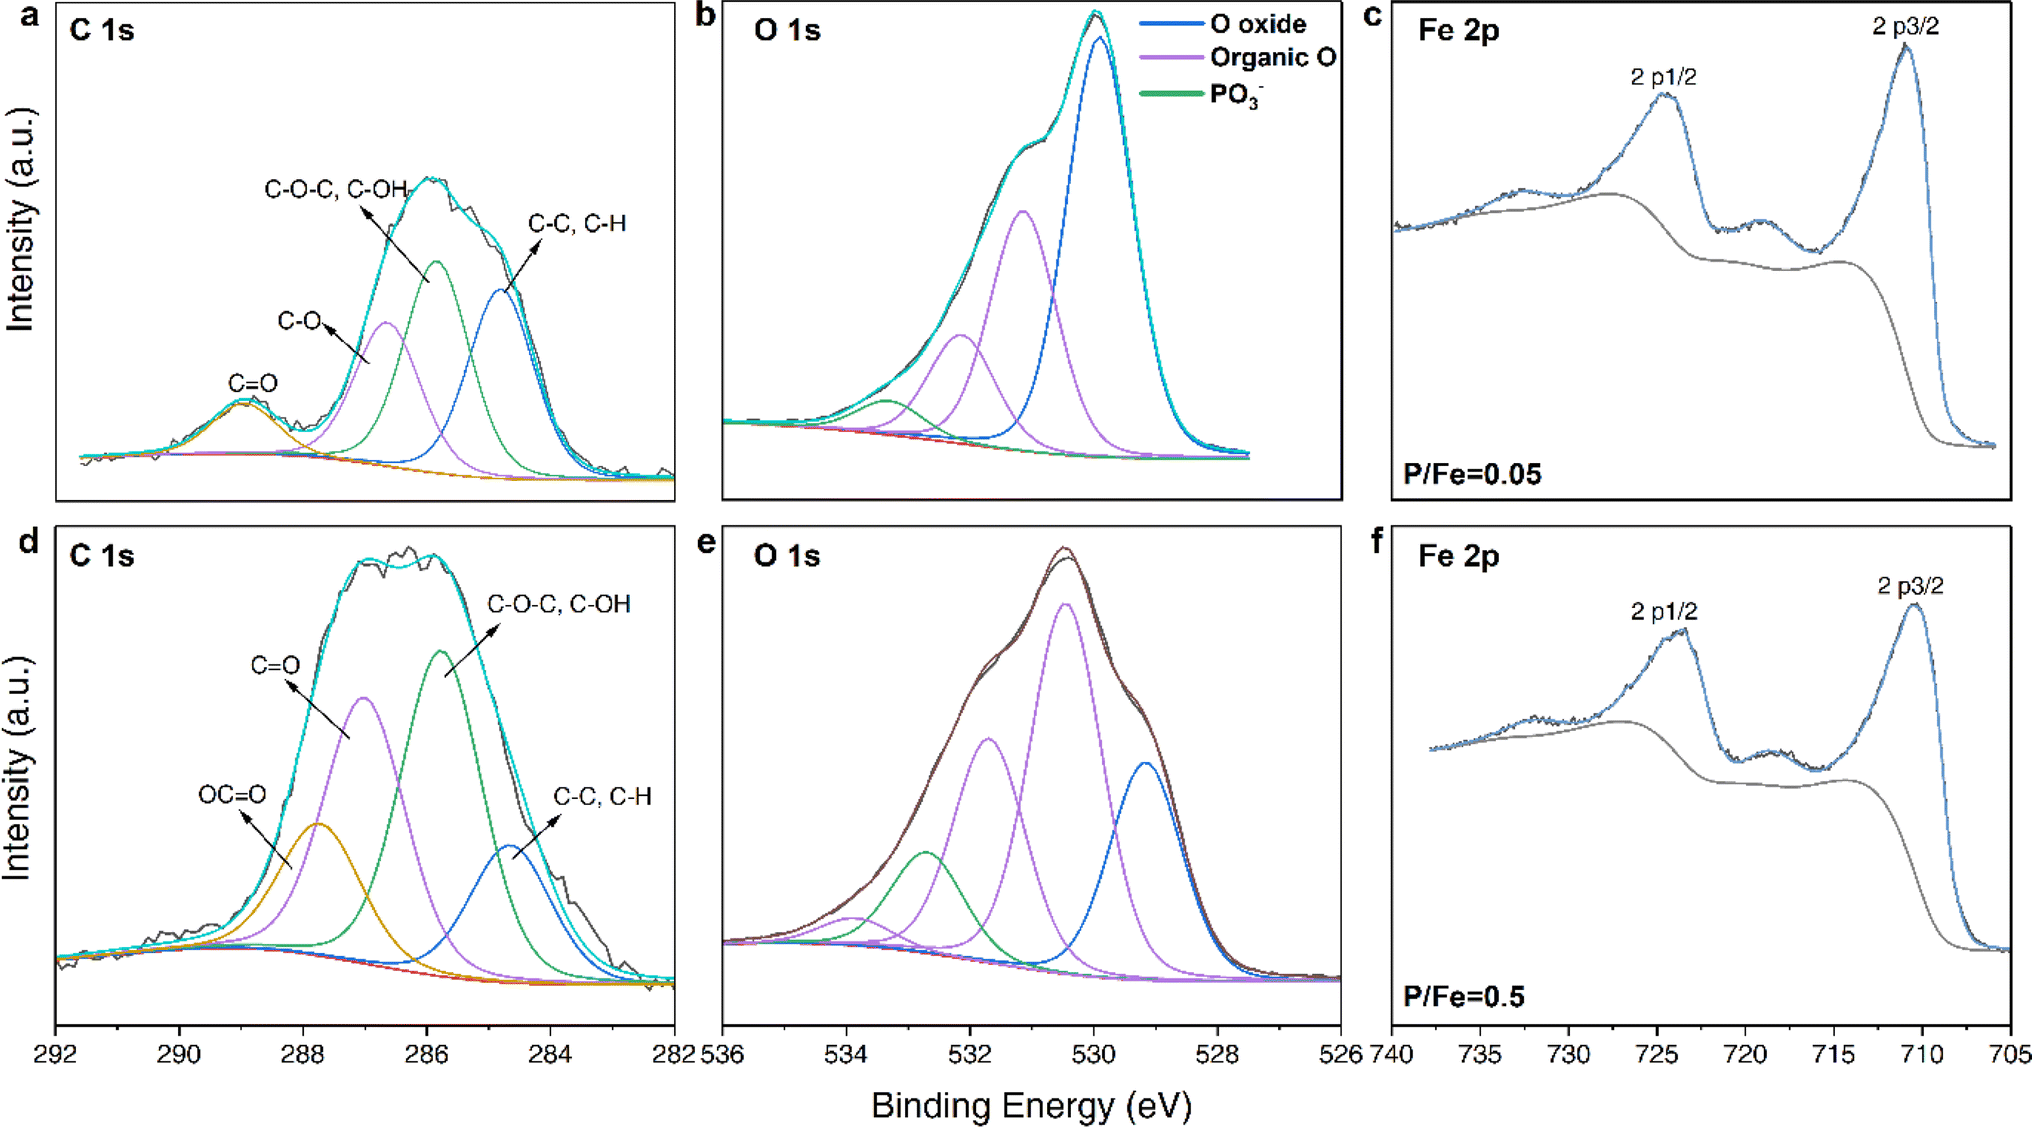 | ||
| Fig. 2 High resolution XPS spectra of coprecipitates at P/Fe ratios of 0.05 (top) and 0.5 (bottom): (a and d) C 1s, (b and e) O 1s and (c and f) Fe 2p spectra. | ||
The effect of GP on the structure of FHY was also clearly documentable in the sharp decrease in the specific surface area (SSA) and pore volume (Vpore) of the coprecipitates with increasing nominal P/Fe ratio > 0.05 (Fig. 1c and d). This can be attributed to the possible collapse of the pore structure based on the decrease in pore width (Fig. 1d inset). Interestingly, coprecipitates obtained at nominal P/Fe ratios between 0.3 and 0.45 showed a large variation in SSA and Vpore values (Fig. 1c and Table S3†), with almost undetectable porosity at P/Fe of 0.5, probably due to organic coverage. Compared to the coprecipitates, the SSA values of GP-adsorbed FHY samples (red inverted triangles in Fig. 1c) were quite similar to pure FHY, irrespective of GP loading. This can be explained by the limited adsorption capacity of pure FHY for GP (maximum P/Fe = 0.07), which is not enough to cover the reactive surfaces of FHY and therefore decrease its SSA. Similar results have been reported in the study where FHY was coprecipitated with various inorganic and organic phosphorus compounds (see Table S4† and references therein).24 Of particular relevance to our work is the fact that a similar SSA decrease in the coprecipitates have only been reported for phosphatidylcholine, a common phospholipid component in cells. Therefore, we attribute the decrease in SSA to the potential formation of organic multilayers that could cover reactive particle surfaces and clog pores, as also shown with OM with varying molecular weights coprecipitated with FHY.13,19
In contrast to employing TEM for the FHY morphological analysis, which may encounter challenges such as nanoparticle aggregation, exceedingly small particles, or beam damage,5,44,45 small angle X-ray scattering (SAXS) analysis was used in our study to detect morphological variations. With increasing nominal P/Fe ratios, our SAXS data revealed a gradual change in pattern profiles (Fig. 3a and S4†). We fitted the SAXS data of the coprecipitates at all P/Fe ratios with a model that is comprised of two spherical populations, in addition to a background contribution consisting of a Porod slope and a flat background (Fig. S5†). These two sphere populations, I and II, were used to describe: (I) the radius of the primary bead (i.e., (OM–)Fe oligomer/cluster); and (II) either the particle size or pore width. The morphological variations as a function of nominal P/Fe ratios (Fig. 3b–g) shows that for population I, at P/Fe ratios ≤ 0.05, the radial particle distribution is centered around 0.7 nm, ranging between 0.2 and 2 nm. However, higher P/Fe ratios (0.1–0.5) led to a narrower particle size distribution (between 0.25 and 1.5 nm) (Fig. 3b). Meanwhile, the average sphere radius increased from 0.52 to 0.60 nm with increasing P/Fe ratios (Fig. 3d). It has been proposed that a single Fe(III)O6 octahedron has a radius of ∼0.2 nm and PO4–Fe dimer has a radius of 0.42 nm.46 Therefore, it is reasonable to suggest that Fe(III)–GP oligomer comprises the population I, particularly for higher GP-loaded precipitates. This assumption is also in accordance with Guénet et al.47 who reported a radius of 0.8 nm for FHY–OM primary bead. Furthermore, the average radius of pure FHY closely matches the radius of the Fe13 Keggin cluster (0.5–0.6 nm), which is the initial particle for FHY formation.6,48 The larger radial range was attributed to the continuous growth of iron clusters, thereby indicating that particle growth was restricted at higher P/Fe ratios (Fig. 3b).46
 | ||
| Fig. 3 (a) SAXS curves for FHY and coprecipitates synthesized at different P/Fe ratios (both axes are log10 scale) and the inset is the enlarged grey WAXS region (liner scale). Size distribution, variations in the average radius and polydispersity for the primary beads (population I) (b, d and f) and the nanoparticles (c, e and g). | ||
For population II, the radial size of coprecipitates (except for ratio of 0.01) decreased with increasing P/Fe ratios, finally narrowing down to a size of about 2 nm (Fig. 3c), although the average radii showed a slight increase trend (Fig. 3e). Considering that the observed radial range of FHY particle was between 1 and 6 nm, population II could potentially be FHY-like particles.49 According to a previous study in which the size of Fe–OM coprecipitates was determined by SAXS, nanoparticles of radius ∼3–6 nm were defined as nanoparticles formed from primary beads.47 More direct support came from FlFFF analysis, not only detecting the DOC–Fe monomers (∼0.6 nm in radius), but differentiating them from OM associated Fe oxyhydroxides particles (∼1.5–3 nm in radius).23 Thus, combining these previous works with the decrease in the number of population II in our study, we speculate that higher P/Fe ratio retards FHY formation, leading to smaller GP–FHY particles and an increase in Fe(III)–GP oligomer, which is also consistent with XPS analysis. However, we cannot exclude the possibility of population II as pore width, especially these results match well with observations of both pore width and derived SSA, and the decrease in population II suggested the pore blockage within the systems (Fig. 3c). Although our SAXS analyses could not definitively state population II, the evolution of polydispersity for the two populations coincides with the trend observed for the final P/Fe ratios and SSA/Vpore, respectively (Fig. 3f and g). This reveals that the state of primary beads is controlled by the nominal P/Fe ratios, and then influenced the nanoparticle formation and led to different morphologies of coprecipitates. The WAXS (wide angle X-ray scattering) part of the patterns (high Q-range in Fig. 3a and inset) for pure FHY and all coprecipitates showed identical results to the powder XRD data (Fig. S1†) in terms of the broad peaks and their position.
Local bonding environment
The Fourier transform infrared spectra (FTIR) of GP–FHY coprecipitates synthesized at varying P/Fe molar ratios showed significant increase in absorbance with increasing GP content in the frequency region between 1250 and 800 cm−1. This originated from the changes in stretching vibrations of the phosphate group (Fig. 4a, S6 and S7†).50 Literature data for GP complexation with FHY is lacking, and thus based our interpretation of the bonding configuration of GP with FHY on GP reference patterns we prepared (see ESI and Table S5† for more details), combined with limited experimental51,52 and theoretical studies53 describing P–O stretching bands (ν) in Fe (oxyhydr)oxides. Deconvolution of the FTIR spectra between the range of 1250 to 800 cm−1 showed that, for GP–FHY at all ratios, the phosphate region could be resolved into several bands at 965, 1000, 1045, 1080, and 1115 cm−1; two additional bands at 890 and 1150 cm−1 appeared in the samples prepared at P/Fe ratios ≥ 0.1. With higher amounts of GP coprecipitated, peak shifts and changes in relative areas were observed due to the configuration change (Table S6†). The appearance of the band of 890 cm−1, which was assigned to be the symmetric νs(P–OH) band,54 can be explained by the formation of a monodentate mononuclear (1V) inner-sphere surface complex.55 The bands at 970 and 1000 cm−1 represent symmetric νs(P–OFe) and asymmetric νas(P–(OFe)2) bands, while the band at 1040 cm−1 could be attributed to either νas(P–OFe) or νas(P–OC) and band at ∼1120 cm−1 is designated as ν(P![[double bond, length as m-dash]](https://www.rsc.org/images/entities/char_e001.gif) O). When GP was adsorbed onto crystalline goethite, the bands at 998, 1044 and 1126 cm−1 shifted to significantly higher frequencies of 1008, 1052 and 1139 cm−1.51 Moreover, higher inorganic P loading on goethite induce the configuration to change from bidentate binuclear (2C) to 1V geometry.50 Matching this approach, we assigned in our patterns the bands at 1000, 1040 and 1125 cm−1 to the 2C complex, and the bands at 890, 965, 1070, 1115 and 1150 cm−1 to 1V complex (Fig. 4a and S7†). This way we could use our patterns to derive for each GP–FHY coprecipitate the percentage of each binding geometry by deconvoluting the relative areas of each peak (Fig. S7 and Table S6†). The data revealed that with increasing GP, the proportion of the 1V geometry increased from ∼45 to ∼75%, while the 2C geometry decreases from ∼55 to ∼25% (Fig. 4b).
O). When GP was adsorbed onto crystalline goethite, the bands at 998, 1044 and 1126 cm−1 shifted to significantly higher frequencies of 1008, 1052 and 1139 cm−1.51 Moreover, higher inorganic P loading on goethite induce the configuration to change from bidentate binuclear (2C) to 1V geometry.50 Matching this approach, we assigned in our patterns the bands at 1000, 1040 and 1125 cm−1 to the 2C complex, and the bands at 890, 965, 1070, 1115 and 1150 cm−1 to 1V complex (Fig. 4a and S7†). This way we could use our patterns to derive for each GP–FHY coprecipitate the percentage of each binding geometry by deconvoluting the relative areas of each peak (Fig. S7 and Table S6†). The data revealed that with increasing GP, the proportion of the 1V geometry increased from ∼45 to ∼75%, while the 2C geometry decreases from ∼55 to ∼25% (Fig. 4b).
 | ||
| Fig. 4 (a) Phosphate stretching region of the FTIR spectra (1250–800 cm−1) for all GP–FHY coprecipitates synthesized at different nominal P/Fe molar ratios; red dashed lines represent bands in the 1V geometry while blue dashed lines represent bands in the 2C geometry (full spectra and curve fitting with spectral assignments in ESI, Fig. S6 and S7, Tables S5 and S7†). (b) Percentage of each bonding geometry calculated using the relative peak areas. (c) PDFs [G(r)] in the low r-value region for GP–FHY coprecipitates and pure FHY (see Fig. S9† for full range) and (d) zoomed in grey region in (c); note that Fe–Ooct and Fe–Fetet refer to Fe–O in octahedral and tetrahedral geometries, Fe–FeE and Fe–FeC refer to edge- and corner-sharing Fe polyhedra, and Fe–PB and Fe–PM refer to Fe–P for bidentate binuclear (2C) and monodentate mononuclear (1V) configurations, respectively. (e) k3-weighted χ(k) EXAFS spectra of FHY and GP–FHY coprecipitates with nominal P/Fe molar ratios of 0.05, 0.3 and 0.5 (upside down triangles in are eye guides, XANES spectra in Fig. S10†); (f) radial distribution function based on the Fourier-transformed EXAFS data. Solid lines indicate experimental data and grey dashed lines represent the shell-by-shell fitting results, with fitting parameters shown in Table 2. | ||
The FTIR data and interpretations (Fig. 4a and b) were further strengthened by pair distribution function analyses (PDF, G(r)) of the GP–FYH precipitates (Fig. 4c and d). The data revealed that position and intensity of the edge-sharing Fe–Fe pair (Fe–FeE) remained relatively constant at ∼3.04 Å (Fig. 4d), while the corner-sharing Fe–Fe pair (Fe–FeC) at 3.4 Å was affected by the Fe–P bidentate peak (Fe–PB) at 3.3 Å.57 Meanwhile, a peak at 3.6 Å corresponding to the Fe–P bond in the 1V bonding configuration, became more pronounced, similar to orthophosphate surface complexes on goethite.56 Therefore, we suggest that in our GP–FHY coprecipitates, the GP also complexed with Fe at the expense of corner-sharing Fe polyhedra. The process was initially dominated by a 2C geometry but with increasing GP contents, the bonding switched to a 1V geometry at high P/Fe ratios.39
To support the interpretation of the bonding environment information from our FTIR and PDF data, we collected Fe K-edge extended X-ray absorption fine structure (EXAFS) spectra (Fig. 4e and f and Table 2). The EXAFS spectra of the coprecipitates feature a small bump near 5.5 Å−1 (Fig. 4e, blue triangle), attributed to corner-sharing FeO6 octahedra,58 which became less pronounced with increasing P/Fe ratio. A second significant decrease in oscillation amplitude was also observed at ∼7.5 Å−1 (black triangle), indicating a potential decrease in the coordination number (CN) of the nearest Fe neighbors.20 To quantify these changes in Fe bonding environment, we performed shell-by-shell fits on the Fe k3-weighted EXAFS spectra (Fig. 4f). With increasing nominal P/Fe ratios to >0.3, the first-shell attributed to Fe–O bonding became broader, accompanied by the disappearance of the shoulder feature at ∼1.85 Å (pink band). This represents the loss of tetrahedral Fe and a distortion of octahedral Fe.59,60 The amplitude of the second-shell also decreased, suggesting a strong disruption of the Fe–Fe bonding environment. In particular, the right shoulder feature of the second-shell at ∼3.3 Å, which represents the corner-shared Fe polyhedral (light green band), slowly disappeared as the nominal P/Fe increased. The EXAFS-derived bond distances of the Fe–O bonds of the GP–FHY coprecipitates did not vary compared to pure FHY (Fig. 4f and Table 2), both having an average distance for the octahedra in the Fe(III) (oxyhydr)oxides of 1.98 ± 0.01 Å. In samples with higher GP contents, Fe–P pairs were coordinated in bidentate (∼3.25 Å) and monodentate geometry (∼3.6 Å) starting at the ratios of 0.05 and 0.3, respectively. This change also led to a progressive suppression of Fe–Fe interactions,17 with the corner-sharing Fe–Fe at ∼3.45 Å disappearing first. Furthermore, the CN of the edge-sharing Fe–Fe at ∼3.0 Å also changed from 3.2 ± 0.6 to 1.3 ± 0.8. We attempted to fit the Fe–P2 (1V) path with a single corner-sharing Fe–Fe path (∼3.6 Å),25,27 but could not achieve a physically realistic fit resulting from the high correlation between σ2 and CN, and also a chemical impossibility as P suppresses the corner-sharing Fe polyhedra.21
| Sample (P/Fe) | Atomic pair | CN | R (Å) | σ 2 (Å2) | ΔE0 (eV) | Red. Χ2 | R-Factor |
|---|---|---|---|---|---|---|---|
| a CN, coordination number; R, interatomic distance; σ2, mean-squared atomic displacement; and ΔE0, change in threshold energy. The passive electron reduction factor (S02) was fixed at 0.85, and σ2 for Fe–Feedge and Fe–Fecorner pairs were fixed at 0.016 and 0.012 based on 2-line FHY, while the fixed σ2 (Fe–P) = 0.007 was based on empirical calculations.59 All fits were done in R + ΔR-space = 1–4 Å and k-range = 2–12.5 Å−1. The number of independent points (NIDP) in the fits was 19.8 and the number of variables (NVar) was 8–10. One example of fitting attempts for coprecipitate at P/Fe of 0.5 can be found in Table S8. | |||||||
| 0 (FHY) | Fe–O | 5.2 (0.8) | 1.97 (0.01) | 0.010 (0.001) | −2.4 (1.6) | 0.0018 | 0.0275 |
| Fe–Feedge | 3.2 (0.6) | 3.06 (0.02) | 0.016 | ||||
| Fe–Fecorner | 1.4 (0.9) | 3.44 (0.01) | 0.007 (0.004) | ||||
| 0.05 | Fe–O | 4.5 (0.5) | 1.98 (0.01) | 0.010 (0.001) | 3.0 (1.1) | 0.0281 | 0.0181 |
| Fe–Feedge | 2.3 (1.3) | 3.06 (0.03) | 0.016 | ||||
| Fe–P1 (2C) | 1.1 (0.9) | 3.26 (0.05) | 0.007 | ||||
| Fe–Fecorner | 1.2 (0.5) | 3.44 (0.03) | 0.012 | ||||
| 0.3 | Fe–O | 5.5 (0.4) | 1.98 (0.01) | 0.011 (0.001) | −0.9 (0.8) | 0.1048 | 0.0096 |
| Fe–Feedge | 1.1 (1.0) | 3.07 (0.05) | 0.016 | ||||
| Fe–P1 (2C) | 2.1 (0.7) | 3.23 (0.02) | 0.007 | ||||
| Fe–P2 (1V) | 0.6 (0.4) | 3.58 (0.05) | σ 2 (Fe–P1) | ||||
| 0.5 | Fe–O | 4.4 (0.4) | 1.98 (0.01) | 0.010 (0.001) | −0.8 (0.9) | 0.0288 | 0.0105 |
| Fe–Feedge | 1.3 (0.8) | 3.05 (0.03) | 0.016 | ||||
| Fe–P1 (2C) | 1.5 (0.6) | 3.25 (0.02) | 0.007 | ||||
| Fe–P2 (1V) | 0.5 (0.3) | 3.57 (0.05) | σ 2 (Fe–P1) | ||||
Structural alteration of Fe(III) precipitates by GP coprecipitation
Although all coprecipitates synthesized at different P/Fe ratios showed a typical 2-line FHY XRD pattern (Fig. S1†), significant variations were evident in their structures as well as SSA, Vpore, PZC, particle sizes and elemental compositions (Table 1, Fig. 1 and 3). When the nominal P/Fe ratio was ≤0.05, the coprecipitates exhibited FHY-like characteristics. With increasing ratios, more Fe surface sites became occupied (Fig. 1c and d), which suppressed or even fully inhibited the growth of the polymeric chains of the edge/corner sharing Fe octahedra. Smaller primary particles sizes were observed at higher P/Fe (Fig. 3b) with a maximum ratio of 0.22, and more Fe(III)–GP complexes were formed (Fig. 1a and b). In the local bonding environment, the coordination number of Fe–Fe pairs decreased, while that of the Fe–P pairs increased, accompanied by a switching in geometry from 2C to 1V (Fig. 4).The inhibition of GP on the growth of FHY can be explained by the adsorption of either organic molecules or oxyanions,61 which reduces the surface Gibbs free energy and results in the formation of smaller clusters, with the Fe13 Keggin units being the smallest unit for generic FHY structure formation.9 Such an interpretation is also supported by experimental results that showed that Fe13 clusters can be stabilized by organic ligands,48 and that the particle size of inorganic phosphate coprecipitate FHY decrease at very high P/Fe ratio of 10.62 In our study, for coprecipitates with nominal P/Fe in the range 0.3–0.5, the smallest detectable solids could be one GP bridging two Fe dimers (i.e., oligomers), consistent with the final P/Fe ratio of 0.22. Similar to the coprecipitation of iron with inorganic phosphate, Fe(III)–PO4 solids with short-range networks formed at higher ratios (>0.5) in the studies of Mikutta et al.27 and Voegelin et al.17 In addition, a study about Fe(III)–As(V) complexes documented the presence of mononuclear Fe complexes with either 1 or 2 As molecules.40 Comparing these findings with our data, we infer similar processes in our system, i.e., that Fe(III)–GP complexes in the supernatant could be mononuclear Fe with 2 or 1 GP molecule attached (i.e., monomers). We have summarized these observations and our interpretations in a schematic in Fig. 5.
 | ||
| Fig. 5 Average particle diameters, SSA and structural changes in coprecipitated GP–FHY as a function of increasing nominal P/Fe ratio; Fe(III)–GP oligomers (in the solid grey line ellipses) shown as aggregates and the Fe(III)–GP monomers forming in the supernatant at P/Fe ratios of 0.3 to 0.5 are shown in the dotted grey line contour at right. Yellow/brown colors represent Fe–O octahedra and tetrahedra and PO4 tetrahedra are shown in pink; red, black and white spheres represent oxygen, carbon and hydrogen, respectively. | ||
Conclusion
The presence of inorganic PO43− can dramatically affect the structure and reactivity of Fe (oxyhydr)oxides in soils and ferritin proteins. Among phosphorus compounds, we show that organic phosphates also affect the structure and properties of ferrihydrite and that the effect is strongly dependent on the molar ratios of P/Fe (0.01 to 0.5) in the initial experiments. All precipitates had XRD patterns akin to FHY, but only solids at lower ratio (≤0.05) exhibited distinct FHY-like properties (i.e., high SSA/Vpore and small particle sizes). With increasing nominal P/Fe ratios, the SSA of the precipitates sharply decreased from ∼300 to 3 m2 g−1, due to the collapse of the pore structure. With increasing P/Fe ratios, the local bonding environment evaluation based on Fe-edge XAS analyses, PDF as well as FTIR data, revealed that Fe–P pairs gradually transitioned from a 2C (∼3.25 Å) to a 1V geometry (∼3.6 Å). Simultaneously, the corner-sharing Fe–Fe bonds (at ∼3.45 Å) disappeared, and the coordination number of the edge-sharing Fe–Fe decreased from 3.2 ± 0.6 to 1.3 ± 0.8. We documented that the GP was linked to the FeO6 octahedra mainly in a 1V geometry, and that this hinders the formation of solid iron (oxyhydr)oxide particles during Fe(III) polymerization. On the other hand, at higher nominal P/Fe ratios between 0.3 and 0.5, solid oligomers were formed but all were characterized by a constant P/Fe ratio of 0.22, despite the fact that Fe(III)–GP monomers still existed in the supernatant. Taking all this together, our results highlight the need to evaluate the role of organo-phosphates containing Fe nanophases, because the interaction between organic phosphates and precipitating FHY changes the mineralogy, morphology and surface properties. Compared to the better studied inorganic phosphates17,27,28 and phytates,16,31 our coprecipitates containing phospholipids at the same initial P/Fe ratio, have a lower Fe–P binding capacity and smaller particle sizes. Such a property could further increase the ability of these material towards loss and degradation of organic phosphates in natural environments. Such changes will also invariably affect the fate of trace and major elements in aquifers and soils, where for example chemical and microbial-induced iron oxidation will lead to interactions between organic phosphate compounds and newly forming, nanoparticulate sized Fe-solids. Furthermore, variations in phosphate species can impact the iron storage capacity of ferritin, a protein responsible for regulating in vivo iron levels, influencing both iron deficiency and iron overload.Experimental
Synthesis of ferrihydrite and organic phosphate coprecipitates
Two-line ferrihydrite was synthesized according to the method described by Schwertmann and Cornell.63 Under constant stirring, a 1 M NaOH solution was slowly titrated into a perfluoroalkoxy alkanes (PFA) container with 1 L of 5 mM Fe(NO3)3·9H2O solution until the pH value of 7 was recorded by a pH electrode (SenTix 62 Precision, WTW). This induced the precipitation of a light brown material that was separated from the supernatant by centrifugation at 4350 × g. The resulting pellet was re-suspended in Milli-Q water (∼18.2 MΩ cm) and ‘washed’ via six cycles of centrifugation (7690 × g for five minutes) and re-suspension in Milli-Q water until a total dissolved solids concentration of ∼5 mg L−1 was reached in the supernatant (Hanna Instruments, HI98130). Finally, the washed solid was freeze-dried and stored until it was further used for characterization. Aliquots of the OM free FHY precipitates were used for adsorption experiments with GP (see ESI†).For the GP–FHY coprecipitates, the above synthesis was modified by the addition of disodium β-glycerophosphate to the initial Fe(III) solution. Solids were precipitated by slowly adding NaOH to the Fe(III)–GP solution at varying nominal moral P/Fe ratios (Table 1) and treating the resulting solids as described above (i.e., to obtain ‘washed’ GP–FHY coprecipitates). The suspensions were also prepared freshly for ‘unwashed’ GP–FHY coprecipitates.
Material characterization
Conflicts of interest
The authors declare no conflict of interest.Acknowledgements
Z. C. acknowledges the Chinese Scholarship Council (CSC) for her doctoral research scholarship (award no. 202006320060). The research in this project was funded by the Helmholtz Recruiting Initiative grant (I-044-16-01) awarded to L. G. B., the GFZ expedition fund (grant no. X-044-20-01) for supporting travel to the ESRF synchrotron facility, and the Deutsche Forschungsgemeinschaft (DFG, German Research Foundation) “Open Access Publikationskosten” funding programme (project no. 491075472). We acknowledge the ESRF for time on beamline BM23 funded under proposal ES-1044, and thank O. Mathon for assistance. We also like to thank R. E. Delina for her help during beamtime. J. P. H. P. is in part funded by his independent research fellowship (GFZ Discovery Fellowship, grant no. P-032-45-002). Finally, we also thank the GFZ's ‘Helmholtz Laboratory for the Geochemistry of the Earth Surface (HELGES)’ for ICP-OES access, and the ‘Elements and Minerals of the Earth Laboratory (ElMiE-Lab)’ and A. Gottsche for the elemental analyses.References
- C. W. Childs, Ferrihydrite: A Review of Structure, Properties and Occurrence in Relation to Soils, Z. Pflanzenernaehr. Bodenkd., 1992, 155(5), 441–448, DOI:10.1002/jpln.19921550515.
- R. M. Cornell and U. Schwertmann, The Iron Oxides:Structure, Properties, Reactions, Occurrences and Uses, Wiley-VCH Verlag GmbH & Co. KGaA, Weinheim, FRG, 2nd edn, 2003 Search PubMed.
- S. H. Banyard, D. K. Stammers and P. M. Harrison, Electron Density Map of Apoferritin at 2.8-Å Resolution, Nature, 1978, 271(5642), 282–284, DOI:10.1038/271282a0.
- N. Gálvez, B. Fernández, P. Sánchez, R. Cuesta, M. Ceolín, M. Clemente-León, S. Trasobares, M. López-Haro, J. J. Calvino, O. Stéphan and J. M. Domínguez-Vera, Comparative Structural and Chemical Studies of Ferritin Cores with Gradual Removal of Their Iron Contents, J. Am. Chem. Soc., 2008, 130(25), 8062–8068, DOI:10.1021/ja800492z.
- D. E. Janney, J. M. Cowley and P. R. Buseck, Transmission Electron Microscopy of Synthetic 2- and 6-Line Ferrihydrite, Clays Clay Miner., 2000, 48(1), 111–119, DOI:10.1346/CCMN.2000.0480114.
- J. S. Weatherill, K. Morris, P. Bots, T. M. Stawski, A. Janssen, L. Abrahamsen, R. Blackham and S. Shaw, Ferrihydrite Formation: The Role of Fe13 Keggin Clusters, Environ. Sci. Technol., 2016, 50(17), 9333–9342, DOI:10.1021/acs.est.6b02481.
- A. Manceau and W. Gates, Surface Structural Model for Ferrihydrite, Clays Clay Miner., 1997, 45, 448–460, DOI:10.1346/CCMN.1997.0450314.
- F. M. Michel, L. Ehm, S. M. Antao, P. L. Lee, P. J. Chupas, G. Liu, D. R. Strongin, M. A. A. Schoonen, B. L. Phillips and J. B. Parise, The Structure of Ferrihydrite, A Nanocrystalline Material, Science, 2007, 316(5832), 1726–1729, DOI:10.1126/science.1142525.
- T. Hiemstra, Surface and Mineral Structure of Ferrihydrite, Geochim. Cosmochim. Acta, 2013, 105, 316–325, DOI:10.1016/j.gca.2012.12.002.
- N. P. Funnell, M. F. Fulford, S. Inoué, K. Kletetschka, F. M. Michel and A. L. Goodwin, Nanocomposite Structure of Two-Line Ferrihydrite Powder from Total Scattering, Commun. Chem., 2020, 3(1), 1–9, DOI:10.1038/s42004-020-0269-2.
- M. A. Caraballo, M. P. Asta, J. P. H. Perez and M. F. Hochella, Past, Present and Future Global Influence and Technological Applications of Iron-Bearing Metastable Nanominerals, Gondwana Res., 2021, 110, 283–304, DOI:10.1016/j.gr.2021.11.009.
- K. Eusterhues, T. Rennert, H. Knicker, I. Kögel-Knabner, K. U. Totsche and U. Schwertmann, Fractionation of Organic Matter Due to Reaction with Ferrihydrite: Coprecipitation versus Adsorption, Environ. Sci. Technol., 2011, 45(2), 527–533, DOI:10.1021/es1023898.
- C. Chen, J. J. Dynes, J. Wang and D. L. Sparks, Properties of Fe-Organic Matter Associations via Coprecipitation versus Adsorption, Environ. Sci. Technol., 2014, 48(23), 13751–13759, DOI:10.1021/es503669u.
- K.-Y. Chen, T.-Y. Chen, Y.-T. Chan, C.-Y. Cheng, Y.-M. Tzou, Y.-T. Liu and H.-Y. Teah, Stabilization of Natural Organic Matter by Short-Range-Order Iron Hydroxides, Environ. Sci. Technol., 2016, 50(23), 12612–12620, DOI:10.1021/acs.est.6b02793.
- Y. Hu, B. Lee, C. Bell and Y.-S. Jun, Environmentally Abundant Anions Influence the Nucleation, Growth, Ostwald Ripening, and Aggregation of Hydrous Fe(III) Oxides, Langmuir, 2012, 28(20), 7737–7746, DOI:10.1021/la300791w.
- X. Wang, Y. Hu, Y. Tang, P. Yang, X. Feng, W. Xu and M. Zhu, Phosphate and Phytate Adsorption and Precipitation on Ferrihydrite Surfaces, Environ. Sci.: Nano, 2017, 4(11), 2193–2204, 10.1039/C7EN00705A.
- A. Voegelin, A.-C. Senn, R. Kaegi, S. J. Hug and S. Mangold, Dynamic Fe-Precipitate Formation Induced by Fe(II) Oxidation in Aerated Phosphate-Containing Water, Geochim. Cosmochim. Acta, 2013, 117, 216–231, DOI:10.1016/j.gca.2013.04.022.
- D. M. Sherman and S. R. Randall, Surface Complexation of Arsenic(V) to Iron(III) (Hydr)Oxides: Structural Mechanism from Ab Initio Molecular Geometries and EXAFS Spectroscopy, Geochim. Cosmochim. Acta, 2003, 67(22), 4223–4230, DOI:10.1016/S0016-7037(03)00237-0.
- L. K. ThomasArrigo, R. Kaegi and R. Kretzschmar, Ferrihydrite Growth and Transformation in the Presence of Ferrous Iron and Model Organic Ligands, Environ. Sci. Technol., 2019, 53(23), 13636–13647, DOI:10.1021/acs.est.9b03952.
- C. Mikutta, X-Ray Absorption Spectroscopy Study on the Effect of Hydroxybenzoic Acids on the Formation and Structure of Ferrihydrite, Geochim. Cosmochim. Acta, 2011, 75(18), 5122–5139, DOI:10.1016/j.gca.2011.06.002.
- C. M. van Genuchten, A. J. Gadgil and J. Peña, Fe(III) Nucleation in the Presence of Bivalent Cations and Oxyanions Leads to Subnanoscale 7 Å Polymers, Environ. Sci. Technol., 2014, 48(20), 11828–11836, DOI:10.1021/es503281a.
- C. Mikutta, R. Mikutta, S. Bonneville, F. Wagner, A. Voegelin, I. Christl and R. Kretzschmar, Synthetic Coprecipitates of Exopolysaccharides and Ferrihydrite. Part I: Characterization, Geochim. Cosmochim. Acta, 2008, 72(4), 1111–1127, DOI:10.1016/j.gca.2007.11.035.
- C. Moens and E. Smolders, Suwannee River Natural Organic Matter Concentrations Affect the Size and Phosphate Uptake of Colloids Formed by Iron Oxidation, Geochim. Cosmochim. Acta, 2021, 312, 375–391, DOI:10.1016/j.gca.2021.07.028.
- V. Santoro, M. Martin, P. Persson, C. Lerda, D. Said-Pullicino, G. Magnacca and L. Celi, Inorganic and Organic P Retention by Coprecipitation during Ferrous Iron Oxidation, Geoderma, 2019, 348, 168–180, DOI:10.1016/j.geoderma.2019.04.004.
- J. Rose, A. Manceau, J.-Y. Bottero, A. Masion and F. Garcia, Nucleation and Growth Mechanisms of Fe Oxyhydroxide in the Presence of PO4 Ions. 1. Fe K-Edge EXAFS Study, Langmuir, 1996, 12(26), 6701–6707, DOI:10.1021/la9606299.
- P.-J. Thibault, D. G. Rancourt, R. J. Evans and J. E. Dutrizac, Mineralogical Confirmation of a Near-P:Fe=1:2 Limiting Stoichiometric Ratio in Colloidal P-Bearing Ferrihydrite-like Hydrous Ferric Oxide, Geochim. Cosmochim. Acta, 2009, 73(2), 364–376, DOI:10.1016/j.gca.2008.10.031.
- C. Mikutta, C. Schröder and F. Marc Michel, Total X-Ray Scattering, EXAFS, and Mössbauer Spectroscopy Analyses of Amorphous Ferric Arsenate and Amorphous Ferric Phosphate, Geochim. Cosmochim. Acta, 2014, 140, 708–719, DOI:10.1016/j.gca.2014.05.040.
- B. van der Grift, T. Behrends, L. A. Osté, P. P. Schot, M. J. Wassen and J. Griffioen, Fe Hydroxyphosphate Precipitation and Fe(II) Oxidation Kinetics upon Aeration of Fe(II) and Phosphate-Containing Synthetic and Natural Solutions, Geochim. Cosmochim. Acta, 2016, 186, 71–90, DOI:10.1016/j.gca.2016.04.035.
- N. Khare, J. D. Martin and D. Hesterberg, Phosphate Bonding Configuration on Ferrihydrite Based on Molecular Orbital Calculations and XANES Fingerprinting, Geochim. Cosmochim. Acta, 2007, 71(18), 4405–4415, DOI:10.1016/j.gca.2007.07.008.
- K. C. Ruttenberg and D. J. Sulak, Sorption and Desorption of Dissolved Organic Phosphorus onto Iron (Oxyhydr)Oxides in Seawater, Geochim. Cosmochim. Acta, 2011, 75(15), 4095–4112, DOI:10.1016/j.gca.2010.10.033.
- A. Chen, Y. Li, J. Shang and Y. Arai, Ferrihydrite Transformation Impacted by Coprecipitation of Phytic Acid, Environ. Sci. Technol., 2020, 54(14), 8837–8847, DOI:10.1021/acs.est.0c02465.
- B. L. Turner, N. Mahieu and L. M. Condron, Phosphorus-31 Nuclear Magnetic Resonance Spectral Assignments of Phosphorus Compounds in Soil NaOH–EDTA Extracts, Soil Sci. Soc. Am. J., 2003, 67(2), 497–510, DOI:10.2136/sssaj2003.4970.
- S. Baken, C. Moens, B. van der Grift and E. Smolders, Phosphate Binding by Natural Iron-Rich Colloids in Streams, Water Res., 2016, 98, 326–333, DOI:10.1016/j.watres.2016.04.032.
- A. Gunnars, S. Blomqvist, P. Johansson and C. Andersson, Formation of Fe(III) Oxyhydroxide Colloids in Freshwater and Brackish Seawater, with Incorporation of Phosphate and Calcium, Geochim. Cosmochim. Acta, 2002, 66(5), 745–758, DOI:10.1016/S0016-7037(01)00818-3.
- L. Charlet and A. A. Manceau, X-Ray Absorption Spectroscopic Study of the Sorption of Cr(III) at the Oxide-Water Interface: II. Adsorption, Coprecipitation, and Surface Precipitation on Hydrous Ferric Oxide, J. Colloid Interface Sci., 1992, 148(2), 443–458, DOI:10.1016/0021-9797(92)90182-L.
- R. Mikutta, D. Lorenz, G. Guggenberger, L. Haumaier and A. Freund, Properties and reactivity of Fe-organic matter associations formed by coprecipitation versus adsorption: Clues from arsenate batch adsorption, Geochim. Cosmochim. Acta, 2014, 258–276 CrossRef CAS.
- L. Brinza, H. P. Vu, M. Neamtu and L. G. Benning, Experimental and Simulation Results of the Adsorption of Mo and V onto Ferrihydrite, Sci. Rep., 2019, 9(1), 1365, DOI:10.1038/s41598-018-37875-y.
- J. Gerke, Phosphate Adsorption by Humic/Fe-Oxide Mixtures Aged at pH 4 and 7 and by Poorly Ordered Fe-Oxide, Geoderma, 1993, 59(1), 279–288, DOI:10.1016/0016-7061(93)90074-U.
- Q. Shi, C. Jing and X. Meng, Competing Interactions of As Adsorption and Fe(III) Polymerization during Ferric Coprecipitation Treatment, Environ. Sci. Technol., 2018, 52(13), 7343–7350, DOI:10.1021/acs.est.8b01845.
- Q. Shi, G. E. Sterbinsky, S. Zhang, C. Christodoulatos, G. P. Korfiatis and X. Meng, Formation of Fe(III)–As(V) Complexes: Effect on the Solubility of Ferric Hydroxide Precipitates and Molecular Structural Identification, Environ. Sci.: Nano, 2020, 7(5), 1388–1398, 10.1039/D0EN00024H.
- Z. Wang, W. D. C. Schenkeveld, S. M. Kraemer and D. E. Giammar, Synergistic Effect of Reductive and Ligand-Promoted Dissolution of Goethite, Environ. Sci. Technol., 2015, 49(12), 7236–7244, DOI:10.1021/acs.est.5b01191.
- K. M. Towe and W. F. Bradley, Mineralogical Constitution of Colloidal “Hydrous Ferric Oxides.”, J. Colloid Interface Sci., 1967, 24(3), 384–392, DOI:10.1016/0021-9797(67)90266-4.
- J.-F. Boily and X. Song, Direct Identification of Reaction Sites on Ferrihydrite, Commun. Chem., 2020, 3(1), 1–8, DOI:10.1038/s42004-020-0325-y.
- F. M. Michel, L. Ehm, G. Liu, W. Q. Han, S. M. Antao, P. J. Chupas, P. L. Lee, K. Knorr, H. Eulert, J. Kim, C. P. Grey, A. J. Celestian, J. Gillow, M. A. A. Schoonen, D. R. Strongin and J. B. Parise, Similarities in 2- and 6-Line Ferrihydrite Based on Pair Distribution Function Analysis of X-Ray Total Scattering, Chem. Mater., 2007, 19(6), 1489–1496, DOI:10.1021/cm062585n.
- Y.-H. Pan, G. Vaughan, R. Brydson, A. Bleloch, M. Gass, K. Sader and A. Brown, Electron-Beam-Induced Reduction of Fe3+ in Iron Phosphate Dihydrate, Ferrihydrite, Haemosiderin and Ferritin as Revealed by Electron Energy-Loss Spectroscopy, Ultramicroscopy, 2010, 110(8), 1020–1032, DOI:10.1016/j.ultramic.2010.01.008.
- A. Masion, J. Rose, J.-Y. Bottero, D. Tchoubar and P. Elmerich, Nucleation and Growth Mechanisms of Iron Oxyhydroxides in the Presence of PO4 Ions. 3. Speciation of Fe by Small Angle X-Ray Scattering, Langmuir, 1997, 13(14), 3882–3885, DOI:10.1021/la962015+.
- H. Guénet, M. Davranche, D. Vantelon, J. Gigault, S. Prévost, O. Taché, S. Jaksch, M. Pédrot, V. Dorcet, A. Boutier and J. Jestin, Characterization of Iron–Organic Matter Nano-Aggregate Networks through a Combination of SAXS/SANS and XAS Analyses: Impact on As Binding, Environ. Sci.: Nano, 2017, 4(4), 938–954, 10.1039/C6EN00589F.
- O. Sadeghi, L. N. Zakharov and M. Nyman, Aqueous Formation and Manipulation of the Iron-Oxo Keggin Ion, Science, 2015, 347, 1359–1362, DOI:10.1126/science.aaa4620.
- T. C. Hiemstra, J. Mendez and J. Li, Evolution of the Reactive Surface Area of Ferrihydrite: Time, pH, and Temperature Dependency of Growth by Ostwald Ripening, Environ. Sci.: Nano, 2019, 6(3), 820–833, 10.1039/C8EN01198B.
- M. I. Tejedor-Tejedor and M. A. Anderson, The Protonation of Phosphate on the Surface of Goethite as Studied by CIR-FTIR and Electrophoretic Mobility, Langmuir, 1990, 6(3), 602–611, DOI:10.1021/la00093a015.
- H. Li, B. Wan, Y. Yan, Y. Zhang, W. Cheng and X. Feng, Adsorption of Glycerophosphate on Goethite (α-FeOOH): A Macroscopic and Infrared Spectroscopic Study, J. Plant Nutr. Soil Sci., 2018, 181(4), 557–565, DOI:10.1002/jpln.201700517.
- C. Xu, J. Li, R. Xu and Z. Hong, Sorption of Organic Phosphates and Its Effects on Aggregation of Hematite Nanoparticles in Monovalent and Bivalent Solutions, Environ. Sci. Pollut. Res., 2017, 24(8), 7197–7207, DOI:10.1007/s11356-017-8382-1.
- P. B. Ganta, M. Morshedizad, O. Kühn, P. Leinweber and A. A. Ahmed, The Binding of Phosphorus Species at Goethite: A Joint Experimental and Theoretical Study, Minerals, 2021, 11(3), 323, DOI:10.3390/min11030323.
- P. Persson, N. Nilsson and S. Sjöberg, Structure and Bonding of Orthophosphate Ions at the Iron Oxide–Aqueous Interface, J. Colloid Interface Sci., 1996, 177(1), 263–275, DOI:10.1006/jcis.1996.0030.
- Y. Arai and D. L. Sparks, ATR–FTIR Spectroscopic Investigation on Phosphate Adsorption Mechanisms at the Ferrihydrite–Water Interface, J. Colloid Interface Sci., 2001, 241(2), 317–326, DOI:10.1006/jcis.2001.7773.
- D. B. Abdala, P. A. Northrup, Y. Arai and D. L. Sparks, Surface Loading Effects on Orthophosphate Surface Complexation at the Goethite/Water Interface as Examined by Extended X-Ray Absorption Fine Structure (EXAFS) Spectroscopy, J. Colloid Interface Sci., 2015, 437, 297–303, DOI:10.1016/j.jcis.2014.09.057.
- J. P. H. Perez, D. J. Tobler, A. N. Thomas, H. M. Freeman, K. Dideriksen, J. Radnik and L. G. Benning, Adsorption and Reduction of Arsenate during the Fe2+-Induced Transformation of Ferrihydrite, ACS Earth Space Chem., 2019, 3(6), 884–894, DOI:10.1021/acsearthspacechem.9b00031.
- B. M. Toner, C. M. Santelli, M. A. Marcus, R. Wirth, C. S. Chan, T. McCollom, W. Bach and K. J. Edwards, Biogenic Iron Oxyhydroxide Formation at Mid-Ocean Ridge Hydrothermal Vents: Juan de Fuca Ridge, Geochim. Cosmochim. Acta, 2009, 73(2), 388–403, DOI:10.1016/j.gca.2008.09.035.
- A. Voegelin, R. Kaegi, J. Frommer, D. Vantelon and S. J. Hug, Effect of Phosphate, Silicate, and Ca on Fe(III)-Precipitates Formed in Aerated Fe(II)- and As(III)-Containing Water Studied by X-Ray Absorption Spectroscopy, Geochim. Cosmochim. Acta, 2010, 74(1), 164–186, DOI:10.1016/j.gca.2009.09.020.
- F. Maillot, G. Morin, Y. Wang, D. Bonnin, P. Ildefonse, C. Chaneac and G. Calas, New Insight into the Structure of Nanocrystalline Ferrihydrite: EXAFS Evidence for Tetrahedrally Coordinated Iron(III), Geochim. Cosmochim. Acta, 2011, 75(10), 2708–2720, DOI:10.1016/j.gca.2011.03.011.
- T. Hiemstra and W. Zhao, Reactivity of Ferrihydrite and Ferritin in Relation to Surface Structure, Size, and Nanoparticle Formation Studied for Phosphate and Arsenate, Environ. Sci.: Nano, 2016, 3(6), 1265–1279, 10.1039/C6EN00061D.
- P. Kraal, C. M. van Genuchten, T. Behrends and A. L. Rose, Sorption of Phosphate and Silicate Alters Dissolution Kinetics of Poorly Crystalline Iron (Oxyhydr)Oxide, Chemosphere, 2019, 234, 690–701, DOI:10.1016/j.chemosphere.2019.06.071.
- U. Schwertmann and R. M. Cornell, Iron Oxides in the Laboratory: Preparation and Characterization, Wiley-VCH Verlag GmbH& Co. KGaA, Weinheim, FRG, 2nd edn, 2000, p. 188 Search PubMed.
- X. Qiu, J. W. Thompson and S. J. L. Billinge, PDFgetX2: A GUI-Driven Program to Obtain the Pair Distribution Function from X-Ray Powder Diffraction Data, J. Appl. Crystallogr., 2004, 37(4), 678, DOI:10.1107/S0021889804011744.
- R. Mikutta and C. Mikutta, Stabilization of Organic Matter at Micropores (<2 nm) in Acid Forest Subsoils, Soil Sci. Soc. Am. J., 2006, 70(6), 2049–2056, DOI:10.2136/sssaj2005.0366N.
- A. Paredes, S. M. Acuña, L. Gutiérrez and P. G. Toledo, Zeta Potential of Pyrite Particles in Concentrated Solutions of Monovalent Seawater Electrolytes and Amyl Xanthate, Minerals, 2019, 9(10), 584, DOI:10.3390/min9100584.
- G. J. Smales and B. R. Pauw, The MOUSE Project: A Meticulous Approach for Obtaining Traceable, Wide-Range X-Ray Scattering Information, J. Instrum., 2021, 16(6), P06034, DOI:10.1088/1748-0221/16/06/P06034.
- A. J. Smith, S. G. Alcock, L. S. Davidson, J. H. Emmins, J. C. Hiller Bardsley, P. Holloway, M. Malfois, A. R. Marshall, C. L. Pizzey, S. E. Rogers, O. Shebanova, T. Snow, J. P. Sutter, E. P. Williams and N. J. Terrill, I22: SAXS/WAXS Beamline at Diamond Light Source – An Overview of 10 Years Operation, J. Synchrotron Radiat., 2021, 28(3), 939–947, DOI:10.1107/S1600577521002113.
Footnotes |
| † Electronic supplementary information (ESI) available. See DOI: https://doi.org/10.1039/d3na01045g |
| ‡ Current affiliation: Leibniz-Institut für Kristallzüchtung (IKZ), Max-Born-Str. 2, Berlin 12489, Germany. |
| This journal is © The Royal Society of Chemistry 2024 |