 Open Access Article
Development of a protocol of isolation of nanoparticles from patients' broncho-alveolar lavages for their in vitro toxicity assessment
Kévin
Bernal
a,
Ozge
Kose
a,
Lara
Leclerc
a,
Jean-Michel
Vergnon
bc,
Jérémie
Pourchez
 a and
Valérie
Forest
 *a
*a
aMines Saint-Etienne, Univ Jean Monnet, INSERM, U 1059 Sainbiose, Centre CIS, CS 62362 42023, 158 cours Fauriel, F-42023 Saint-Etienne Cedex 2, France. E-mail: vforest@emse.fr; Tel: +33477499776
bUniv Lyon, Univ Jean Monnet, INSERM, U 1059 Sainbiose, F-42023 Saint-Etienne, France
cCHU Saint-Etienne, Service de Pneumologie, F-42055 Saint-Etienne, France
First published on 4th December 2023
Abstract
To investigate potential correlations between human exposure to inhaled particles and pathological effects, the biological monitoring of nanoparticles in broncho-alveolar lavages (BAL) from patients has been proposed. To better understand the underlying mechanisms of toxicity, we propose to couple this biomonitoring of nanoparticles to their in vitro toxicity assessment. However, BAL obtained from regular clinical practice are conditioned with sodium hypochlorite solution (in a 50% v/v ratio), which is toxic to cells. The aim of this study was to develop a protocol to neutralize sodium hypochlorite, allowing to properly investigate the toxicity of the nanoparticles BAL contain. We first tried to neutralize chemically the sodium hypochlorite using H2O2, ascorbic acid or sodium ascorbate but this approach was unsuccessful. In addition, standard toxicology assays (MTT, LDH) could not be used because of interference with neutralizing solutions. We thus changed strategy and used ultracentrifugation to isolate nanoparticles from the sodium hypochlorite solution, with satisfactory extraction yields (88 to 100%). We then incubated the extracted nanoparticles with macrophages from the RAW264.7 cell line and assessed the cell viability and pro-inflammatory response. This study can be used as a proof-of-concept for further study of the biological impact of nanoparticles. This approach paves the way for studies aiming at a better understanding of the aetiology of some idiopathic diseases and underlying mechanisms.
1. Introduction
Despite intensive research, the impact of inhaled engineered nanoparticles on human health is not fully elucidated yet. The biological monitoring of nanoparticles in human lung tissues or fluids represents a promising way to investigate potential causal links between an exposure to inhaled particles and biological effects and even diseases (Fig. 1).1–5 This was perfectly exemplified by the correlation between the amount of asbestosis bodies in patient samples and specific lung diseases.6 More recently, it has been suggested that the chemical composition of broncho-alveolar lavages from idiopathic pulmonary fibrosis patients had a specific profile that can be distinguished from that of patients with other interstitial lung diseases or healthy subjects.7 We adopted this approach to detect and quantify nanoparticles in patients' biological samples such as colons,8 seminal and follicular fluids,9 amniotic fluids10 or broncho-alveolar lavages fluids.11,12 In particular, for these latter we have evidenced a concentration of submicron silica particles higher in patients suffering from sarcoidosis than in patients suffering from other interstitial lung diseases, suggesting a potential role of these inhaled particles in the aetiology and/or development of sarcoidosis.13,14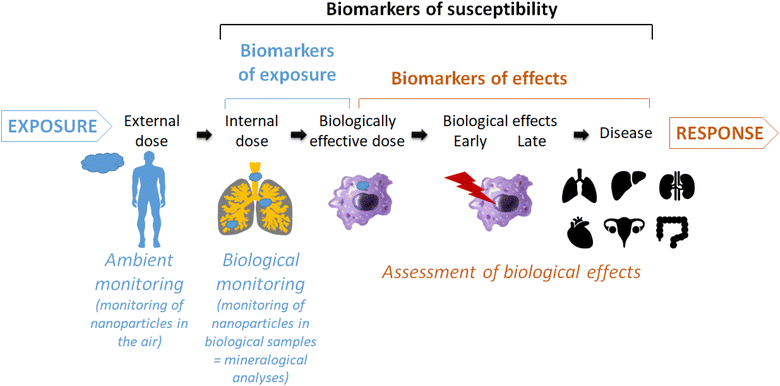 | ||
| Fig. 1 Schematic view of the place and usefulness of mineralogical analyses of biological samples as biomarker of exposure and relationship with biological/pathological effects. | ||
However, this finding must be treated with caution for different reasons. First, it has to be confirmed by the analysis of a larger cohort, which is the topic of our ongoing research. And second, in-depth mechanistic studies are needed to prove a causal link with a disease, and the only presence of an inhaled particle in a larger amount within biological samples is not sufficient. Indeed, mineralogical analyses (i.e. biological monitoring) allow quantifying the internal dose of inhaled particles in a lung sample which differs from the external dose that can be measured by ambient monitoring (i.e. atmospheric metrology or surface sampling) (Fig. 1). The accumulation of biopersistent particles, reaching the biologically effective dose, can induce biological and even pathological effects.2 To better characterize the continuum from exposure to disease, the identification of biomarkers is of particular interest. A biomarker has been defined as an alteration in cellular or biochemical components, processes, structures or functions which is measurable in a biological system or sample.15 Three types of biomarkers have been defined: biomarkers of exposure, effect and susceptibility. In the context of occupational health, biomarkers can be particularly useful to support adequate assessment and management of risk with respect to nanomaterial exposure and effect.3
To better understand the toxicity potential of inhaled particles found in patients we proposed to couple the biomonitoring of particles in lung clinical samples with the in vitro assessment of their toxicity.16 Concretely, we propose to incubate cells with particles extracted from patients' broncho-alveolar lavages and then analyse the cell response obtained in terms of induction of cell death, pro-inflammatory response, oxidative stress, etc.
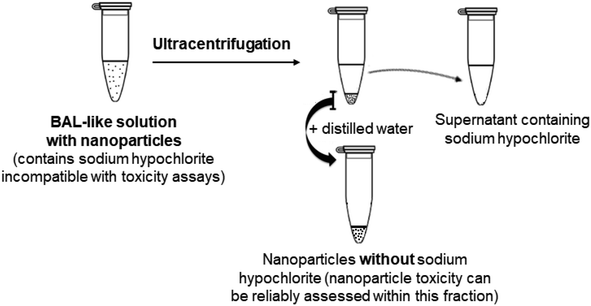
The aim of the present proof-of-concept study is to demonstrate the feasibility of this approach. To that purpose, we first had to develop a protocol for the pre-treatment of the clinical samples. Indeed, after collection, the broncho-alveolar lavages were conditioned with sodium hypochlorite, which was added to the samples in a 50% v/v ratio. This solution has been shown to be toxic for cells17,18 and in vitro toxicity assessments of these samples cannot be performed without first neutralizing the sodium hypochlorite. Indeed, the toxicity of the matrix should be eliminated to properly investigate the toxicity of the nanoparticles it contains. We thus developed a protocol to that purpose. We first tried to neutralize chemically the sodium hypochlorite solution using different compounds. Because this approach was unsuccessful we then isolated nanoparticles contained in broncho-alveolar lavages by ultracentrifugation. We then incubated the extracted nanoparticles with macrophages from the RAW264.7 cell line and assessed the cell response.
2. Results and discussion
Broncho-alveolar lavages (BAL) are routinely performed in the Chest diseases and thoracic oncology Department of the University Hospital of Saint-Etienne. They consist of a warmed saline solution that is injected in the selected area of lung and slowly aspirated. Samples are then added with an equivalent volume of sodium hypochlorite to eliminate cells and proteins and prevent microorganism proliferation. However, for the development of our protocol of neutralisation we did not use these precious clinical samples. Instead, we reconstituted a model of BAL by mixing an equal volume of saline solution and sodium hypochlorite solution. This solution will be called “BAL-like solution” throughout the text.2.1. Chemical neutralisation of sodium hypochlorite from the BAL-like solution
| H2O2 (aq) + NaClO (aq) → NaCl (aq) + H2O (aq) + O2 (g) | (1) |
The second and third protocols we assessed were based on the use of two forms of vitamin C: ascorbic acid (C6H8O6) and sodium ascorbate (C6H7O6Na) which have been shown to neutralize sodium hypochlorite as follows:
| C6H8O6 + NaClO → C6H6O6 + H2O + NaCl | (2) |
| C6H7O6Na + NaClO → C6H6O6 + NaOH + NaCl | (3) |
We first observed the pH variation occurring during the three neutralisation reactions.
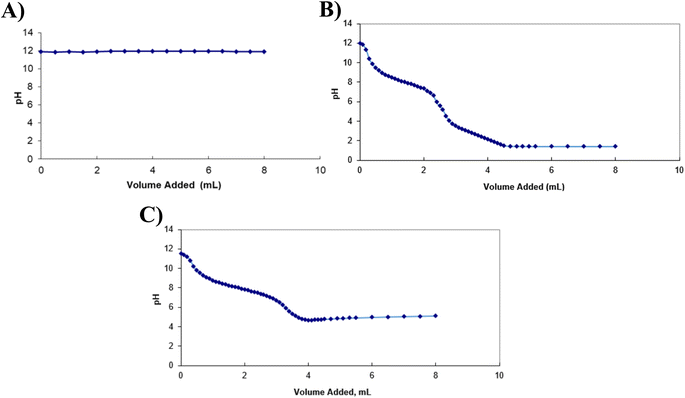
As illustrated by Fig. 2, when H2O2 was added to the BAL-like solution, no pH variation was observed, suggesting that either the reaction (1) did not affect the pH or it did not occur. This latter hypothesis is unlikely as the formation of bubbles was observed during the titration, sign of the production of a gas in the solution. Titration curves obtained using ascorbic acid and sodium ascorbate allowed determining equivalent volumes of 2.7 mL and 3.35 mL respectively.
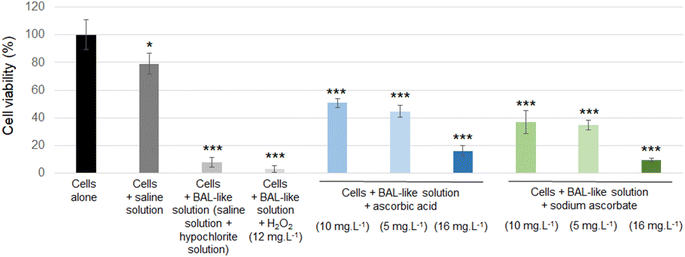
Then the efficiency of the neutralisation protocols was evaluated with regard to cell viability and was quantified using the MTT assay, as reported by Fig. 4.
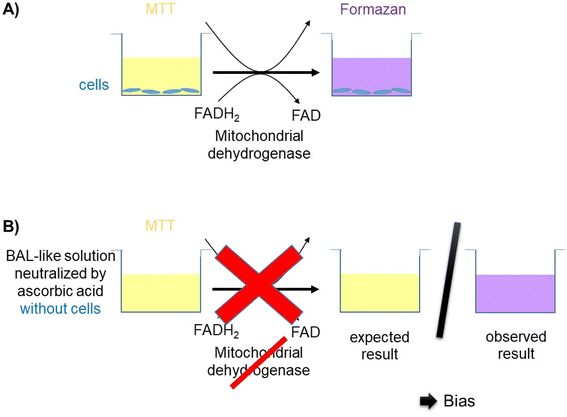
Cell viability was decreased when cells were exposed to a saline solution but it decreased to less than 10% when this saline solution was added with hypochlorite solution (i.e. when cells were incubated with the BAL-like solution), confirming the high cytotoxicity of hypochlorite ions. Cell viability was not restored when BAL-like solutions were neutralized with H2O2, unlike what was observed when BAL-like solutions were neutralized either with ascorbic acid or sodium ascorbate. However, in the best case, cell viability was restored to only 50%, when using 10 mg L−1 ascorbic acid. We therefore decided to continue with this compound. To ensure the reliability of our results we performed some controls. We observed that when the BAL-like solution neutralized by 10 mg L−1 ascorbic acid was mixed with MTT reagent (in the absence of cells), a change of colour of the solution occurred as schematically illustrated by Fig. 5.
It suggests that our previous results could be biased because of interactions between our solutions and MTT. To better understand this phenomenon, we performed further investigations.
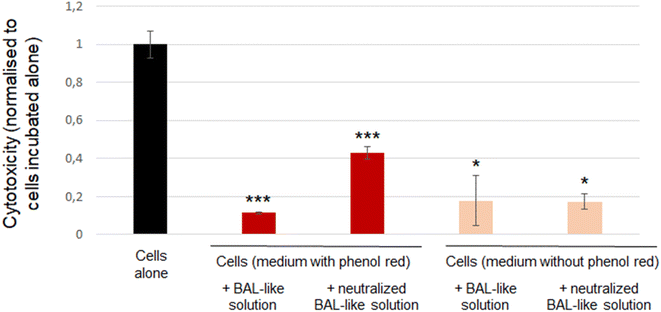
To confirm the inefficiency of neutralisation by ascorbic acid, we used another cytotoxicity assay: the LDH release. We observed that cytotoxicity exhibited by the cells incubated with BAL-like solution neutralized by 10 mg L−1 ascorbic acid was higher than that exhibited by the cells incubated with BAL-like solution (26% and 7% respectively). However, another bias could be suspected with this experiment as culture medium contained phenol red and hypochlorite solution has a bleaching power. We may thus question the impact of this phenomenon on a colorimetric assay. Indeed, we could clearly observe a change in the colour of cell culture medium when it was added with BAL-like solutions. To shed light on this issue, we performed the same experiment using a culture medium without phenol red. To compare results between the different culture conditions, the signal observed for each condition was normalised to that of cells incubated alone (negative control). As reported in Fig. 6, the same level of cytotoxicity was induced by BAL-like solution and neutralized BAL-like solution (right part of the figure). We also observed that whatever the condition tested, the cytotoxicity was lower for the experimental groups than for the control group (cells alone), suggesting that even in the absence of phenol red, this assay remains biased. And indeed, despite the transparency of the cell culture medium, a colour change was still observed when BAL-like solution was added.
Taken together these findings lead to the following conclusions: (i) standard toxicological assays such as MTT or LDH assays based on colorimetric detection are inadequate and thus cannot be used because of interference and (ii) chemical neutralisation of hypochlorite solution by ascorbic acid is not efficient as shown by a similar cell viability when cells were incubated either with neutralized or non-neutralized BAL-like solutions.
Therefore, we changed strategy and adopted another approach consisting of eliminating physically the hypochlorite solution, i.e. we aimed at extracting the nanoparticles from BAL by ultracentrifugation.
2.2. Nanoparticle extraction from the BAL-like solution
| BAL-like solution | Pellet | Extraction yield | |
|---|---|---|---|
| Concentration of Ce | 200.24 ± 23.29 μg mL−1 | 202.33 ± 13.4 μg mL−1 | 101% |
| Concentration of Ti | 747.12 ± 162.5 μg mL−1 | 658.33 ± 136.35 μg mL−1 | 88% |
The extraction yields were excellent, showing that the major, if not the entire part, of the nanoparticles was recovered after ultracentrifugation. In addition, to ensure the reliability of our results we also assessed the concentration of Ce and Ti in the supernatants. They were respectively 0.09 ± 0.12 and 0.04 ± 0.07 μg mL−1, confirming the absence of CeO2 or TiO2 nanoparticles in this fraction. Finally, to verify that most of the nanoparticles were recovered after resuspension of the pellet into distilled water, we washed the tubes three times with distilled water and analyzed the concentrations of Ce and Ti in these washes. They were found to be negligible, ranging between 0 and 6 μg mL−1.
Regarding the BAL-like solution before ultracentrifugation, it should be noted that the concentrations of Ce and Ti should have been about 500 μg mL−1. It was almost the case for Ti, but for Ce the experimentally measured value was about half the theoretical one. We thus analysed the concentrations of Ti and Ce in the nanoparticle stock solutions, they were found to be 1466.38 μg mL−1 (theoretically 1600 μg mL−1) for Ti and 2023.94 μg mL−1 (instead of 4680 μg mL−1) for Ce. This discrepancy explains why the concentration of Ce in the BAL-like solution was half the expected one.
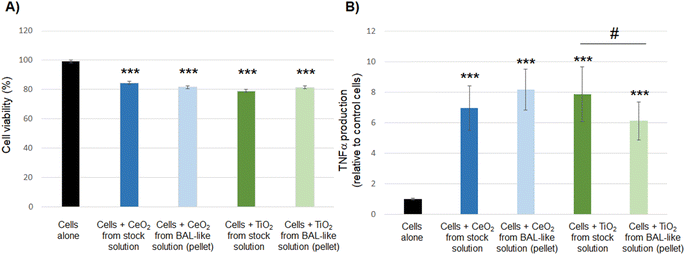
Taken together, our results show that nanoparticles extracted from the BAL-like solution exhibit a toxicity profile similar to that of native nanoparticles. It suggests that we were able to restore the initial level of toxicity of nanoparticles, validating our experimental protocol and enabling us to use these solutions for toxicity assessment without any bias induced by the sodium hypochlorite conditioning solution.
3. Experimental
3.1. BAL-like solutions
For the development of the neutralisation protocol we did not use precious clinical samples, we reconstituted a model of BAL (the so-called “BAL-like solution”) by mixing an equal volume of a saline solution (0.9% w/w NaCl in distilled water) with sodium hypochlorite solution (2.6%). The solution was then filtered (0.45 μm).3.2. Chemical neutralisation of the sodium hypochlorite solution
![[thin space (1/6-em)]](https://www.rsc.org/images/entities/char_2009.gif) 000 cells per well (in a volume of 150 μL) were seeded in 96-well-plates and were allowed to adhere overnight. Cells were exposed to BAL-like solutions (neutralized or not) and after a 24 h incubation 20 μL of MTT (5 μg mL−1, Sigma-Aldrich) were added in each well, and plates were incubated for 3 h at 37 °C. Then, 200 μL of dimethylsulfoxide (DMSO, ThermoFisher Scientific) was added and thoroughly mixed to dissolve the crystals. The optical density of each sample was determined using a microplate reader (Multiskan RC, Thermolabsystems) set to 570 nm. Negative and positive controls were included: cells incubated alone and cells incubated in the presence of 0.1% Triton X-100 (Sigma-Aldrich).
000 cells per well (in a volume of 150 μL) were seeded in 96-well-plates and were allowed to adhere overnight. Cells were exposed to BAL-like solutions (neutralized or not) and after a 24 h incubation 20 μL of MTT (5 μg mL−1, Sigma-Aldrich) were added in each well, and plates were incubated for 3 h at 37 °C. Then, 200 μL of dimethylsulfoxide (DMSO, ThermoFisher Scientific) was added and thoroughly mixed to dissolve the crystals. The optical density of each sample was determined using a microplate reader (Multiskan RC, Thermolabsystems) set to 570 nm. Negative and positive controls were included: cells incubated alone and cells incubated in the presence of 0.1% Triton X-100 (Sigma-Aldrich).
For the bias study, cell culture supernatant was removed by aspiration before the addition of 200 μL of fresh culture medium and 20 μL of MTT. The other steps of the protocol remained unchanged.
![[thin space (1/6-em)]](https://www.rsc.org/images/entities/char_2009.gif) 000 cells per well (in a volume of 150 μL) were seeded in 96-well-plates and were allowed to adhere overnight. Cells were exposed to BAL-like solutions (neutralized or not) and after a 24 h incubation cell membrane integrity was evaluated. The cellular release in the supernatant of cytoplasmic lactate dehydrogenase (LDH) was assessed using the CytoTox-96™ Homogeneous Membrane Integrity Assay (Promega) according to the manufacturer's instructions. The optical density of the samples was determined using a microplate reader (Multiskan RC, Thermolabsystems) set to 490 nm. Three independent experiments were performed, each in quadruplicate and the activity of the released LDH was reported to that of negative control cells (cells alone). A positive control consisting of the maximal cellular LDH released after cells lysis was used.
000 cells per well (in a volume of 150 μL) were seeded in 96-well-plates and were allowed to adhere overnight. Cells were exposed to BAL-like solutions (neutralized or not) and after a 24 h incubation cell membrane integrity was evaluated. The cellular release in the supernatant of cytoplasmic lactate dehydrogenase (LDH) was assessed using the CytoTox-96™ Homogeneous Membrane Integrity Assay (Promega) according to the manufacturer's instructions. The optical density of the samples was determined using a microplate reader (Multiskan RC, Thermolabsystems) set to 490 nm. Three independent experiments were performed, each in quadruplicate and the activity of the released LDH was reported to that of negative control cells (cells alone). A positive control consisting of the maximal cellular LDH released after cells lysis was used.
To determine potential colorimetric bias, experiments were performed in different media: either DMEM containing phenol red (Sigma-Aldrich) or DMEM without phenol red (Pan-Biotech).
3.3. Nanoparticles extraction by ultracentrifugation
As before, we did not use clinical samples for the development of the protocol. We used BAL-like samples added with a known amount of nanoparticles.![[thin space (1/6-em)]](https://www.rsc.org/images/entities/char_2009.gif) 000 rpm, at room temperature. Supernatant was recovered and transferred into a new tube, the pellet was resuspended into 4.2 mL of distilled water and transferred into a new tube. The particle concentration in these two fractions was determined by ICP-AES.
000 rpm, at room temperature. Supernatant was recovered and transferred into a new tube, the pellet was resuspended into 4.2 mL of distilled water and transferred into a new tube. The particle concentration in these two fractions was determined by ICP-AES.
![[thin space (1/6-em)]](https://www.rsc.org/images/entities/char_2009.gif) 000 cells (in a volume of 150 μL) were seeded per well in 96-well-plates and were allowed to adhere overnight. Cells were exposed for 24 h to the previously mentioned solutions. The production of TNF-α was assessed in the cell culture supernatant using a commercial ELISA kit (Quantikine® Mouse TNF-α Immunoassay, R&D Systems) according to the manufacturer's instructions. The optical density of each sample was determined using a microplate reader (Multiskan RC, Thermolabsystems) set to 450 nm. A standard curve was established and results were expressed in picograms of TNF-α per millilitre of supernatant. Three independent experiments were performed, each in duplicate and the production of TNF-α was reported to that of control cells (cells alone).
000 cells (in a volume of 150 μL) were seeded per well in 96-well-plates and were allowed to adhere overnight. Cells were exposed for 24 h to the previously mentioned solutions. The production of TNF-α was assessed in the cell culture supernatant using a commercial ELISA kit (Quantikine® Mouse TNF-α Immunoassay, R&D Systems) according to the manufacturer's instructions. The optical density of each sample was determined using a microplate reader (Multiskan RC, Thermolabsystems) set to 450 nm. A standard curve was established and results were expressed in picograms of TNF-α per millilitre of supernatant. Three independent experiments were performed, each in duplicate and the production of TNF-α was reported to that of control cells (cells alone).
3.4. Statistical analyses
Results are expressed as means of 3 independent experiments where endpoints were assessed in quadruplicates unless otherwise stated. One-way ANOVA analyses were performed to determine statistical differences (p < 0.05) between experimental and control groups or between experimental groups.4. Conclusions
The chemical neutralisation of sodium hypochlorite solution was found to be ineffective. In addition, standard toxicology assays could not be used because of interferences with sodium hypochlorite neutralizing solution. On the contrary, using ultracentrifugation was found to be an efficient approach to isolate nanoparticles from the sodium hypochlorite solution, with excellent extraction yields. This study can therefore be used as a proof-of-concept for further toxicological assays in biological samples containing sodium hypochlorite solution. It opens new perspectives for the study of the biological impact of nanoparticles. This approach paves the way for studies aiming at a better understanding of the aetiology of some idiopathic diseases and underlying mechanisms.Conflicts of interest
There are no conflicts to declare.Acknowledgements
The authors would like to acknowledge Juan Felipe Porras Yaruro and Karla Mirallès for their participation to the experiments as part of their research project.References
- J. D. Groopman and T. W. Kensler, Carcinogenesis, 1999, 20, 1–11 CrossRef CAS.
- J. Angerer, U. Ewers and M. Wilhelm, Int. J. Hyg. Environ. Health, 2007, 210, 201–228 CrossRef CAS.
- I. Iavicoli, V. Leso, M. Manno and P. A. Schulte, J. Nanopart. Res., 2014, 16, 2302 CrossRef.
- M. Rinaldo, P. Andujar, A. Lacourt, L. Martinon, M. Canal Raffin, P. Dumortier, J.-C. Pairon and P. Brochard, Ann. Occup. Hyg., 2015, 59, 669–680 CrossRef CAS.
- E. Bergamaschi, J. Nanomater., 2012, 2012, 564121 Search PubMed.
- P. De Vuyst, A. Karjalainen, P. Dumortier, J. C. Pairon, E. Monsó, P. Brochard, H. Teschler, A. Tossavainen and A. Gibbs, Eur. Respir. J., 1998, 11, 1416–1426 CrossRef CAS.
- E. Bargagli, F. Lavorini, M. Pistolesi, E. Rosi, A. Prasse, E. Rota and L. Voltolini, J. Trace Elem. Med. Biol., 2017, 42, 39–44 CrossRef CAS.
- L. Rinaldi, G. Barabino, J.-P. Klein, D. Bitounis, J. Pourchez, V. Forest, D. Boudard, L. Leclerc, G. Sarry, X. Roblin, M. Cottier and J.-M. Phelip, Dig. Liver Dis., 2015, 47, 602–607 CrossRef CAS PubMed.
- D. Bitounis, J.-P. Klein, L. Mery, A. El-Merhie, V. Forest, D. Boudard, J. Pourchez and M. Cottier, Anal., 2018, 143, 475–486 RSC.
- T. Raia-Barjat, C. Prieux, L. Leclerc, G. Sarry, L. Grimal, C. Chauleur, J. Pourchez and V. Forest, J. Trace Elem. Med. Biol., 2020, 60, 126477 CrossRef CAS PubMed.
- V. Forest, J.-M. Vergnon, C. Guibert, D. Bitounis, L. Leclerc, G. Sarry and J. Pourchez, Nanotoxicology, 2017, 11, 1211–1224 CrossRef CAS.
- D. Bitounis, V. Barnier, C. Guibert, J. Pourchez, V. Forest, D. Boudard, J.-F. Hochepied, P. Chelle, J.-M. Vergnon and M. Cottier, Nanoscale, 2018, 10, 2955–2969 RSC.
- V. Forest, J. Pourchez, C. Guibert, D. Bitounis, L. Leclerc, G. Sarry and J.-M. Vergnon, Environ. Sci.: Nano, 2019, 6, 1343–1350 RSC.
- V. Forest, J. Pourchez, C. Pélissier, S. Audignon Durand, J.-M. Vergnon and L. Fontana, Toxics, 2021, 9, 204 CrossRef CAS PubMed.
- M. Manno, C. Viau, J. Cocker, C. Colosio, L. Lowry, A. Mutti, M. Nordberg and S. Wang, Toxicol. Lett., 2010, 192, 3–16 CrossRef CAS PubMed.
- V. Forest, J.-M. Vergnon and J. Pourchez, Chem. Res. Toxicol., 2017, 30, 1655–1660 Search PubMed.
- T. Vouzara, E. Koulaouzidou, F. Ziouti and N. Economides, Int. Endod. J., 2016, 49, 764–773 CrossRef CAS.
- A.-L. Severing, J.-D. Rembe, V. Koester and E. K. Stuermer, J. Antimicrob. Chemother., 2019, 74, 365–372 CrossRef CAS PubMed.
- R. F. Hamilton, S. A. Thakur and A. Holian, Free Radical Biol. Med., 2008, 44, 1246–1258 CrossRef CAS.
- R. Chakrabarti, S. Kundu, S. Kumar and R. Chakrabarti, J. Cell. Biochem., 2000, 80, 133–138 CrossRef CAS.
- V. Forest, L. Leclerc, J.-F. Hochepied, A. Trouvé, G. Sarry and J. Pourchez, Toxicol. In Vitro, 2017, 38, 136–141 CrossRef CAS PubMed.
- O. Kose, M. Tomatis, L. Leclerc, N.-B. Belblidia, J.-F. Hochepied, F. Turci, J. Pourchez and V. Forest, Chem. Res. Toxicol., 2020, 33, 2324–2337 Search PubMed.
- C. G. Mackenzie, J. B. Mackenzie and P. Beck, J. Biophys. Biochem. Cytol., 1961, 9, 141–156 Search PubMed.
| This journal is © The Royal Society of Chemistry 2024 |

