DOI:
10.1039/D3NA00691C
(Paper)
Nanoscale Adv., 2024,
6, 876-891
The essence of the effect of strain rate on the mechanical behavior of the Fe14.6Ni (at%) elastocaloric refrigeration alloy: a molecular dynamics study†
Received
27th August 2023
, Accepted 5th December 2023
First published on 22nd December 2023
Abstract
In this research, a molecular dynamics (MD) model was adopted to investigate the essence of the effect of strain rate on the mechanical behavior of the Fe14.6Ni (at%) elastocaloric refrigeration alloy. The study showed that the mechanical behavior of the Fe14.6Ni (at%) alloy was dependent on the strain rate. Besides, the investigation of temperature demonstrated that the strain rate influenced mechanical behavior by changing the transient temperatures. Furthermore, it was found that the adiabatic temperature change (ΔTadi) was high and up to 51 K, which was a 1.57 times improvement. Finally, the conclusion was drawn that the strain rate influenced the mechanical behavior by changing the transient total kinetic energy and the phase content evolution processes, which was the essence of the effect of strain rate on the mechanical behavior. This work has clarified the essence and enriched the theory of the effect of strain rate on the mechanical behavior of elastocaloric refrigeration alloys.
| Xianfa Li Xianfa Li, born in 1994, is currently a lecturer at the School of Mechanical and Power Engineering, Henan Polytechnic University, China. He received his doctoral degree in mechanical engineering from the China University of Petroleum (East China), China, in 2023. His research interests include Fe-based elastocaloric refrigeration alloys, shape memory alloys (SMAs) and laser manufacturing. |
| Junyu An Junyu An, born in 2000, is currently a master candidate at the Mechanical and Electrical Engineering Institute, China University of Petroleum, China. His research interests include Fe-based elastocaloric refrigeration alloys and shape memory alloys (SMAs). |
| Shuisheng Chen Shuisheng Chen, born in 1978, is currently a lecturer at the School of Mechanical and Power Engineering, Henan Polytechnic University, China. He received his doctoral degree in mechanical engineering from Tongji University, China, in 2011. His research interests include aluminum magnesium alloy materials and automobile lightweight. |
| Guoqiang Chen Guoqiang Chen, born in 1978, is currently a professor at the School of Mechanical and Power Engineering, Henan Polytechnic University, China. He received his doctoral degree in mechanical engineering from Tongji University, China, in 2011. His research interests include electric vehicles, automotive electronics, autonomous driving, and robots. |
| Yi Liu Yi Liu, born in 1994, is currently a doctoral candidate at the School of Mechanical Engineering, Southeast University, China. His research interests are thermodynamics in metal friction and wear. |
| Yongjun Shi Yongjun Shi, born in 1973, is currently a professor at the Mechanical and Electrical Engineering Institute, China University of Petroleum of Huadong, China. He received his doctoral degree in mechanical engineering at Shanghai Jiaotong University, China, in 2003. |
| Long Zhou Long Zhou, born in 1978, is currently an associate professor at the School of Mechanical and Power Engineering, Henan Polytechnic University, China. He received his doctoral degree in engineering thermophysics from the Dalian University of Technology, China, in 2011. His research interests include heat transfer, lubrication and tribology in internal combustion engines, heat conduction theory, and heat management in Li-ion batteries. |
1. Introduction
Recently, elastocaloric refrigeration alloys, as emerging refrigeration materials, have been widely recognized by scholars due to their high efficiency, low cost, and eco-friendliness, which provide a solution to replace traditional vapor compression gas refrigerants.1–3 For instance, H. Ossmer et al.4 investigated the temperature profiles of magnetron-sputtered superelastic TiNi films of 20 μm thickness during tensile stress cycling at different strain rates. The results demonstrated that the ΔTadi increased with increasing strain rates and the evolution of temperature profiles could be quantitatively described by a phenomenological Tanaka-type model of martensitic transformation combined with a heat transfer model. Marvin Schmidt et al.5 designed a scientific test setup to investigate the influence of strain rate on the elastocaloric effect of the NiTi alloy. The results illustrated that the mean surface temperature of the SMA ribbon showed a consistent ΔTadi of 18.2 K at every strain rate. Stefan Seelecke et al.6 developed a newly quaternary Ni–Ti–Cu–V alloy and performed tensile experiments at different strain rates in various thermodynamic cycles. The conclusions were drawn that the transformation stress was dependent on strain rates and an increasing strain rate contributed to an increasing ΔTadi during phase transformation. Li et al.2 prepared a multiferroic Ni50Mn35In15 meta-magnetic shape memory alloy by directional solidification and investigated various elastocaloric effects of the alloy, including the inverse magnetocaloric effect around inverse martensitic transformation, conventional magnetocaloric effect around Curie transition and elastocaloric effect above Curie transition. The conclusion illustrated that the elastocaloric effect was particularly striking among various caloric effects, where the maximum high ΔTadi up to −19.7 K was achieved with an increasing strain rate on removing a moderate stress of 350 MPa, with a specific ΔTadi of 56 K GPa−1. Bonnot et al.7 studied the elastocaloric effect in the vicinity of the martensitic transition of the Cu–Zn–Al alloy by applying different stress loadings. The results showed that the entropy change associated with the whole transformation (ΔSt) was coincident at different stress loadings, which agreed with estimations based on the Clausius–Clapeyron equation. Wang et al.8 conducted a systematic investigation of the effect of Gd substitution for Sn on martensitic transformation temperature, microstructure, elastocaloric effect and mechanical properties of the Mn49Ni41Sn10 ferromagnetic shape memory alloy. It was found that the Mn49Ni41Sn9.4Gd0.6 alloy showed a prominent elastocaloric effect and stable superelasticity among these alloys and a constant ΔTadi of −9.6 K showed no apparent degradation under a compressive stress of 400 MPa during 200 cycles at different strain rates. Muhammad Imran et al.9 employed the replication casting technique to fabricate Ni–Fe–Ga alloy foams with NaAlO2 as a space holder and investigated the martensite transformation, superelasticity and compressive elastocaloric properties of the annealed foam. As a result, the foam exhibited a ΔTadi 3.4 K and large specific elastocaloric effect strength |ΔT/Δσ| = 56.7 K GPa−1 under an external stress of 60 MPa. And the results also showed that the ΔTadi increased gradually with increasing strain rates due to an increasing fraction of materials subjected to stress-induced martensite and a better adiabatic state.10 The experimental method has been widely adopted and achieved many achievements in the study of the influence of strain rate on the elastocaloric effect of Ni–Ti-based,11–13 Cu-based,14 Fe-based15 and Ni–Mn-based alloys.16
However, limited by the experimental method, the essence of the effect of strain rate on mechanical behavior remains unclear. As a result, it is difficult to accurately determine the variation trend of the phase transformation stage with increasing strain rates, which leads to deviations in the study of the elastocaloric effect of elastocaloric refrigeration alloys.2,7,12 Fortunately, the booming development of MD technology has made it possible to study the mechanical behavior at microscopic and atomic scales.17–19 Investigating mechanical behavior through MD simulation can not only easily realize adiabatic conditions,20 but also study the evolution processes of the parameters at different strain rates dynamically, such as stress, temperature, total kinetic energy, phase content, etc.,21 which overcomes the shortcomings of the experimental methods. More importantly, the essence of the effect of strain rate on the mechanical behavior can be revealed with the assistance of process parameters.22 For example, Yong Zhang et al.23 developed the theory of high entropy materials through MD simulation and calculation to predict structures and properties of high-entropy alloys. Zhang et al.24 performed MD simulations to investigate the mechanisms of the superelastic behavior of zirconia nanopillars. It was found that up to 13.1% strain can be recovered by inverse martensite transformation for [0 0 1] oriented zirconia nanopillars under uniaxial compressive loading. Wang et al.25 investigated the mechanical behavior and phase transformation of NiTi nanocrystalline shape memory alloys with gradient structures by MD simulation. And it was found that the maximum tensile stress and irrecoverable strain decreased with an increase in the average grain size of the surface layer. For non-recoverable strain, the maximum value was 0.5% and the minimum value was 0.25%. The degradation of superelasticity was mainly attributed to the plastic deformation of the amorphous phase and GBs. J. Zhang et al.22 observed a novel stress–strain relationship of two-stage linear elastic deformation of [001]-oriented tetragonal zirconia nanopillars by MD uniaxial tensile simulation. Shi et al.26 studied the mechanical properties of Fe–Co elastocaloric refrigeration alloys through MD simulation. The evaluation of the mechanical properties of the alloy showed that the mechanical properties of the Fe9.5Co (at%) alloys were greatly affected by the strain rate and temperature. And research on the essence of unsteady mechanical behavior of Fe14.6Ni (at%) elastocaloric refrigeration alloys was also conducted28 The conclusion was drawn that the essence of the unsteady mechanical behavior of Fe14.6Ni (at%) alloys in an adiabatic system was the macro-performance of the interaction between the crystal structure and the total kinetic energy evolution.
Currently, to the best of our knowledge, little research has been reported about the essence of the effect of strain rate on the mechanical behavior of elastocaloric refrigeration alloys through MD simulation.22,24,25 As a typical martensite transformation material, the Fe14.6Ni (at%) alloy has a huge latent heat effect. The martensite transformation enthalpy is as high as 34.43 J g−1.27,28 Therefore, in this study, MD simulations were performed to investigate the essence of the effect of strain rate on the mechanical behavior of the Fe14.6Ni (at%) alloy. First, the MD model was adopted and the EAM potential function was introduced to perform the uniaxial tensile simulation. Then, at different strain rates, the investigations of the mechanical behavior and temperature evolution processes of the Fe14.6Ni (at%) alloy were conducted in an adiabatic system. Furthermore, the variation trends of the total kinetic energy at different strain rates were studied. Finally, the phase content evolution processes at different strain rates were investigated.
2. MD simulation system settings
The MD simulations were conducted by adopting the package Large-Scale Atomic/Molecular Massively Parallel Simulator (LAMMPS)29 and the Open Visualization Tool (OVITO) software was chosen for visualizing the structure.30 The EAM potential function developed by G. Bonny et al.31 was used as the force field in the uniaxial tensile simulation process of the Fe14.6Ni (at%) elastocaloric refrigeration alloy. For the EAM potential, the total energy of the system is| | 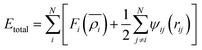 | (1) |
where Fi is the embedding function, ψij is the atom pair interaction, rij is the distance between atom i and atom j, and  is the electron density of atom i.
Periodic boundary conditions were considered for the three directions of Cartesian coordinates for the elimination of dimensional boundary effects. Newton's equations of motion were integrated using the velocity-Verlet algorithm.23,32 The canonical NVT ensemble was used in the simulation, where N, V, and T are the atoms' numbers, system volume, and temperature, respectively. The canonical NVT ensemble was used to simulate the adiabatic system of uniaxial tensile simulation. The system temperature was controlled by a Nose–Hoover thermostat.33,34 Before the uniaxial tensile simulation started, the system was subjected to energy minimization with a conjugate gradient algorithm.22,23 The timestep was set at 1 fs. The cutoff for FCC, BCC and HCP was set to be 2.42 Å, 3.41 Å and 3.91 Å, respectively.
2.1 The parameters of the Fe–Ni MD model
In this study, Ni atoms were randomly distributed in the Fe matrix forming an Fe14.6Ni (at%) solid solution alloy. The space group was the body-centered cubic (BCC) structure of Im![[3 with combining macron]](https://www.rsc.org/images/entities/char_0033_0304.gif) m 229 and the lattice constant was a = b = c = 2.863 Å. As shown in Fig. S0,† the model of the Fe14.6Ni (at%) alloy was a rectangular block to minimize the simulation so that the system could reach equilibrium soon. The lengths of the model in the x, y, and z directions are 56.94 Å, 28.47 Å and 28.47 Å, respectively. The Fe14.6Ni (at%) alloy model was laid in a vacuum box and the mass center of the model was matched up with the origin of the Cartesian coordinates. As shown in Fig. S1,† the correctness of the MD model and the applicability of the EAM potential function have been verified by XRD methods according to the previous study.27,28
m 229 and the lattice constant was a = b = c = 2.863 Å. As shown in Fig. S0,† the model of the Fe14.6Ni (at%) alloy was a rectangular block to minimize the simulation so that the system could reach equilibrium soon. The lengths of the model in the x, y, and z directions are 56.94 Å, 28.47 Å and 28.47 Å, respectively. The Fe14.6Ni (at%) alloy model was laid in a vacuum box and the mass center of the model was matched up with the origin of the Cartesian coordinates. As shown in Fig. S1,† the correctness of the MD model and the applicability of the EAM potential function have been verified by XRD methods according to the previous study.27,28
2.2 Research on the mechanical behavior
To evaluate the superelastic properties of the Fe14.6Ni (at%) elastocaloric refrigeration alloy, the mechanical behaviors were evaluated by MD simulation. The sintered model was selected to perform the uniaxial loading stretch simulations of the Fe14.6Ni (at%) alloy by the MD method. In the MD simulation of stress, each atom stress tensor was measured.22 The average stress of the Fe14.6Ni (at%) alloy was calculated using the following formula:| | 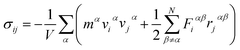 | (2) |
where i, j = x, y, z represent the three spatial directions, mα is the mass of the atom α, vα is the velocity of the atom α, Fαβ and rαβ are the interaction force and the distance between atoms α and β, respectively.
The uniaxial tensile simulations were performed at strain rates of 0.1 ps−1, 0.2 ps−1, 0.3 ps−1, 0.4 ps−1 and 0.5 ps−1 in the x-axis direction from strain = 0 to strain = 1.200 in the adiabatic system to obtain the mechanical behavior of the Fe14.6Ni (at%) elastocaloric refrigeration alloy.
2.3 Crystal structure evolution
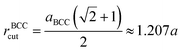
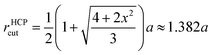
In addition to the analysis of the uniaxial tensile simulation process, a common neighborhood analysis (CNA) for describing the evolution of the crystal structure was also conducted. CNA has been widely used35–37 to describe the crystal structure evolution during the nanomaterials melting, sintering and mechanical deformation process.38–43 In general, two atoms were considered to be bonded if their distance was less than the specified cutoff radius rcut. For the FCC, BCC and HCP structures, the cutoff radius was defined as eqn (3), (4) and (5), respectively.| | 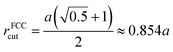 | (3) |
| |  | (4) |
| |  | (5) |
where rcut is the cutoff radius, a is the lattice constant for the crystal structure concerned and in the HCP case, x = (c/a)/1.633, where 1.633 is the ideal c/a for the HCP crystal.38
2.4 The calculation of energy
To reveal the essence of the effect of strain rate on the mechanical behavior of the Fe14.6Ni (at%) alloy during the uniaxial tensile process, the total kinetic energy was calculated. Given that energy is universal across scales, the analysis from the perspective of the energy field can reflect the essence of mechanical behavior. Therefore, it was of great significance to the understanding of the cross-scale physical process.44
3. Results and discussion
3.1 The influence of strain rate on mechanical behavior
In this section, the mechanical behavior of the Fe14.6Ni (at%) alloy at different strain rates was investigated. The stress–strain 3D walls at different strain rates are shown in Fig. 1(a). Fig. 1(a) indicates that the stress showed similar and classic variation trends with strain at different strain rates.28
 |
| | Fig. 1 Stress–strain curves at different strain rates. | |
The stress–strain of elastocaloric refrigeration alloys generally evolved in the order of six stages:22,26,27 the superelastic stage (M-Stage I), superelastic yield stage (M-Stage II), phase transformation stage (M-Stage III), elastic stage (M-Stage IV), yield stage (M-Stage V) and fracture stage (M-Stage VI), as shown in Fig. S2.† Based on the theory, the key points and the corresponding strain values of these points from A to K at different strain rates are listed in Table 1.
Table 1 The strain values from point A to point K at different strain rates
| Strain rate (ps−1) |
The strain values of points |
|
A
|
B
|
C
|
D
|
E
|
F
|
G
|
H
|
I
|
J
|
K
|
| 0.1 |
0.053 |
0.073 |
0.093 |
0.098 |
0.150 |
0.349 |
0.374 |
0.387 |
0.397 |
0.482 |
1.200 |
| 0.2 |
0.060 |
0.076 |
0.096 |
0.100 |
0.158 |
0.376 |
0.398 |
0.424 |
0.438 |
0.548 |
1.200 |
| 0.3 |
0.063 |
0.081 |
0.099 |
0.108 |
0.177 |
0.381 |
0.414 |
0.444 |
0.468 |
0.606 |
1.200 |
| 0.4 |
0.068 |
0.084 |
0.108 |
0.116 |
0.192 |
0.384 |
0.420 |
0.456 |
0.488 |
0.632 |
1.200 |
| 0.5 |
0.070 |
0.085 |
0.110 |
0.130 |
0.220 |
0.395 |
0.425 |
0.465 |
0.495 |
0.690 |
1.200 |
To accurately describe the effect of strain rate on the mechanical behavior, the evaluation was performed from three aspects: strain interval, stress extreme (SE), superelastic modulus (Es) and elastic modulus (En).
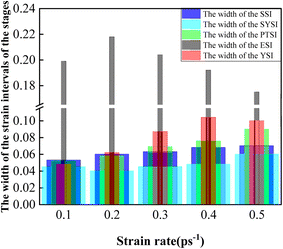
Firstly, the strain interval variation was evaluated. The strain interval of M-Stage I (SSI), the strain interval of M-Stage II (SYSI), the strain interval of M-Stage III (PTSI), the strain interval of M-Stage IV (ESI) and the strain interval of M-Stage V (YSI) at different strain rates are listed in Table 2. Table 2 demonstrates that M-Stage I, M-Stage II, M-Stage III, M-Stage IV and M-Stage V moved backward gradually with increasing strain rates.
Table 2 The SSI, SYSI, PTSI, ESI and YSI at different strain rates
| Strain rate (ps−1) |
SSI |
SYSI |
PTSI |
ESI |
YSI |
| 0.1 |
[0, 0.053] |
[0.053, 0.098] |
[0.098, 0.150] |
[0.150, 0.349] |
[0.349, 0.397] |
| 0.2 |
[0, 0.060] |
[0.060, 0.100] |
[0.100, 0.158] |
[0.158, 0.376] |
[0.376, 0.438] |
| 0.3 |
[0, 0.063] |
[0.063, 0.108] |
[0.108, 0.177] |
[0.177, 0.381] |
[0.381, 0.468] |
| 0.4 |
[0, 0.068] |
[0.068, 0.116] |
[0.116, 0.192] |
[0.192, 0.384] |
[0.384, 0.488] |
| 0.5 |
[0, 0.070] |
[0.070, 0.130] |
[0.130, 0.220] |
[0.220, 0.395] |
[0.395, 0.495] |
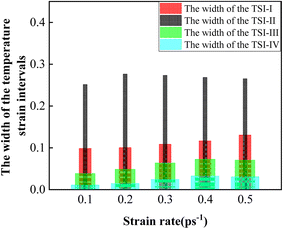
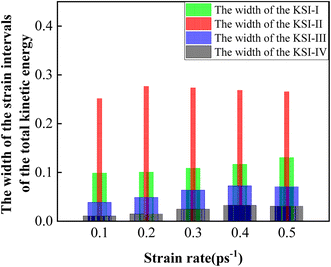
Furthermore, the width of the strain intervals of the five stages was determined according to Table 2. The variation trends of the width of the strain intervals of the five stages are shown in Fig. 2. From Fig. 2, it can be seen that the width of the SSI increased gradually, which demonstrated that the Fe14.6Ni (at%) alloy exhibited a more and more excellent superelastic performance with the increasing strain rate. And the width of the SYSI dropped first and then increased. This indicated that the plasticity of the Fe14.6Ni (at%) alloy showed a first declining and an increasing trend with an increasing strain rate. In other words, the resistance to get into the phase transformation stage presented a first declining and an increasing trend with an increasing strain rate. When the strain rate was kept around 0.2–0.3 ps−1, the resistance was minimized to start the phase transformation stage. The width of the PTSI increased gradually indicating that the strain interval window was widened with the increasing strain rate. As a result, the Fe14.6Ni (at%) alloy exhibited a better phase transformation performance. The width of the ESI showed a first increasing and then a falling trend. This shows that the Fe14.6Ni (at%) alloy depicted a better and better elastic performance with an increasing strain rate. When the strain rate exceeded 0.4 ps−1, the elastic performance reached the limit due to the nature restriction of the Fe14.6Ni (at%) alloy. And the width of the YSI presented a first increasing and then a declining trend. From the analysis, it can be seen that strain rate had a great influence on the strain interval.
 |
| | Fig. 2 The variation trends of the width of the SSI, SYSI, PTSI, ESI and YSI. | |
Secondly, the variations of the SE were investigated. Table 3 lists the three SEs and the corresponding strain values (CSVs) at different strain rates. From Table 3, it can be seen that the three SEs showed an upward trend and the three CSVs presented an increasing trend, as shown in Fig. 3. This demonstrated that the mechanical behavior of the Fe14.6Ni (at%) alloy performed with a higher stress and greater deformability with an increasing strain rate. From the analysis, it was known that the SEs were greatly affected by the strain rate.
Table 3 The three SEs and the CSVs at different strain rates
| Strain rate (ps−1) |
The 1st SE |
The CSV of the 1st SE |
The 2nd SE |
The CSV of the 2nd SE |
The 3rd SE |
The CSV of the 3rd SE |
| 0.1 |
157 |
0.093 |
146 |
0.119 |
224 |
0.397 |
| 0.2 |
159 |
0.096 |
152 |
0.126 |
240 |
0.438 |
| 0.3 |
163 |
0.099 |
156 |
0.135 |
249 |
0.468 |
| 0.4 |
165 |
0.108 |
158 |
0.152 |
253 |
0.488 |
| 0.5 |
167 |
0.110 |
161 |
0.155 |
257 |
0.495 |
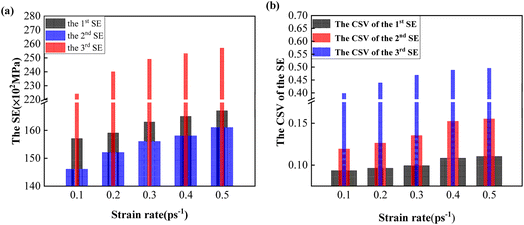 |
| | Fig. 3 The variation trends of the three SEs and the three CSVs. (a) The variation trends of the three SEs; (b) the variation trends of the three CSVs. | |
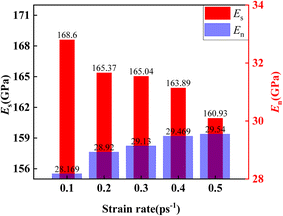
Thirdly, the Es and En were studied. From Fig. 1, it was known that stress kept a linear relationship with strain at M-Stage I and M-Stage IV,28 which satisfied Hooke's law. Therefore, the Es and the En at different strain rates can be determined by the slope of stress with strain. The Es and En at different strain rates are listed in Table 4. The variation trends of the Es and En with increasing strain rates are presented in Fig. 4. Fig. 4 demonstrates that the Es declined with increasing strain rates and the En increased with increasing strain rates. The results showed that superelasticity and elasticity gradually weakened and strengthened with increasing strain rates. When the strain rate was 0.3 ps−1, the superelasticity and elasticity reached equilibrium. From the above analysis, it was known that the Es and En were greatly influenced by the strain rate.
Table 4 The Es and En at different strain rates
| Strain rate (ps−1) |
E
s (GPa) |
E
n (GPa) |
| 0.1 |
168.60 |
28.17 |
| 0.2 |
165.37 |
28.92 |
| 0.3 |
165.04 |
29.13 |
| 0.4 |
163.89 |
29.47 |
| 0.5 |
160.93 |
29.54 |
 |
| | Fig. 4 The variation trends of Es and En. | |
From the above analysis, it can be found that the strain rate had huge effects on the strain interval, the SE, Es and En. As a result, the conclusion was drawn that the mechanical behavior of the Fe14.6Ni (at%) alloy was dependent on the strain rate, which was in good agreement with experimental research.4,6,8,9
3.2 The effects of strain rates on temperatures
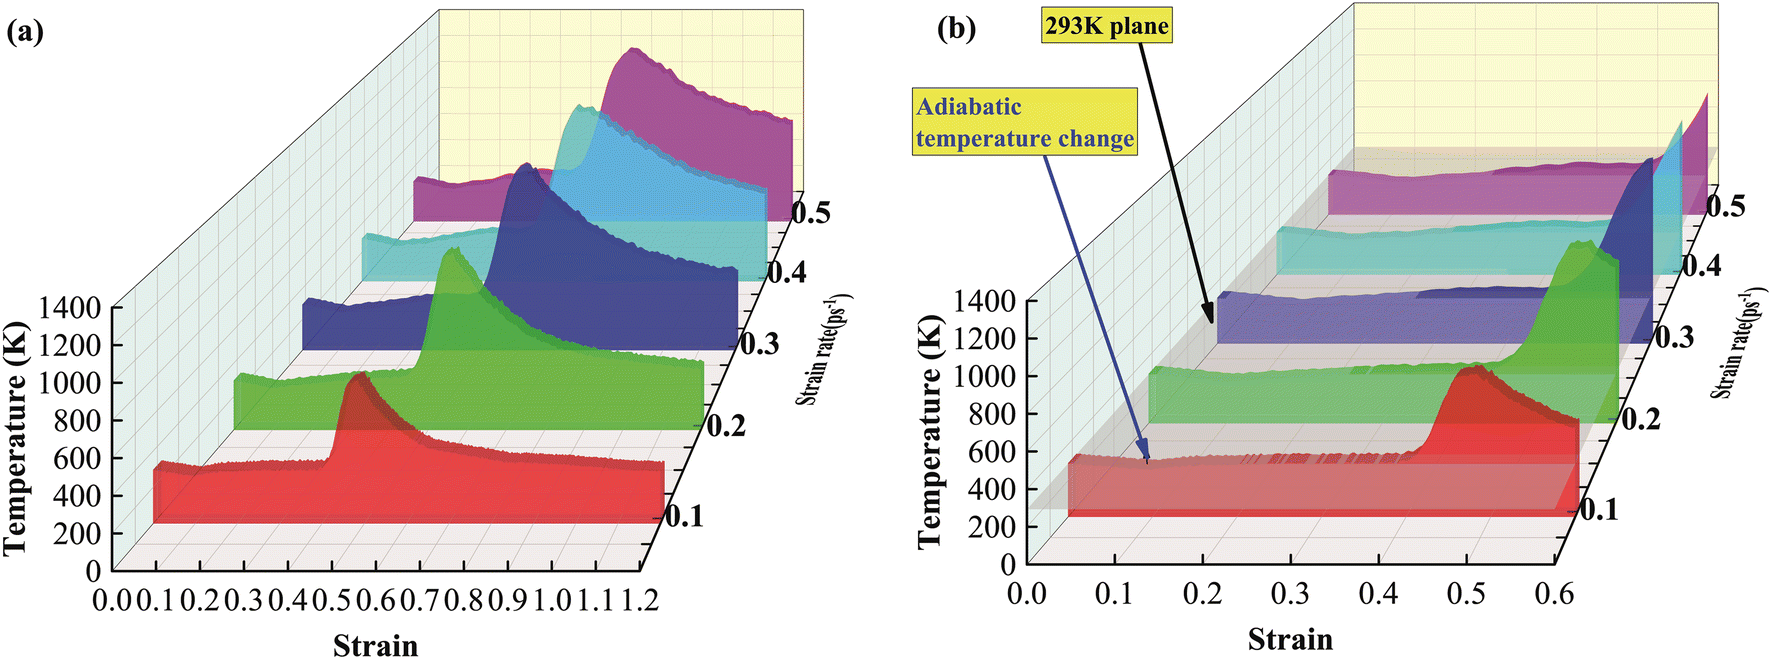
In Section 3.1, the conclusion was drawn that the mechanical behavior of the Fe14.6Ni (at%) alloy was greatly influenced by the strain rate. From previous studies,45–47 the conclusion was drawn that the mechanical behavior of phase change materials in an adiabatic system was unsteady due to the fluctuation of the temperature.28 Therefore, in this section, the variations of the temperature were investigated. The temperature-strain 3D walls at different strain rates are shown in Fig. 5. Fig. 5 indicates that the temperature showed similar and typical variation trends at different strain rates.28
 |
| | Fig. 5 The variations of the temperature with strain at different strain rates. (a) The global view; (b) the local view. | |
As depicted in Fig. S3,† the temperature exhibited a six-stage variation trend, including a fluctuating decrease stage (T-Stage I), a fluctuating increase stage (T-Stage II), a fluctuating falling stage (T-Stage III), a slow increasing stage (T-Stage IV), a rapid increasing stage (T-Stage V) and finally a smooth declining stage (T-Stage VI). To accurately illustrate the effect of strain rate on the temperature, the evaluation of the temperature was performed from three aspects: strain interval, temperature extreme (TE) and temperature changing rate (TCR).
Firstly, the strain interval variation was researched. The strain interval of T-Stage I (TSI-I), the strain interval of T-Stage II (TSI-II), the strain interval of T-Stage III (TSI-III) and the strain interval of T-Stage IV (TSI-IV) at different strain rates are listed in Table 5. Table 5 demonstrates that the four stages moved backward gradually with increasing strain rates. And from Table 5, the width of the strain intervals of the four stages could be determined.
Table 5 Strain intervals of the four stages of temperature at different strain rates
| Strain rate |
TSI-I |
TSI-II |
TSI-III |
TSI-IV |
| 0.1 ps−1 |
[0, 0.098] |
[0.098, 0.349] |
[0.349, 0.387] |
[0.387, 0.397] |
| 0.2 ps−1 |
[0, 0.100] |
[0.100, 0.376] |
[0.376, 0.424] |
[0.424, 0.438] |
| 0.3 ps−1 |
[0, 0.108] |
[0.108, 0.381] |
[0.381, 0.444] |
[0.444, 0.468] |
| 0.4 ps−1 |
[0, 0.116] |
[0.116, 0.384] |
[0.384, 0.456] |
[0.456, 0.488] |
| 0.5 ps−1 |
[0, 0.130] |
[0.130, 0.395] |
[0.395, 0.465] |
[0.465, 0.495] |
The variation trends of the width of the temperature strain intervals of the four stages are presented in Fig. 6. As shown in Fig. 6, the width of TSI-I showed a first downward and then an upward trend with increasing strain rates. And the width of TSI-II increased first and then decreased with increasing strain rates. And the width of TSI-III and TSI-IV increased first and then dropped with increasing strain rates. The results showed that the temperature strain intervals of the four stages were greatly influenced by the strain rate.
 |
| | Fig. 6 The variation trends of the width of the temperature strain intervals. | |
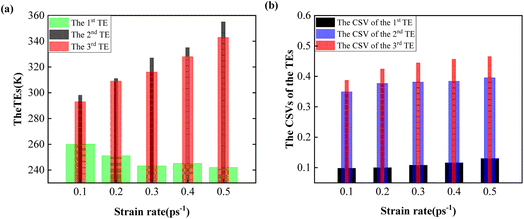
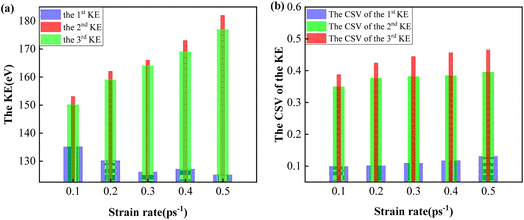
Secondly, the variations of the TE were studied. The first, the second and the third TEs and the CSVs at different strain rates are listed in Table 6. From Table 6, the variation trends of TEs and CSVs with increasing strain rates could be determined, as shown in Fig. 7. Fig. 7(a) indicates that the first TE declined first and then remained stable. And with increasing strain rates, the second and the third TEs showed an upward trend. This illustrated that a higher strain rate caused a smaller value of the first TE and larger value of the second and the third TEs. A lower value of the first TE exhibited a better elastocaloric refrigeration performance. And the higher value of the second and the third TEs presented a better performance excitation of the Fe14.6Ni (at%) alloy. Fig. 7(b) demonstrates that the CSVs of the three TEs increased with increasing strain rates.
Table 6 The three TEs and the CSVs at different strain rates
| Strain rate |
The 1st TE |
The CSV of the 1st TE |
The 2nd TE |
The CSV of the 2nd TE |
The 3rd TE |
The CSV of the 3rd TE |
| 0.1 ps−1 |
260 K |
0.098 |
298 K |
0.349 |
293 K |
0.387 |
| 0.2 ps−1 |
251 K |
0.100 |
311 K |
0.376 |
309 K |
0.424 |
| 0.3 ps−1 |
243 K |
0.108 |
327 K |
0.381 |
316 K |
0.444 |
| 0.4 ps−1 |
245 K |
0.116 |
335 K |
0.384 |
328 K |
0.456 |
| 0.5 ps−1 |
242 K |
0.130 |
355 K |
0.395 |
343 K |
0.465 |
 |
| | Fig. 7 The variation trends of the TEs and the CSVs. (a) The variation trends of the TEs; (b) the variation trends of the CSVs. | |
And a detail needs to be noticed that the difference between the first TE with 293 K was defined as the ΔTadi, which was the key parameter of the elastocaloric effect.3,5,7,8 From Table 6, with increasing strain rates, the ΔTadi was determined to be 33 K, 42 K, 50 K, 48 K and 51 K, respectively. It can be seen that the ΔTadi first increased and then gradually stabilized with the increasing strain rates, which was consistent with experimental conclusions.6,7,9 When the strain rate was less than 0.3 ps−1, the increase of the ΔTadi was due to the incomplete excitation of the elastocaloric refrigeration performance. With the strain rate continuing to increase, the stabilization of the ΔTadi was caused by the limitation of the properties of the elastocaloric refrigeration alloy. This provided theoretical support for the experimental conclusions.4–6,8–10 From the analysis, it can be seen that the strain rate had a huge impact on the TEs.
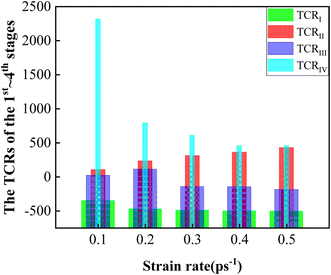
Thirdly, the variation trends of TCRs of the four stages were investigated. The TCRs at different strain rates can be determined by the slope of the temperature with strain. The TCRs of the four stages at different strain rates are listed in Table 7. The variation trends of the TCRs with increasing strain rates are presented in Fig. 8. As illustrated in Fig. 8, the variation trend of TCRI demonstrated that the dropping rate was getting faster with increasing strain rates. It presented a quicker dropping speed of the temperature, which demonstrated better elastocaloric performance. The TCRII increased with increasing strain rates. It depicted a quicker recovery speed of the temperature and better temperature recoverability of the Fe14.6Ni (at%) alloy. And the TCRIII showed a fluctuating trend with increasing strain rates due to plastic deformation. The TCRIV presented a downward trend with increasing strain rates. The TCRs were greatly affected by the strain rate.
Table 7 The TCRs of the four stages at different strain rates
| Strain rate |
TCRI |
TCRII |
TCRIII |
TCRIV |
| 0.1 ps−1 |
−350.530 |
103.380 |
18.985 |
2319.000 |
| 0.2 ps−1 |
−473.300 |
231.670 |
112.350 |
789.000 |
| 0.3 ps−1 |
−491.530 |
309.960 |
−143.630 |
608.340 |
| 0.4 ps−1 |
−501.760 |
359.690 |
−148.580 |
452.750 |
| 0.5 ps−1 |
−504.510 |
427.320 |
−188.900 |
457.730 |
 |
| | Fig. 8 The variation trends of the TCRs. | |
Overall, the strain rate had large effects on the strain intervals, the TEs and TCRs. As a result, the conclusion was drawn that the variation trends of temperature were dependent on the strain rate. And it can be seen that the Fe14.6Ni (at%) alloy was at different transient temperatures with increasing strain rates during the uniaxial tensile process. Affected by transient temperatures, the stress strain interval, the SE, Es and En changed with increasing strain rates. Therefore, it can be concluded that the strain rate influenced the mechanical behavior by changing the transient temperatures, which complemented the conclusions drawn through experimental methods.5,6,9,10
3.3 The essence of the effect of strain rate on mechanical behavior
In Section 3.2, the conclusion was drawn that the strain rate affected the mechanical behavior by changing the transient temperatures. However, the essence of the effect of strain rate on the mechanical behavior remained unclear yet. Therefore, in this section, the total kinetic energy evolution processes and the crystal structure evolution processes were investigated to illustrate the essence of the effect of strain rate on the mechanical behavior.
3.3.1 The analysis of the total kinetic energy evolution processes at different strain rates.
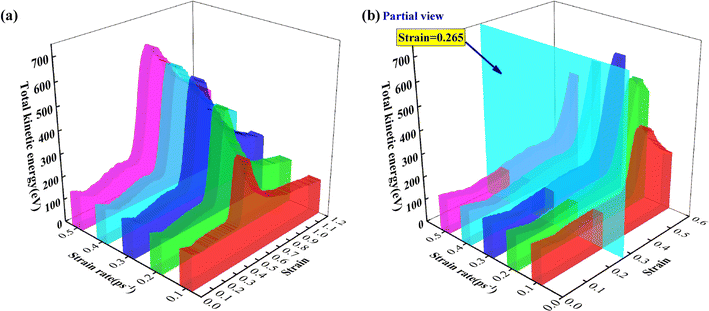
In this section, the variation trends of the total kinetic energy with increasing strain rates in the adiabatic system were researched. The variation trends of total kinetic energy at different strain rates are shown in Fig. 9. Fig. 9 indicates that the variations of total kinetic energy presented similar and classic variation trends at different strain rates.28
 |
| | Fig. 9 The variation trends of the total kinetic energy with strain at different strain rates. (a) The global view; (b) the local view. | |
As presented in Fig. S4,† total kinetic energy exhibited a six-stage variation trend, including a fluctuating decrease stage (K-Stage I), a fluctuating increase stage (K-Stage II), a fluctuating fall stage (K-Stage III), a slow increase stage (K-Stage IV), a rapid increase stage (K-Stage V) and finally a smooth decline stage (K-Stage VI). To accurately depict the effect of strain rate on the total kinetic energy, the evaluation was conducted from three aspects: strain interval, total kinetic energy extreme (KE) and total kinetic energy changing rate (KCR).
Firstly, the strain interval variation was researched. The strain interval of K-Stage I (KSI-I), the strain interval of K-Stage II (KSI-II), the strain interval of K-Stage III (KSI-III) and the strain interval of K-Stage IV (KSI-IV) at different strain rates are listed in Table 8. Table 8 illustrates that the four stages moved backward gradually with increasing strain rates. And from Table 8, the width of the strain intervals of the four stages was determined. The variation trends of the width of the total kinetic energy strain intervals of the four stages are depicted in Fig. 10. As shown in Fig. 10, the width of KSI-I presented a first dropping and then an increasing trend. And the width of KSI-II increased first and then declined. And the width of KSI-III and KSI-IV showed a first upward and then a downward trend. The results indicated that the total kinetic energy strain intervals of the four stages were greatly impacted by the strain rate.
Table 8 Strain intervals of the four stages of total kinetic energy at different strain rates
| Strain rate |
KSI-I |
KSI-II |
KSI-III |
KSI-IV |
| 0.1 ps−1 |
[0, 0.098] |
[0.098, 0.349] |
[0.349, 0.387] |
[0.387, 0.397] |
| 0.2 ps−1 |
[0, 0.100] |
[0.100, 0.376] |
[0.376, 0.424] |
[0.424, 0.438] |
| 0.3 ps−1 |
[0, 0.108] |
[0.108, 0.381] |
[0.381, 0.444] |
[0.444, 0.468] |
| 0.4 ps−1 |
[0, 0.116] |
[0.116, 0.384] |
[0.384, 0.456] |
[0.456, 0.488] |
| 0.5 ps−1 |
[0, 0.130] |
[0.130, 0.395] |
[0.395, 0.465] |
[0.465, 0.495] |
 |
| | Fig. 10 The variation trends of the width of the total kinetic energy strain intervals. | |
Secondly, the variations of the KEs were studied. The first, the second and the third KEs and the CSVs at different strain rates are listed in Table 9. From Table 9, the variation trends of KEs and CSVs with increasing strain rates could be determined, as shown in Fig. 11. Fig. 11(a) indicates that the first KE declined first and then remained stable. And with increasing strain rates, the second and the third KEs showed an upward trend. The variation trends of KEs led to the change of the TEs.28Fig. 11(b) demonstrates that the CSVs of the three KEs increased with increasing strain rates.
Table 9 The three KEs and the CSVs at different strain rates
| Strain rate |
The 1st KE |
The CSV of the 1st KE |
The 2nd KE |
The CSV of the 2nd KE |
The 3rd KE |
The CSV of the 3rd KE |
| 0.1 ps−1 |
135 eV |
0.098 |
153 eV |
0.349 |
150 eV |
0.387 |
| 0.2 ps−1 |
130 eV |
0.100 |
162 eV |
0.376 |
159 eV |
0.424 |
| 0.3 ps−1 |
126 eV |
0.108 |
166 eV |
0.381 |
164 eV |
0.444 |
| 0.4 ps−1 |
127 eV |
0.116 |
173 eV |
0.384 |
169 eV |
0.456 |
| 0.5 ps−1 |
125 eV |
0.130 |
182 eV |
0.395 |
177 eV |
0.465 |
 |
| | Fig. 11 The variation trends of the KEs and the CSVs. (a) The variation trends of the KEs; (b) the variation trends of the CSVs. | |
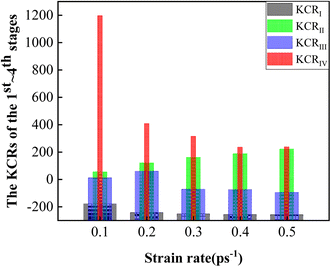
Thirdly, the variation trends of KCRs of the four stages were studied. The KCRs at different strain rates were determined by the slope of the total kinetic energy with strain. The KCRs of the four stages at different strain rates are listed in Table 10. The variation trends of the KCRs with increasing strain rates are shown in Fig. 12. From Fig. 12, the variation trend of KCRI demonstrated that the dropping rate was getting faster with increasing strain rates. KCRII showed an upward trend. And KCRIII presented a fluctuating trend. KCRIV depicted a decreasing trend. The variation trends of KCRs caused the change of the TEs.28 The KCRs were greatly influenced by the strain rate. Overall, the conclusion was drawn that the total kinetic energy variation processes depended on the strain rate.
Table 10 The KCRs of the four stages at different strain rates
| Strain rate |
KCRI |
KCRII |
KCRIII |
KCRIV |
| 0.1 ps−1 |
−180.918 |
53.357 |
9.799 |
1196.897 |
| 0.2 ps−1 |
−244.283 |
119.571 |
57.987 |
407.224 |
| 0.3 ps−1 |
−253.691 |
159.978 |
−74.131 |
313.980 |
| 0.4 ps−1 |
−258.971 |
185.645 |
−76.686 |
233.676 |
| 0.5 ps−1 |
−260.391 |
220.551 |
−97.496 |
236.246 |
 |
| | Fig. 12 The variation trends of the KCRs. | |
3.3.2 The crystal structure evolution processes at different strain rates.
In this section, the crystal structure evolution processes at different strain rates were analyzed. The phase content evolution processes at different strain rates are shown in Fig. 13. From Fig. 13, it can be seen that the phase content evolution processes at different strain rates had similar and classic trends.
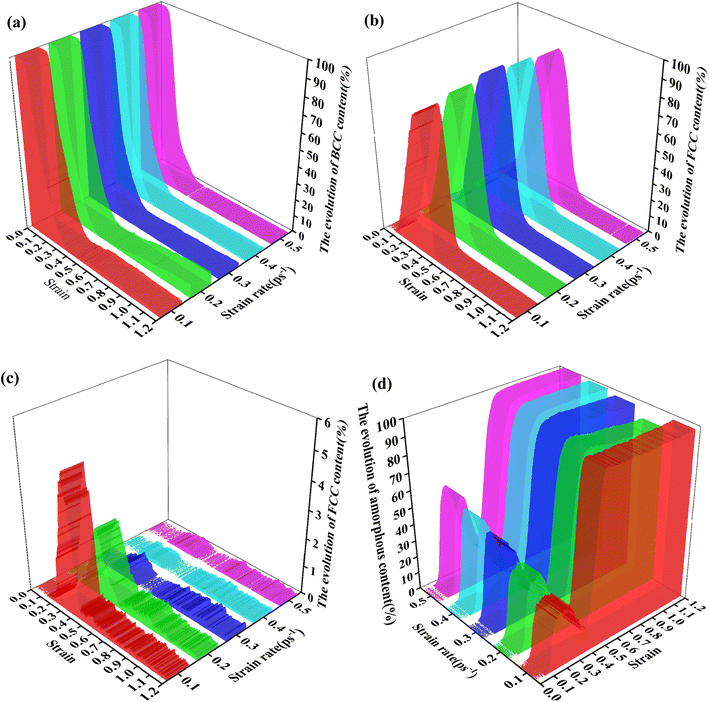 |
| | Fig. 13 The variation trends of the phase content evolution processes with strain at different strain rates. (a) The variation trends of the BCC phase content evolution processes with strain at different strain rates; (b) the variation trends of the FCC phase content evolution processes with strain at different strain rates; (c) the variation trends of the HCP phase content evolution processes with strain at different strain rates; (d) the variation trends of the amorphous phase content evolution processes with strain at different strain rates. | |
Fig. S5† demonstrates that the phase content evolution process was divided into four stages, including the BCC phase preservation stage (P-Stage I), BCC-polycrystal phase transformation stage (P-Stage II), FCC-amorphous phase transformation stage (P-Stage III) and amorphous phase preservation stage (P-Stage IV). And P-Stage II covered the first-order phase transformation stage (FPT Stage) and the second-order phase transformation stage (SPT Stage).28 To accurately demonstrate the effect of strain rate on the phase content evolution processes, the evaluation was carried out to investigate the strain intervals of the stages and the transformed content of the four phases.
The strain intervals of P-Stage I, P-Stage II and P-Stage III are listed in Table 11. From Table 11, the width of the strain intervals of the three stages was determined. Fig. 14 describes the variation trends of the width of the strain intervals of the three stages.
Table 11 The strain intervals of P-Stage I, P-Stage II and P-Stage III at different strain rates
| Strain rate (ps−1) |
P-Stage I |
P-Stage II |
P-Stage III |
| 0.1 |
[0, 0.053] |
[0.053, 0.374] |
[0.374, 0.482] |
| 0.2 |
[0, 0.060] |
[0.060, 0.398] |
[0.398, 0.548] |
| 0.3 |
[0, 0.063] |
[0.063, 0.414] |
[0.414, 0.606] |
| 0.4 |
[0, 0.068] |
[0.068, 0.420] |
[0.420, 0.632] |
| 0.5 |
[0, 0.070] |
[0.070, 0.425] |
[0.425, 0.690] |
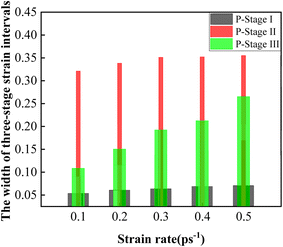 |
| | Fig. 14 The variation trends of the width of the three-stage strain intervals of phase content evolution processes. | |
At P-Stage I, the BCC phase content was 100% and the other contents were zero. The variation trend of the width of the strain interval of P-Stage I with increasing strain rates is shown in Fig. 14. Fig. 14 indicates that the width of the strain interval of P-Stage I showed a first increasing and then a gradually stable trend. When the strain rate was less than 0.3 ps−1, the width of the strain interval of P-Stage I was affected significantly by the strain rate due to the unsteady behavior of the crystal structure in the adiabatic system. When the strain rate reached 0.3 ps−1, the width of the strain interval of P-Stage I gradually stabilized due to the limit which depended on the inherent properties of the Fe14.6Ni (at%) alloy.
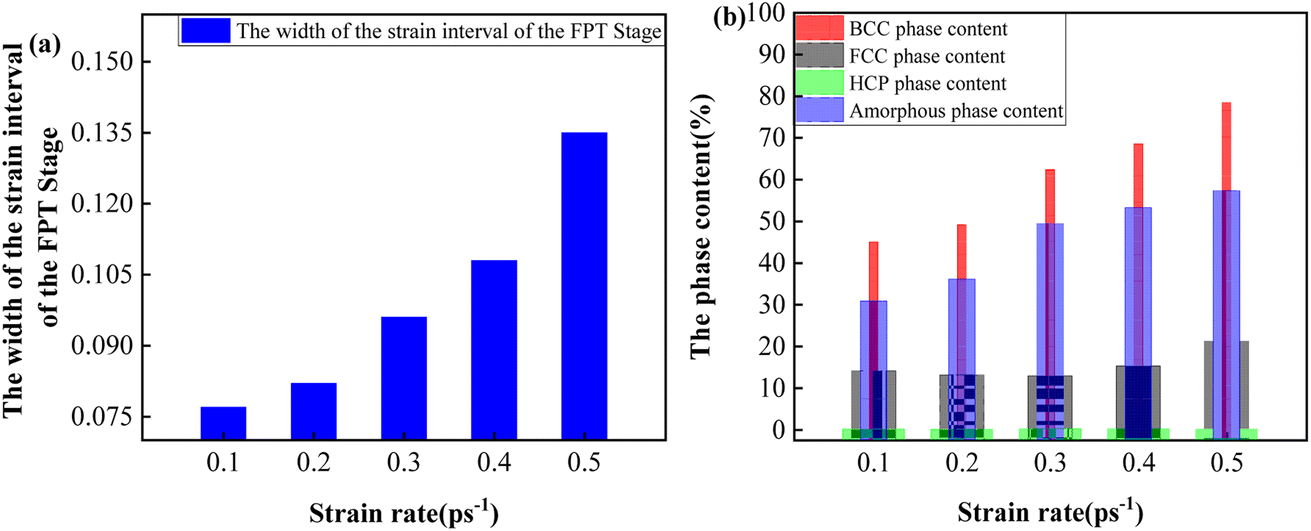
In P-Stage II, the BCC phase transformed into the FCC phase, the HCP phase and the amorphous phase. The variation trend of the width of strain interval of P-Stage II is shown in Fig. 14. Fig. 14 indicates that the width of the strain interval of P-Stage II showed an increasing trend. And the FPT Stage and the SPT Stage were investigated in detail, respectively.
During the FPT Stage, the BCC phase transformed into the FCC phase, the HCP phase and the amorphous phase. The strain interval of the FPT Stage and the transformed content of the four phases are listed in Table 12. From Table 12, with increasing strain rates, the FPT Stage lagged to start due to the hysteresis of P-Stage I. The variation trend of the width of the strain interval of the FPT Stage with increasing strain rates is depicted in Fig. 15. From Fig. 15(a), it can be seen that the width of the strain interval of the FPT Stage increased with increasing strain rates. Besides, the variation trend of the absolute value of the transformed content of the four phases during the FPT Stage with increasing strain rates is presented in Fig. 15(b). Fig. 15(b) indicates that the absolute value of the transformed content of the BCC phase during the FPT Stage increased with increasing strain rates. It was due to the decrease in the phase transformation resistance. In addition, as presented in Fig. 15(b), the transformed content of the HCP phase fluctuated at an extremely low level. This demonstrated that few contents of the stacking fault appeared during the FPT Stage. And as Fig. 15(b) demonstrates, the transformed content of the amorphous phase increased with increasing strain rates. And, as shown in Fig. 15(b), the transformed content of the FCC phase showed a first drop and then an increasing trend. When the strain rate was less than 0.3 ps−1, the transformation rate of the amorphous transition phase was higher than the transformation rate of the BCC phase. Therefore, the transformed content of the FCC phase decreased with increasing strain rates. As the strain rate continued to increase, the transformation rate of the amorphous transition phase was lower than the transformation rate of the BCC phase. As a result, the transformed content of the FCC phase increased with the strain rate. The variation trend of the transformed content of the FCC phase was the result of the combined effect of the BCC phase and amorphous phase transformation.
Table 12 The strain intervals of the FPT Stage and the transformed content of four phases at different strain rates
| Strain rate (ps−1) |
The strain interval of the FPT Stage |
BCC phase transformed content |
FCC phase transformed content |
HCP phase transformed content |
The amorphous phase transformed content |
| 0.1 |
[0.053, 0.150] |
44.95 |
14.03 |
0.03 |
30.80 |
| 0.2 |
[0.060, 0.158] |
49.10 |
13.05 |
0.00 |
36.05 |
| 0.3 |
[0.063, 0.177] |
62.30 |
12.80 |
0.10 |
49.40 |
| 0.4 |
[0.068, 0.192] |
68.50 |
15.18 |
0.13 |
53.20 |
| 0.5 |
[0.070, 0.220] |
78.40 |
21.13 |
0.03 |
57.25 |
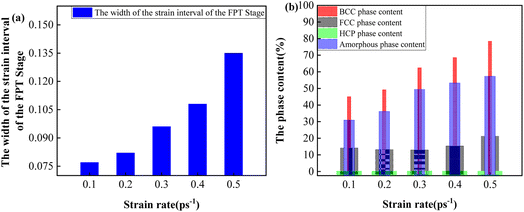 |
| | Fig. 15 The variation trends of the width of the strain intervals and the transformed content of the four phases of the FPT Stage. (a) The variation trends of the width of the strain intervals of the FPT Stage; (b) the variation trends of the transformed content of the four phases during the FPT Stage. | |
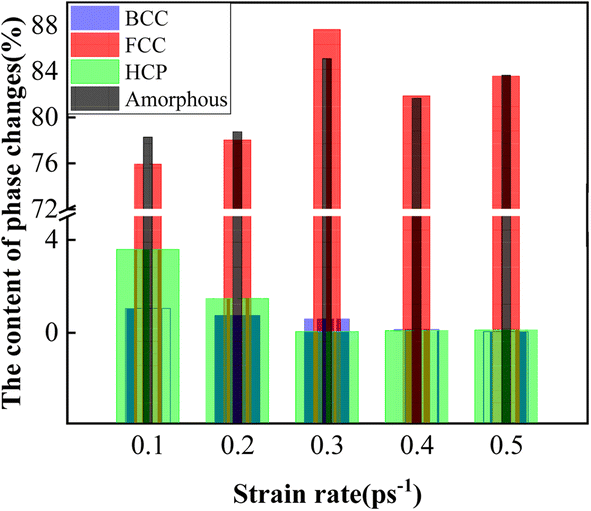
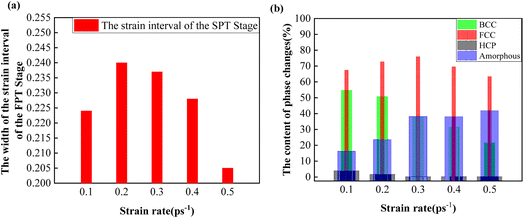
At the SPT Stage, the BCC phase and the amorphous phase transformed into the FCC phase. The strain interval of the SPT Stage and the transformed content of the four phases are listed in Table 13. From Table 13, it can be seen that with increasing strain rates, the SPT Stage was delayed to start due to the hysteresis of P-Stage I and the FPT Stage. The variation trend of the width of the strain intervals of the SPT Stage with increasing strain rates is presented in Fig. 16(a). Fig. 16(a) indicates that the width of the strain interval of the SPT Stage showed a first increasing and then a declining trend with increasing strain rates. Besides, the variation trends of the absolute value of the transformed content of the four phases during the SPT Stage are shown in Fig. 16(b). As shown in Fig. 16(b), the content of the transformed BCC phase during the SPT Stage showed a downward trend with increasing strain rates. In addition, as shown in Fig. 16(b), the transformed content of the FCC phase showed a first increasing and then a decreasing trend. As presented in Fig. 16(b), the transformed content of the HCP phase showed a first declining and then a stable trend. And the content of the transformed amorphous transition phase during the SPT Stage increased. The variation trend of the content of the transformed FCC phase in the SPT Stage was the result of the combined effect of the BCC phase and the amorphous phase transformation.
Table 13 The strain interval of the SPT Stage and the transformed content of four phases at different strain rates
| Strain rate (ps−1) |
The strain interval of the SPT Stage |
The BCC phase transformed content |
The FCC phase transformed content |
The HCP phase transformed content |
The amorphous phase transformed content |
| 0.1 |
[0.150, 0.374] |
54.67 |
67.35 |
3.77 |
16.15 |
| 0.2 |
[0.158, 0.398] |
50.67 |
72.63 |
1.58 |
23.52 |
| 0.3 |
[0.177, 0.414] |
37.62 |
75.80 |
0.05 |
38.12 |
| 0.4 |
[0.192, 0.420] |
31.37 |
69.47 |
0.13 |
37.97 |
| 0.5 |
[0.220, 0.425] |
21.52 |
63.25 |
0.12 |
41.85 |
 |
| | Fig. 16 The variation trends of the width of the strain intervals and the transformed content of the four phases of the SPT Stage. (a) The variation trends of the width of the strain interval of the SPT Stage; (b) the variation trends of the transformed content of the four phases during the SPT Stage. | |
At P-Stage III, the FCC phase was transformed into the amorphous phase. The transformed contents of the four phases are listed in Table 14. Table 11 demonstrates that P-Stage III was delayed to start with increasing strain rates because of the hysteresis of P-Stage I and P-Stage II. The variation trend of the width of the strain interval of P-Stage III is depicted in Fig. 14. As Fig. 14 illustrates, the width of the strain interval of P-Stage III showed a first increasing and then a stable trend. And the variation trends of the transformed content of the four phases during P-Stage III are presented in Fig. 17. As illustrated in Fig. 17, the content of the transformed FCC phase and amorphous phase during P-Stage III showed a first increasing and then decreasing and finally increasing trend. And the content of the transformed BCC phase and HCP phase showed a first decreasing and then stable trend and remained at an exceedingly low level. From the above analysis, the phase evolution processes were dependent on the strain rate.
Table 14 The transformed content of four phases during P-Stage III at different strain rates
| Strain rate (ps−1) |
BCC phase transformed content |
FCC phase transformed content |
HCP phase transformed content |
The amorphous phase transformed content |
| 0.1 |
1.02 |
75.90 |
3.57 |
78.25 |
| 0.2 |
0.72 |
78.00 |
1.45 |
78.72 |
| 0.3 |
0.57 |
87.65 |
0.02 |
85.1 |
| 0.4 |
0.12 |
81.85 |
0.08 |
81.65 |
| 0.5 |
0.02 |
83.58 |
0.10 |
83.65 |
 |
| | Fig. 17 The variation trends of the transformed content of the four phases of P-Stage III. | |
3.3.3 The essence of the effect of strain rate on mechanical behavior exploration.
From Fig. 9(b), it can be seen that the evolution processes of total kinetic energy can be divided into two stages as well. The strain interval of the viscosity stage I was from 0 to 0.265 and the strain interval of the viscosity stage II was from 0.265 to the ending point of K-Stage IV. During the viscosity stage I, the transient total kinetic energy decreased with increasing strain rates. The weakening of the transient total kinetic energy contributed to the increased viscosity, which led to an increase in the first and the second SEs.48–50 During the viscosity stage II, the transient total kinetic energy showed an opposite trend. The enhancement of the transient total kinetic energy contributed to the decreased viscosity, which led to a decrease in the third SE.51–53 Meanwhile, the extension of the strain intervals would lengthen the stress variation strain interval causing an increase in the three SEs. The increase in the third SE was the result of the combined effect of the weakening of viscosity and the prolongation of the strain interval.54–56 Similarly, the stress at point A, point E and point F also showed upward trends. The increase in the three SEs was the result of the combined effect of the variation in viscosity and the prolongation of the strain interval. This deepened the theory of the effect of strain rate on mechanical behavior.7,9,13,16
Furthermore, the influence of the phase content evolution processes on the mechanical behavior at different strain rates was analyzed. From the above analysis of the effect of strain rate on the phase content evolution processes and the mechanical behavior, it can be seen that point A was the end point at which the stress and strain maintained a linear relationship and the point at which the BCC content started to decrease from 100% as well. With increasing strain rates, point A during the phase content evolution processes moved backward gradually. It contributed to the increase in the width of the strain interval of M-Stage I with increasing strain rates. And point D was not only the endpoint at which the stress decreased slowly with strain but also the endpoint at which the FCC phase increased slowly with strain. Point D moved backward gradually with increasing strain rates during the phase content evolution processes. The movement of point A and point D during the phase content evolution processes resulted in the variation trend of the width of the strain interval of M-Stage II. And point E was the starting point at which the stress increased linearly with strain and also the first extreme of the content of the amorphous phase evolution curve. With increasing strain rates, point E during the phase content evolution processes moved backward. The movement of point D and point E during the phase content evolution processes led to the variation trend of the width of the strain interval of M-Stage III. And point F was the ending point at which the stress increased linearly with strain and also the endpoint at which the FCC phase increased rapidly with strain. With increasing strain rates, point F during the phase content evolution processes moved backward. The movement of point E and point F during the phase content evolution processes contributed to the variation trend of the width of the strain interval of M-Stage IV. And point I was the third SE and the point at which the fracture of the FCC phase started with strain. With increasing strain rates, point I during the phase content evolution processes moved backward. The movement of point F and point I during the phase content evolution processes caused the variation trend of the width of the strain interval of M-Stage V. Combined with the influence of the total kinetic energy evolution processes and the phase content evolution processes at different strain rates on mechanical behaviors, it can be seen that the stress and the width of the strain interval of M-Stage I increased. As a result, the Es showed a declining trend with increasing strain rates due to the combined effect of the stress and the width of the strain interval. Similarly, with increasing strain rates, the change of the stress and the width of the strain interval of M-Stage IV also contributed to the increase in the En.
Therefore, the conclusion can be drawn that the essence of the effect of strain rate on the mechanical behavior was to induce different phase content evolution processes and total kinetic energy evolution processes of the Fe14.6Ni (at%) alloy. This enriched the theory of the effect of strain rate on the mechanical behavior.7,9,11,12,15,16
4. Conclusion
In this research, an MD model was adopted to investigate the essence of the effect of strain rate on the mechanical behavior of the Fe14.6Ni (at%) elastocaloric refrigeration alloy. Firstly, the study of the mechanical behavior at different strain rates showed that the strain intervals, the SEs, the Es and the En changed with increasing strain rates. Secondly, the investigation of the temperature illustrated that the strain rate affected the mechanical behavior by inducing different transient temperatures. In addition, the study of the total kinetic energy showed that an increase in the three SEs was the result of the combined effect of the variation of viscosity and the prolongation of the strain interval. Furthermore, the analysis of the crystal structure evolution demonstrated that the phase content evolution processes varied with increasing strain rates, leading to the backward movement of the key points of the stress. As a result, the strain intervals of the stress changed with increasing strain rates. The combined effect of total kinetic energy and phase content evolution processes contributed to the changes of the Es and En with increasing strain rates. Finally, the conclusion was drawn that the strain rate influenced the mechanical behavior by changing the transient total kinetic energy and the phase content evolution processes, which was the essence of the effect of the strain rate on the mechanical behavior. This work has clarified the essence and enriched the theory of the effect of strain rate on the mechanical behavior of elastocaloric refrigeration alloys.
Author contributions
Xianfa Li collected and transcribed all the data, performed the molecular dynamics simulations, wrote the core of the paper with a focus on the analytical sections and responded to reviewers. Junyu An read and contributed to draft versions of the paper and provided background information for the elastocaloric refrigeration alloy. Shuisheng Chen teased out research papers and relevant materials on molecular dynamics simulation and wrote relevant sections of the paper. Guoqiang Chen commented on and contributed to draft versions of the paper and supported content analysis. Yi Liu identified and suggested relevant research papers on strain rate dependence. Yongjun Shi wrote the introduction and conclusion. Long Zhou wrote the abstract and thought of recommendations.
Conflicts of interest
The authors declare that they have no known competing financial interests or personal relationships that could have appeared to influence the work reported in this paper.
Acknowledgements
This work was supported by the Shandong Province Natural Science Foundation [grant number ZR2020ME162]. This research was supported by the Doctoral Fund of Henan University of Technology (B2024-39), and (B2021-29), the Key Scientific and Technological Breakthroughs of Henan Province (222102520007).
References
- D. Luo, Y. S. Feng and P. Verma, Modeling and analysis of an integrated solid state elastocaloric heat pumping system, Energy, 2017, 130, 500–514 CrossRef.
- Z. Z. Li, Z. B. Li, D. Li, J. J. Yang, B. Yang, Y. Hou, D. H. Wang, Y. D. Zhang, C. Esling, X. Zhao and L. Zuo, Achieving a broad refrigeration temperature region through the combination of successive caloric effects in a multiferroic Ni50Mn35In15 alloy, Acta Mater., 2020, 192, 52–59 CrossRef CAS.
- G. Y. Zhang, Z. B. Li, J. J. Yang, B. Yang, D. H. Wang, Y. D. Zhang, C. Esling, L. Hou, X. Li, X. Zhao and L. Zuo, Giant elastocaloric effect in a Mn-rich Ni 44 Mn 46 Sn 10 directionally solidified alloy, Appl. Phys. Lett., 2020, 116, 023902 CrossRef.
- H. Ossmer, F. Lambrecht, M. Gültig, C. Chluba, E. Quandt and M. Kohl, Evolution of temperature profiles in TiNi films for elastocaloric cooling, Acta Mater., 2014, 81, 9–20 CrossRef CAS.
- M. Schmidt, A. Schütze and S. Seelecke, Scientific test setup for investigation of shape memory alloy based elastocaloric cooling processes, Int. J. Refrig., 2015, 54, 88–97 CrossRef CAS.
- M. Schmidt, S. M. Kirsch and S. Seelecke,
et al., Elastocaloric cooling: From fundamental thermodynamics to solid state air conditioning, Science and Technology for the Built Environment, 2016, 22(5), 475–488 CrossRef.
- E. Bonnot, R. Romero and L. Mañosa,
et al., Elastocaloric effect associated with the martensitic transition in shape-memory alloys, Phys. Rev. Lett., 2008, 100(12), 190–193 CrossRef PubMed.
- L. Wang, H. Xuan and S. Liu,
et al., Enhanced elastocaloric effect and mechanical properties of Gd-doped Ni–Mn–Sn-Gd ferromagnetic shape memory alloys, J. Alloys Compd., 2020, 846, 156313 CrossRef CAS.
- M. Imran and X. Zhang, Ferromagnetic shape memory Ni-Fe-Ga alloy foams for elastocaloric cooling, J. Phys. D: Appl. Phys., 2020, 53(24), 245503 CrossRef CAS.
- W. Sun, L. Jian and L. Binfeng,
et al., Large elastocaloric effect at small transformation strain in Ni45Mn44Sn11 metamagnetic shape memory alloys, Scr. Mater., 2016, 114, 1–4 CrossRef CAS.
- C. Aprea, A. Greco and A. Maiorino,
et al., The Employment of Caloric-Effect Materials for Solid-State Heat Pumping, Int. J. Refrig., 2019, 109, 1–11 CrossRef.
- J. Chen, L. Xing and G. Fang,
et al., Improved elastocaloric cooling performance in gradient-structured NiTi alloy processed by localized laser surface annealing, Acta Mater., 2021, 208, 116741 CrossRef CAS.
- D. J. Sharar, J. Radice and R. Warzoha, Low-Force Elastocaloric Refrigeration via Bending, Appl. Phys. Lett., 2021, 118, 184103 CrossRef CAS.
- A. Nhl and B. Chca, Inhomogeneous martensitic transformation behavior and elastocaloric effect in a bicrystal Cu-Al-Mn shape memory alloy - ScienceDirect, Mater. Sci. Eng., A, 2020, 800, 140386 Search PubMed.
- M. Imran, X. Zhang and M. Qian,
et al., Enhancing the Elastocaloric Cooling Stability of Ni–Fe–Ga Alloys via Introducing Pores, Adv. Eng. Mater., 2020, 22, 1901140 CrossRef CAS.
- H. Xuan, L. Wang and T. Cao,
et al., Mechanical and elastocaloric effect of Fe and Co co-doped Ni–Mn–Al ferromagnetic shape memory alloys, Phys. Lett. A, 2021, 402, 127362 CrossRef CAS.
- A. Kuwabara, T. Tohei and T. Yamamoto,
et al., Ab initio lattice dynamics and phase transformations of ZrO_ {2, Phys. Rev. B: Condens. Matter Mater. Phys., 2005, 71(6), 064301.1–064301.7 CrossRef.
- X. Luo, W. Zhou and S. V. Ushakov,
et al., Monoclinic to tetragonal transformations in hafnia and zirconia: A combined calorimetric and density functional study, Phys. Rev., 2009, 80(13), 134119.1–134119.13 CrossRef.
- M. Mamivand, R. F. Trevor and N. Fred,
et al., Phase field modeling of the tetragonal-to-monoclinic phase transformation in zirconia, Acta Mater., 2013, 61(14), 5223–5235 CrossRef CAS.
- P. Grammatikopoulos, C. Cassidy and V. Singh,
et al., Coalescence behaviour of amorphous and crystalline tantalum nanoparticles: a molecular dynamics study, J. Mater. Sci., 2014, 49(11), 3890–3897 CrossRef CAS.
- B. Cla, B. Xza and B. Xla, Investigation on sintering processes and mechanical properties of Ti Ta alloys by molecular dynamics simulation, Powder Technol., 2022, 398, 117069 CrossRef.
- J. Zhang, M. Zhang and L. Deng,
et al., Mechanical behavior of tetragonal zirconia nanopillars subjected to uniaxial loading: A molecular dynamics study, Mech. Mater., 2020, 151, 103666 CrossRef.
-
Y. Zhang and Y. Yue, Simulation and Calculation for Predicting Structures and Properties of High-Entropy Alloys, High Entropy Materials – Microstructures and Properties, IntechOpen, 2023, DOI:10.5772/intechopen.105963.
- J. Zhang, M. Zhang, L. Deng, J. Jin, P. Gong and X. Wang, Atomistic investigation of pseudoelasticity in zirconia nanopillars, Ceram. Int., 2019, 45, 1–6 CrossRef CAS.
- W. A. Man, D. Sjab and S. D. Dong, Molecular dynamics simulation of mechanical behavior and phase transformation of nanocrystalline NiTi shape memory alloy with gradient structure, Shape Mem. Superelasticity, 2022, 8, 308–319 CrossRef.
- X. Li, Y. Shi, J. Chen, J. An and Q. Wang, Research on solid-phase sintering mechanism and mechanical properties of Fe9.5Co (at%) elastocaloric refrigeration alloy through molecular dynamics simulation, J. Mater. Res. Technol., 2022, 19, 2314–2329 CrossRef CAS , ISSN 2238-7854..
- X. Li, Y. Shi, T. Chen, S. Wang and K. Fan, Study on sintering mechanism and mechanical properties of Fe–Ni elastocaloric refrigeration alloy through molecular dynamics simulation, Mater. Today Commun., 2022, 32, 103913 CrossRef CAS , ISSN 2352-4928..
- X. Li, Y. Shi, J. An, J. Chen and T. Chen, The research on the essence of unsteady mechanical behavior of Fe14.6Ni (at%) nanocrystalline elastocaloric refrigeration alloy through molecular dynamics simulation, J. Mater. Res. Technol., 2022, 20, 3103–3113 CrossRef CAS.
- S. Plimpton, Fast Parallel Algorithms for Short-Range Molecular Dynamics, J. Comput. Phys., 1995, 117(1), 1–19 CrossRef CAS.
- A. Stukowski, Visualization and analysis of atomistic simulation data with OVITO-the open visualization tool, Modell. Simul. Mater. Sci. Eng., 2010, 18, 150121 Search PubMed.
- G. Bonny, R. C. Pasianot and L. Malerba, Modell. Simul. Mater. Sci. Eng., 2009, 17, 025010 CrossRef.
- X. W. Zhou, R. A. Johnson and H. N. G. Wadley, Misfit-energy-increasing dislocations in vapor-deposited CoFe/NiFe multilayers, Phys. Rev. B: Condens. Matter Mater. Phys., 2004, 69, 144113 CrossRef.
- S. Nosé, A unified formulation of the constant temperature molecular dynamics methods, J. Chem. Phys., 1984, 81, 511–519 CrossRef.
- W. G. Hoover, Canonical dynamics: equilibrium phase-space distributions, Phys. Rev., 1985, 31, 1695–1697 Search PubMed.
- G. J. Ackland and A. P. Jones, Applications of Local Crystal Structure Measures in Experiment and Simulation, Phys. Rev. B: Condens. Matter Mater. Phys., 2006, 73, 054104 CrossRef.
- W. Lechner and C. Dellago, Accurate Determination of Crystal Structures Based on Averaged Local Bond Order Parameters, J. Chem. Phys., 2008, 129, 114707 CrossRef PubMed.
- A. Stukowski, Structure Identification Methods for Atomistic Simulations of Crystalline Materials, Modell. Simul. Mater. Sci. Eng., 2012, 20, 045021 CrossRef.
- R. Huang, G. F. Shao, X. M. Zeng and Y. H. Wen, Diverse Melting Modes and Structural Collapse of Hollow Bimetallic Core-Shell Nanoparticles: A Perspective from Molecular Dynamics Simulations, Sci. Rep., 2014, 4, 7051 CrossRef CAS PubMed.
- R. Huang, G. Shao, Y. Wen and S. Sun, Tunable Thermodynamic Stability of Au−CuPt Core-Shell Trimetallic Nanoparticles by Controlling the Alloy Composition: Insights from Atomistic Simulations, Phys. Chem. Chem. Phys., 2014, 16, 22754–22761 RSC.
- R. Huang, Y. Wen, G. Shao and S. Sun, Insight into the Melting Behavior of Au−Pt Core−Shell Nanoparticles from Atomistic Simulations, J. Phys. Chem. C, 2013, 117, 4278–4286 CrossRef CAS.
- J. Schiøtz, F. D. Di Tolla and K. W. Jacobsen, Softening of Nanocrystalline Metals at Very Small Grain Sizes, Nature, 1998, 391, 561–563 CrossRef.
- J. Schiøtz and K. W. Jacobsen, A Maximum in the Strength of Nanocrystalline Copper, Science, 2003, 301, 1357–1359 CrossRef PubMed.
- S. Jiang, Y. Zhang, Y. Gan, Z. Chen and H. Peng, Molecular Dynamics Study of Neck Growth in Laser Sintering of Hollow Silver Nanoparticles with Different Heating Rates, J. Phys. D: Appl. Phys., 2013, 46, 335302 CrossRef.
-
A. Govari, Metal immune system for tracking spatial coordinates of an object in the presence of a perturbed energy field, US Pat., US6373240B1, 2002 Search PubMed.
- O. D. Sherby and P. M. Burke, Mechanical behavior of crystalline solids at elevated temperature, Prog. Mater. Sci., 1968, 13, 323–390 CrossRef.
- N. Mara, A. Sergueeva, A. Misra and A. K. Mukherjee, Structure and high-temperature mechanical behavior relationship in nano-scaled multilayered materials, Scr. Mater., 2001, 673(6), 803–806 CrossRef.
- C. W. Tan, X. U. Shan-Na, L. Wang, Z. Y. Chen, F. C. Wang and H. N. Cai, Effect of temperature on the mechanical behavior of az31 magnesium alloy, Trans. Nonferrous Met. Soc. China, 2007, 17(001), 41–45 CrossRef CAS.
- C. F. Raymond, Inversion of flow measurements for stress and rheological parameters in a valley glacier, J. Glaciol., 2017, 12(64), 19–44 CrossRef.
- T. Li, Y. Wang and Y. Dong,
et al. Effect of solid contents on the controlled shear stress rheological properties of different types of sludge, J. Environ. Sci., 2012, 24(11), 1917–1922 CrossRef PubMed.
- F. H. Marchesini, M. F. Naccache, A. Abdu, A. A. Alicke and P. Mendes, Rheological characterization of yield-stress materials: flow pattern and apparent wall slip, Appl. Rheol., 2015, 25(5), 53883 Search PubMed.
- Y. Q. Wan, J. H. He and Y. Wu, Vibrorheological effect on electrospun polyacrylonitrile (pan) nanofibers, Mater. Lett., 2006, 60(27), 3296–3300 CrossRef CAS.
- A. Zolfaghari, A. H. Behravesh, E. Shakouri and E. Soury, Flow balancing in die design of wood flour/hdpe composite extrusion profiles with consideration of a rheological effect, Polym. Eng. Sci., 2010, 543–549 CrossRef CAS.
- A. Jd, B. Dla and A. Zl, Study on the influence of surface roughness on wall slip effect (in rheological measurement) of magnetic fluid, J. Magn. Magn. Mater., 2022, 557, 169453 CrossRef.
- K. Zhang, L. Pan, J. Li and C. Lin, What is the mechanism of the fiber effect on the rheological behavior of cement paste with polycarboxylate superplasticizer?, Constr. Build. Mater., 2021, 281(1–3), 122542 CrossRef CAS.
- G. Lawrance, P. S. Paul, X. A. Vasanth and A. S. Varadarajan, Effect of rheological fluid parameters on tool vibration during boring of hardened steel, J. Adv. Manuf. Syst., 2021, 20(02), 447–470 CrossRef.
- M. Schmidt, S.-M. Kirsch, S. Seelecke and A. Schütze, Elastocaloric cooling: From fundamental thermodynamics to solid state air conditioning, Sci. Technol. Built Environ., 2016, 22(5), 475–488 CrossRef.
|
| This journal is © The Royal Society of Chemistry 2024 |
Click here to see how this site uses Cookies. View our privacy policy here. 
 Open Access Article
 This Open Access Article is licensed under a Creative Commons Attribution-Non Commercial 3.0 Unported Licence
 *a,
Junyu
An
*a,
Junyu
An

 is the electron density of atom i.